2021
[4]\fnmGiovanni \surVolpe
[1,2]\fnmNuno A. M. \surAraújo
[3]\fnmGiorgio \surVolpe
1]\orgdivDepartamento de Física, Faculdade de Ciências, \orgnameUniversidade de Lisboa, \orgaddress\postcode1749-016 \cityLisboa, \countryPortugal
2]\orgdivCentro de Física Teórica e Computacional, Faculdade de Ciências, \orgnameUniversidade de Lisboa, \orgaddress\postcode1749-016 \cityLisboa, \countryPortugal
3]\orgdivDepartment of Chemistry, \orgnameUniversity College London, \orgaddress\street20 Gordon Street, \postcodeWC1H 0AJ \cityLondon, \countryUnited Kingdom
4]\orgdivDepartment of Physics, \orgnameUniversity of Gothenburg, \orgaddress\streetOrigovägen 6B, \postcodeSE-41296 \cityGothenburg, \countrySweden
Environmental Memory Boosts Group Formation of Clueless Individuals
Abstract
The formation of groups of interacting individuals improves performance and fitness in many decentralised systems, from micro-organisms to social insects, from robotic swarms to artificial intelligence algorithms. Often, group formation and high-level coordination in these systems emerge from individuals with limited information-processing capabilities implementing low-level rules of communication to signal to each other. Here, we show that, even in a community of clueless individuals incapable of processing information and communicating, a dynamic environment can coordinate group formation by transiently storing memory of the earlier passage of individuals. Our results identify a new mechanism of indirect coordination via shared memory that is primarily promoted and reinforced by dynamic environmental factors, thus overshadowing the need for any form of explicit signalling between individuals. We expect this pathway to group formation to be relevant for understanding and controlling self-organisation and collective decision making in both living and artificial active matter in real-life environments.
“Strength in numbers” is more than an idiomatic expression. Many living systems form groups to improve their fitness, optimise use and allocation of resources, and reach consensus vicsek2012collective . Examples emerge at all length scales, from bacterial quorum sensing and biofilm formation mukherjee2019bacterial to social insects czaczkes2015trail , from animal groups moussaid2009collective to human crowds sieben2017collective . Artificial active matter systems, such as active colloids bechinger2016active and robotic swarms dorigo2020reflections , provide controllable systems to pinpoint the essential principles behind the emergence of these collective behaviours in living systems Palacci2012 ; Lavergne2019 . For example, active colloids have been employed to demonstrated motility-induced phase separation Buttinoni2013 ; Cates2015 as well as the spontaneous formation of living crystals resembling animal group formation Palacci2012 ; Ginot2018 . Complex dynamic collective patterns, such as colloidal swarms, flocks and swirls, have also been demonstrated by introducing controllable attractive, repulsive or aligning interactions among individuals by particle design Bricard2013 ; Granick2016 , by defining appropriate confining potentials Pince2016 or by modulating particles’ propulsion with external feedback loops khadka2018 ; Lavergne2019 . In recent years, a few active particles in crowded environments of passive colloids have also been employed to modulate the energy landscape of the passive phase with an emphasis on controlling the assembly of soft materials reichhardt2004local ; kummel2015formation ; van2016fabricating ; omar2018swimming ; dietrich2018active ; ramananarivo2019activity ; banerjee2022unjamming ; madden2022hydrodynamically ; trivedi2022self .
Whether living or artificial, decentralised systems are characterised by high-level coordination and collective behaviours, which emerge from individuals with limited information-processing capabilities responding to low-level rules of engagement garnier2007biological . In particular, stigmergy is a form of indirect communication between individuals mediated by modifications of the local environment, where individuals actively signal to others by depositing cues which shape a shared environmental memory marsh2008stigmergic . This strategy underpins the emergence of coordination and collective decision making in many natural decentralised systems, from micro-organisms mukherjee2019bacterial to social insects czaczkes2015trail . For example, trailing stalk cells guided by chemo-attractants through tissue establish the vascular lumen in sprout angiogenesis Lugano2020 ; bacteria Austin2020 , amoebas Tweedy2020 and ants Reid2011 can solve physical mazes by tracking chemical scents and forming optimal paths; mutual anticipation and avoidance in crowds lead to lane formation and stabilisation murakami2021mutual . The concept of stigmergy has also found widespread use in technological and engineering applications, from robotic swarms werfel2014designing to artificial intelligence algorithms dorigo2020reflections , to, recently, active colloids nakayama2023tunable . In these systems, it is usually assumed that individuals possess a minimal level of low-level communication and signal processing capabilities, which leads to the emergence of a shared environmental memory and, eventually, high-level group dynamics marsh2008stigmergic .
Here, we demonstrate that, even in a community of clueless self-motile individuals (i.e., incapable of directly signalling to each other or processing information), avoidance of a dense population of non-fixed obstacles is sufficient to lead to the emergence of stigmergy when the dynamic environment can transiently store memory of the earlier passage of individuals. Counterintuitively, we find that, while the motion of the individuals is hampered by increasing levels of crowding, the spatial correlations created and stored in the otherwise passive environment after their passage feed back on the motion of other individuals boosting aggregation rates and, consequently, group formation.
As paradigmatic self-motile individuals, we employ Janus silica () colloids (diameter ) half-coated with a thin layer of carbon () (Methods). When suspended in a critical binary mixture of water and 2,6-lutidine ( mass fraction of lutidine) below its lower critical temperature (), these colloids undergo Brownian diffusion buttinoni2012active . Upon exposure to laser illumination (, ) (Methods), light absorption at the carbon cap drives the Janus particles’ self-diffusiophoretic motion at a speed of due to local heating and demixing of the critical mixture around the cap buttinoni2012active . Because of their colloidal nature, these self-motile individuals are clueless in the sense that they have no sensing or information processing capabilities and interact with each other through simple physical interactions rules, such as steric and short-range attractive interactions Palacci2012 ; Buttinoni2013 ; mognetti2013living . Boundaries can also influence their motion with aligning interactions das2015boundaries ; simmchen2016topographical .
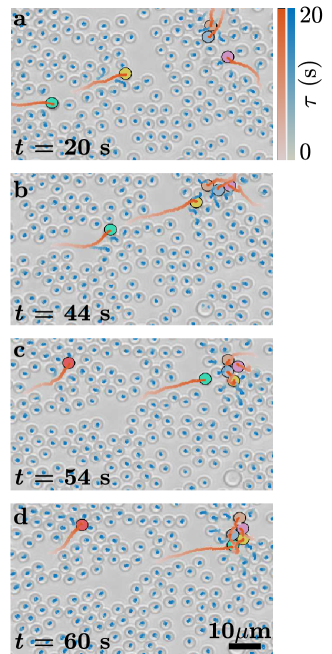
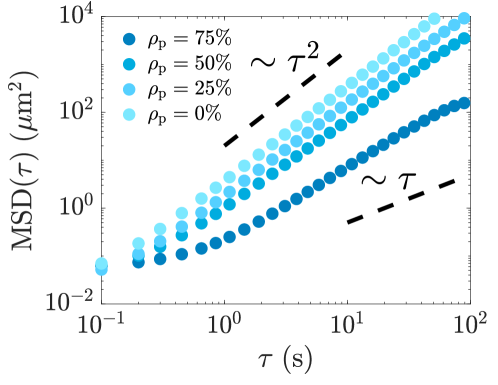
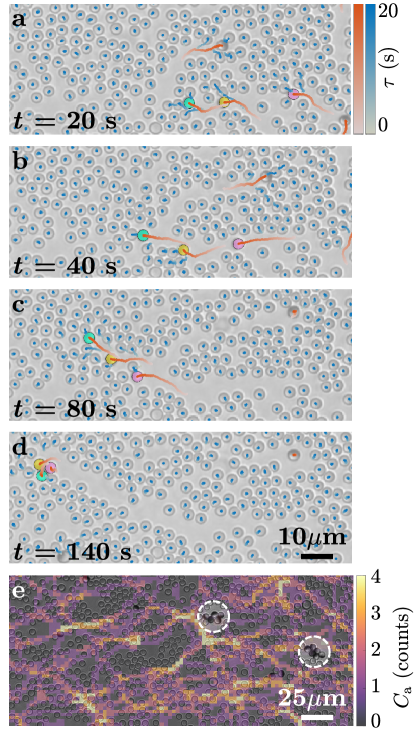
To study their interplay with a dynamic environment of non-static obstacles, we prepare quasi-two-dimensional samples of Janus particles mixed with dispersions of equally-sized freely diffusing silica () colloids at different densities (, defined as fractional surface coverage), where the Janus particles only represent a small portion (, also defined as fractional surface coverage) (Methods). The two example time sequences of active particles () moving in a crowded environment () in Figs. 1 and S1 show how the changes introduced in the passive phase by the active colloids produce spatial correlations in the environment in the form of open transient paths. These paths feed back on the motion of the active particles, eventually leading to group formation (here defined as the formation of a stable cluster of at least three particles). While moving forward, individual Janus particles need to physically dig their own path against the surrounding background of passive colloids (Figs. 1a and S1a), which in turn reduces their overall motility for increasing values of (as exemplified by the mean square displacements in Fig. S2). Interestingly, before closing due to the Brownian motion of the passive colloids, these paths appear to be reused by nearby active colloids, which favour reusing these preformed paths of lower resistance rather than digging their owns (Figs. 1b and S1b). A form of stigmergy between the active particles is then established thanks to their passive counterparts, where the transient paths opened by the active colloids in their surroundings become a shared environmental memory for their peers, which generates a feedback that reinforces their trailing behaviour and, eventually, leads to group formation. Indeed, over time, the trailing Janus colloids catch up with the front particles (Figs. 1c and S1c) to form a small cluster (Figs. 1d and S1d). Once formed, these clusters then grow to larger sizes due to the continuous addition of new active particles to the group through a network of similar transient open paths that form and evolve over time (Fig. 1e).
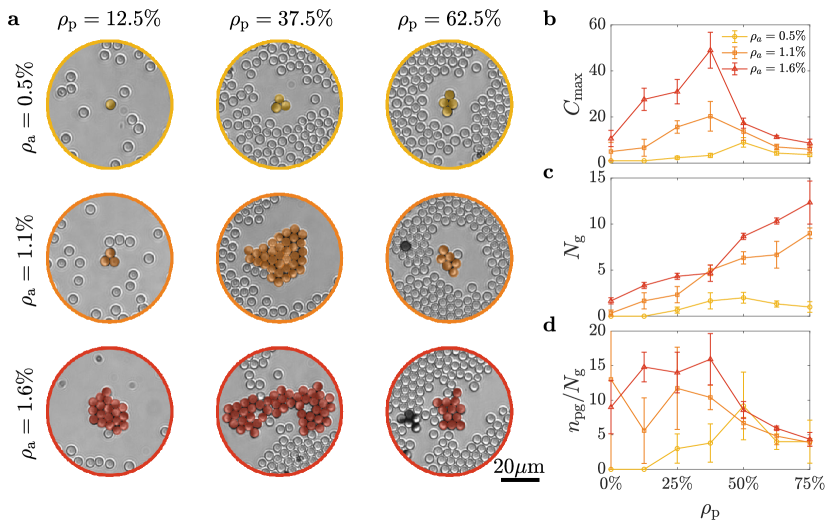
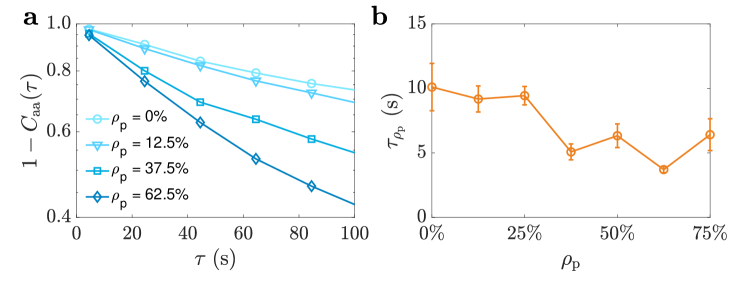
Figure 2a shows examples of the largest groups obtained after 25 minutes of experimental time for different values of and . Independently of , the largest groups appear to form for intermediate values of , where the crowding is sufficient to create a shared memory in the environment in the form of reusable transient paths, but not dense enough to completely hamper the motility of the individual Janus particles. To quantify this observation, we calculated the size of the largest cluster (Fig. 2b), the total number of groups (Fig. 2c) and the average number of particles per group (Fig. 2d) for different values of as a function of . At , no group forms at low density of active particles () as encounters are sparse, while the formation of a very few groups (up to ) becomes increasingly more likely for higher values of , as chances for encounter increase with the number of available individuals. Increasing to intermediate values (up to ) leads to the formation of more groups on average (up to , Fig. 2c). While, for a given , the average size of these groups seems roughly constant (Fig. 2d), a larger cluster emerges (Fig. 2b) that can contain up to of the particles in a group due to the shared environmental memory from the path reuse highlighted in Figs. 1 and S1. This reuse can be quantified through the path revival function , where is the cumulative probability that a region crossed by an active particle will be crossed by another particle within a lag time (Methods). The faster decays (i.e., the faster increases to one), the sooner a region explored by a particle will be crossed by another particle. Figure S3 shows how, in our experiments, the path revival function at first decays faster at higher (quantified by the path revival lifetime ), thus indicating a higher likelihood of reusing previously explored region. This trend of the path revival lifetime with is unexpected and can only by justified by the emergence of a shared environmental memory due to the reuse of pre-existing paths. In fact, if we consider collisions between persistent particles whose velocities are Poisson distributed enns1984hitting , we would expect the lifetime of the path revival function to increase with as the particles’ effective velocity decreases due to the collisions with the passive particles (as confirmed by the MSDs in Fig. S2) — a trend that in our data only appears for high densities (, Fig. S3). Indeed, an even further increase of has a dramatic effect on group formation, as the reduced motility for the active colloids due to the resistance offered by the passive particles (Fig. S2) induces a more intuitive behaviour where group formation and cohesion are drastically hampered by the crowded environment and any reduction of the path revival lifetime with respect to the case at (Fig. S3) is now driven by the active particles being more localised in space due to crowding rather than the presence of longer-range correlations in the form of transient paths. For a given , the ever-increasing number of groups with (Fig. 2c) translates now into smaller groups of more homogeneous sizes and more localised in space, which, differently from , are roughly independent of the initial value of (Figs. 2b and 2d).
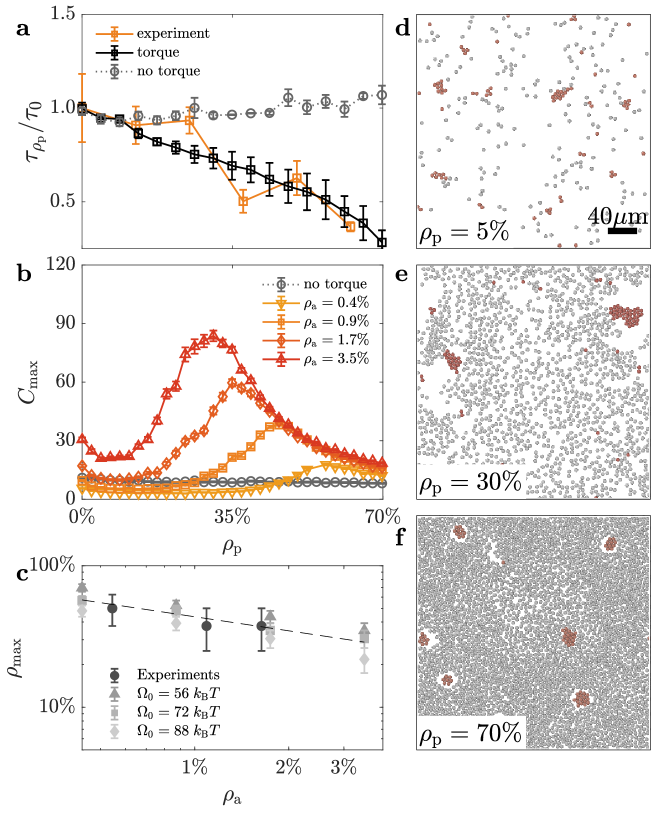
To gain a microscopic understanding of the non-monotonic dynamics of group formation in Fig. 2b, we consider a simple particle-based model that includes an aligning torque in the equations of motion of the active particles (Methods) Liebchen2019 . The effect of this torque is to steer the active particles away from the surrounding passive ones, and align their direction of motion to any effective boundary of a transient path das2015boundaries ; simmchen2016topographical . Figure 3a shows how the presence of this aligning torque is fundamental to reproduce the dependence of the experimental path revival time on , indicating that obstacle avoidance is the mechanism that promotes active particles to follow previously formed transient paths. In fact, in the absence of the torque, the revival lifetime increases with as one would intuitively expect due to the decrease of the particles’ effective velocity caused by collisions with the obstacles enns1984hitting . Fitting our experimental data to our model allows us to determine the strength of the torque to be . As shown in Fig. 3b, the presence of this torque is also critical to recover the non-monotic dependence of the largest group size with as observed in our experimental data (Fig. 2b). Therefore, this torque and the resulting aligning interaction provide an enabling mechanism for the emergence of stigmergy via a shared environmental memory in the system of non-communicating active particles by allowing the spatial correlations in the environment to feed back on the active particles’ motion. Figure 3b also confirms that the non-monotonic dynamics of group formation depend on the numbers of individuals (as already observed in Fig. 2b). At higher values of , encounters become more probable so that groups can form and grow to larger sizes at lower values of . As groups grow to larger sizes, the density of passive particles needed to cage them and prevent them from merging into even larger groups lowers too. The combination of these two effects translate in a decreasing monotonic dependence of the peak position on (Fig. 3c), highlighting the relevance of environmental memory effects for group formation in sparse systems of clueless active particles. Figures 3d-f show example snapshots from the simulations, which confirm our qualitative observations in Fig. 2: at low values of (Fig. 3d), groups of a few units are formed; at intermediate values of (Fig. 3e), the landscape is dominated by a very few large groups that collect most of the active particles; finally, at large values of (Fig. 3f), a few relatively smaller groups of more homogeneous size appear to be caged within the crowded environment.
To further understand how the shared environmental memory affects encounter dynamics, we can define a kinetic model based on mean-field rate equations for the number density of monomers (free active particles, i.e., not part of a group) and for the number density of groups as
| (1) |
| (2) |
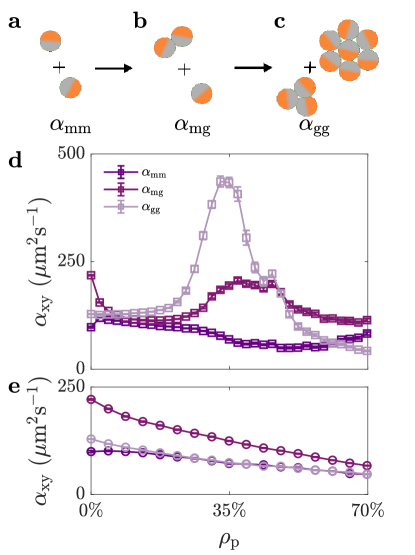
where , and are the rate coefficients of monomer-monomer, monomer-group and group-group aggregation (Methods). In Eq. 1, monomers disappear due to the formation of a new group from two monomers (first term, Fig. 4a) or due to the growth of an existing group by addition of a new monomer (second term, Fig. 4b). Similarly, in Eq. 2, can change due to the formation of a new group from monomers (first term, Fig. 4a) or from the merging of two existing groups (second term, Fig. 4c). In all cases, we assume that the rate of encounters is proportional to the product of the number densities of the species involved (either monomers or groups) and that any dependence on the effective cross-sectional area of each species is accounted for by the effective rates of aggregation , and . Without a shared environmental memory, these rates should only depend on the effective diffusion coefficients of the species involved krapivsky2010kinetic . The larger the effective diffusion coefficient, the faster is the rate of group formation and growth, leading to larger groups within the same time interval. Nonetheless, our experimental results suggest that the effective diffusion coefficients decrease with (Fig. S2), so that the augmented group formation for intermediate values of must result from the presence of spatial correlations in the environment that increase the chances for particles to meet, i.e. the reuse of transient paths highlighted in Figs. 1 and S1.
By calculating the effective rate coefficients (, and ) from the simulated data, we can assess the relative importance of monomer–monomer, monomer–group and group–group aggregation on the kinetics of group formation (Fig. 4d). Both and present a maximum for intermediate values of when group formation is enhanced, while is roughly constant in comparison. In the presence of passive particles, although monomer–monomer aggregation is key for the formation of the initial groups, the kinetics are dominated by groups catalysing their own growth through the addition of new monomers and merging to other existing groups. These aggregation events mediated by the presence of a shared environmental memory are hence behind the enhanced group formation observed at intermediate . Indeed, when the torque is switched off in simulation (Fig. 4e), the shared memory and stigmergy cannot develop (Fig. 3), resulting in aggregation rates that decay monotonically with increasing values of , as one would expect when an increased number of obstacles hinders diffusion (Fig. S2).
In summary, our results demonstrate how, in a decentralised system composed of clueless active units with no explicit signalling pathway or information processing capability, a dynamic environment can create the conditions for the emergence of a shared environmental memory that can coordinate and shape the system’s collective response. Hence, confinement by crowding becomes a condition sufficient for self-organisation to emerge and to activate the system’s coordination capabilities (e.g., by naturally evolving to larger groups) araujo2023steering . Similar mechanisms of shared memory which are primarily promoted and reinforced by dynamic environmental factors could also contribute to shaping the collective dynamics of other decentralised systems where individuals can instead actively signal to each other marsh2008stigmergic , such as communities of micro-organisms mukherjee2019bacterial ; Austin2020 , social insects czaczkes2015trail ; Reid2011 and robotic swarms moussaid2009collective ; dorigo2020reflections . The feedback from the environment could then lower the threshold for quorum formation in natural communities mukherjee2019bacterial and for reaching consensus in decision-making processes garnier2007biological , e.g., by synergistically catalysing any pathway of explicit communication. Finally, we envisage that shared memories promoted by environmental dynamic features could become design factors to implement low-level rules to drive high-level self-organisation in artificial systems, including in the design of antimicrobial surfaces, of crowd management control tools, and of neuromorphic computers and artificial swarm intelligence araujo2023steering .
Acknowledgments
We are grateful to Samantha Rueber and Matthew Blunt for initial training on experimental techniques. CSD and NAMA acknowledge financial support from the Portuguese Foundation for Science and Technology (FCT) under Contracts no. PTDC/FIS-MAC/5689/2020, EXPL/FIS-MAC/0406/2021, CEECIND/00586/2017, UIDB/00618/2020, and UIDP/00618/2020. GV (Giorgio) acknowledges sponsorship for this work by the US Office of Naval Research Global (Award No. N62909-18-1-2170). NAMA and GV (Giorgio) acknowledge support from the UCL MAPS Faculty Visiting Fellowship programme.
Author contributions
Author contributions are defined based on the CRediT (Contributor Roles Taxonomy) and listed alphabetically. Conceptualisation: GV (Giovanni), NAMA, GV (Giorgio). Data Curation: CSD, MT. Formal analysis: CSD, MT, NAMA, GV (Giorgio). Funding acquisition: GV (Giorgio). Investigation: CSD, MT, NAMA. Methodology: CSD, MT, GV (Giovanni), NAMA, GV (Giorgio). Project administration: GV (Giorgio). Resources: NAMA, GV (Giorgio). Software: CSD. Supervision: CSD, NAMA, GV (Giorgio). Validation: CSD, MT, GV (Giorgio). Visualisation: CSD, MT, GV (Giorgio). Writing – original draft: CSD, GV (Giovanni), NAMA, GV (Giorgio). Writing – review and editing: CSD, MT, GV (Giovanni), NAMA, GV (Giorgio).
Competing interests
The authors have no competing interests.
Data availability
All data in support of this work is available in the manuscript or the supplementary materials. Further data and materials are available from the corresponding authors upon reasonable request.
Code availability
The code that supports the findings of this study is available from the corresponding authors upon reasonable request.
Methods
Materials
Glass microscopy slides (Thermo Fisher) were purchased from VWR while glass coverslips were purchased from Thorlabs. The following chemicals were purchased and used as received: 2,6-lutidine ( 99, Sigma-Aldrich), acetone ( 99.8, Sigma-Aldrich), ethanol ( 99.8, Fisher Scientific), sodium hydroxide (NaOH, Fisher Scientific). Deionised (DI) water ( 18 Mcm) was collected from a Milli-Q purification system. Aqueous colloidal dispersions (5 w/v) of silica () colloids for sample preparation (4.77 0.20 m in diameter for Janus particle fabrication and as passive colloids; 7.00 ± 0.15 m in diameter as spacers) were purchased from Microparticles GmbH. Carbon rods of length 300 mm and diameter 6.15 mm for coating Janus particles by sputtering were purchased from Agar Scientific and cut to a length of 50 mm before use. Lens tissue for slide cleaning was purchased from Thorlabs. UV cure adhesive (Blufixx) and hydrophobic coating (RainX) for sample preparation were purchased from an online retailer (Amazon).
Slide cleaning protocol
Before their use for sample preparation, glass slides and coverslips were cleaned by wiping with acetone-soaked lens tissue. RainX (a commercial solution which renders glass surfaces more hydrophobic and aids limiting particle sticking to the glass chamber) was then smeared on both with a cotton bud and gently dried with a nitrogen gun. After 2 min, excess RainX was removed by wiping with acetone-soaked lens tissue. Glass slides for the deposition of colloidal monolayers were instead cleaned by sonication for 10 min in a 2 M NaOH ethanolic solution followed by three cycles of 5 min sonication in DI water. To dry them, the slides were withdrawn from water in the presence of ethanol vapor (Marangoni drying) and, subsequently, blown dry with a nitrogen gun.
Fabrication of Janus particles
The Janus particles used in our experiments were fabricated from colloids of diameter , which were coated on one side with a thin layer () of carbon. We first deposited a monolayer of colloids on a clean glass slide. The monolayer was obtained by evaporating a droplet containing a dispersion of the colloids in DI water. The particles were then coated with a 60 nm thick carbon layer using an automatic carbon coater (AGB7367A, Agar Scientific). The thickenss of the carbon layer was confirmed by atomic force measurements (AFM). Post-coating sonication allowed us to dislodge the half-coated particles in DI water from the glass slide to use them for sample preparation.
Sample preparation
Samples were prepared in the form of a quasi-two-dimensional glass chamber filled with a colloidal dispersion in a critical mixture of water-2,6-lutidine. Typical colloidal dispersions include Janus particles as well as passive particles and spacers. For example, to achieve a typical dispersion with packing fractions of and , we mixed stock dispersions of the three types of particles in DI water to achieve an aqueous dispersion containing w/v of Janus particles, w/v of passive particles and w/v of spacers. This concentration of spacers was chosen to minimise their number in the field of view, whilst giving enough support to maintain the quasi-two-dimensional chamber’s geometry. Samples with other packing fractions ( and ) were obtained by linearly scaling these concentrations of Janus particles and passive particles to obtain the right values of and . Before their use, the colloidal mixtures were centrifuged at 1000 relative centrifugal force (RCF) for 3 minutes leaving a pellet; the supernatant was then removed and replaced with a w/v water-2,6-lutidine solution. This process was repeated three times to remove residual DI water from the initial dispersion. Experiment-ready quasi-two-dimensional sample chambers containing a dispersion of colloids in a critical water-2,6-lutidine solution were prepared by sandwiching of this final dispersion between a clean glass slide and a thin coverslip. The chamber was sealed by applying an ultraviolet-curable adhesive around the edges of the coverslip, which was then exposed to UV light for 30 s on each side. Before data acquisition, the sample was left to equilibrate over a 30 min period.
Optical setup and microscopy
All the experiments were performed on an inverted microscope (Leica, DMI4000) equipped with a homemade flow thermostat to maintain the critical suspension at a fixed temperature (T = 30 ∘C) below the critical point (C). The sample was illuminated with a green continuous-wave laser () at a power density of to propel the Janus particles via self-diffusiophoresis due to light absorption at the carbon cap buttinoni2012active . Both Janus and passive particles are tracked by digital video microscopy crocker1996methods using the image projected by a microscope objective (, ) on a monochrome complementary metal–oxide–semicondutor (CMOS) camera (Thorlabs, DCC1545M) with an acquisition rate of 10 frames per second. The incoherent illumination for the tracking is provided by a white-light-emitting diode (Thorlabs, MWWHLP1) directly projected onto the sample. A long-pass dichroic mirror (Thorlabs, DMLP605) with a 605-nm cut-on wavelength is used to combine laser and white light before the sample, while laser light is removed from the detection path with a notch filter centred at 532 nm (Semrock, NF01-532U-25).
Path revival function
To quantify the path reuse by the Janus particles, we define the path revival function , where is the cumulative probability that a region crossed by an active particle will be crossed by another particle within a lag time . To compute we define a circular region of diameter around each active particle at a certain time and measure how many of those regions have been crossed by the center of another active particle up to lag time . If we consider the particles’ velocities to be Poisson distributed when a path is chosen, then this function should follow an exponential distribution for persistent particles enns1984hitting
| (3) |
where is the effective path revival lifetime, which we fit from the data. For both experiments and simulations, we assume that the initial positions in the particles’ trajectories are uncorrelated (i.e., in the experiments, we only consider trajectories of individual particles before groups form and, in the simulations, the short-range attractive interaction between particles is turned off to prevent group formation).
Particle-based simulations
We consider a numerical model where active spheres and passive spheres of diameter move inside a two-dimensional box of side with periodic boundary conditions. Both and are fixed to match the experimental values of and . As in the experiments, all particles, whether active or passive, have the same size and mass .
To map the simulations to the experiments, we consider the same Péclet number defined as,
| (4) |
where , , and . Both velocity and diameter of the active particles were used to convert the reduced units in simulations to SI units. The translational diffusion coefficient was calculated as
| (5) |
where is the Boltzmann constant, the absolute temperature, and is the corrected translational drag coefficient for colloids at distance from a surface Leach2009 , given by
| (6) |
with
| (7) |
where is the fluid viscosity. We assume , , and for the water-lutidine mixture. Similarly, the rotational diffusion coefficient was calculated as
| (8) |
where is the corrected rotational drag coefficient for colloids at distance from a surface Leach2009 , given by
| (9) |
with
| (10) |
The trajectories of both active and passive particles were obtained by integrating their equations of motion using a velocity Verlet scheme implemented in the Large-scale Atomic/Molecular Massively Parallel Simulator (LAMMPS) PLIMPTON1995 . Specifically, the particles’ translational motion and rotational motion around one single axis (perpendicular to the simulation plane) are respectively described by the following Langevin equations,
| (11) |
and
| (12) |
where and are the translational and angular velocity for particle , , , is the strength of the self-propulsion force for the active particles, is the damping time, is the particles’ inertia of rotation, is the potential due to the interaction with all surrounding particles, and is an effective torque due to the interaction of particle with the surrounding passive particles. and are stochastic terms taken from a truncated random distribution of zero mean and unitary standard deviation Dunweg1991 . Moreover, is a model parameter that defines the relationship between the rotational () and translational () diffusion coefficients as
| (13) |
where is adjusted to map the experimental relation between and .
The motion of the passive particles is only governed by Eq. 11, where we set .
The interaction between particles is implemented with a Lennard-Jones potential given by
| (14) |
where is the distance between two particles, the depth of the potential well, and the width of the potential (distance at which the potential is zero). For passive particles, with purely repulsive interactions, we consider a truncated Lennard-Jones potential where the cut-off is set at to remove the attractive part. For active particles, we consider an attractive interaction with a cut-off set at . The depth of the potential well is obtained from experimental data (Fig. S4).
Finally, to describe the impact of the passive particles on the rotational degrees of freedom of the active particles, we introduce the effective torque on particle Liebchen2019
| (15) |
where sets the strength of the torque, and is the cross product. The negative sign indicates that active particle steer away from the surrounding passive ones; gives the screening number in agreement with the range of experimental values estimated in Liebchen2019 . For numerical efficiency, we set a cut-off radius of four particles diameters, where the value of the torque is much lower than the typical thermal noise. The torque used to map the experiments () was computed and confirmed from two different experimental measurements (Figs. 3a,c).
Rate equations
The relevant mechanisms for the dynamics are: (1) the formation of new groups by combining two free active particles (monomers); (2) the growth of a group by the addition of a monomer; (3) the pairwise merging of groups; and (4) their fragmentation. In the experiments, we define groups as clusters of size larger than two as dimers are unstable in time. Here, for completeness, we consider all cases. We assume that groups only lose one active particle at a time (fragmentation).
We define and as the number densities of free active particles (monomers) and groups of size , respectively. The following rate equations then gives the time evolution of ,
| (16) |
where the first term accounts for the formation of new groups, the second one for the growth of an existing group, the third for fragmentation, and the fourth term for the additional free active particle obtained from the fragmentation of groups of size two. If the distance between groups is larger than the persistence length of the free active particles, the main mechanism of mass transport is diffusion and, in the absence of spatial correlations, the rates and should only depend on the size of the active particles and on their effective diffusion coefficients krapivsky2010kinetic . For simplicity, we also consider that does not depend on the group size.
Similarly, for groups of size two,
| (17) |
and for groups of size ,
| (18) |
If we now define the number density of groups and the total fragmentation rate , we obtain,
| (19) |
and,
| (20) |
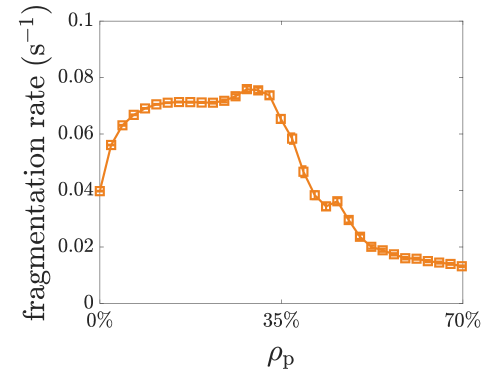
In simulation, we observe that the total fragmentation rate is constant for a large range of up to the intermediate values where the largest groups are observed and then drops fast at higher values (Fig. S5). Thus, aggregation rather than fragmentation is the leading factor in the non-monotonic dynamics of group formation observed in Fig. 2. If we neglect fragmentation, we obtain Eqs. 1 and 2, respectively.
References
- \bibcommenthead
- (1) Vicsek, T., Zafeiris, A.: Collective motion. Phys. Rep. 517(3-4), 71–140 (2012)
- (2) Mukherjee, S., Bassler, B.L.: Bacterial quorum sensing in complex and dynamically changing environments. Nat. Rev. Microbiol. 17(6), 371–382 (2019)
- (3) Czaczkes, T.J., Grüter, C., Ratnieks, F.L.: Trail pheromones: an integrative view of their role in social insect colony organization. Annu. Rev. Entomol. 60, 581–599 (2015)
- (4) Moussaid, M., Garnier, S., Theraulaz, G., Helbing, D.: Collective information processing and pattern formation in swarms, flocks, and crowds. Top. Cogn. Sci. 1(3), 469–497 (2009)
- (5) Sieben, A., Schumann, J., Seyfried, A.: Collective phenomena in crowds—where pedestrian dynamics need social psychology. PLoS one 12(6), 0177328 (2017)
- (6) Bechinger, C., Di Leonardo, R., Löwen, H., Reichhardt, C., Volpe, G., Volpe, G.: Active particles in complex and crowded environments. Rev. Mod. Phys. 88(4), 045006 (2016)
- (7) Dorigo, M., Theraulaz, G., Trianni, V.: Reflections on the future of swarm robotics. Sci. Robot. 5(49), 4385 (2020)
- (8) Palacci, J., Sacanna, S., Steinberg, A.P., Pine, D.J., Chaikin, P.M.: Living crystals of light-activated colloidal surfers. Science 339(6122), 936–940 (2013)
- (9) Lavergne, F.A., Wendehenne, H., Bäuerle, T., Bechinger, C.: Group formation and cohesion of active particles with visual perception-dependent motility. Science 364(6435), 70–74 (2019)
- (10) Buttinoni, I., Bialké, J., Kümmel, F., Löwen, H., Bechinger, C., Speck, T.: Dynamical clustering and phase separation in suspensions of self-propelled colloidal particles. Phys. Rev. Lett. 110(23), 238301 (2013)
- (11) Cates, M.E., Tailleur, J.: Motility-induced phase separation. Annu. Rev. Condens. Matter Phys. 6(1), 219–244 (2015)
- (12) Ginot, F., Theurkauff, I., Detcheverry, F., Ybert, C., Cottin-Bizonne, C.: Aggregation-fragmentation and individual dynamics of active clusters. Nat. Commun. 9(1), 696 (2018)
- (13) Bricard, A., Caussin, J.-B., Desreumaux, N., Dauchot, O., Bartolo, D.: Emergence of macroscopic directed motion in populations of motile colloids. Nature 503(7474), 95–98 (2013)
- (14) Yan, J., Han, M., Zhang, J., Xu, C., Luijten, E., Granick, S.: Reconfiguring active particles by electrostatic imbalance. Nat. Mater. 15(10), 1095–1099 (2016)
- (15) Pinçe, E., Velu, S.K.P., Callegari, A., Elahi, P., Gigan, S., Volpe, G., Volpe, G.: Disorder-mediated crowd control in an active matter system. Nat. Commun. 7, 10907 (2016)
- (16) Khadka, U., Holubec, V., Yang, H., Cichos, F.: Active particles bound by information flows. Nat. Commun. 9(1), 3864 (2018)
- (17) Reichhardt, C., Reichhardt, C.O.: Local melting and drag for a particle driven through a colloidal crystal. Phys. Rev. Lett. 92(10), 108301 (2004)
- (18) Kümmel, F., Shabestari, P., Lozano, C., Volpe, G., Bechinger, C.: Formation, compression and surface melting of colloidal clusters by active particles. Soft Matter 11(31), 6187–6191 (2015)
- (19) Van Der Meer, B., Filion, L., Dijkstra, M.: Fabricating large two-dimensional single colloidal crystals by doping with active particles. Soft Matter 12(14), 3406–3411 (2016)
- (20) Omar, A.K., Wu, Y., Wang, Z.-G., Brady, J.F.: Swimming to stability: structural and dynamical control via active doping. ACS nano 13(1), 560–572 (2018)
- (21) Dietrich, K., Volpe, G., Sulaiman, M.N., Renggli, D., Buttinoni, I., Isa, L.: Active atoms and interstitials in two-dimensional colloidal crystals. Phys. Rev. Lett. 120(26), 268004 (2018)
- (22) Ramananarivo, S., Ducrot, E., Palacci, J.: Activity-controlled annealing of colloidal monolayers. Nat. Commun. 10(1), 3380 (2019)
- (23) Banerjee, J.P., Mandal, R., Banerjee, D.S., Thutupalli, S., Rao, M.: Unjamming and emergent nonreciprocity in active ploughing through a compressible viscoelastic fluid. Nat. Commun. 13(1), 4533 (2022)
- (24) Madden, I.P., Wang, L., Simmchen, J., Luijten, E.: Hydrodynamically controlled self-organization in mixtures of active and passive colloids. Small 18(21), 2107023 (2022)
- (25) Trivedi, M., Saxena, D., Ng, W.K., Sapienza, R., Volpe, G.: Self-organized lasers from reconfigurable colloidal assemblies. Nat. Phys. 18(8), 939–944 (2022)
- (26) Garnier, S., Gautrais, J., Theraulaz, G.: The biological principles of swarm intelligence. Swarm Intell. 1, 3–31 (2007)
- (27) Marsh, L., Onof, C.: Stigmergic epistemology, stigmergic cognition. Cogn. Syst. Res. 9(1-2), 136–149 (2008)
- (28) Lugano, R., Ramachandran, M., Dimberg, A.: Tumor angiogenesis: causes, consequences, challenges and opportunities. Cell. Mol. Life Sci. 77(9), 1745–1770 (2020)
- (29) Phan, T.V., Morris, R., Black, M.E., Do, T.K., Lin, K.-C., Nagy, K., Sturm, J.C., Bos, J., Austin, R.H.: Bacterial route finding and collective escape in mazes and fractals. Phys. Rev. X 10, 031017 (2020)
- (30) Tweedy, L., Thomason, P.A., Paschke, P.I., Martin, K., Machesky, L.M., Zagnoni, M., Insall, R.H.: Seeing around corners: Cells solve mazes and respond at a distance using attractant breakdown. Science 369(6507), 9792 (2020)
- (31) Reid, C.R., Sumpter, D.J.T., Beekman, M.: Optimisation in a natural system: Argentine ants solve the Towers of Hanoi. J. Exp. Biol. 214(1), 50–58 (2011)
- (32) Murakami, H., Feliciani, C., Nishiyama, Y., Nishinari, K.: Mutual anticipation can contribute to self-organization in human crowds. Sci. Adv. 7(12), 7758 (2021)
- (33) Werfel, J., Petersen, K., Nagpal, R.: Designing collective behavior in a termite-inspired robot construction team. Science 343(6172), 754–758 (2014)
- (34) Nakayama, B., Nagase, H., Takahashi, H., Saito, Y., Hatayama, S., Makino, K., Yamamoto, E., Saiki, T.: Tunable pheromone interactions among microswimmers. Proc. Natl. Acad. Sci. U.S.A. 120(9), 2213713120 (2023)
- (35) Buttinoni, I., Volpe, G., Kümmel, F., Volpe, G., Bechinger, C.: Active brownian motion tunable by light. J. Phys. Condens. Matter 24(28), 284129 (2012)
- (36) Mognetti, B.M., Šarić, A., Angioletti-Uberti, S., Cacciuto, A., Valeriani, C., Frenkel, D.: Living clusters and crystals from low-density suspensions of active colloids. Phys. Rev. Lett. 111(24), 245702 (2013)
- (37) Das, S., Garg, A., Campbell, A.I., Howse, J., Sen, A., Velegol, D., Golestanian, R., Ebbens, S.J.: Boundaries can steer active janus spheres. Nat. Commun. 6(1), 8999 (2015)
- (38) Simmchen, J., Katuri, J., Uspal, W.E., Popescu, M.N., Tasinkevych, M., Sánchez, S.: Topographical pathways guide chemical microswimmers. Nat. Commun. 7(1), 10598 (2016)
- (39) Enns, E., Smith, B., Ehlers, P.: Hitting spheres by straight-line motion or brownian motion. J. Appl. Probab. 21(1), 70–79 (1984)
- (40) Liebchen, B., Löwen, H.: Which interactions dominate in active colloids? J. Chem. Phys. 150, 061102 (2019)
- (41) Krapivsky, P.L., Redner, S., Ben-Naim, E.: A Kinetic View of Statistical Physics. Cambridge University Press, New York (2010)
- (42) Araújo, N.A.M., Janssen, L.M., Barois, T., Boffetta, G., Cohen, I., Corbetta, A., Dauchot, O., Dijkstra, M., Durham, W.M., Dussutour, A., et al.: Steering self-organisation through confinement. Soft Matter 19(9), 1695–1704 (2023)
- (43) Crocker, J.C., Grier, D.G.: Methods of digital video microscopy for colloidal studies. J. Colloid Interface Sci. 179(1), 298–310 (1996)
- (44) Leach, J., Mushfique, H., Keen, S., Di Leonardo, R., Ruocco, G., Cooper, J.M., Padgett, M.J.: Comparison of Faxén’s correction for a microsphere translating or rotating near a surface. Phys. Rev. E 79, 026301 (2009)
- (45) Plimpton, S.: Fast parallel algorithms for short-range Molecular Dynamics. J. Comp. Phys. 117, 1 (1995)
- (46) Dunweg, B., Wolfgang, P.: Brownian Dynamics without gaussian random numbers. Int. J. Mod. Phys. C 2, 817 (1991)
Supplementary Information
Supplementary Figures