2023 May 31
galaxies: active — galaxies: ISM — galaxies: Seyfert
Nobeyama 45-m CO =1–0 Observations of Luminous Type 1 AGNs at
Abstract
We have performed CO =1–0 observations of ten galaxies hosting luminous () type 1 active galactic nuclei (AGNs) with the Nobeyama 45-m radio telescope. The targets are selected because they are expected to be rich in molecular gas based on their high nebular dust extinction (). However, no significant CO emission lines were detected in any of the targets. The upper limits of the CO =1–0 luminosities are lower than expected given the molecular gas mass inferred from the nebular . This inconsistency may be due to overestimated values due to the lack of stellar absorption correction. Considering more reliable values, the CO =1–0 non-detections by Nobeyama 45-m are natural. This suggests that our results do not contradict the conversion methods from to molecular gas mass proposed in the literature. This survey suggests that careful measurements as well as CO observations are still needed to improve the measurements or estimates of the molecular gas content of galaxies hosting luminous AGNs.
1 Introduction
To understand the regulation of star formation rates and the cold gas content of galaxies, as well as the co-evolution of supermassive black holes and their galaxies, it is important to study the feedback process associated with Active Galactic Nuclei (AGN), which can change the ionization structure and inject energy and momentum into the interstellar medium (ISM). Studying molecular gas content in ISM could provide direct evidence for the effect of AGN feedback. For example, fast molecular gas outflows driven by AGNs could heat and sweep out cold gas in their host galaxies, thereby inhibiting star formation and preventing the galaxies from overgrowing. Such effects are known as negative feedback (e.g., [Fabian (2012)]). On the other hand, in positive feedback, star formation activities of the host galaxy could be enhanced by star formation inside outflows driven by AGNs and/or the compression of gas due to the interaction between ISM and jet triggered by AGNs (e.g., [Maiolino et al. (2017)]).
In order to understand how AGN affects their host galaxies, low- CO emissions are observed in a number of galaxies (Husemann et al., 2017; Jarvis et al., 2020; Koss et al., 2021). For example, Shangguan et al. (2020a, b) investigated the molecular gas properties of a representative sample of 40 () quasars. These two studies represent one of the largest and most sensitive CO surveys for low- quasars. They found that the AGN luminosity correlates with both the CO luminosity and BH mass, suggesting that strong AGNs are gas-rich. It is necessary to increase the sample size to understand the feedback processes in gas-rich luminous AGNs, however, measuring CO lines in large AGN samples is time-consuming. To overcome the small sample size of CO measurements, Yesuf & Ho (2019) developed a new technique to indirectly measure molecular gas mass () using dust extinction and metallicity in a sample of nearby star-forming galaxies (see also Yesuf & Ho (2020a, b)). This new method is effective because it can be applied to large surveys such as Sloan Digital Sky Survey (York et al., 2000, SDSS).
While the methods in Yesuf & Ho (2019) have been tested on a heterogeneous sample of AGNs with CO observations (Zhuang et al., 2021), it is not clear whether this method can be applied to any AGN population, especially those with extreme dust extinction. In this paper, we check whether this indirect method works for extremely dusty (nebular ) and luminous () type 1 AGNs from Zhuang et al. (2021) by directly observing CO =1–0 (hereafter CO (1–0)) emission. These objects have high molecular gas mass () predicted from their high nebular extinction. This paper is structured as follows: Section 2 and 3 explain the Nobeyama 45-m observations and the results, respectively. Section 2 discusses the reasons for Nobeyama 45-m non-detections. This paper assumes a cosmology with km s-1 Mpc-1 and .
2 Nobeyama 45-m radio telescope observations
2.1 Sample selection
We used the Nobeyama 45-m radio telescope to observe CO (1–0) line of type 1 AGN sample investigated in Zhuang et al. (2021). The targets are selected from 453 AGNs in Zhuang et al. (2021) based on molecular gas mass () predicted by a combination of and metallicity using the calibration from Yesuf & Ho (2019),
| (1) |
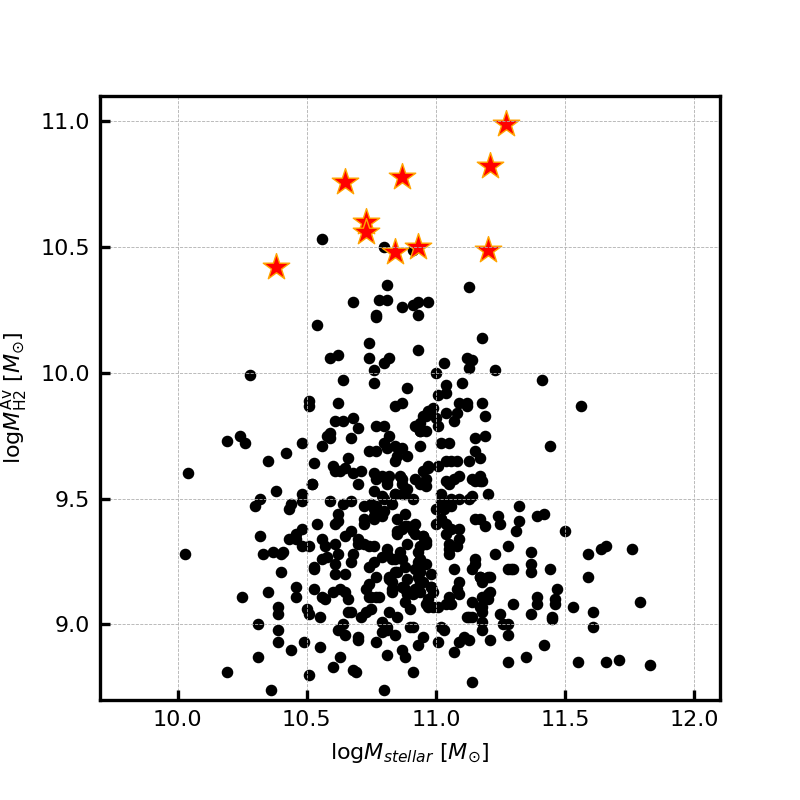
where is estimated using mass-metallicity relation from Tremonti et al. (2004) as parameterized by Kewley & Ellison (2008). Table 1 summarizes the basic properties of our targets. Among the targets that were observable from the Nobeyama site, we selected targets whose is the largest in every observation slot assigned. Finally, we succeeded to observe 10 AGNs (Figure 1). In addition, we observed PG 1700+518 (PG) to confirm that our observation setups were correct (see details in Appendix).
| ID | SDSS name | R.A., Decl. | z | ||||||
|---|---|---|---|---|---|---|---|---|---|
| (J2000.0) | (GHz) | () | (erg s-1) | (mag) | () | ||||
| (1) | (2) | (3) | (4) | (5) | (6) | (7) | (8) | (9) | (10) |
| Q0 | J140604.26+572956.5 | 14h06m04.3s +57d29m57s | 86.95 | 0.326 | 18.6 | 47.15 | 4.94 | 9.11 | 9.7 |
| Q1 | J114906.09+042859.6 | 11h49m06.1s +04d28m60s | 86.51 | 0.333 | 16.2 | 46.83 | 4.56 | 9.11 | 6.5 |
| Q2 | J012419.88+141858.5 | 01h24m19.9s +14d18m59s | 86.08 | 0.339 | 7.4 | 47.06 | 4.51 | 9.10 | 5.9 |
| Q3 | J102700.24-010425.0 | 10h27m00.2s -01d04m25s | 85.77 | 0.344 | 4.5 | 47.42 | 4.58 | 9.08 | 5.6 |
| Q4 | J085420.81+031144.4 | 08h54m20.8s +03d11m44s | 87.17 | 0.322 | 5.4 | 46.30 | 4.18 | 9.09 | 3.9 |
| Q5 | J023602.08-090000.9 | 02h36m02.1s -09d00m01s | 86.30 | 0.336 | 5.4 | 45.97 | 4.09 | 9.09 | 3.6 |
| Q6 | J161436.82+283906.0 | 16h14m36.8s +28d39m06s | 87.57 | 0.316 | 8.5 | 46.61 | 3.88 | 9.11 | 3.2 |
| Q7* | J074613.33+332604.0 | 07h46m13.3s +33d26m04s | 87.43 | 0.318 | 6.3 | 46.43 | 3.92 | 9.10 | 3.2 |
| Q8* | J085229.48+024713.9 | 08h52m29.5s +02d47m14s | 86.36 | 0.335 | 3.6 | 46.26 | 4.12 | 9.07 | 3.3 |
| Q9* | J081446.27+223645.6 | 08h14m46.3s +22d36m46s | 86.93 | 0.326 | 8.1 | 46.93 | 3.85 | 9.11 | 3.1 |
| Q10 | J204626.11+002337.7 | 20h46m26.1s +00d23m38s | 86.52 | 0.332 | 6.9 | 47.26 | 3.87 | 9.10 | 3.0 |
| Q11 | J142441.21-000727.1 | 14h24m41.2s -00d07m27s | 87.44 | 0.318 | 2.4 | 46.47 | 4.04 | 9.04 | 2.6 |
| Q12 | J140609.74+604500.1 | 14h06m09.7s +60d45m00s | 85.50 | 0.348 | 15.8 | 46.65 | 3.84 | 9.11 | 3.1 |
2.2 Observation
The observations were performed during the period from 2021 January to February using the Nobeyama 45-m radio telescope (project ID is CG201019). We used the multi-beam receiver FOREST (FOur-beam REceiver System on the 45-m Telescope; Minamidani et al. (2016)) and the FX type correlator SAM45 (Spectral Analysis Machine for the 45-m telescope), which is equivalent to a part of the Atacama Compact Array Correlator (Kuno et al., 2011; Kamazaki et al., 2012).The bandwidth is 2 GHz and the velocity resolution is 488.28 kHz (i.e., 4096 channels). During the observation, the pointing accuracy () was checked every one hour if the wind speed is m s-1 and every 30 minutes if the wind speed is m s-1. This was done by observing SiO maser sources at 43 GHz or strong continuum sources (3C273). We observed a compact standard source IRC +10216 during the observation to measure the main beam efficiency (), showing that the beam efficiency is ( is antenna temperature and is main beam temperature). When we investigate the upper limits of CO integrated intensity, we assume for conservative estimation because depends on pointing accuracy (see details in Appendix). For PG 1700+518, we use which is the value measured on 26th January. Table 2 is the summary for the observing date, sources for pointing calibration, and weather conditions.
| Date | Targets | Pointing | Water Vapor | Wind | |
|---|---|---|---|---|---|
| (yyyy/mm/dd) | (K) | (hPa) | (m s-1) | ||
| (1) | (2) | (3) | (4) | (5) | (6) |
| 2021/01/11 | J140604 (Q0) | S-Crb | 150300 | 13 | |
| J204626 (Q10) | O-Cet | 130200 | 23 | ||
| J012419 (Q2) | O-Cet | 140200 | 25 | ||
| J012419 (Q5) | O-Cet | 140200 | 25 | ||
| J085420 (Q4) | R-Leo | 100200 | 46 | ||
| J140604 (Q0) | S-Crb, U-Her | 140300 | 56 | ||
| J140609 (Q12) | R-Leo | 100250 | 57* | ||
| 2021/01/14 | J140604 (Q0) | 3C273 | 100200 | 12 | |
| 2021/01/26 | J114906 (Q1) | 3C273 | 120250 | 02 | |
| PG 1700+518 (PG) | 3C273 | 120300 | 12 | ||
| 2021/01/28 | J102700 (Q3) | R-Leo | 200300 | 02 | |
| J161436 (Q6) | U-Her | 250400 | 24 | ||
| J142441 (Q11) | S-Crb | 160240 | 35 |
2.3 Data reduction
We used Java NEWSTAR which is an astronomical data-analyzing system developed by the Nobeyama 45-m Radio Observatory. The bad scans (e.g., wavy spectra and terrible spurs) were manually flagged. Then, the baseline was fitted by linear function for each scan, and each scan for both polarization is integrated into one spectrum.
3 Results
3.1 Individual Object
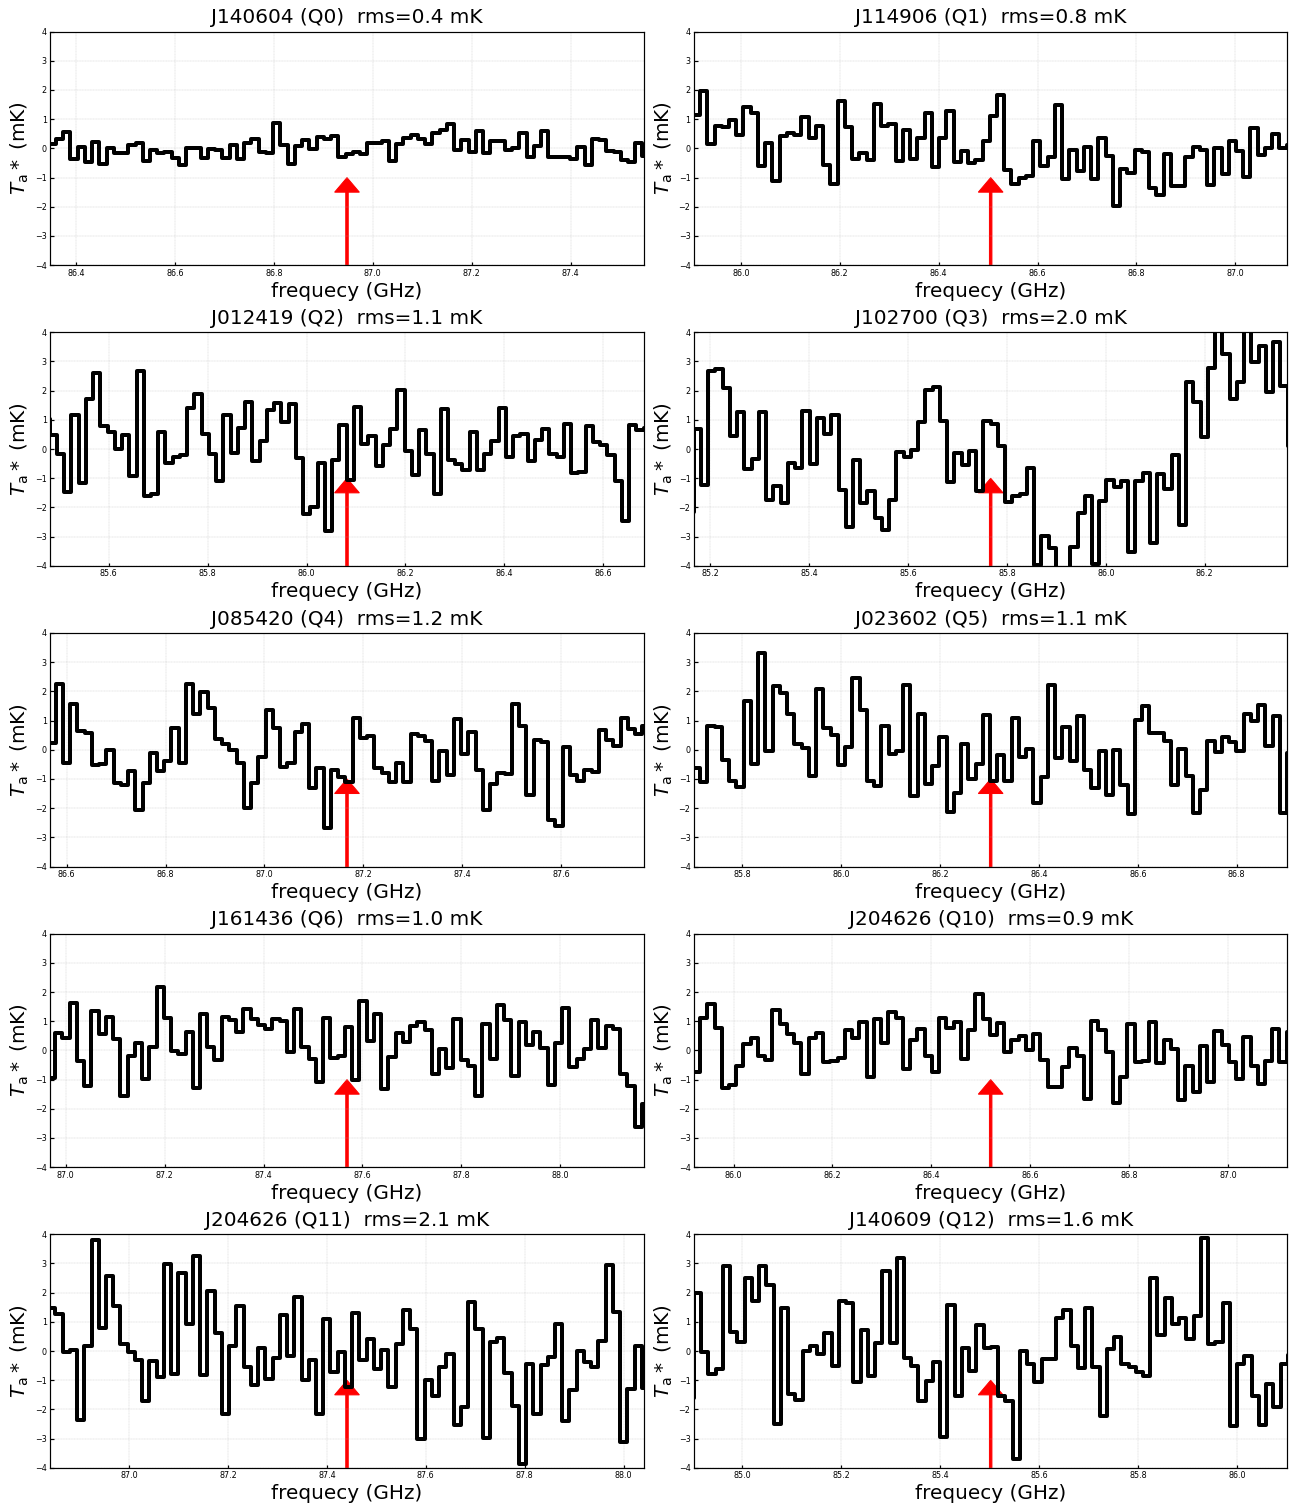
After binning the channel with a velocity resolution of 50 km s-1, no significant CO (1–0) emissions () were confirmed in any spectrum (Figure 2). Therefore, we calculate upper limit of the integrated intensity according to Hainline et al. (2004),
| (2) |
where is the rms noise in each spectra at given , is the main beam efficiency, km s-1 is the line width assumed by the detected CO (1–0) emission in PG 1700+618 (see Appendix), is the number of channels for the integration ( km s-1 is the velocity resolution). Then, we calculate the upper limit of CO luminosity () based on
| (3) |
where is the beam solid angle of the main beam (=18\farcs6 at 86 GHz) and is the luminosity distance (e.g., Mpc for J140604). Table 3 presents the summary of observation information and upper limits. In regard to J102700 (Q3), the exceeds the theoretical noise level determined from the on-source time ( mK assuming K and minutes). This discrepancy could be attributed to the fluctuating spectrum. The data flags by eyes may not adequately address this particular target. Nevertheless, this issue does not significantly impact the main conclusion of this paper, as we utilize upper limits for our analysis.
| Targets | |||||
|---|---|---|---|---|---|
| (min.) | (mK) | (K km s-1) | ( K km s-1 pc2) | ( ) | |
| (1) | (2) | (3) | (4) | (5) | (6) |
| J140604 (Q0) | 140 | 0.4 | 0.27 | 0.31 | 0.2, 1.0, 1.3 |
| J114906 (Q1) | 22 | 0.8 | 0.55 | 0.66 | 0.5, 2.0, 2.7 |
| J012419 (Q2) | 16 | 1.1 | 0.75 | 0.93 | 0.7, 2.9, 3.9 |
| J102700 (Q3) | 36 | 2.0 | 1.37 | 1.74 | 1.4, 5.4, 7.3 |
| J085420 (Q4) | 22 | 1.2 | 0.82 | 0.91 | 1.4, 5.4, 7.3 |
| J023602 (Q5) | 19 | 1.1 | 0.75 | 0.91 | 0.7, 2.8, 3.8 |
| J161436 (Q6) | 23 | 1.0 | 0.68 | 0.73 | 0.7, 2.8, 3.8 |
| J204626 (Q10) | 29 | 0.9 | 0.62 | 0.72 | 0.6, 2.3, 3.0 |
| J142441 (Q11) | 20 | 2.1 | 1.44 | 1.54 | 1.2, 4.8, 6.5 |
| J140609 (Q12) | 13 | 1.6 | 1.09 | 1.42 | 1.1, 4.4, 6.0 |
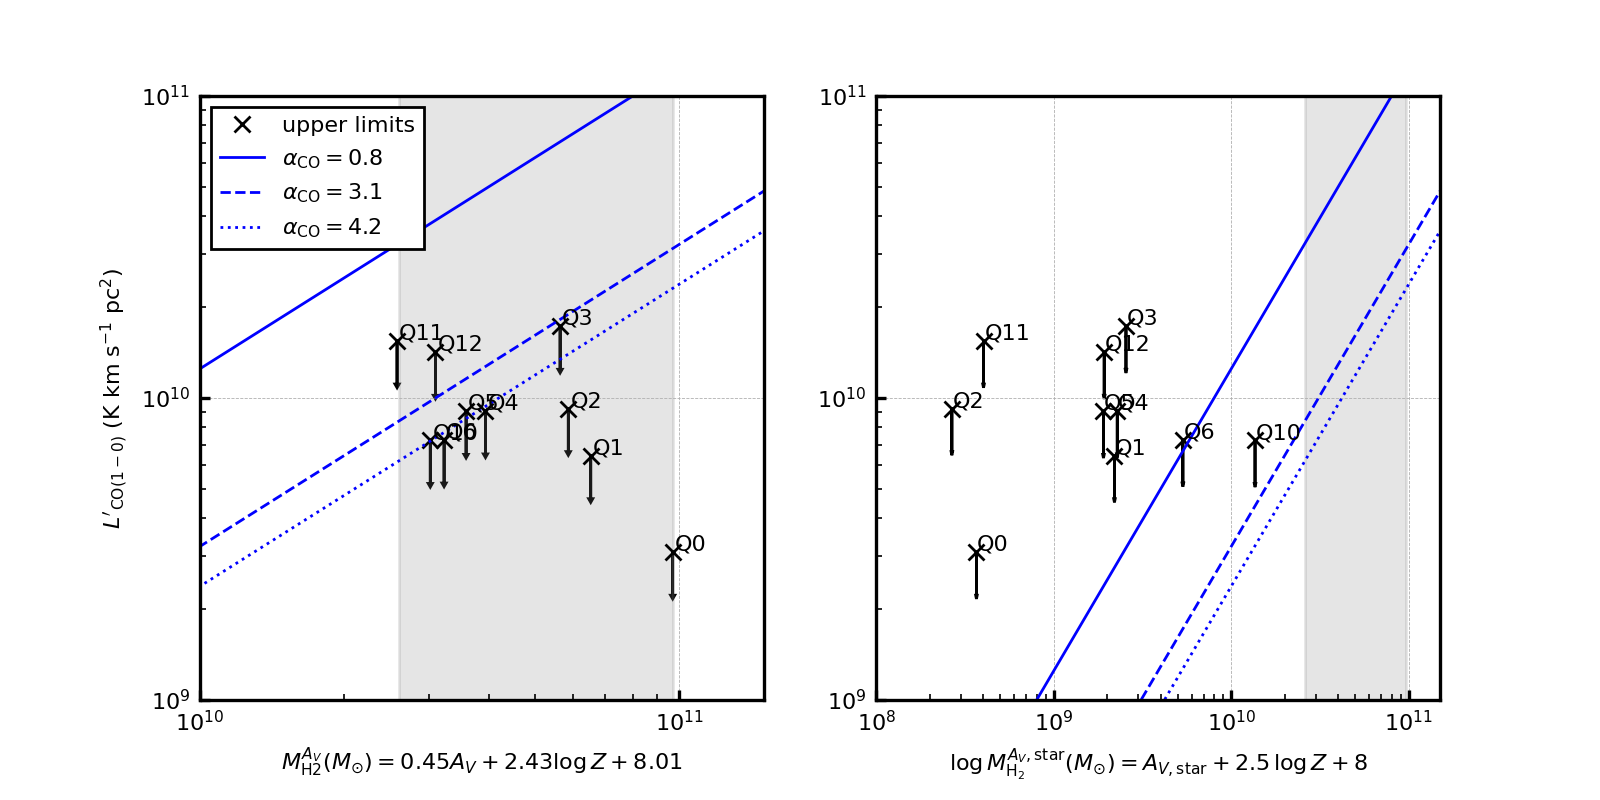
Figure 3 (left) compares the predicted with upper limits of from our observations. The ratio between and is the CO-to-H2 conversion factor (). The is often assumed for active galaxies like Ultra/Luminous Infrared Galaxies (U/LIRGs) and the for normal star-forming galaxies like the Milky Way (Bolatto et al., 2013). Blue solid, dashed, dotted lines indicate the predicted for each AGNs assuming , 3.1, and 4.2 , respectively. Considering typical from previous AGN observations (Shangguan et al., 2020b), the upper limits of from CO =1–0 luminosities are lower than for most targets (figure 3 left).
3.2 Averaged CO (1–0) spectrum
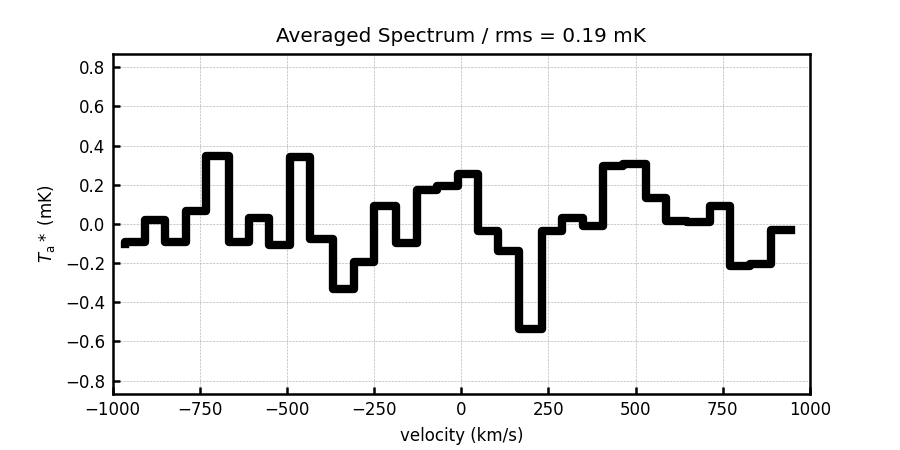
Figure 4 shows stacked (averaged by considering 1/rms weights) spectrum of ten targets. All ten spectra were re-sampled to the frequency resolution of 5 MHz after converting the sky frequency frame into the same rest-frequency frame by using their optical redshift. Then we stacked 10 spectra without correcting the observed intensities according to the distances to galaxies. The averaged spectrum is binned with 60 km s-1 velocity resolution. Additional baseline subtraction was done with a first-order polynomial function toward velocity averaged spectrum. While the averaged spectrum achieved the rms noise level of 0.19 mK and three channels around the systematic velocity have positive values, the robust detection was not confirmed (no channel with the S/N). We note that optical and CO-based redshifts of the same target could be shifted from each other. If the shifts in our targets are severe, this averaged spectrum may not imply faint CO in our targets. Therefore, we do not further discuss the non-detections in the stacked spectrum.
4 Discussion
Zhuang et al. (2021) demonstrated that equation 1 can provide fairly good molecular gas estimates with a scatter of dex using nearby () AGNs in which CO emissions were detected in literature. In this project, we try to confirm that this method works for very luminous AGNs with in the relatively higher-z universe (). However, Nobeyama 45-m CO (1–0) non-detections show that equation 1 may overestimate the molecular gas mass in our targets. We investigate four possible reasons for this inconsistency.
First, we investigate the possible overestimation of the nebular values of our targets. The attenuation of our targets are mag, due to their extremely high H/H ratios of 11–15, according to Liu et al. (2019). The Balmer decrement may be significantly affected by the stellar absorption, which is difficult to be measured in type 1 AGNs due to the broad emission lines. We use equation 2 of Groves et al. (2012) to estimate the stellar absorption in H and H, assuming galaxy color () for the typical starburst galaxies. Using equivalent widths (EWs) measured by Liu et al. (2019), the Balmer decrements become mean (85%) H/H. If we apply for normal star-forming galaxies, H/H. Even in the latter conservative case, in our targets. Therefore, the calculated in literature might be significantly overestimated. If this correction is true, then the Nobeyama 45-m non-detections are naturally explained. In addition, we estimated the stellar absorption () based on UV-optical-IR spectral energy distribution (SED) fitting (Yesuf et al. in prep.), showing that the typical value is mag in our Nobeyama 45-m targets. Although nebular mag and mag is not physically impossible, it would be unusual. If we use the value instead, the newly predicted molecular gas mass by equation (Yesuf & Ho, 2019) becomes mostly (figure 3 right). Therefore, the inconsistency between the CO (1–0) non-detection and the predicted is likely due to overestimated values resulting from the lack of stellar absorption correction.
The second hypothes is that the equation 1 may not work for objects with extreme nebular extinction ( mag), which assumes mag is true. The calibration sample of nearby star-forming galaxies in Yesuf & Ho (2019) only covers the range of from 0 – 3 mag. These literature AGNs have nebular mag and , with superscript and subscript showing the difference of 84th and 16th percentiles with the median. The largest values are mag and , respectively. These objects still are not as extreme as our targets observed here, i.e., in our targets. In addition, the measured may not trace the bulk of the cold gas in host galaxies if such extinction is from the central “compact” region. Using the high central in equation 1 of Yesuf & Ho (2019) leads to an overestimation of the host galaxy gas mass because the equation was derived using typical star-forming and quiescent galaxies in the xCOLDGASS survey; the AV values (within 1\farcs5 radius) of these galaxies are not extremely high. However, to prove this hypothesis, we need CO (1–0) observations deeper than Nobeyama 45-m to check the consistency between the nebular after stellar absorption correction and the based on SED fitting.
Another possible explanation of the inconsistency between measured by CO (1–0) and is the unusually large ; i.e., (K km s-1 pc2)-1. Such a large can be seen in the low metallicity environment (Bolatto et al., 2013). However, the large and high metallicity estimated from the mass-metallicity relation (table 1) seem to contradict the low metallicity environment scenario. This means that large may not be a feasible reason to explain the inconsistency between and .
Finally, we investigate the technical issues, i.e., Nobeyama 45-m beam efficiency for point sources. We have observed PG 1700+518 for the confirmation of the telescope setup. A factor of two difference in flux is found between our measurement ( K km s-1 pc-2) and that measured using IRAM-30m telescope ( K km s-1 pc-2) from Evans et al. (2009). However, as described in Appendix A, we had the best efforts to check the beam efficiency in each observation run. We confirmed that correct and conservative main beam efficiency is used in our analysis. Therefore CO non-detections are not likely due to technical issues.
5 Summary
We observed CO (1–0) in ten luminous type 1 AGNs by the Nobeyama 45-m telescope. While a rich molecular gas reservoir is predicted from nebular dust extinction in literature, we do not detect CO (1–0) emission in any of our targets. The inconsistency between prediction and observation may be due to overestimation of in the literature. Our results suggest that direct observation of molecular gas using “CO” is still necessary to understand the relationship between very luminous () AGN and molecular gas in the host galaxy.
T.M. and H.K. appreciate support from NAOJ ALMA Scientific Research Grant Number 2021-17A and 2020-15A, respectively. T.M. is supported by JSPS KAKENHI grant No. JP22K14073. M.-Y.Z. and L.C.H acknowledge support from the National Science Foundation of China (11721303, 11991052, 12192220, and 12192222) and the China Manned Space Project (CMS-CSST-2021-A04 and CMS-CSST-2021-A06). H.Y. was supported by JSPS KAKENHI Grant Number JP22K14072 and the Research Fund for International Young Scientists of NSFC (11950410492).
Appendix A PG 1700+518 and IRC +10216
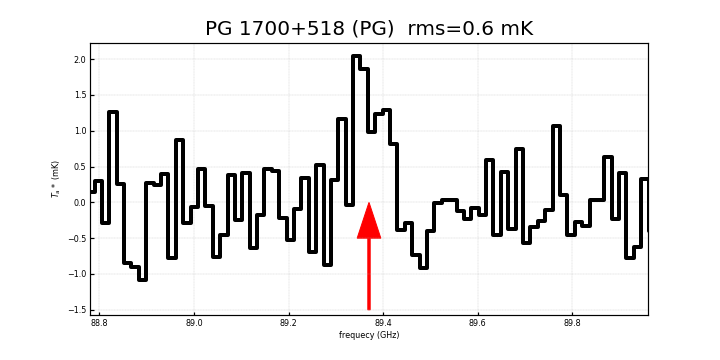
We observed PG 1700+518 to confirm that our observation setups were correct. In PG 1700+518, CO (1–0) was detected by IRAM 30m telescope at 89.370 GHz (z=0.290) with the CO (1–0) luminosity of K km s-1 pc-2 (Evans et al., 2009). Figure 5 is the spectrum obtained by us during this project, showing that CO (1–0) emission is detected at the same frequency of 89.370 GHz. The spectrum shows that peak antenna temperature is 2 mK, the rms noise level is mK, and velocity width is FWHM=270 km s-1 (This FWHM is consistent with the measurements by IRAM 30m). The integrated intensity is K km s-1 in the unit of antennae temperature. Assuming , the corresponding CO (1–0) luminosity is K km s-1 pc-2. This Nobeyama 45-m measurement is of the value measured by IRAM 30m, which possibly suggests that the main beam efficiency is less than .
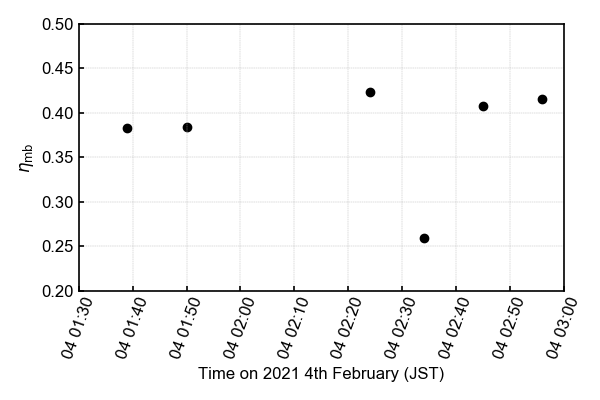
While was measured by the standard source IRC +10216 during the observation, it significantly depends on the wind due to unstable pointing accuracy. In order to demonstrate how stable the beam efficiency is during the observation after pointing calibration, we observed IRC +10216 when the wind is constantly strong ( m s-1) on 4th February 2021 (We did not observe science targets due to strong wind). Figure 6 shows the time variation of for 90 min without pointing calibration. The typical value of is smaller than (due to bad pointing accuracy). While the efficiency was sometimes very small probably due to sudden strong winds, the efficiency is stable after the unexpected event. During the observation run for science targets, we performed pointing calibration every 30 or 60 min and the wind velocity is basically m s-1. We conclude that smaller main beam efficiency is not the main reason for the inconsistency between Nobeyama 45-m telescope and IRAM 30m telescope. We use when we investigate the upper limit of CO luminosity in this paper.
References
- Bolatto et al. (2013) Bolatto, A. D., Wolfire, M., & Leroy, A. K. 2013, ARA&A, 51, 207
- Evans et al. (2009) Evans, A. S., Hines, D. C., Barthel, P., et al. 2009, AJ, 138, 262
- Fabian (2012) Fabian, A. C. 2012, ARA&A, 50, 455
- Groves et al. (2012) Groves, B., Brinchmann, J., & Walcher, C. J. 2012, MNRAS, 419, 1402
- Hainline et al. (2004) Hainline, L. J., Scoville, N. Z., Yun, M. S., et al. 2004, ApJ, 609, 61
- Husemann et al. (2017) Husemann, B., Davis, T. A., Jahnke, K., et al. 2017, MNRAS, 470, 1570
- Jarvis et al. (2020) Jarvis, M. E., Harrison, C. M., Mainieri, V., et al. 2020, MNRAS, 498, 1560
- Kamazaki et al. (2012) Kamazaki, T., Okumura, S. K., Chikada, Y., et al. 2012, PASJ, 64, 29
- Kewley & Ellison (2008) Kewley, L. J. & Ellison, S. L. 2008, ApJ, 681, 1183
- Koss et al. (2021) Koss, M. J., Strittmatter, B., Lamperti, I., et al. 2021, ApJS, 252, 29
- Kuno et al. (2011) Kuno, N., Takano, S., Iono, D., et al. 2011, in 2011 XXXth URSI General Assembly and Scientific Symposium, 1–4
- Liu et al. (2019) Liu, H.-Y., Liu, W.-J., Dong, X.-B., et al. 2019, ApJS, 243, 21
- Maiolino et al. (2017) Maiolino, R., Russell, H. R., Fabian, A. C., et al. 2017, Nature, 544, 202
- Minamidani et al. (2016) Minamidani, T., Nishimura, A., Miyamoto, Y., et al. 2016, in Society of Photo-Optical Instrumentation Engineers (SPIE) Conference Series, Vol. 9914, Millimeter, Submillimeter, and Far-Infrared Detectors and Instrumentation for Astronomy VIII, ed. W. S. Holland & J. Zmuidzinas, 99141Z
- Shangguan et al. (2020a) Shangguan, J., Ho, L. C., Bauer, F. E., Wang, R., & Treister, E. 2020a, ApJ, 899, 112
- Shangguan et al. (2020b) Shangguan, J., Ho, L. C., Bauer, F. E., Wang, R., & Treister, E. 2020b, ApJS, 247, 15
- Tremonti et al. (2004) Tremonti, C. A., Heckman, T. M., Kauffmann, G., et al. 2004, ApJ, 613, 898
- Yesuf & Ho (2019) Yesuf, H. M. & Ho, L. C. 2019, ApJ, 884, 177
- Yesuf & Ho (2020a) Yesuf, H. M. & Ho, L. C. 2020a, ApJ, 901, 42
- Yesuf & Ho (2020b) Yesuf, H. M. & Ho, L. C. 2020b, ApJ, 900, 107
- York et al. (2000) York, D. G., Adelman, J., Anderson, Jr., J. E., et al. 2000, AJ, 120, 1579
- Zhuang & Ho (2020) Zhuang, M.-Y. & Ho, L. C. 2020, ApJ, 896, 108
- Zhuang et al. (2021) Zhuang, M.-Y., Ho, L. C., & Shangguan, J. 2021, ApJ, 906, 38