Nara Institute of Science and Technology, Japan
11email: {gu.yi.gu4,otake,yoshi}@is.naist.jp 22institutetext: CentraleSupélec, Université Paris-Saclay, France 33institutetext: Department of Orthopaedics, Osaka University Graduate School of Medicine, Japan 44institutetext: Department of Bone and Joint Surgery,
Ehime University Graduate School of Medicine, Japan 55institutetext: Department of Orthopaedic Medical Engineering,
Osaka University Graduate School of Medicine, Japan
MSKdeX: Musculoskeletal (MSK) decomposition from an X-ray image for fine-grained estimation of lean muscle mass and muscle volume
Abstract
Musculoskeletal diseases such as sarcopenia and osteoporosis are major obstacles to health during aging. Although dual-energy X-ray absorptiometry (DXA) and computed tomography (CT) can be used to evaluate musculoskeletal conditions, frequent monitoring is difficult due to the cost and accessibility (as well as high radiation exposure in the case of CT). We propose a method (named MSKdeX) to estimate fine-grained muscle properties from a plain X-ray image, a low-cost, low-radiation, and highly accessible imaging modality, through musculoskeletal decomposition leveraging fine-grained segmentation in CT. We train a multi-channel quantitative image translation model to decompose an X-ray image into projections of CT of individual muscles to infer the lean muscle mass and muscle volume. We propose the object-wise intensity-sum loss, a simple yet surprisingly effective metric invariant to muscle deformation and projection direction, utilizing information in CT and X-ray images collected from the same patient. While our method is basically an unpaired image-to-image translation, we also exploit the nature of the bone’s rigidity, which provides the paired data through 2D-3D rigid registration, adding strong pixel-wise supervision in unpaired training. Through the evaluation using a 539-patient dataset, we showed that the proposed method significantly outperformed conventional methods. The average Pearson correlation coefficient between the predicted and CT-derived ground truth metrics was increased from 0.460 to 0.863. We believe our method opened up a new musculoskeletal diagnosis method and has the potential to be extended to broader applications in multi-channel quantitative image translation tasks.
Keywords:
Muscles Radiography Generative adversarial networks (GAN). Sarcopenia Image-to-image translation
1 Introduction
Sarcopenia is a prevalent musculoskeletal disease characterized by the inevitable loss of skeletal muscle, causing increased risks of all-cause mortality and disability that result in heavy healthcare costs [1, 2, 3, 4, 6, 5]. Measuring body composition, such as lean muscle mass (excluding fat contents), is essential for diagnosing musculoskeletal diseases, where dual-energy X-ray absorptiometry (DXA) [7, 8] and computed tomography (CT) [9, 10, 11] are often used. However, DXA and CT require special equipment that is much less accessible in a small clinic. Furthermore, CT requires high radiation exposure, and DXA allows the measurement of only overall body composition, which lacks details in individual muscles such as the iliacus muscle, which overlays with the gluteus maximus muscle in DXA images. Although several recent works used X-ray images for bone mineral density (BMD) estimation and osteoporosis diagnosis [12, 13, 14, 15], only a few works estimated muscle metrics and sarcopenia diagnosis [16, 17], and the deep learning technology used is old. Recently, BMD-GAN [15] was proposed for estimating BMD through X-ray image decomposition using X-ray and CT images aligned by 2D-3D registration. However, they did not target muscles. Nakanishi et al. [17] proposed an X-ray image decomposition for individual muscles. However, they calculated only the affected and unaffected muscle volumes ratio without considering the absolute volume and lean mass, which is more relevant to sarcopenia diagnosis.
In this study, we propose MSKdeX: Musculoskeletal (MSK) decomposition from a plain X-ray image for the fine-grained estimation of lean muscle mass and volume of each individual muscle, which are useful metrics for evaluating muscle diseases including sarcopenia. Fig. 1 illustrates the meaning of our fine-grained muscle analysis and its challenges. The contribution of this paper is three-fold: 1) proposal of the object-wise intensity-sum (OWIS) loss, a simple yet effective metric invariant to muscle deformation and projection direction, for quantitative learning of the absolute volume and lean mass of the muscles, 2) proposal of partially aligned training utilizing the aligned (paired) dataset for the rigid object for the pixel-wise supervision in an unpaired image translation task, 3) extensive evaluation of the performance using a 539-patient dataset.
2 Method
2.1 Dataset preparation
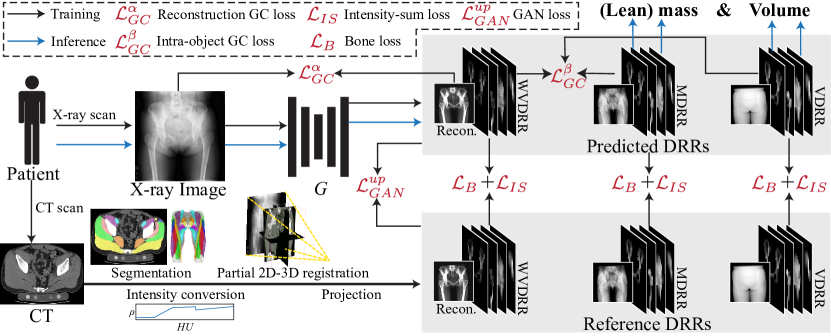
Fig. 2 illustrates the overview of the proposed MSKdeX. We collected a dataset of 552 patients subject to the total hip arthroplasty surgery (455 females and 97 males, height 156.9 8.3 cm, weight 57.5 11.9 kg, BMI 23.294 3.951 [mean std]). Ethical approval was obtained from the Institutional Review Boards of the institutions participating in this study (IRB approval numbers: 15056-3 for Osaka University and 2019-M-6 for Nara Institute of Science and Technology). We acquired a pair of pre-operative X-ray and CT images from each patient, assuming consistency in bone shape, lean muscle mass, and muscle volume. Automated segmentation of individual bones and muscles was obtained from CT [18]. Three different intensity conversions were applied to the segmented CT; 1) the original intensity, 2) intensity of 1.0 for voxels inside the structure and 0.0 for voxels outside to estimate muscle volume, 3) intensity corresponding to the lean muscle mass density based on a conversion function from the Hounsfield unit (HU) to the mass density [19, 20] to estimate lean muscle mass. Following [19], we assumed the voxels with less than -30 HU consisted of the fat, more than +30 HU consisted of the lean muscle, and the voxels in between -30 to +30 HU contained the fat and lean muscle with the ratio depending on linear interpolation of the HU value. The mass of the lean muscle was calculated by the conversion function proposed in [20]. Then, object-wise DRRs for the three conversions were generated for each segmented individual object (bone/muscle) region. (Note: When we refer to a DRR in this paper, it is object-wise.) We call the three types of the DRRs weighted volume DRR (WVDRR), volume DRR (VDRR), and mass DRR (MDRR). The intensity sum of VDRR and MDRR amounts to each object’s muscle volume () and lean muscle mass (), respectively. (Note: “Muscle volume” includes the fat in addition to lean muscle.) The summation of all the objects of WVDRRs becomes an image with a contrast similar to the real X-ray image used to calculate the reconstruction gradient correlation (GC) loss [17, 22]. A 2D-3D registration [21] of each bone between CT and X-ray image of the same patient was performed to obtain its DRR aligned with the X-ray image, which is used in the proposed partially aligned training.
Since muscles deform depending on the joint angle, they are not aligned. Instead, we exploited the invariant property of muscles using the newly proposed intensity-sum loss.
2.2 Model training
We train a decomposition model to decompose an X-ray image into the to infer the lean muscle mass and muscle volume, adopting CycleGAN [23]. The model backbone is replaced with HRNet [24]. The GAN loss we use is formulated in supplemental materials.
2.2.1 Structural consistency.
We call the summation of a DRR over all the channels (objects) the virtual X-ray image defined as , where is the -th object image of a DRR. We applies reconstruction GC loss [17] defined as
| (1) |
to maintain the structure consistency between an X-ray image and decomposed DRR, where is the decomposed WVDRR. However, we do not apply reconstruction GC loss for VDRR and MDRR because of lacking attenuation coefficient information. Instead, we propose inter-DRR/intra-object GC loss defined as
| (2) |
to chain the structural constraints from WVDRR to VDRR and MDRR, where the , , and are -th object image of the decomposed WVDRR, VDRR, and MDRR, respectively. The operator stops the gradient from being back-propagated in which the decomposed VDRR and MDRR are expected to be structurally closer to WVDRR (not vice-versa) to stabilize training. Thus, our structural consistency constant is defined as where the balances the two GC losses.
2.2.2 Intensity sum consistency.
Unlike general images, our DRRs embedded specific information so that the intensity sum represents physical metrics (mass and volume). Furthermore, the conventional method did not utilize the paired information of an X-ray image and DRR (obtained from the same patient). We took advantage of the paired information, proposing the object-wise intensity-sum loss, a simple yet effective metric invariant to patient pose and projection direction, for quantitative learning. The OWIS loss is defined as:
| (3) |
where and are the -th object image of DRR and the intensity summation operator (sum over the intensity of an image), respectively. The and are the image height and weight, respectively, served as temperatures for numeric stabilizability. The intensity consistency objective is defined as .
2.2.3 Partially aligned training.
A previous study [15] suggested that supervision by the aligned (paired) data can improve the quantitative translation. Therefore, we incorporated 2D-3D registration [21] to align the pelvis and femur DRRs with the paired X-ray images for partially aligned training to improve overall performance, including muscle metrics estimation. We applied and GC loss to maintain quantitative and structural consistencies, respectively. However, we preclude using GAN loss and feature matching loss to avoid the training burden by additional discriminators. The paired bone loss for a DRR is defined as
| (4) |
where the is a set of indexes containing aligned bone indexes. The is the size of the set . The tries to balance structural faithfulness and quantitative accuracy. The objective of partially aligned pixel-wise learning is defined as .
2.2.4 Full objective
The full objective, aiming for realistic decomposition while maintaining structural faithfulness and quantitative accuracy, is defined as
| (5) |
where the re-weights the penalty on the proposed OWIS loss.
3 Experiments and Results
The automatic segmentation results of 552 CTs were visually verified, and 13 cases with severe segmentation failures were omitted from our analysis, resulting in 539 CTs. Four-fold cross-validation was performed, i.e., 404 or 405 training data and 134 or 135 test data per fold. The baseline of our experiment was the vanilla CycleGAN with the reconstruction GC loss proposed in [17]. We evaluated the predicted lean muscle mass and volume using the ground truth derived from 3D CT images with three metrics, Pearson correlation coefficient (PCC), intra-class correlation coefficient (ICC), and mean absolute error (MAE). Additionally, we evaluated the image quality of predicted DRRs of the bones by comparing them with the aligned DRRs using peak-signal-noise-ratio (PSNR) and structural similarity index measure (SSIM). Implementation details are described in supplemental materials.
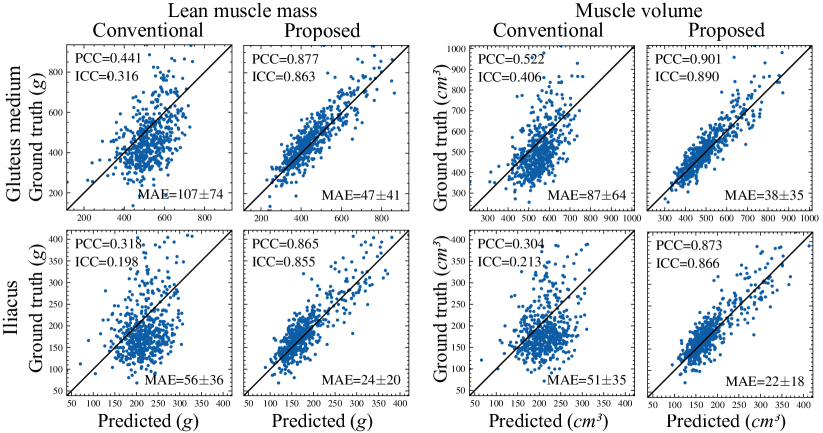
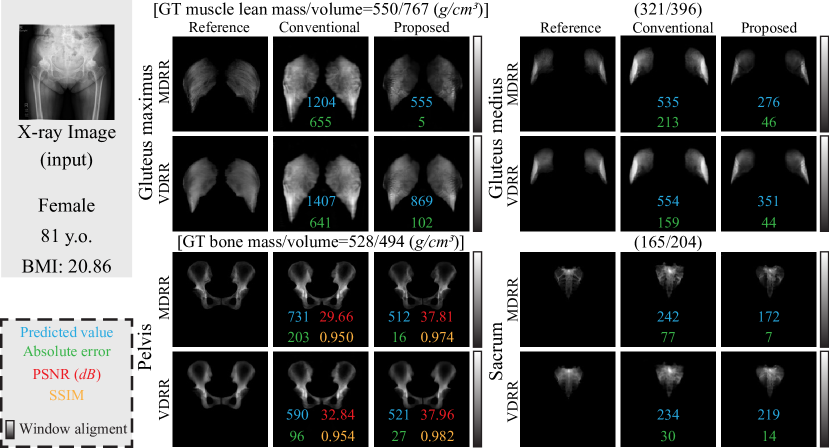
Fig. 3 shows the prediction results on the gluteus medius and iliacus muscles. The conventional method (without using the intensity constraints) resulted in low PCCs of 0.441 and 0.522 for the lean muscle mass and muscle volume estimations, respectively, for the gluteus medius, and 0.318 and 0.304, respectively, for the iliacus. Significant improvements by the proposed method were observed, achieving high PCCs of 0.877 and 0.901 of the lean muscle mass and muscle volume estimations, respectively, for the gluteus medius, and 0.865 and 0.873, respectively, for the iliacus. Fig. 4 visualized the decomposed VDRR and MDRR of four objects of a representative case. Our method (MSKdeX) reduced the hallucinating features in the decomposed DRRs by the proposed losses. The overall intensity of the conventional method was clearly different from the reference, while the proposed method decomposed the X-ray image considering the structural faithfulness and quantitative accuracy, outperforming the conventional method significantly. Table 1 shows evaluation for other objects. Statistical test (one-way ANOVA) was performed on the conventional and proposed methods using prediction absolute error, where the differences are significant () for all the objects. More detailed results and a visualization video can be found in supplemental materials.
3.0.1 Ablation study.
We performed ablation studies to investigate the impact of proposed OWIS loss and the use of aligned bones using 404 training and 135 test data. The re-weighting parameter of 0, 10, and 1000 with and without the partially aligned training was tested. The of 0 without partially aligned training [ (False)] is considered our baseline. The results of the ablation study were summarized in Table 2, where the bold font indicated the best setting in a column. We observed significant improvements from the baseline by both proposed features, OWIS loss and partially aligned training .
The average PCC for the muscles was improved from 0.457 to 0.826 by adding the OWIS loss () and to 0.796 by adding the bone loss, while their combination achieved the best average PCC of 0.855, demonstrating the superior ability of quantitative learning of the proposed MSKdeX. The results also suggested that the weight balance for loss terms needs to be made to achieve the best performance. More detailed results are shown in supplemental materials.
| Lean muscle mass and Bone mass estimation accuracy (PCC) | |||||||||
| Method | Glu. max. | Glu. med. | Glu. min. | Ilia. | Obt. ext. | Pec. | Pelv. | Sac. | |
| Conv. | .417 | .441 | .415 | .318 | .416 | .457 | .612 | .478 | |
| Prop. | .831 | .877 | .864 | .865 | .825 | .832 | .950 | .878 | |
| Muscle volume and bone volume estimation accuracy (PCC) | |||||||||
| Method | Glu. max. | Glu. med. | Glu. min. | Ilia. | Obt. ext. | Pec. | Pelv. | Sac. | |
| Conv. | .490 | .522 | .463 | .304 | .402 | .460 | .586 | .538 | |
| Prop. | .882 | .901 | .890 | .873 | .864 | .849 | .956 | .873 | |
| Bone decomposition accuracy [mean PSNR(mean SSIM)] | |||||||||
| Method | MDRR Pelv., Fem. | VDRR Pelv., Fem. | MVDRR Pelv., Fem. | ||||||
| Conv. | 31.5(.940), 31.7(.962) | 31.7(.940), 32.4(.963) | 34.5(.956), 31.6(.971) | ||||||
| Prop. | 37.1(.978), 37.8(.987) | 37.7(.982), 39.5(.991) | 39.0(.980), 37.1(.987) | ||||||
4 Summary
We proposed MSKdeX, a method for fine-grained estimation of the lean muscle mass and volume from a plain X-ray image (2D) through the musculoskeletal decomposition, which, in fact, recovers CT (3D) information. Our method decomposes an X-ray image into DRRs of objects to infer the lean muscle mass and volume considering the structural faithfulness (by the gradient correlation loss chain) and quantitative accuracy (by the object-wise intensity-sum loss and aligned bones training), outperforming the conventional method by a large margin as shown in Sec. 3. The results suggested a high potential of MSKdeX for opportunistic screening of musculoskeletal diseases in routine clinical practice, providing a new approach to accurately monitoring musculoskeletal health. The aligned bone DRRs positively affected the quantification of the density and volume of the muscles as shown in the ablation study in Sec. 3.0.1, implying the deep connection between muscles and bones. The prediction of muscles overlapped with the pelvis in the X-ray image can leverage the strong pixel-wise supervision by the aligned pelvis’s DRR, which can be considered as a type of calibration. Our future works are the validation with a large-scale dataset and extension to the decomposition into a larger number of objects.
| With | Lean muscle mass and bone mass estimation accuracy (PCC) | ||||||||
|---|---|---|---|---|---|---|---|---|---|
| Glu. max. | Glu. med. | Glu. min. | Ilia. | Obt. ext. | Pec. | Pelv. | Sac. | ||
| 0 | (False) | .415 | .419 | .469 | .368 | .473 | .600 | .542 | .265 |
| 0 | (True) | .734 | .799 | .788 | .855 | .784 | .813 | .954 | .798 |
| 100 | (False) | .799 | .815 | .829 | .854 | .815 | .842 | .925 | .774 |
| 100 | (True) | .854 | .857 | .837 | .883 | .854 | .846 | .947 | .898 |
| 1000 | (False) | .798 | .765 | .770 | .839 | .704 | .840 | .870 | .767 |
| 1000 | (True) | .795 | .776 | .767 | .828 | .748 | .820 | .929 | .745 |
4.0.1 Acknowledgement.
The research in this paper was funded by
MEXT/JSPS KAKENHI (19H01176, 20H04550, 21K16655).
4.0.2 Code availability.
The code is available from the authors ({gu.yi.gu4,otake, yoshi}@is.naist.jp) upon reasonable request for research activity.
References
- [1] Kitamura, A., Seino, S., Takumi, A., et al.: Sarcopenia: prevalence, associated factors, and the risk of mortality and disability in Japanese older adults. J. Cachexia Sarcopenia Muscle 12(1), 30–38 (2021). \doi10.1002/jcsm.12651
- [2] Chen, L.-K., Lee, W.-J., Peng, L.-N., Liu, L.-K., et al.: Recent advances in sarcopenia research in Asia: 2016 update from the Asian Working Group for Sarcopenia. JAMDA 17(8), 767.e1–767.e7 (2016). \doi10.1016/j.jamda.2016.05.016
- [3] Marzetti, E., Calvani, R., Tosato, M., Cesari, M., et al.: Sacopenia: an overview. Aging Clin. Exp. Re. 29. 11–17 (2017). \doi10.1007/s40520-016-0704-5
- [4] Petermann-Rocha, F., Balntze, V., Gray, S. R., et al.: Global prevalence of sarcopenia and severe sarcopenia: a systematic review and meta-analysis. J. Cachexia, Sarcopenia Muscle 13(1), 86–99 (2022). \doi10.1002/jcsm.12783
- [5] Shu, X., Lin, T., Wang, H., Zhao, Y., et al.: Diagnosis, prevalence, and mortality of sarcopenia in dialysis patients: a systematic review and meta-analysis. J. Cachexia, Sarcopenia Muscle 13(1), 145–158 (2022). \doi10.1002/jcsm.12890
- [6] Edwards, M. H., Dennision, E. M., Sayer, A. A., et al.: Osteoporosis and sarcopenia in older age. Bone 80, 126–130 (2015). \doi10.1016/j.bone.2015.04.016
- [7] Shepherd, J., Ng, B., Sommer, M., and Heymsfield, S. B.: Body composition by DXA. Bone 104, 101–105 (2017). \doi10.1016/j.bone.2017.06.010
- [8] Nana, A., Slater, G. J., Stewart, A. D., and Burke, L. M.: Methodology review: using dual-energy X-ray absorptiometry (DXA) for the assessment of body composition in athletes and active people. Int. J. Sport Nutr. Exerc. Metab. 25(2), 198–215 (2015). \doi10.1123/ijsnem.2013-0228
- [9] Feliciano, E. M. C., Pouri, K., Cobzas, D., Baracos, V. E., Beg, M. F., Khan, A. D., Ma, C., et al.: Evaluation of automated computed tomography segmentation to assess body composition and mortality associations in cancer patients. J. Cachexia Sarcopenia Muscle 11(5), 1258–1269 (2020). \doi10.1002/jcsm.12573
- [10] Paris, M. T., Tandon, P., Heyland, D. K., et al.: Automated body composition analysis of clinically acquired computed tomography scans using neural networks. Clin. Nutr. 39(10), 3049–3055 (2020). \doi10.1016/j.clnu.2020.01.008
- [11] Ogawa, T., Takao, M., et al.: Validation study of the CT-based cross-sectional evaluation of muscular atrophy and fatty degeneration around the pelvis and the femur. J. Orthop. 25(1), 139–144 (2020). \doi10.1016/j.jos.2019.02.004
- [12] Hsieh, C.-I., Zheng, K., Lin, C., Mei, L., et al.: Automated bone mineral density prediction and fracture risk assessment using plain radiographs via deep learning. Nat. Communi. 12(1), 5472 (2021). \doi10.1038/s41467-021-25779-x
- [13] Wang, F., Zheng, K., Lu, Le., et al.: Lumbar bone mineral density estimation from chest X-ray images: Anatomy-aware attentive multi-ROI modeling. IEEE Trans. Med. Imaging. 42(1), 257–267 (2023). \doi10.1109/TMI.2022.3209648
- [14] Ho, C.-S., Chen, Y.-P., Fan, T.-Y., Kuo, C.-F., et al.: Application of deep learning neural network in predicting bone mineral density from plain X-ray radiography. Arch. Osteoporosis 16(1), 153 (2021). \doi10.1007/s11657-021-00985-8
- [15] Gu, Y., Otake, Y., Uemura, K., et al.: BMD-GAN: Bone mineral density estimation using X-ray image decomposition into projections of bone-segmented quantitative computed tomography using hierarchical learning. In: MICCAI 2022. vol. 13436, pp. 644–654. Springer, Cham (2022). \doi10.1007/978-3-031-16446-0_61
- [16] Ryu, J., Eom, S., Kim, H. C., Kim, C. O., Rhee, Y., You, S. C., Hong, N.: Chest X-ray-based opportunistic screening of sarcopenia using deep learning. J. Cachexia Sarcopenia Muscle 14(1), 418–428 (2023). \doi10.1002/jcsm.13144
- [17] Nakanishi, N., Otake, Y., Hiasa, Y., Gu, Y., Uemura, K., et al.: Decomposition of musculoskeletal structures from radiography using an improved CycleGAN framework, Sci. Rep. 13, 8482 (2023). \doi10.1038/s41598-023-35075-x
- [18] Hiasa, Y., Otake, Y., et al.: Automated muscle segmentation from clinical CT using Bayesian U-Net for personalized musculoskeletal modeling. IEEE Trans. Med. Imaging 39(4), 1030–1040 (2019). \doi10.1109/TMI.2019.2940555
- [19] Aubrey, J., Esfandiari, N., Baracos, V. E., Buteau, F. A., et al.: Measurement of skeletal muscle radiation attenuation and basis of its biological variation. Acta. Physiol. (Oxf.) 210(3), 489–497 (2014). \doi10.1111/apha.12224
- [20] Wilfried, S., Thomas, B., and Wolfgang, S.: Correlation between CT numbers and tissue parameters needed for Monte Carlo simulations of clinical dose distributions. Phys. Med. Biol. 45(2), 459. (2000). \doi10.1088/0031-9155/45/2/314
- [21] Otake, Y., et al.: Intraoperative image-based multiview 2D/3D registration for image-guided orthopaedic surgery: incorporation of fiducial-based C-arm tracking and GPU-acceleration. IEEE Trans. Med. Imaging 31(4), 948–962 (2012).
- [22] Hiasa, Y., Otake, Y., Takao, M., Matsumoka, T., et al.: Cross-modality image synthesis from unpaired data using CycleGAN. In: SASHIMI 2018. vol. 11037, pp 31–41, Springer, Cham (2018). \doi10.1007/978-3-030-00536-8_4
- [23] Zhu, J.-Y., Park. T., Isola, P. Efros, A. A.: Unpaired image-to-image translation using cycle-consistent adversarial networks. In: ICCV 2017, pp. 2242–2251 (2017)
- [24] Wang, J., Sun, K., Cheng, T., Jiang, B., Deng, C., Zhao, Y. Liu, D., Mu, Y., Tan, M., et al.: Deep high-resolution representation learning for visual recognition. IEEE TPAMI 43(10), 3349–3364 (2021). \doi10.1109/TPAMI.2020.2983686