Is the background evolution of CDM model consistent with observations?
Abstract
We establish a new and cosmological-model-independent method to explore the cosmic background dynamics in this work. Utilizing the latest Pantheon+ type Ia supernova sample and the Hubble parameter measurements, we obtain the values of the Hubble parameter and the deceleration parameter at five different redshift points ranging from 0.2 to 0.6, and find that they can deviate from the predictions of the CDM model at more than . We further probe the equation of state of dark energy and obtain that a slightly oscillating equation of state of dark energy around the line is favored.
1 Introduction
The cosmological constant plus cold dark matter (CDM) is the simplest and most favored cosmological model to describe the cosmic evolution. The CDM model, although fits observational data very well, still faces some challenges. Among them, the Hubble constant () tension is the most notable one and it has been considered as the most serious crisis in modern cosmology (Riess, 2020; Perivolaropoulos & Skara, 2022). The tension refers to the discrepancy (more than 5) between the measurements of using the near type Ia supernova (SN Ia) calibrated by Cepheids (Riess et al., 2022) and that from the high-redshift cosmic microwave background (CMB) radiation observation within the framework of the CDM model (Planck Collaboration, 2020), and it indicates that the assumed CDM model used to determine the Hubble constant may be inconsistent with our present Universe or there may be potentially unknown systematic errors in the observational data. It is worth noting, however, that any systematics, which could explain the tension, have not been found (Efstathiou, 2014; Feeney et al., 2018; Riess et al., 2016; Cardona et al., 2017; Zhang et al., 2017; Follin & Knox, 2018; Riess et al., 2018a, b). Thus, it is necessary to investigate whether the CDM model can correctly describe our Universe.
Since the cosmological constant as dark energy has a constant equation of state (EoS) parameter equal to , where is defined as with and being the pressure and energy density of dark energy, respectively. Generalizing the EoS of dark energy from to an arbitrary constant or a parametrized form as a function of redshift , e.g., the CPL parametrization (Chevallier & Polarski, 2001; Linder, 2003), and constraining or the coefficients in the parameterization from observational data, we can judge the viability of the cosmological constant as dark energy by analyzing whether is allowed by the observations. Although the CDM model has been found to be supported by the observations, the result will be unreliable if the EoS of dark energy is not a constant or the parametrized form of EoS is inappropriate.
Reconstructing the cosmic background evolution directly from the observations is a reliable method to understand the expanding history of our Universe. The usual methods include the nonparametric Bayesian reconstruction (Zhao et al., 2012, 2017) and the Gaussian process (Holsclaw et al., 2010; Seikel et al., 2012; Shafieloo et al., 2012). Using the observational data, e.g., SN Ia, one can reconstruct the Hubble parameter () or luminosity distance () with their derivatives, and then compare them with the predictions from the CDM model to determine whether the CDM model can correctly describe the cosmic evolution. However, since all observational data are used together to reconstruct the cosmic evolution, the low (high) redshift data will affect the reconstructed result of the high (low) redshift regions.
In this work, we establish a new method to obtain the cosmic background dynamics in different redshift regions from observational data. Our method does not assume the EoS of dark energy and any cosmological model. Using the Pantheon+ SN Ia and the Hubble parameter measurements, we obtain the values of the Hubble parameter and the deceleration parameter at different redshifts, and find that may be incompatible with the predictions of the CDM model at more than .
2 Method
For a homogeneous and isotropic Universe described by the Friedmann-Lemaître-Robertson-Walker metric, the Hubble parameter , which gives the cosmic expanding velocity, is defined as
| (1) |
where is the cosmic scale factor and the cosmic time. In the CDM model, the Hubble parameter has the form: with being the present dimensionless matter density parameter. Using the Hubble parameter, one can obtain the luminosity distance :
| (2) |
Comparing the theoretical value and the observational one of the luminosity distance can yield constraints on the cosmological parameters, i.e. , after choosing a concrete cosmological model. To cosmological-model-independently understand the cosmic dynamics, we perform the Taylor expansion of the Hubble parameter and the luminosity distance at a given redshift and then obtain:
| (3) |
and
| (4) | |||||
where , , and with being the cosmic deceleration parameter. Clearly, , and are constants. If we can determine their values from the observational data, the cosmic dynamics will be known. Since the convergence region of the Taylor series of the luminosity distance and the Hubble parameter is the near region around , we only consider the observational data in the redshift region to constrain , and , where represents the convergence radius. When , our method reduces to the usual cosmographic one, which has been widely used to study the cosmic expanding history (Visser, 2005; Luongo, 2011; Aviles et al., 2012; Dunsby & Luongo, 2016; Capozziello et al., 2019, 2020).
Once the constraints on and at a given redshift are obtained, we can calculate the EoS parameter of dark energy at that redshift
| (5) |
after assuming that the energy component of the Universe consists of pressureless matter and dark energy and the Universe is spatially flat.
3 Samples and Results
The latest Pantheon+ SN Ia sample (Scolnic et al., 2022) will be used firstly to constrain and . We choose , which is small enough to avoid the convergence problem in the Taylor series, and consider five redshift points () in redshift from 0.2 to 0.6 with an increment of 0.1. The number of SN Ia data in each redshift region is summarized in Table 1. Due to that the nearby SN Ia sample is strongly impacted by their peculiar velocities (Brout et al., 2022), we exclude those data whose redshift are less than 0.01 in our analysis. The redshift points at are not considered since the data number in the range are less than two hundred, which will not give tight constraints on the cosmological parameters.
| 0.2 | 0.3 | 0.4 | 0.5 | 0.6 | |
|---|---|---|---|---|---|
| Redshift range | |||||
| 1282 | 750 | 624 | 419 | 278 | |
| 12 | 16 | 12 | 11 | 10 | |
| 1294 | 766 | 636 | 430 | 288 |
Note. — Number of data in each redshift range. The , , and represent the number of SN Ia data, data, and the total data in each redshift range, respectively. The SN Ia data with redshift less than 0.01 are excluded here.
To estimate the best-fit values of the cosmological parameters and their uncertainties from SN Ia, we utilize the minimizing method:
| (6) |
Here the subscript ‘obs’ and ‘th’ refer to the observed and theoretical values, respectively, is the covariance matrix, which is a submatrix of the full SN Ia sample since only data within the range are used, and is a 1D array consisting of the SN Ia apparent magnitudes. The theoretical value of the apparent magnitude can be derived from the luminosity distance and the absolute magnitude :
| (7) |
Since the Hubble parameter is highly correlated with the absolute magnitude , we need to fix , which is set to satisfy a Gaussian prior: (Riess et al., 2022), when only the SN Ia data are used.
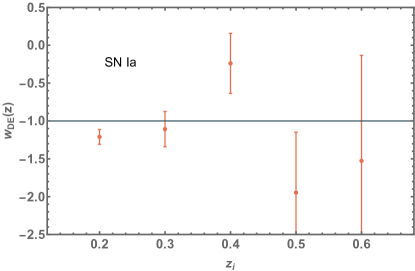
In Figure 1, we show the constraints on (Figure 1(a)) and (Figure 1(b)). The solid lines represent the evolutionary curves of and in the CDM model with and , which are obtained from the SN Ia sample with . To show the difference between and , and the predictions in the CDM model clearly, we also plot and . The corresponding numerical results are summarized in Table 2. It is easy to see that the values of at , and are consistent with the CDM model. But they deviate from the CDM model when and , and the deviation can reach about 1.4. For the deceleration parameter, the values at are different from the prediction of the CDM model, the largest deviation, which occurs at , is about . Furthermore, we find that at the SN Ia data support a decelerating expansion at more than . Using Eq. (5), we can derive the EoS parameter of dark energy at different redshifts () by considering the constraints on and . Setting and to be and , respectively, we obtain five values of , which are shown in Figure 2. We find that shows a slightly oscillating behavior around the line. The values of at exhibit discrepancy from , and the maximum statistical deviation is about , which occurs at .
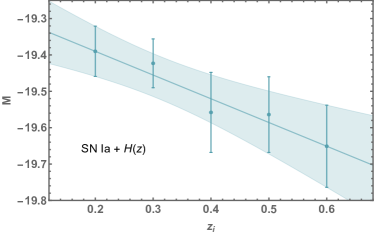
A prior fixed may introduce some unknown bias in the results. To avoid this issue, we add the Hubble parameter measurements (Simon et al., 2005; Stern et al., 2010; Moresco et al., 2012; Cong et al., 2014; Moresco, 2015; Moresco et al., 2016; Ratsimbazafy et al., 2017; Borghi et al., 2022) into our analysis. Thus, can be treated as a free parameter. The number of data in different redshift ranges is listed in Table 1. The results from SN Ia+ are shown in Table 3 and Figure 3. While Figure 3(a) and 3(b), respectively, represent , and the predicted and from the CDM model with and , which are determined from the data. Figure 3(a) indicates that the values of are consistent with the CDM model at 1 CL, which is different from the results from the SN Ia data only. While, the values of at , and deviate from the prediction of the CDM model and the largest deviation is about . At , SN Ia+ favor a decelerating expansion since is supported at more than . These results are almost the same as what are obtained from the SN Ia data only. Figure 4 shows the values of , from which, we find that decreases almost linearly with the increase of redshift. To illustrate clearly this trend, we use a simple linear function: to fit the evolution of between and , and obtain and . Apparently, is well consistent with that obtained from the Cepheid host () (Riess et al., 2022). The slope deviates from zero at about , which indicates the observations seem to favor a non-constant absolute magnitude of SN Ia.
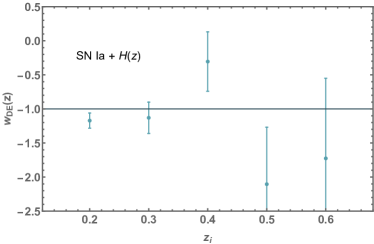
Figure 5 shows the values of after setting and . One can see that oscillates slightly around the line and the maximum deviation from of occurs at and is at about , which is similar to the results from the SN Ia data only.
Note. — The marginalized mean value and the 1 uncertainty of parameters from the SN Ia data. The is set to be . denotes the difference between the constraint results and the CDM model with and .
| … | ||||
| … | ||||
| … | ||||
| … | ||||
| … | ||||
| … |
Note. — The marginalized mean value and the 1 uncertainty of parameters from data. denotes the difference between the constraint results and the CDM model with and .
4 Conclusions
To determine whether the cosmic evolution is consistent with the predictions of the CDM model, we establish a new and cosmological-model-independent method to explore the cosmic dynamics from observational data. Using the Pantheon+ SN Ia data, we obtain the values of and at five different redshift points. We find that the deviation from the prediction of the CDM model is apparent and the largest deviation reaches . Further considering the Hubble parameter measurements, we discover that the values of can deviate from the predictions of the CDM model at about although become consistent with the CDM model, and a linearly decreasing absolute magnitude of SN Ia with the increase of redshift is favored. Furthermore, a slightly oscillating EoS of dark energy around is found. We think that this property of dark energy may alleviate the tension, and this issue is under current investigation.
References
- Aviles et al. (2012) Aviles, A., Gruber, C., Luongo, O., & Quevedo, H. 2012, Phys. Rev. D, 86, 123516
- Brout et al. (2022) Brout, D., Scolnic, D., Popovic, B., et al. 2022, ApJ, 938, 110
- Borghi et al. (2022) Borghi, N., Moresco, M., & Cimatti, A. 2022, ApJ, 928, L4
- Capozziello et al. (2019) Capozziello, S., D’Agostino, R., & Luongo, O. 2019, IJMPD, 28, 1930016
- Capozziello et al. (2020) Capozziello, S., D’Agostino, R., & Luongo, O. 2020, MNRAS, 494, 2576
- Cardona et al. (2017) Cardona, W., Kunz, M., & Pettorino, V. 2017, J. Cosmology Astropart. Phys, 03, 056
- Chevallier & Polarski (2001) Chevallier, M., & Polarski, D. 2001, IJMPD, 10, 213
- Cong et al. (2014) Cong, Z., Han, Z., Shuo, Y., et al. 2014, RAA, 14, 1221
- Dunsby & Luongo (2016) Dunsby, P. K. S., & Luongo, O. 2016, IJGMM, 13, 1630002
- Efstathiou (2014) Efstathiou, G. 2014, MNRAS, 400, 1138
- Feeney et al. (2018) Feeney, S. M., Mortlock, D. J., & Dalmasso, N. 2018, MNRAS, 476, 3861
- Follin & Knox (2018) Follin, B., & Knox, L. 2018, MNRAS, 477, 4534
- Holsclaw et al. (2010) Holsclaw, T., Alam, U., Sansó, B., et al. 2010, Phys. Rev. Lett., 105, 241302
- Linder (2003) Linder, E. V. 2003, Phys. Rev. Lett., 90, 091301
- Luongo (2011) Luongo, O. 2011, Mod. Phys. Lett. A, 26, 1459
- Moresco et al. (2012) Moresco, M., Cimatti, A., Jimenez, R., et al. 2012, J. Cosmology Astropart. Phys, 08, 006
- Moresco (2015) Moresco, M. 2015, MNRAS Lett., 450, L16
- Moresco et al. (2016) Moresco, M., Pozzetti, L., Cimatti, A., et al. 2016, J. Cosmology Astropart. Phys, 05, 014
- Perivolaropoulos & Skara (2022) Perivolaropoulos, L., & Skara, F. 2022, NewAR, 95, 101659
- Planck Collaboration (2020) Planck Collaboration. 2020, A&A, 641, A6
- Ratsimbazafy et al. (2017) Ratsimbazafy, A. L., Loubser, S. I., Crawford, S. M., et al. 2017, MNRAS, 467, 3239
- Riess et al. (2016) Riess, A. G., Macri, L. M., Hoffmann, S. L., et al. 2016, ApJ, 826, 56
- Riess et al. (2018a) Riess, A. G., Casertano, S., Yuan, W., et al. 2018a, ApJ, 855, 136
- Riess et al. (2018b) Riess, A. G., Casertano, S., Yuan, W., et al. 2018, ApJ, 861, 126
- Riess (2020) Riess, A. G. 2020, NatRP, 2, 10
- Riess et al. (2022) Riess, A. G., Yuan, W., Macri, L. M., et al. 2022, ApJ, 934, L7
- Scolnic et al. (2022) Scolnic, D., Brout, D., Carr, A., et al. 2022, ApJ, 938, 113
- Seikel et al. (2012) Seikel, M., Clarkson, C., & Smith, M. 2012, J. Cosmology Astropart. Phys, 06, 036
- Shafieloo et al. (2012) Shafieloo, A., Kim, A. G., Linder, E. V. 2012, Phys. Rev. D, 85, 123530
- Simon et al. (2005) Simon, J., Verde, L., & Jimenez, R. 2005, Phys. Rev. D, 71, 123001
- Stern et al. (2010) Stern, D., Jimenez, R., Verde, L., Kamionkowski, M., & Stanford, S. A. 2010, J. Cosmology Astropart. Phys, 02, 008
- Visser (2005) Visser, M. 2005, Gen. Relativ. Gravit., 37, 1541
- Zhang et al. (2017) Zhang, B. R., Childress, M. J., Davis, T. M., et al. 2017, MNRAS, 471, 2254
- Zhao et al. (2012) Zhao, G. B., Crittenden, R. G., Pogosian, L., & Zhang, X. 2012, Phys. Rev. Lett., 109, 171301
- Zhao et al. (2017) Zhao, G. B., Raveri, M., Pogosian, L., et al. 2017, Nat. Astron., 1, 627