thanks: cxyue@lnnu.edu.cnthanks: wangwanghan1106@163.comthanks: cxj225588@163.comthanks: wyq13889702166@163.com

Sensitivity of the future 𝒆𝒑superscript𝒆𝒑\bm{e^{-}p} collider to the coupling of axion-like particles with vector bosons

Chong-Xing Yue1,2    Han Wang1,2    Xue-Jia Cheng1,2    Yue-Qi Wang1,2 1Department of Physics, Liaoning Normal University, Dalian 116029, China
2Center for Theoretical and Experimental High Energy Physics, Liaoning Normal University, China
Abstract

Axion-like particles (ALPs) arise naturally in many extensions of the Standard Model (SM). We explore the discovery potential for ALPs of the Large Hadron electron Collider (LHeC) via the W+Wsuperscript𝑊superscript𝑊W^{+}W^{-} fusion process. For concreteness, both cases of the ALP decaying to muon pairs and bb¯𝑏¯𝑏b\overline{b} pairs are investigated. Our numerical results show that the LHeC with the center of mass energy of 1.31.31.3 TeV and the integrated luminosity of 111 ab-1 might be more sensitive than the LHC in probing ALPs over a range of masses from a few tens of GeV to 900900900 GeV, where the promising sensitivities to the coupling of ALP with W±superscript𝑊plus-or-minusW^{\pm} bosons reach nearly 0.150.150.15 TeV-1 and 0.320.320.32 TeV-1 for the signal processes epνeja(aμ+μ)superscript𝑒𝑝subscript𝜈𝑒𝑗𝑎𝑎superscript𝜇superscript𝜇e^{-}p\rightarrow\nu_{e}ja(a\rightarrow\mu^{+}\mu^{-}) and epνeja(abb¯)superscript𝑒𝑝subscript𝜈𝑒𝑗𝑎𝑎𝑏¯𝑏e^{-}p\rightarrow\nu_{e}ja(a\rightarrow b\overline{b}), respectively.

I Introduction

The Standard Model (SM) of particle physics has been proved to be remarkably successful, explaining almost all relevant data with a handful of parameters. However, there are many reasons to believe that the SM is not an ultimate theory of nature. For example, it can not solve the gauge hierarchy problem Feng (2013) and the strong CP problem Kim and Carosi (2010). The discrepancy between the SM prediction for the muon anomalous magnetic moment and the experimental result Lindner et al. (2018), as well as the problem of neutrino masses Gonzalez-Garcia and Maltoni (2008), can not be explained either. As a result, there are currently a number of areas where new physics beyond the SM (BSM) may exist. High energy collider experiments provide the primary tools to effectively search for BSM physics at the energy frontier. The lack of new physics at the LHC up to now compels new theoretical ideas to be developed and the exploration for complementarities of the pp𝑝𝑝pp machines with other potential future facilities. The Large Hadron electron Collider (LHeC) Abelleira Fernandez et al. (2012a, b); Bruening and Klein (2013); Agostini et al. (2021) has been proposed to complement the measurements at the LHC, which combines the superior performance of the pp𝑝𝑝pp and e+esuperscript𝑒superscript𝑒e^{+}e^{-} colliders. It yields the projected integrated luminosity of =absent\mathcal{L}= 111 ab-1 at the center of mass energy s=1.3𝑠1.3\sqrt{s}=1.3 TeV following the baseline energy of the 606060 GeV electron beam in cooperation with the 777 TeV proton beam. Due to the clean experimental environment and the prospects for the substantial extension of the kinematic range in deep inelastic scattering, the LHeC has the potential to find new physics. In fact, the axion-like particle (ALP, known as “a𝑎a”) is clearly an interesting BSM scenario that is worthy of being studied at the LHeC.

ALPs are pseudo-Nambu-Goldstone bosons, typically those induced by the spontaneous breaking of one or more global symmetries. These particles are independent of Peccei-Quinn mechanism and enjoy less model constraints than the QCD axion Peccei and Quinn (1977); Weinberg (1978); Wilczek (1978); Grilli di Cortona et al. (2016). They are CP-odd scalars and gauge-singlets under the SM, which are well motivated new physics candidates. The physics case of the ALP has been greatly developed in recent years, and the experimental landscape is rapidly evolving for exploring the accessible regions in the ALP parameter space. Whereas astrophysics and cosmology impose tight constraints on very light ALPs Raffelt (1990); Marsh (2016), the most powerful detections of such particles in the MeV-GeV range arise from experiments performing at the precision frontier Konaka et al. (1986); Abudinén et al. (2020); Altmannshofer et al. (2022). A variety of dedicated experiments have been proposed to probe heavier ALPs in terms of their masses and couplings. In addition to phenomenological studies of ALPs focusing on their interactions with gluons or fermions Brivio et al. (2017); Ghebretinsaea et al. (2022); Yue et al. (2022a), searches for the ALP coupled to the SM electroweak gauge bosons (γ𝛾\gamma, W±superscript𝑊plus-or-minusW^{\pm}, Z𝑍Z) are also available Baldenegro et al. (2018); Flórez et al. (2021); d’Enterria (2021); İnan and Kisselev (2020, 2021); Zhang et al. (2021); Yue et al. (2022b); Lu (2022); Bao et al. (2022); Han et al. (2022). The LHC and the future e+esuperscript𝑒superscript𝑒e^{+}e^{-} colliders have been used to detect the ALP via the photon-photon fusion process, as discussed extensively in Refs. Baldenegro et al. (2018); Flórez et al. (2021); d’Enterria (2021); İnan and Kisselev (2020, 2021); Zhang et al. (2021). The production of ALP could also be efficiently produced through the massive vector boson (W±superscript𝑊plus-or-minusW^{\pm}, Z𝑍Z) fusion processes in which the ALP decays into diphoton at the prospective e+esuperscript𝑒superscript𝑒e^{+}e^{-} and ep𝑒𝑝ep colliders Yue et al. (2022b); Lu (2022), as well as at the muon colliders Bao et al. (2022); Han et al. (2022). It is of great interest to detect the ALP at the future ep𝑒𝑝ep colliders. Inspired by previous studies, we implement in this work the investigation of the ALP at the LHeC with s=1.3𝑠1.3\sqrt{s}=1.3 TeV and =absent\mathcal{L}= 111 ab-1 through the W+Wsuperscript𝑊superscript𝑊W^{+}W^{-} fusion process, where the ALP decays to fermions.

The paper is structured as follows. After describing the theory framework in Sec. II, we provide a detailed analysis in Sec. III for the possibility of probing ALPs via the W+Wsuperscript𝑊superscript𝑊W^{+}W^{-} fusion processes epνeja(aμ+μ)superscript𝑒𝑝subscript𝜈𝑒𝑗𝑎𝑎superscript𝜇superscript𝜇e^{-}p\rightarrow\nu_{e}ja(a\rightarrow\mu^{+}\mu^{-}) and epνeja(abb¯)superscript𝑒𝑝subscript𝜈𝑒𝑗𝑎𝑎𝑏¯𝑏e^{-}p\rightarrow\nu_{e}ja(a\rightarrow b\overline{b}) based on the LHeC detector simulation. Our main results about the projected LHeC sensitivity region on the coupling of ALP with W±superscript𝑊plus-or-minusW^{\pm} bosons are summarized in Sec. IV, where we compare our results with those from the LHC.

II The theory framework

Generally, the couplings of ALP with the SM particles can be encoded in the following effective Lagrangian that includes operators with dimension up to five Georgi et al. (1986); Brivio et al. (2017); Bauer et al. (2017)

eff=12(μa)(μa)12ma2a2+μafaψ=QL,QR,LL,LRψ¯γμXψψCG~afaGμνiG~iμνCW~afaWμνiW~iμνCB~afaBμνB~μν,subscripteff12superscript𝜇𝑎subscript𝜇𝑎12superscriptsubscript𝑚𝑎2superscript𝑎2superscript𝜇𝑎subscript𝑓𝑎subscript𝜓subscript𝑄𝐿subscript𝑄𝑅subscript𝐿𝐿subscript𝐿𝑅¯𝜓subscript𝛾𝜇subscript𝑋𝜓𝜓subscript𝐶~𝐺𝑎subscript𝑓𝑎subscriptsuperscript𝐺𝑖𝜇𝜈superscript~𝐺𝑖𝜇𝜈subscript𝐶~𝑊𝑎subscript𝑓𝑎subscriptsuperscript𝑊𝑖𝜇𝜈superscript~𝑊𝑖𝜇𝜈subscript𝐶~𝐵𝑎subscript𝑓𝑎subscript𝐵𝜇𝜈superscript~𝐵𝜇𝜈,\displaystyle\begin{split}\mathcal{L}_{\text{eff}}=&\frac{1}{2}(\partial^{\mu}a)(\partial_{\mu}a)-\frac{1}{2}m_{a}^{2}a^{2}+\frac{\partial^{\mu}a}{f_{a}}\sum_{\begin{subarray}{c}\psi=Q_{L},\,Q_{R},\\ \,L_{L},\,L_{R}\end{subarray}}\bar{\psi}\gamma_{\mu}X_{\psi}\psi\\ &-C_{\tilde{G}}\frac{a}{f_{a}}G^{i}_{\mu\nu}\tilde{G}^{i\mu\nu}-C_{\tilde{W}}\frac{a}{f_{a}}W^{i}_{\mu\nu}\tilde{W}^{i\mu\nu}-C_{\tilde{B}}\frac{a}{f_{a}}B_{\mu\nu}\tilde{B}^{\mu\nu}\text{,}\end{split} (1)

where Gμνisubscriptsuperscript𝐺𝑖𝜇𝜈G^{i}_{\mu\nu}, Wμνisubscriptsuperscript𝑊𝑖𝜇𝜈W^{i}_{\mu\nu} and Bμνsubscript𝐵𝜇𝜈B_{\mu\nu} are respectively the SU(3)C𝑆𝑈subscript3𝐶SU(3)_{C}, SU(2)L𝑆𝑈subscript2𝐿SU(2)_{L} and U(1)Y𝑈subscript1𝑌U(1)_{Y} gauge field strengths, while G~iμνsuperscript~𝐺𝑖𝜇𝜈\tilde{G}^{i\mu\nu}, W~iμνsuperscript~𝑊𝑖𝜇𝜈\tilde{W}^{i\mu\nu} and B~μνsuperscript~𝐵𝜇𝜈\tilde{B}^{\mu\nu} are the corresponding dual field strengths which are defined as V~μν=12ϵμνλκVλκsuperscript~𝑉𝜇𝜈12superscriptitalic-ϵ𝜇𝜈𝜆𝜅subscript𝑉𝜆𝜅\tilde{V}^{\mu\nu}=\frac{1}{2}\epsilon^{\mu\nu\lambda\kappa}V_{\lambda\kappa} (VG(V\in G, W𝑊W, B)B). Xψsubscript𝑋𝜓X_{\psi} are 3×3333\times 3 Hermitian matrices in flavour space. The ALP mass masubscript𝑚𝑎m_{a} and the decay constant fasubscript𝑓𝑎f_{a} can be regarded as independent parameters.

Instead of a number of previous articles focusing on the decay channel aγγ𝑎𝛾𝛾a\rightarrow\gamma\gamma Yue et al. (2019); Liu and Yan (2023); Yue et al. (2022b); Wang et al. (2022); Lu (2022), we explore the possibility of probing ALP at the LHeC through the W+Wsuperscript𝑊superscript𝑊W^{+}W^{-} fusion process with ALP further decaying to fermions in this work. Then the case that ALP couples to W±superscript𝑊plus-or-minusW^{\pm} bosons and fermions should be considered. After electroweak symmetry breaking, the effective Lagrangian Eq.(1) can give the couplings of ALP to W±superscript𝑊plus-or-minusW^{\pm} bosons and fermions

effsubscripteff\displaystyle\mathcal{L}_{\text{eff }} superset-of\displaystyle\supset igaψaψ=Q,Lmψdiagψ¯γ5ψ14gaWWaWμνW~μν,𝑖subscript𝑔𝑎𝜓𝑎subscript𝜓𝑄𝐿subscriptsuperscript𝑚diag𝜓¯𝜓subscript𝛾5𝜓14subscript𝑔𝑎𝑊𝑊𝑎subscript𝑊𝜇𝜈superscript~𝑊𝜇𝜈,\displaystyle ig_{a\psi}a\sum_{\psi=Q,\,L}m^{\text{diag}}_{\psi}\,\bar{\psi}\gamma_{5}\psi-\dfrac{1}{4}g_{aWW}aW_{\mu\nu}\tilde{W}^{\mu\nu}\text{,} (2)

where the sum in the first term extends over all fermion mass eigenstates. gaψsubscript𝑔𝑎𝜓g_{a\psi} is the coupling coefficient for the effective ALP-fermion interaction and mψdiagsubscriptsuperscript𝑚diag𝜓m^{\text{diag}}_{\psi} is the fermion mass matrix. The interaction of ALP with W±superscript𝑊plus-or-minusW^{\pm} bosons comes from the contribution of the fifth term in Eq.(1). The coupling strength of such interaction is depicted by the coupling coefficient gaWW=4faCW~subscript𝑔𝑎𝑊𝑊4subscript𝑓𝑎subscript𝐶~𝑊g_{aWW}=\frac{4}{f_{a}}C_{\tilde{W}}. The model file with the Lagrangian is produced by FeynRules Alloul et al. (2014).

The flavor bounds of quark and lepton flavor-changing processes focusing on the MeV-GeV mass range of ALP in an effective field theory have been recently explored in Ref. Bauer et al. (2022). The most stringent upper limits on gaψsubscript𝑔𝑎𝜓g_{a\psi} at 909090%percent\% C.L. come from Beam Dump experiments for ALP with mass interval between 111 MeV and 333 GeV, which are (3.4×1052.9×1033.4superscript1052.9superscript1033.4\times 10^{-5}-2.9\times 10^{-3}) TeV-1 Bergsma et al. (1985); Dolan et al. (2015). The constraints on gaψsubscript𝑔𝑎𝜓g_{a\psi} are much looser in higher mass region of ALP.

Refer to caption
Refer to caption
Figure 1: Illustration of the Feynman diagrams for the W+Wsuperscript𝑊superscript𝑊W^{+}W^{-} fusion processes epνeja(aμ+μ)superscript𝑒𝑝subscript𝜈𝑒𝑗𝑎𝑎superscript𝜇superscript𝜇e^{-}p\rightarrow\nu_{e}ja(a\rightarrow\mu^{+}\mu^{-}) (a) and epνeja(abb¯)superscript𝑒𝑝subscript𝜈𝑒𝑗𝑎𝑎𝑏¯𝑏e^{-}p\rightarrow\nu_{e}ja(a\rightarrow b\overline{b}) (b) at the LHeC.

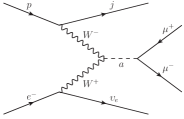
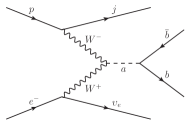
LHeC is a powerful TeV energy collider and the possibility of discovering new physics below the TeV scale could be addressed by it. Owing to good capabilities of the LHeC detector in identifying muons and performing b-tagging, the decay channels aμ+μ𝑎superscript𝜇superscript𝜇a\rightarrow\mu^{+}\mu^{-} as well as abb¯𝑎𝑏¯𝑏a\rightarrow b\overline{b} are mainly concerned, which could be complementary to the searches at the LHC Brivio et al. (2017); Craig et al. (2018). The Feynman diagrams describing the production of ALP via the W+Wsuperscript𝑊superscript𝑊W^{+}W^{-} fusion process epνejasuperscript𝑒𝑝subscript𝜈𝑒𝑗𝑎e^{-}p\rightarrow\nu_{e}ja followed by a𝑎a decaying to muon pairs and bb¯𝑏¯𝑏b\overline{b} pairs, respectively, are displayed in FIG. 1. We focus on the production of ALP with mass ma1000subscript𝑚𝑎1000m_{a}\leq 1000 GeV at the LHeC in this paper, picking gaψsubscript𝑔𝑎𝜓g_{a\psi} equals to 111 TeV-1. In the following, the 606060 GeV electron beam and 777 TeV proton beam of the LHeC are considered to obtain the center of mass energy approaching 1.31.31.3 TeV with the integrated luminosity of 111 ab-1.

III The discovery potential for ALP of the LHeC

III.1 Searching for ALP via epνeja(aμ+μ)superscript𝑒𝑝subscript𝜈𝑒𝑗𝑎𝑎superscript𝜇superscript𝜇e^{-}p\rightarrow\nu_{e}ja(a\rightarrow\mu^{+}\mu^{-}) at the LHeC

Our phenomenological study starts with the W+Wsuperscript𝑊superscript𝑊W^{+}W^{-} fusion process epνejasuperscript𝑒𝑝subscript𝜈𝑒𝑗𝑎e^{-}p\rightarrow\nu_{e}ja followed by aμ+μ𝑎superscript𝜇superscript𝜇a\rightarrow\mu^{+}\mu^{-}, in which the ALP with mass from 5 GeV to 1000 GeV is taken into account. This channel provides final states that include muon pairs, a light jet j=(uj=(u, d𝑑d, c𝑐c, or s)s) and missing energy italic-E̸\not{E}. The corresponding SM background is epνejμ+μsuperscript𝑒𝑝subscript𝜈𝑒𝑗superscript𝜇superscript𝜇e^{-}p\rightarrow\nu_{e}j\mu^{+}\mu^{-}. A Monte Carlo (MC) simulation is performed to explore the potential of detecting ALP at the LHeC. All the signal and background events that are going to be discussed in this and the next subsection will be generated in MadGraph5_aMC@NLO Alwall et al. (2014) with basic cuts, which require the leptons (electrons and muons included) with transverse momentum pTl>10superscriptsubscript𝑝𝑇𝑙10p_{T}^{l}>10 GeV and the jets (light flavor jets and b-jets included) with transverse momentum pTj>20superscriptsubscript𝑝𝑇𝑗20p_{T}^{j}>20 GeV. The absolute values of the leptons pseudorapidity ηlsubscript𝜂𝑙\eta_{l} and the jets pseudorapidity ηjsubscript𝜂𝑗\eta_{j} need to be less than 2.52.52.5 and 555, respectively. The angular separation requirements are ΔRll>0.4Δsubscript𝑅𝑙𝑙0.4\Delta R_{ll}>0.4, ΔRjj>0.4Δsubscript𝑅𝑗𝑗0.4\Delta R_{jj}>0.4 as well as ΔRlj>0.4Δsubscript𝑅𝑙𝑗0.4\Delta R_{lj}>0.4 for leptons and jets, in which ΔΔ\DeltaR𝑅R is defined as (Δϕ)2+(Δη)2superscriptΔitalic-ϕ2superscriptΔ𝜂2\sqrt{(\Delta\phi)^{2}+(\Delta\eta)^{2}}. The PYTHIA8 program Sjöstrand et al. (2015) is implemented for showering and hadronization. We use DELPHES de Favereau et al. (2014) for the fast simulation of the LHeC detector and MadAnalysis5 Conte et al. (2013, 2014); Conte and Fuks (2018) for the analysis of the resulting output.

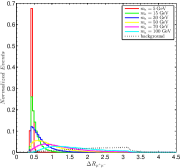
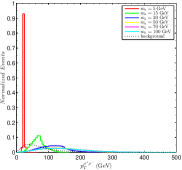
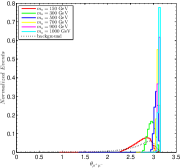
The cross section of the background is larger than that of our signal in the parameter region considered in this paper. The cross sections of the signal process with different gaWWsubscript𝑔𝑎𝑊𝑊g_{aWW} at the 1.31.31.3 TeV LHeC increase with the coupling coefficient gaWWsubscript𝑔𝑎𝑊𝑊g_{aWW} and peak near the ALP mass of 100 GeV, therefore, we take such mass as a breakpoint to divide the mass range of ALP considered into two intervals for the study. For ALP in the mass range of 555 GeV to 100100100 GeV, observables of the angular separation between the pair of muons ΔRμ+μΔsubscript𝑅superscript𝜇superscript𝜇\Delta R_{\mu^{+}\mu^{-}} in the final states and the transverse momentum of reconstructed ALP pTμ+μsuperscriptsubscript𝑝𝑇superscript𝜇superscript𝜇p_{T}^{\mu^{+}\mu^{-}} are chosen. We present in FIG. 2 the distributions of ΔRμ+μΔsubscript𝑅superscript𝜇superscript𝜇\Delta R_{\mu^{+}\mu^{-}} and pTμ+μsuperscriptsubscript𝑝𝑇superscript𝜇superscript𝜇p_{T}^{\mu^{+}\mu^{-}} for the signal and background events with typical points of ma=5subscript𝑚𝑎5m_{a}=5, 151515, 303030, 505050, 707070, 100100100 GeV. Two muons from the light ALP decay are much closer, whereas the angular separation between them tends to have a wide distribution for the background events.

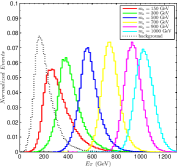
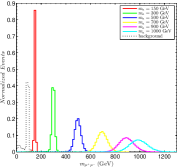
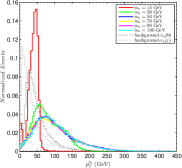
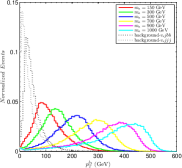
Variables of the angel between reconstructed ALP and the beam axis θμ+μsubscript𝜃superscript𝜇superscript𝜇\theta_{\mu^{+}\mu^{-}}, the total transverse energy of the final states ETsubscript𝐸𝑇E_{T} and the invariant mass of muon pairs mμ+μsubscript𝑚superscript𝜇superscript𝜇m_{\mu^{+}\mu^{-}} are taken to be analyzed when the ALP mass falls in the region of 100100100 GeV to 100010001000 GeV, meanwhile the normalized distributions of them are given in FIG. 3 based on six benchmark points as ma=150subscript𝑚𝑎150m_{a}=150, 300300300, 500500500, 700700700, 900900900, 100010001000 GeV. It can be seen that the signal and background can be well distinguished in the invariant mass mμ+μsubscript𝑚superscript𝜇superscript𝜇m_{\mu^{+}\mu^{-}} distribution. The SM background mainly comes from epνejZsuperscript𝑒𝑝subscript𝜈𝑒𝑗𝑍e^{-}p\rightarrow\nu_{e}jZ followed by Z𝑍Z decaying into muon pairs. The signal events have peaks around the ALP mass, which become wider as the ALP mass increases.

Refer to caption
Refer to caption
Figure 2: The normalized distributions of the observables ΔRμ+μΔsubscript𝑅superscript𝜇superscript𝜇\Delta R_{\mu^{+}\mu^{-}} (a) and pTμ+μsuperscriptsubscript𝑝𝑇superscript𝜇superscript𝜇p_{T}^{\mu^{+}\mu^{-}} (b) in signal and background events for various ALP masses at the 1.3 TeV LHeC with =absent\mathcal{L}= 111 ab-1.
Refer to caption
Refer to caption
Refer to caption
Figure 3: The normalized distributions of the observables θμ+μsubscript𝜃superscript𝜇superscript𝜇\theta_{\mu^{+}\mu^{-}} (a), ETsubscript𝐸𝑇E_{T} (b) and mμ+μsubscript𝑚superscript𝜇superscript𝜇m_{\mu^{+}\mu^{-}} (c) in signal and background events for various ALP masses at the 1.3 TeV LHeC with =absent\mathcal{L}= 111 ab-1.

According to the information of these kinematic distributions, improved cuts presented in TABLE 1 are further imposed for separating the signal events from the background events, where the particle numbers in the final states are subject to the conditions of Nμ+1subscript𝑁superscript𝜇1N_{\mu^{+}}\geq 1, Nμ1subscript𝑁superscript𝜇1N_{\mu^{-}}\geq 1 and Nj1subscript𝑁𝑗1N_{j}\geq 1. In TABLE 2 and TABLE 3, we show the cross sections of the signal and background at the LHeC with s=1.3𝑠1.3\sqrt{s}=1.3 TeV after taking the step-by-step cuts for few ALP mass benchmark points and the specific parameter gaWW=1subscript𝑔𝑎𝑊𝑊1g_{aWW}=1 TeV-1. It can be seen that the background is effectively suppressed. We further calculate the statistical significance SS=S/S+B𝑆𝑆𝑆𝑆𝐵SS=S/\sqrt{S+B} for the luminosity of 111 ab-1, where S𝑆S and B𝐵B are the number of events for the signal and background, respectively. Large SS𝑆𝑆SS values can be attained in a broad region of the parameter space, as illustrated in TABLE 2 and TABLE 3. The statistical significance can reach 7.0157.0157.015 (1.5811.5811.581) for ma=15subscript𝑚𝑎15m_{a}=15 GeV (700700700 GeV).

Table 1: The improved cuts on signal and background for 555 GeV \leq ma1000subscript𝑚𝑎1000m_{a}\leq 1000 GeV.
Cuts Mass
       555 GeV \leq ma100subscript𝑚𝑎100m_{a}\leq 100 GeV        100100100 GeV << ma1000subscript𝑚𝑎1000m_{a}\leq 1000 GeV
Cut 1 Nμ+1subscript𝑁superscript𝜇1N_{\mu^{+}}\geq 1, Nμ1subscript𝑁superscript𝜇1N_{\mu^{-}}\geq 1, Nj1subscript𝑁𝑗1N_{j}\geq 1 Nμ+1subscript𝑁superscript𝜇1N_{\mu^{+}}\geq 1, Nμ1subscript𝑁superscript𝜇1N_{\mu^{-}}\geq 1, Nj1subscript𝑁𝑗1N_{j}\geq 1
Cut 2 ΔRμ+μ<1.8Δsubscript𝑅superscript𝜇superscript𝜇1.8\Delta R_{\mu^{+}\mu^{-}}<1.8 θμ+μ>2.1subscript𝜃superscript𝜇superscript𝜇2.1\theta_{\mu^{+}\mu^{-}}>2.1
Cut 3 pTμ+μ>20superscriptsubscript𝑝𝑇superscript𝜇superscript𝜇20p_{T}^{\mu^{+}\mu^{-}}>20 GeV ET>250subscript𝐸𝑇250E_{T}>250 GeV
Cut 4 - mμ+μ>100subscript𝑚superscript𝜇superscript𝜇100m_{\mu^{+}\mu^{-}}>100 GeV
Table 2: The cross sections of the W+Wsuperscript𝑊superscript𝑊W^{+}W^{-} fusion process epνeja(aμ+μ)superscript𝑒𝑝subscript𝜈𝑒𝑗𝑎𝑎superscript𝜇superscript𝜇e^{-}p\rightarrow\nu_{e}ja(a\rightarrow\mu^{+}\mu^{-}) and the background epνejμ+μsuperscript𝑒𝑝subscript𝜈𝑒𝑗superscript𝜇superscript𝜇e^{-}p\rightarrow\nu_{e}j\mu^{+}\mu^{-} after the improved cuts applied for gaWW=1subscript𝑔𝑎𝑊𝑊1g_{aWW}=1 TeV-1 at the 1.3 TeV LHeC with benchmark points. 
Cuts cross sections for signal (background) [pb]
ma=5subscript𝑚𝑎5m_{a}=5 GeV ma=15subscript𝑚𝑎15m_{a}=15 GeV ma=30subscript𝑚𝑎30m_{a}=30 GeV ma=50subscript𝑚𝑎50m_{a}=50 GeV ma=70subscript𝑚𝑎70m_{a}=70 GeV ma=100subscript𝑚𝑎100m_{a}=100 GeV
Basic Cuts 1.7442×1061.7442superscript1061.7442\times 10^{-6} (0.0142)0.0142(0.0142) 5.2885×1045.2885superscript1045.2885\times 10^{-4} (0.0142)0.0142(0.0142) 2.0437×1032.0437superscript1032.0437\times 10^{-3} (0.0142)0.0142(0.0142) 2.8861×1032.8861superscript1032.8861\times 10^{-3} (0.0142)0.0142(0.0142) 2.9864×1032.9864superscript1032.9864\times 10^{-3} (0.0142)0.0142(0.0142) 2.7399×1032.7399superscript1032.7399\times 10^{-3} (0.0142)0.0142(0.0142)
Cut 1 1.4435×1061.4435superscript1061.4435\times 10^{-6} (0.0128)0.0128(0.0128) 4.6473×1044.6473superscript1044.6473\times 10^{-4} (0.0128)0.0128(0.0128) 1.8361×1031.8361superscript1031.8361\times 10^{-3} (0.0128)0.0128(0.0128) 2.6165×1032.6165superscript1032.6165\times 10^{-3} (0.0128)0.0128(0.0128) 2.7072×1032.7072superscript1032.7072\times 10^{-3} (0.0128)0.0128(0.0128) 2.4812×1032.4812superscript1032.4812\times 10^{-3} (0.0128)0.0128(0.0128)
Cut 2 1.4435×1061.4435superscript1061.4435\times 10^{-6} (3.9212×10³)3.9212superscript103(3.9212\times 10^{-3}) 4.6463×1044.6463superscript1044.6463\times 10^{-4} (3.9212×10³)3.9212superscript103(3.9212\times 10^{-3}) 1.8156×1031.8156superscript1031.8156\times 10^{-3} (3.9212×10³)3.9212superscript103(3.9212\times 10^{-3}) 2.4350×1032.4350superscript1032.4350\times 10^{-3} (3.9212×10³)3.9212superscript103(3.9212\times 10^{-3}) 2.2205×1032.2205superscript1032.2205\times 10^{-3} (3.9212×10³)3.9212superscript103(3.9212\times 10^{-3}) 1.5666×1031.5666superscript1031.5666\times 10^{-3} (3.9212×10³)3.9212superscript103(3.9212\times 10^{-3})
Cut 3 1.3934×1061.3934superscript1061.3934\times 10^{-6} (3.8963×10³)3.8963superscript103(3.8963\times 10^{-3}) 4.6375×1044.6375superscript1044.6375\times 10^{-4} (3.8963×10³)3.8963superscript103(3.8963\times 10^{-3}) 1.8155×1031.8155superscript1031.8155\times 10^{-3} (3.8963×10³)3.8963superscript103(3.8963\times 10^{-3}) 2.4349×1032.4349superscript1032.4349\times 10^{-3} (3.8963×10³)3.8963superscript103(3.8963\times 10^{-3}) 2.2205×1032.2205superscript1032.2205\times 10^{-3} (3.8963×10³)3.8963superscript103(3.8963\times 10^{-3}) 1.5666×1031.5666superscript1031.5666\times 10^{-3} (3.8963×10³)3.8963superscript103(3.8963\times 10^{-3})
SS𝑆𝑆SS 0.0220.0220.022 7.0157.0157.015 24.02224.02224.022 30.60930.60930.609 28.39628.39628.396 21.19621.19621.196
Table 3: Same as TABLE 2 but for benchmark points ma=150subscript𝑚𝑎150m_{a}=150, 300300300, 500500500, 700700700, 900900900, 100010001000 GeV. 
Cuts cross sections for signal (background) [pb]
ma=150subscript𝑚𝑎150m_{a}=150 GeV ma=300subscript𝑚𝑎300m_{a}=300 GeV ma=500subscript𝑚𝑎500m_{a}=500 GeV ma=700subscript𝑚𝑎700m_{a}=700 GeV ma=900subscript𝑚𝑎900m_{a}=900 GeV ma=1000subscript𝑚𝑎1000m_{a}=1000 GeV
Basic Cuts 2.1509×1032.1509superscript1032.1509\times 10^{-3} (0.0142)0.0142(0.0142) 8.8581×1048.8581superscript1048.8581\times 10^{-4} (0.0142)0.0142(0.0142) 2.0197×1042.0197superscript1042.0197\times 10^{-4} (0.0142)0.0142(0.0142) 2.7954×1052.7954superscript1052.7954\times 10^{-5} (0.0142)0.0142(0.0142) 1.5617×1061.5617superscript1061.5617\times 10^{-6} (0.0142)0.0142(0.0142) 1.9118×1071.9118superscript1071.9118\times 10^{-7} (0.0142)0.0142(0.0142)
Cut 1 1.9429×1031.9429superscript1031.9429\times 10^{-3} (0.0128)0.0128(0.0128) 7.9889×1047.9889superscript1047.9889\times 10^{-4} (0.0128)0.0128(0.0128) 1.8218×1041.8218superscript1041.8218\times 10^{-4} (0.0128)0.0128(0.0128) 2.4999×1052.4999superscript1052.4999\times 10^{-5} (0.0128)0.0128(0.0128) 1.3965×1061.3965superscript1061.3965\times 10^{-6} (0.0128)0.0128(0.0128) 1.7116×1071.7116superscript1071.7116\times 10^{-7} (0.0128)0.0128(0.0128)
Cut 2 1.9417×1031.9417superscript1031.9417\times 10^{-3} (0.0112)0.0112(0.0112) 7.9882×1047.9882superscript1047.9882\times 10^{-4} (0.0112)0.0112(0.0112) 1.8218×1041.8218superscript1041.8218\times 10^{-4} (0.0112)0.0112(0.0112) 2.4999×1052.4999superscript1052.4999\times 10^{-5} (0.0112)0.0112(0.0112) 1.3965×1061.3965superscript1061.3965\times 10^{-6} (0.0112)0.0112(0.0112) 1.7116×1071.7116superscript1071.7116\times 10^{-7} (0.0112)0.0112(0.0112)
Cut 3 1.3790×1031.3790superscript1031.3790\times 10^{-3} (3.2070×10³)3.2070superscript103(3.2070\times 10^{-3}) 7.7811×1047.7811superscript1047.7811\times 10^{-4} (3.2070×10³)3.2070superscript103(3.2070\times 10^{-3}) 1.8218×1041.8218superscript1041.8218\times 10^{-4} (3.2070×10³)3.2070superscript103(3.2070\times 10^{-3}) 2.4999×1052.4999superscript1052.4999\times 10^{-5} (3.2070×10³)3.2070superscript103(3.2070\times 10^{-3}) 1.3965×1061.3965superscript1061.3965\times 10^{-6} (3.2070×10³)3.2070superscript103(3.2070\times 10^{-3}) 1.7116×1071.7116superscript1071.7116\times 10^{-7} (3.2070×10³)3.2070superscript103(3.2070\times 10^{-3})
Cut 4 1.3713×1031.3713superscript1031.3713\times 10^{-3} (2.2571×10⁴)2.2571superscript104(2.2571\times 10^{-4}) 7.7691×1047.7691superscript1047.7691\times 10^{-4} (2.2571×10⁴)2.2571superscript104(2.2571\times 10^{-4}) 1.8208×1041.8208superscript1041.8208\times 10^{-4} (2.2571×10⁴)2.2571superscript104(2.2571\times 10^{-4}) 2.4989×1052.4989superscript1052.4989\times 10^{-5} (2.2571×10⁴)2.2571superscript104(2.2571\times 10^{-4}) 1.3965×1061.3965superscript1061.3965\times 10^{-6} (2.2571×10⁴)2.2571superscript104(2.2571\times 10^{-4}) 1.7116×1071.7116superscript1071.7116\times 10^{-7} (2.2571×10⁴)2.2571superscript104(2.2571\times 10^{-4})
SS𝑆𝑆SS 34.30934.30934.309 24.52624.52624.526 8.9868.9868.986 1.5811.5811.581 0.0930.0930.093 0.0110.0110.011

III.2 Searching for ALP via epνeja(abb¯)superscript𝑒𝑝subscript𝜈𝑒𝑗𝑎𝑎𝑏¯𝑏e^{-}p\rightarrow\nu_{e}ja(a\rightarrow b\overline{b}) at the LHeC

In this subsection, the approach to the analysis performed in studying the channel of the ALP decays to bb¯𝑏¯𝑏b\overline{b} pairs is similar to that used in the aμ+μ𝑎superscript𝜇superscript𝜇a\rightarrow\mu^{+}\mu^{-} decay mode, but the ALP mass range is chosen to be 151515 GeV to 100010001000 GeV. The SM backgrounds are dominantly from νejbb¯subscript𝜈𝑒𝑗𝑏¯𝑏\nu_{e}jb\overline{b} and νejjjsubscript𝜈𝑒𝑗𝑗𝑗\nu_{e}jjj for the signal process epνeja(abb¯)superscript𝑒𝑝subscript𝜈𝑒𝑗𝑎𝑎𝑏¯𝑏e^{-}p\rightarrow\nu_{e}ja(a\rightarrow b\overline{b}), in which the νejjjsubscript𝜈𝑒𝑗𝑗𝑗\nu_{e}jjj final states are more severe than the νejbb¯subscript𝜈𝑒𝑗𝑏¯𝑏\nu_{e}jb\overline{b} final states. The cross sections of the signal are several orders of magnitude smaller than the corresponding backgrounds after the basic cuts applied.

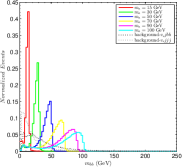
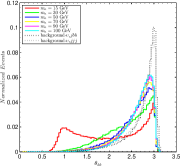
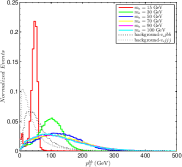
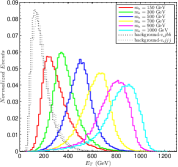
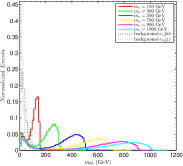
Even though the signal could easily be overwhelmed by the enormous backgrounds, there are many kinematic differences between them that can be utilized to distinguish the signal from the backgrounds. The invariant mass of bb𝑏𝑏bb pairs mbbsubscript𝑚𝑏𝑏m_{bb}, the transverse momentum of the hardest b-jet pTb1superscriptsubscript𝑝𝑇subscript𝑏1p_{T}^{b_{1}}, the angel between reconstructed ALP and the beam axis θbbsubscript𝜃𝑏𝑏\theta_{bb} as well as the transverse momentum of reconstructed ALP pTbbsuperscriptsubscript𝑝𝑇𝑏𝑏p_{T}^{bb} are taken as the variables for analysis in the mass interval of 151515 GeV to 100100100 GeV for ALP. The normalized distributions of these kinematic variables are exhibited in FIG. 4, where some ALP mass benchmark points ma=15subscript𝑚𝑎15m_{a}=15, 303030, 505050, 707070, 909090, 100100100 GeV are picked as examples. The transverse momentum of the reconstructed bb𝑏𝑏bb pairs is small for the background events, while this is not the case for the signal. Some selected kinematic distributions, namely pTb1superscriptsubscript𝑝𝑇subscript𝑏1p_{T}^{b_{1}}, the total transverse energy of the final states ETsubscript𝐸𝑇E_{T} and mbbsubscript𝑚𝑏𝑏m_{bb}, for the signal and background events with six mass points in 100100100 GeV << ma1000subscript𝑚𝑎1000m_{a}\leq 1000 GeV are shown in FIG. 5. We can see that the pTb1superscriptsubscript𝑝𝑇subscript𝑏1p_{T}^{b_{1}} peaks of the signal events are larger than those of the SM backgrounds.

In order to trigger the signal events, different optimized kinematical cuts are applied to reduce backgrounds and improve the statistical significance, as listed in Table 4. The estimation of cross sections after applying the above selection cuts for the signal and potential background processes are given in TABLE 5 and TABLE 6, in which the νejbb¯subscript𝜈𝑒𝑗𝑏¯𝑏\nu_{e}jb\overline{b} background and the νejjjsubscript𝜈𝑒𝑗𝑗𝑗\nu_{e}jjj background are labelled as “background1” and “background2”, respectively. The SS𝑆𝑆SS values obtained with the selection strategy are summarized in the last row of TABLE 5 and TABLE 6. A tagging efficiency of 75%percent7575\% for b-jets and a mistagging rate of 5%percent55\% for c-jets as well as 0.1%percent0.10.1\% for other light flavor jets are assumed. The significance of 3.4683.4683.468 can be obtained when we take masubscript𝑚𝑎m_{a} as 303030 GeV and the integrated luminosity of 111 ab-1. There are small values of SS𝑆𝑆SS when the ALP mass approaching 100010001000 GeV.

Refer to caption
Refer to caption
Refer to caption
Refer to caption
Figure 4: The normalized distributions of the observables mbbsubscript𝑚𝑏𝑏m_{bb} (a), pTb1superscriptsubscript𝑝𝑇subscript𝑏1p_{T}^{b_{1}} (b), θbbsubscript𝜃𝑏𝑏\theta_{bb} (c) and pTbbsuperscriptsubscript𝑝𝑇𝑏𝑏p_{T}^{bb} (d) in signal and background events for various ALP masses at the 1.3 TeV LHeC with =absent\mathcal{L}= 111 ab-1.
Refer to caption
Refer to caption
Refer to caption
Figure 5: The normalized distributions of the observables pTb1superscriptsubscript𝑝𝑇subscript𝑏1p_{T}^{b_{1}} (a), ETsubscript𝐸𝑇E_{T} (b) and mbbsubscript𝑚𝑏𝑏m_{bb} (c) in signal and background events for various ALP masses at the 1.3 TeV LHeC with =absent\mathcal{L}= 111 ab-1.
Table 4: The improved cuts on signal and background for 151515 GeV \leq ma1000subscript𝑚𝑎1000m_{a}\leq 1000 GeV.
Cuts Mass
       151515 GeV \leq ma100subscript𝑚𝑎100m_{a}\leq 100 GeV        100100100 GeV << ma1000subscript𝑚𝑎1000m_{a}\leq 1000 GeV
Cut 1 Nb2subscript𝑁𝑏2N_{b}\geq 2, Nj1subscript𝑁𝑗1N_{j}\geq 1 Nb2subscript𝑁𝑏2N_{b}\geq 2, Nj1subscript𝑁𝑗1N_{j}\geq 1
Cut 2 mbb>10subscript𝑚𝑏𝑏10m_{bb}>10 GeV pTb1>85superscriptsubscript𝑝𝑇subscript𝑏185p_{T}^{b_{1}}>85 GeV
Cut 3 pTb1>30superscriptsubscript𝑝𝑇subscript𝑏130p_{T}^{b_{1}}>30 GeV ET>200subscript𝐸𝑇200E_{T}>200 GeV
Cut 4 θbb<2.9subscript𝜃𝑏𝑏2.9\theta_{bb}<2.9 mbb>100subscript𝑚𝑏𝑏100m_{bb}>100 GeV
Cut 5 pTbb>40superscriptsubscript𝑝𝑇𝑏𝑏40p_{T}^{bb}>40 GeV -
Table 5: The cross sections of the W+Wsuperscript𝑊superscript𝑊W^{+}W^{-} fusion process epνeja(abb¯)superscript𝑒𝑝subscript𝜈𝑒𝑗𝑎𝑎𝑏¯𝑏e^{-}p\rightarrow\nu_{e}ja(a\rightarrow b\overline{b}) and the background processes epνejbb¯superscript𝑒𝑝subscript𝜈𝑒𝑗𝑏¯𝑏e^{-}p\rightarrow\nu_{e}jb\overline{b} and epνejjjsuperscript𝑒𝑝subscript𝜈𝑒𝑗𝑗𝑗e^{-}p\rightarrow\nu_{e}jjj after the improved cuts applied for gaWW=1subscript𝑔𝑎𝑊𝑊1g_{aWW}=1 TeV-1 at the 1.3 TeV LHeC with benchmark points. 
Cuts cross sections for signal (background1, background2) [pb]
ma=15subscript𝑚𝑎15m_{a}=15 GeV ma=30subscript𝑚𝑎30m_{a}=30 GeV ma=50subscript𝑚𝑎50m_{a}=50 GeV ma=70subscript𝑚𝑎70m_{a}=70 GeV ma=90subscript𝑚𝑎90m_{a}=90 GeV ma=100subscript𝑚𝑎100m_{a}=100 GeV
Basic Cuts 6.1000×1056.1000superscript1056.1000\times 10^{-5} (0.0490,6.2968)0.04906.2968(0.0490,6.2968) 1.5831×1031.5831superscript1031.5831\times 10^{-3} (0.0490,6.2968)0.04906.2968(0.0490,6.2968) 2.8332×1032.8332superscript1032.8332\times 10^{-3} (0.0490,6.2968)0.04906.2968(0.0490,6.2968) 3.0975×1033.0975superscript1033.0975\times 10^{-3} (0.0490,6.2968)0.04906.2968(0.0490,6.2968) 3.1289×1033.1289superscript1033.1289\times 10^{-3} (0.0490,6.2968)0.04906.2968(0.0490,6.2968) 3.1248×1033.1248superscript1033.1248\times 10^{-3} (0.0490,6.2968)0.04906.2968(0.0490,6.2968)
Cut 1 2.8250×1052.8250superscript1052.8250\times 10^{-5} (0.0271,0.0922)0.02710.0922(0.0271,0.0922) 8.1835×1048.1835superscript1048.1835\times 10^{-4} (0.0271,0.0922)0.02710.0922(0.0271,0.0922) 1.5797×1031.5797superscript1031.5797\times 10^{-3} (0.0271,0.0922)0.02710.0922(0.0271,0.0922) 1.8036×1031.8036superscript1031.8036\times 10^{-3} (0.0271,0.0922)0.02710.0922(0.0271,0.0922) 1.8604×1031.8604superscript1031.8604\times 10^{-3} (0.0271,0.0922)0.02710.0922(0.0271,0.0922) 1.8691×1031.8691superscript1031.8691\times 10^{-3} (0.0271,0.0922)0.02710.0922(0.0271,0.0922)
Cut 2 2.2980×1052.2980superscript1052.2980\times 10^{-5} (0.0231,0.0576)0.02310.0576(0.0231,0.0576) 7.7615×1047.7615superscript1047.7615\times 10^{-4} (0.0231,0.0576)0.02310.0576(0.0231,0.0576) 1.4986×1031.4986superscript1031.4986\times 10^{-3} (0.0231,0.0576)0.02310.0576(0.0231,0.0576) 1.7120×1031.7120superscript1031.7120\times 10^{-3} (0.0231,0.0576)0.02310.0576(0.0231,0.0576) 1.7665×1031.7665superscript1031.7665\times 10^{-3} (0.0231,0.0576)0.02310.0576(0.0231,0.0576) 1.7751×1031.7751superscript1031.7751\times 10^{-3} (0.0231,0.0576)0.02310.0576(0.0231,0.0576)
Cut 3 1.9960×1051.9960superscript1051.9960\times 10^{-5} (0.0177,0.0387)0.01770.0387(0.0177,0.0387) 7.4325×1047.4325superscript1047.4325\times 10^{-4} (0.0177,0.0387)0.01770.0387(0.0177,0.0387) 1.4409×1031.4409superscript1031.4409\times 10^{-3} (0.0177,0.0387)0.01770.0387(0.0177,0.0387) 1.6500×1031.6500superscript1031.6500\times 10^{-3} (0.0177,0.0387)0.01770.0387(0.0177,0.0387) 1.7096×1031.7096superscript1031.7096\times 10^{-3} (0.0177,0.0387)0.01770.0387(0.0177,0.0387) 1.7228×1031.7228superscript1031.7228\times 10^{-3} (0.0177,0.0387)0.01770.0387(0.0177,0.0387)
Cut 4 1.7110×1051.7110superscript1051.7110\times 10^{-5} (9.9450×10³,(9.9450\times 10^{-3}, 0.0250)0.0250) 6.1904×1046.1904superscript1046.1904\times 10^{-4} (9.9450×10³,(9.9450\times 10^{-3}, 0.0250)0.0250) 1.1660×1031.1660superscript1031.1660\times 10^{-3} (9.9450×10³,(9.9450\times 10^{-3}, 0.0250)0.0250) 1.3126×1031.3126superscript1031.3126\times 10^{-3} (9.9450×10³,(9.9450\times 10^{-3}, 0.0250)0.0250) 1.3244×1031.3244superscript1031.3244\times 10^{-3} (9.9450×10³,(9.9450\times 10^{-3}, 0.0250)0.0250) 1.3193×1031.3193superscript1031.3193\times 10^{-3} (9.9450×10³,(9.9450\times 10^{-3}, 0.0250)0.0250)
Cut 5 1.6290×1051.6290superscript1051.6290\times 10^{-5} (8.9469×10³,(8.9469\times 10^{-3}, 0.0220)0.0220) 6.1644×1046.1644superscript1046.1644\times 10^{-4} (8.9469×10³,(8.9469\times 10^{-3}, 0.0220)0.0220) 1.1534×1031.1534superscript1031.1534\times 10^{-3} (8.9469×10³,(8.9469\times 10^{-3}, 0.0220)0.0220) 1.2712×1031.2712superscript1031.2712\times 10^{-3} (8.9469×10³,(8.9469\times 10^{-3}, 0.0220)0.0220) 1.2725×1031.2725superscript1031.2725\times 10^{-3} (8.9469×10³,(8.9469\times 10^{-3}, 0.0220)0.0220) 1.2629×1031.2629superscript1031.2629\times 10^{-3} (8.9469×10³,(8.9469\times 10^{-3}, 0.0220)0.0220)
SS𝑆𝑆SS 0.0930.0930.093 3.4683.4683.468 6.4346.4346.434 7.0787.0787.078 7.0847.0847.084 7.0327.0327.032
Table 6: Same as TABLE 5 but for benchmark points ma=150subscript𝑚𝑎150m_{a}=150, 300300300, 500500500, 700700700, 900900900, 100010001000 GeV. 
Cuts cross sections for signal (background1, background2) [pb]
ma=150subscript𝑚𝑎150m_{a}=150 GeV ma=300subscript𝑚𝑎300m_{a}=300 GeV ma=500subscript𝑚𝑎500m_{a}=500 GeV ma=700subscript𝑚𝑎700m_{a}=700 GeV ma=900subscript𝑚𝑎900m_{a}=900 GeV ma=1000subscript𝑚𝑎1000m_{a}=1000 GeV
Basic Cuts 2.8355×1032.8355superscript1032.8355\times 10^{-3} (0.0490,6.2968)0.04906.2968(0.0490,6.2968) 1.3969×1031.3969superscript1031.3969\times 10^{-3} (0.0490,6.2968)0.04906.2968(0.0490,6.2968) 3.8331×1043.8331superscript1043.8331\times 10^{-4} (0.0490,6.2968)0.04906.2968(0.0490,6.2968) 6.6391×1056.6391superscript1056.6391\times 10^{-5} (0.0490,6.2968)0.04906.2968(0.0490,6.2968) 4.9981×1064.9981superscript1064.9981\times 10^{-6} (0.0490,6.2968)0.04906.2968(0.0490,6.2968) 7.7509×1077.7509superscript1077.7509\times 10^{-7} (0.0490,6.2968)0.04906.2968(0.0490,6.2968)
Cut 1 1.7067×1031.7067superscript1031.7067\times 10^{-3} (0.0271,0.0922)0.02710.0922(0.0271,0.0922) 8.2443×1048.2443superscript1048.2443\times 10^{-4} (0.0271,0.0922)0.02710.0922(0.0271,0.0922) 2.1850×1042.1850superscript1042.1850\times 10^{-4} (0.0271,0.0922)0.02710.0922(0.0271,0.0922) 3.6355×1053.6355superscript1053.6355\times 10^{-5} (0.0271,0.0922)0.02710.0922(0.0271,0.0922) 2.5790×1062.5790superscript1062.5790\times 10^{-6} (0.0271,0.0922)0.02710.0922(0.0271,0.0922) 3.8905×1073.8905superscript1073.8905\times 10^{-7} (0.0271,0.0922)0.02710.0922(0.0271,0.0922)
Cut 2 1.0934×1031.0934superscript1031.0934\times 10^{-3} (3.5966×10³,(3.5966\times 10^{-3}, 9.6278×10³)9.6278\times 10^{-3}) 6.9825×1046.9825superscript1046.9825\times 10^{-4} (3.5966×10³,(3.5966\times 10^{-3}, 9.6278×10³)9.6278\times 10^{-3}) 2.0489×1042.0489superscript1042.0489\times 10^{-4} (3.5966×10³,(3.5966\times 10^{-3}, 9.6278×10³)9.6278\times 10^{-3}) 3.4825×1053.4825superscript1053.4825\times 10^{-5} (3.5966×10³,(3.5966\times 10^{-3}, 9.6278×10³)9.6278\times 10^{-3}) 2.4991×1062.4991superscript1062.4991\times 10^{-6} (3.5966×10³,(3.5966\times 10^{-3}, 9.6278×10³)9.6278\times 10^{-3}) 3.7804×1073.7804superscript1073.7804\times 10^{-7} (3.5966×10³,(3.5966\times 10^{-3}, 9.6278×10³)9.6278\times 10^{-3})
Cut 3 1.0447×1031.0447superscript1031.0447\times 10^{-3} (2.7793×10³,(2.7793\times 10^{-3}, 7.7577×10³)7.7577\times 10^{-3}) 6.9545×1046.9545superscript1046.9545\times 10^{-4} (2.7793×10³,(2.7793\times 10^{-3}, 7.7577×10³)7.7577\times 10^{-3}) 2.0480×1042.0480superscript1042.0480\times 10^{-4} (2.7793×10³,(2.7793\times 10^{-3}, 7.7577×10³)7.7577\times 10^{-3}) 3.4825×1053.4825superscript1053.4825\times 10^{-5} (2.7793×10³,(2.7793\times 10^{-3}, 7.7577×10³)7.7577\times 10^{-3}) 2.4991×1062.4991superscript1062.4991\times 10^{-6} (2.7793×10³,(2.7793\times 10^{-3}, 7.7577×10³)7.7577\times 10^{-3}) 3.7804×1073.7804superscript1073.7804\times 10^{-7} (2.7793×10³,(2.7793\times 10^{-3}, 7.7577×10³)7.7577\times 10^{-3})
Cut 4 7.8474×1047.8474superscript1047.8474\times 10^{-4} (8.1555×10⁴,(8.1555\times 10^{-4}, 8.8780×10⁴)8.8780\times 10^{-4}) 5.9819×1045.9819superscript1045.9819\times 10^{-4} (8.1555×10⁴,(8.1555\times 10^{-4}, 8.8780×10⁴)8.8780\times 10^{-4}) 1.7398×1041.7398superscript1041.7398\times 10^{-4} (8.1555×10⁴,(8.1555\times 10^{-4}, 8.8780×10⁴)8.8780\times 10^{-4}) 2.9176×1052.9176superscript1052.9176\times 10^{-5} (8.1555×10⁴,(8.1555\times 10^{-4}, 8.8780×10⁴)8.8780\times 10^{-4}) 2.0992×1062.0992superscript1062.0992\times 10^{-6} (8.1555×10⁴,(8.1555\times 10^{-4}, 8.8780×10⁴)8.8780\times 10^{-4}) 3.1304×1073.1304superscript1073.1304\times 10^{-7} (8.1555×10⁴,(8.1555\times 10^{-4}, 8.8780×10⁴)8.8780\times 10^{-4})
SS𝑆𝑆SS 15.72815.72815.728 12.46112.46112.461 4.0124.0124.012 0.7010.7010.701 0.0500.0500.050 0.0080.0080.008

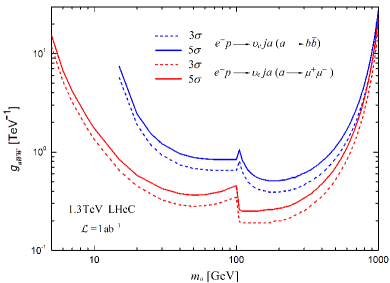
In order to make the analysis more simplified and the cross sections of the signal processes larger, we study the above two decay channels by taking the branching ratios to be 100%percent100100\% for aμ+μ𝑎superscript𝜇superscript𝜇a\rightarrow\mu^{+}\mu^{-} and abb¯𝑎𝑏¯𝑏a\rightarrow b\overline{b}, respectively. Furthermore, we plot the 3σ3𝜎3\sigma and 5σ5𝜎5\sigma curves in the plane of magaWWsubscript𝑚𝑎subscript𝑔𝑎𝑊𝑊m_{a}-g_{aWW} at the LHeC with s=1.3𝑠1.3\sqrt{s}=1.3 TeV and =absent\mathcal{L}= 111 ab-1 in FIG. 6, where the expected bounds for the signal processes epνeja(aμ+μ)superscript𝑒𝑝subscript𝜈𝑒𝑗𝑎𝑎superscript𝜇superscript𝜇e^{-}p\rightarrow\nu_{e}ja(a\rightarrow\mu^{+}\mu^{-}) and epνeja(abb¯)superscript𝑒𝑝subscript𝜈𝑒𝑗𝑎𝑎𝑏¯𝑏e^{-}p\rightarrow\nu_{e}ja(a\rightarrow b\overline{b}) are shown in red and blue, respectively. The figure indicates that the sensitivity bounds on the coupling coefficient gaWWsubscript𝑔𝑎𝑊𝑊g_{aWW} can reach 0.190.190.19 TeV-1 (0.250.250.25 TeV-1) and 0.390.390.39 TeV-1 (0.510.510.51 TeV-1) at 3σ3𝜎3\sigma (5σ5𝜎5\sigma) confidence level for the dacay channels aμ+μ𝑎superscript𝜇superscript𝜇a\rightarrow\mu^{+}\mu^{-} and abb¯𝑎𝑏¯𝑏a\rightarrow b\overline{b}, respectivly. Therefore, the signal of ALP might be probed via the W+Wsuperscript𝑊superscript𝑊W^{+}W^{-} fusion processes epνeja(aμ+μ)superscript𝑒𝑝subscript𝜈𝑒𝑗𝑎𝑎superscript𝜇superscript𝜇e^{-}p\rightarrow\nu_{e}ja(a\rightarrow\mu^{+}\mu^{-}) and epνeja(abb¯)superscript𝑒𝑝subscript𝜈𝑒𝑗𝑎𝑎𝑏¯𝑏e^{-}p\rightarrow\nu_{e}ja(a\rightarrow b\overline{b}) at the LHeC, of which the former is more sensitive to search for the ALP in the studied mass range. If the values for the branching ratios of ALP decaying into specific final states are not fixed, the sensitivity obtained by the bb𝑏𝑏bb mode will be stronger than that achieved from the μ+μsuperscript𝜇superscript𝜇\mu^{+}\mu^{-} mode under study due to the couplings of ALP to fermions proportional to the corresponding fermion mass, which results in the signal cross sections of the bb𝑏𝑏bb mode being larger than those of the μ+μsuperscript𝜇superscript𝜇\mu^{+}\mu^{-} mode. We will comprehensively investigate the ALP signal for this case in future work.

Refer to caption
Figure 6: The 3σ3𝜎3\sigma and 5σ5𝜎5\sigma curves in the magaWWsubscript𝑚𝑎subscript𝑔𝑎𝑊𝑊m_{a}-g_{aWW} plane for the W+Wsuperscript𝑊superscript𝑊W^{+}W^{-} fusion processes epνeja(aμ+μ)superscript𝑒𝑝subscript𝜈𝑒𝑗𝑎𝑎superscript𝜇superscript𝜇e^{-}p\rightarrow\nu_{e}ja(a\rightarrow\mu^{+}\mu^{-}) (red) and epνeja(abb¯)superscript𝑒𝑝subscript𝜈𝑒𝑗𝑎𝑎𝑏¯𝑏e^{-}p\rightarrow\nu_{e}ja(a\rightarrow b\overline{b}) (blue) at the 1.3 TeV LHeC with =absent\mathcal{L}= 111 ab-1.

IV Summary and discussion

Owing to the large energy, the enhanced luminosity and the cleanliness of the hadronic final states, the LHeC will scrutinise the SM deeper than ever before and has its own potential to discover new physics. Exotic phenomena can be studied at the LHeC. With a wide range of phenomenological applications, ALP provides a well-motivated new physics scenario. In this paper, our attention was focused on discussing the possibility of detecting ALP through the W+Wsuperscript𝑊superscript𝑊W^{+}W^{-} fusion processes epνeja(aμ+μ)superscript𝑒𝑝subscript𝜈𝑒𝑗𝑎𝑎superscript𝜇superscript𝜇e^{-}p\rightarrow\nu_{e}ja(a\rightarrow\mu^{+}\mu^{-}) and epνeja(abb¯)superscript𝑒𝑝subscript𝜈𝑒𝑗𝑎𝑎𝑏¯𝑏e^{-}p\rightarrow\nu_{e}ja(a\rightarrow b\overline{b}) in the reasonable parameter space at the 1.31.31.3 TeV LHeC with =absent\mathcal{L}= 111 ab-1.

Refer to caption
Figure 7: Our projected 2σ2𝜎2\sigma sensitivity limits on the coupling of ALP to W±superscript𝑊plus-or-minusW^{\pm} bosons at the LHeC in comparison with other current excluded regions.

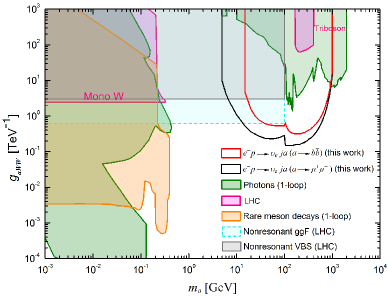
The sensitivity limits on the coupling of ALP to W±superscript𝑊plus-or-minusW^{\pm} bosons at 95%percent9595\% C.L. derived in this paper and other exclusion regions from previous studies are given in FIG. 7. Our results are shown in black line indicating the decay channel aμ+μ𝑎superscript𝜇superscript𝜇a\rightarrow\mu^{+}\mu^{-} and red line for the decay channel abb¯𝑎𝑏¯𝑏a\rightarrow b\overline{b}. The promising sensitivities of the coupling coefficient gaWWsubscript𝑔𝑎𝑊𝑊g_{aWW} are expected to be 0.156.66similar-to0.156.660.15\sim 6.66 TeV-1 for the signal process epνeja(aμ+μ)superscript𝑒𝑝subscript𝜈𝑒𝑗𝑎𝑎superscript𝜇superscript𝜇e^{-}p\rightarrow\nu_{e}ja(a\rightarrow\mu^{+}\mu^{-}) in the ALP mass interval 14924similar-to1492414\sim 924 GeV at the LHeC with s=1.3𝑠1.3\sqrt{s}=1.3 TeV and =absent\mathcal{L}= 111 ab-1. In the case of the signal process epνeja(abb¯)superscript𝑒𝑝subscript𝜈𝑒𝑗𝑎𝑎𝑏¯𝑏e^{-}p\rightarrow\nu_{e}ja(a\rightarrow b\overline{b}), the values of gaWWsubscript𝑔𝑎𝑊𝑊g_{aWW} as 0.326.67similar-to0.326.670.32\sim 6.67 TeV-1 corresponding to the ALP mass interval 39900similar-to3990039\sim 900 GeV are acquired.

Other regions excluded for the coupling of ALP to W±superscript𝑊plus-or-minusW^{\pm} bosons are then depicted in FIG. 7 as coloured areas. Since the radiative corrections of the ALP-boson couplings to the coupling of ALP with photons, the bounds on ALP-photon coupling can be translated into the bounds for gaWWsubscript𝑔𝑎𝑊𝑊g_{aWW}, which are labeled as “Photons”. Such constraints depend mildly on fasubscript𝑓𝑎f_{a}, stemming from Beam Dump experiments, supernova SN1987a observations and the LHC results Alonso-Álvarez et al. (2019). Limits labeled as “LHC” are derived from mono-W𝑊W final states in the sub-GeV ALP mass region Brivio et al. (2017) and resonant triboson searches as the ALP mass near the TeV range at the LHC Craig et al. (2018), though they are superseded by “Photons” exclusions. Light ALPs can also be produced from rare meson decays and the coupling of ALP to W±superscript𝑊plus-or-minusW^{\pm} bosons is best tested by its one-loop impact on rare meson decay experiments, which gives rise to the constraints shown with the orange area in FIG. 7 Artamonov et al. (2009); Izaguirre et al. (2017). The constraints on gaWWsubscript𝑔𝑎𝑊𝑊g_{aWW} offered by the search for ALP inducing nonresonant signals at the LHC via gluon-gluon fusion process (labeled “Nonresonant ggF”) and vector boson scattering (labeled “Nonresonant VBS”) processes have been studied in Refs. Carra et al. (2021) and Bonilla et al. (2022), respectively. Nevertheless, the “Nonresonant ggF” bounds can be completely lifted as the interaction of ALP with gluons tends to zero. As a whole, our results cover regions of the parameter space that complement the research of gaWWsubscript𝑔𝑎𝑊𝑊g_{aWW} by the LHC. The obtained LHeC sensitivity limits are stronger than the bounds given by “Nonresonant ggF” in the cases of ma>14subscript𝑚𝑎14m_{a}>14 GeV for the decay channel aμ+μ𝑎superscript𝜇superscript𝜇a\rightarrow\mu^{+}\mu^{-} and ma>39subscript𝑚𝑎39m_{a}>39 GeV for the abb¯𝑎𝑏¯𝑏a\rightarrow b\overline{b} production mode. The parameter regions being explored are excluded by the “Photons” constraints for approximately ma>900subscript𝑚𝑎900m_{a}>900 GeV.

In conclusion, comparing with the regions excluded by other experiments, the LHeC is more sensitive to the coupling of ALP with W±superscript𝑊plus-or-minusW^{\pm} bosons via the W+Wsuperscript𝑊superscript𝑊W^{+}W^{-} fusion processes epνeja(aμ+μ)superscript𝑒𝑝subscript𝜈𝑒𝑗𝑎𝑎superscript𝜇superscript𝜇e^{-}p\rightarrow\nu_{e}ja(a\rightarrow\mu^{+}\mu^{-}) and epνeja(abb¯)superscript𝑒𝑝subscript𝜈𝑒𝑗𝑎𝑎𝑏¯𝑏e^{-}p\rightarrow\nu_{e}ja(a\rightarrow b\overline{b}) for the ALP with mass range of roughly a few tens of GeV to 900900900 GeV. The LHeC running at 1.31.31.3 TeV with the integrated luminosity of 111 ab-1 would have great potential in detecting ALPs.

ACKNOWLEDGMENT

This work was partially supported by the National Natural Science Foundation of China under Grant No. 11875157 and No. 12147214.

References

  • Feng (2013) J. L. Feng, Ann. Rev. Nucl. Part. Sci. 63, 351 (2013), eprint 1302.6587.
  • Kim and Carosi (2010) J. E. Kim and G. Carosi, Rev. Mod. Phys. 82, 557 (2010), [Erratum: Rev. Mod. Phys. 91, 049902 (2019)], eprint 0807.3125.
  • Lindner et al. (2018) M. Lindner, M. Platscher, and F. S. Queiroz, Phys. Rept. 731, 1 (2018), eprint 1610.06587.
  • Gonzalez-Garcia and Maltoni (2008) M. C. Gonzalez-Garcia and M. Maltoni, Phys. Rept. 460, 1 (2008), eprint 0704.1800.
  • Abelleira Fernandez et al. (2012a) J. L. Abelleira Fernandez et al. (LHeC Study Group), J. Phys. G 39, 075001 (2012a), eprint 1206.2913.
  • Abelleira Fernandez et al. (2012b) J. L. Abelleira Fernandez et al., in CERN Council Open Symposium on European Strategy for Particle Physics (2012b), eprint 1211.4831.
  • Bruening and Klein (2013) O. Bruening and M. Klein, Mod. Phys. Lett. A 28, 1330011 (2013), eprint 1305.2090.
  • Agostini et al. (2021) P. Agostini et al. (LHeC, FCC-he Study Group), J. Phys. G 48, 110501 (2021), eprint 2007.14491.
  • Peccei and Quinn (1977) R. D. Peccei and H. R. Quinn, Phys. Rev. Lett. 38, 1440 (1977).
  • Weinberg (1978) S. Weinberg, Phys. Rev. Lett. 40, 223 (1978).
  • Wilczek (1978) F. Wilczek, Phys. Rev. Lett. 40, 279 (1978).
  • Grilli di Cortona et al. (2016) G. Grilli di Cortona, E. Hardy, J. Pardo Vega, and G. Villadoro, JHEP 01, 034 (2016), eprint 1511.02867.
  • Raffelt (1990) G. G. Raffelt, Phys. Rept. 198, 1 (1990).
  • Marsh (2016) D. J. E. Marsh, Phys. Rept. 643, 1 (2016), eprint 1510.07633.
  • Konaka et al. (1986) A. Konaka et al., Phys. Rev. Lett. 57, 659 (1986).
  • Abudinén et al. (2020) F. Abudinén et al. (Belle-II), Phys. Rev. Lett. 125, 161806 (2020), eprint 2007.13071.
  • Altmannshofer et al. (2022) W. Altmannshofer, J. A. Dror, and S. Gori (2022), eprint 2209.00665.
  • Brivio et al. (2017) I. Brivio, M. B. Gavela, L. Merlo, K. Mimasu, J. M. No, R. del Rey, and V. Sanz, Eur. Phys. J. C 77, 572 (2017), eprint 1701.05379.
  • Ghebretinsaea et al. (2022) F. A. Ghebretinsaea, Z. S. Wang, and K. Wang, JHEP 07, 070 (2022), eprint 2203.01734.
  • Yue et al. (2022a) C.-X. Yue, S. Yang, H. Wang, and N. Zhang, Phys. Rev. D 105, 115027 (2022a), eprint 2204.04702.
  • Baldenegro et al. (2018) C. Baldenegro, S. Fichet, G. von Gersdorff, and C. Royon, JHEP 06, 131 (2018), eprint 1803.10835.
  • Flórez et al. (2021) A. Flórez, A. Gurrola, W. Johns, P. Sheldon, E. Sheridan, K. Sinha, and B. Soubasis, Phys. Rev. D 103, 095001 (2021), eprint 2101.11119.
  • d’Enterria (2021) D. d’Enterria, in Workshop on Feebly Interacting Particles (2021), eprint 2102.08971.
  • İnan and Kisselev (2020) S. C. İnan and A. V. Kisselev, JHEP 06, 183 (2020), eprint 2003.01978.
  • İnan and Kisselev (2021) S. C. İnan and A. V. Kisselev, Chin. Phys. C 45, 043109 (2021), eprint 2007.01693.
  • Zhang et al. (2021) H.-Y. Zhang, C.-X. Yue, Y.-C. Guo, and S. Yang, Phys. Rev. D 104, 096008 (2021), eprint 2103.05218.
  • Yue et al. (2022b) C.-X. Yue, H.-Y. Zhang, and H. Wang, Eur. Phys. J. C 82, 88 (2022b), eprint 2112.11604.
  • Lu (2022) C.-T. Lu (2022), eprint 2210.15648.
  • Bao et al. (2022) Y. Bao, J. Fan, and L. Li, JHEP 08, 276 (2022), eprint 2203.04328.
  • Han et al. (2022) T. Han, T. Li, and X. Wang, in Snowmass 2021 (2022), eprint 2203.05484.
  • Georgi et al. (1986) H. Georgi, D. B. Kaplan, and L. Randall, Phys. Lett. B 169, 73 (1986).
  • Bauer et al. (2017) M. Bauer, M. Neubert, and A. Thamm, JHEP 12, 044 (2017), eprint 1708.00443.
  • Yue et al. (2019) C.-X. Yue, M.-Z. Liu, and Y.-C. Guo, Phys. Rev. D 100, 015020 (2019), eprint 1904.10657.
  • Liu and Yan (2023) Y. Liu and B. Yan, Chin. Phys. C 47, 043113 (2023), eprint 2112.02477.
  • Wang et al. (2022) H. Wang, C.-X. Yue, Y.-C. Guo, X.-J. Cheng, and X.-Y. Li, J. Phys. G 49, 115002 (2022).
  • Alloul et al. (2014) A. Alloul, N. D. Christensen, C. Degrande, C. Duhr, and B. Fuks, Comput. Phys. Commun. 185, 2250 (2014), eprint 1310.1921.
  • Bauer et al. (2022) M. Bauer, M. Neubert, S. Renner, M. Schnubel, and A. Thamm, JHEP 09, 056 (2022), eprint 2110.10698.
  • Bergsma et al. (1985) F. Bergsma et al. (CHARM), Phys. Lett. B 157, 458 (1985).
  • Dolan et al. (2015) M. J. Dolan, F. Kahlhoefer, C. McCabe, and K. Schmidt-Hoberg, JHEP 03, 171 (2015), [Erratum: JHEP 07, 103 (2015)], eprint 1412.5174.
  • Craig et al. (2018) N. Craig, A. Hook, and S. Kasko, JHEP 09, 028 (2018), eprint 1805.06538.
  • Alwall et al. (2014) J. Alwall, R. Frederix, S. Frixione, V. Hirschi, F. Maltoni, O. Mattelaer, H. S. Shao, T. Stelzer, P. Torrielli, and M. Zaro, JHEP 07, 079 (2014), eprint 1405.0301.
  • Sjöstrand et al. (2015) T. Sjöstrand, S. Ask, J. R. Christiansen, R. Corke, N. Desai, P. Ilten, S. Mrenna, S. Prestel, C. O. Rasmussen, and P. Z. Skands, Comput. Phys. Commun. 191, 159 (2015), eprint 1410.3012.
  • de Favereau et al. (2014) J. de Favereau, C. Delaere, P. Demin, A. Giammanco, V. Lemaître, A. Mertens, and M. Selvaggi (DELPHES 3), JHEP 02, 057 (2014), eprint 1307.6346.
  • Conte et al. (2013) E. Conte, B. Fuks, and G. Serret, Comput. Phys. Commun. 184, 222 (2013), eprint 1206.1599.
  • Conte et al. (2014) E. Conte, B. Dumont, B. Fuks, and C. Wymant, Eur. Phys. J. C 74, 3103 (2014), eprint 1405.3982.
  • Conte and Fuks (2018) E. Conte and B. Fuks, Int. J. Mod. Phys. A 33, 1830027 (2018), eprint 1808.00480.
  • Alonso-Álvarez et al. (2019) G. Alonso-Álvarez, M. B. Gavela, and P. Quilez, Eur. Phys. J. C 79, 223 (2019), eprint 1811.05466.
  • Artamonov et al. (2009) A. V. Artamonov et al. (BNL-E949), Phys. Rev. D 79, 092004 (2009), eprint 0903.0030.
  • Izaguirre et al. (2017) E. Izaguirre, T. Lin, and B. Shuve, Phys. Rev. Lett. 118, 111802 (2017), eprint 1611.09355.
  • Carra et al. (2021) S. Carra, V. Goumarre, R. Gupta, S. Heim, B. Heinemann, J. Kuechler, F. Meloni, P. Quilez, and Y.-C. Yap, Phys. Rev. D 104, 092005 (2021), eprint 2106.10085.
  • Bonilla et al. (2022) J. Bonilla, I. Brivio, J. Machado-Rodríguez, and J. F. de Trocóniz, JHEP 06, 113 (2022), eprint 2202.03450.