Amides inventory towards the G+0.693-0.027 molecular cloud
Abstract
Interstellar amides have attracted significant attentions as they are potential precursors for a wide variety of organics essential to life. However, our current understanding of their formation in space is heavily based on observations in star-forming regions and hence the chemical networks lack the constraints on their early origin. In this work, unbiased sensitive spectral surveys with IRAM 30m and Yebes 40m telescopes are used to systematically study a number of amides towards a quiescent Galactic Centre molecular cloud, G+0.693-0.027. We report the first detection of acetamide (CH3C(O)NH2) and trans-N-methylformamide (CH3NHCHO) towards this cloud. In addition, with the wider frequency coverage of the survey, we revisited the detection of formamide (NH2CHO) and urea (carbamide; NH2C(O)NH2), which had been reported previously towards G+0.693-0.027. Our results are compared with those present in the literature including recent laboratory experiments and chemical models. We find constant abundance ratios independently of the evolutionary stages, suggesting that amides related chemistry is triggered in early evolutionary stages of molecular cloud and remain unaffected by the warm-up phase during the star formation process. Although a correlation between more complex amides and NH2CHO have been suggested, alternative formation routes involving other precursors such as acetaldehyde (CH3CHO), methyl isocyanate (CH3NCO) and methylamine (CH3NH2) may also contribute to the production of amides. Observations of amides together with these species towards a larger sample of sources can help to constrain the amide chemistry in the interstellar medium.
keywords:
ISM: molecules – ISM: clouds – Galaxy: centre – galaxies: ISM – astrochemistry – line: identification1 Introduction
Amides are chemical species that contain a carbonyl group linked to a nitrogen atom (RC(=O)N), which can also be referred to as peptide bonds during the formation of proteins, where a large number of amino acids bind with each other through peptide chains. Amides are thus among the essential components in the fundamental building blocks of life that make up the structural components of living cells and regulate biochemical processes (Ruiz-Mirazo et al., 2014). The presence of amino acids on the prebiotic Earth is widely accepted, either coming from endogenous chemical processes (e.g. Patel et al., 2015) or forming in the interstellar medium (ISM), and with their subsequent delivery to Earth (e.g. Altwegg et al., 2016). As such, understanding the formation of amides in the ISM can be relevant for studying the chemical origin of life.
Formamide (NH2CHO) was the first amide detected in the ISM (towards Sgr B2; Rubin et al., 1971) and has then been robustly detected in several star-forming regions (see e.g. very recent observations by Colzi et al., 2021; Ligterink et al., 2020; Ligterink et al., 2022, and see review by López-Sepulcre et al. 2019 for a detailed list of astronomical observations). Ever since the detection of formamide, amides with increasing complexity such as acetamide (CH3C(O)NH2; Hollis et al., 2006; Halfen et al., 2011; Belloche et al., 2017; Ligterink et al., 2020; Ligterink et al., 2022; Colzi et al., 2021), and N-methylformamide (CH3NHCHO; Belloche et al., 2017; Ligterink et al., 2020; Ligterink et al., 2022; Colzi et al., 2021) have been detected in the ISM, although mostly exclusively towards high-mass star-forming regions. The detection of another amide, urea (aka carbamide, NH2C(O)NH2), has also been confirmed towards the Galactic Centre (GC) source Sgr B2(N1) (Belloche et al., 2019) and the molecular cloud G+0.693-0.027 (Jiménez-Serra et al., 2020). However, searches of more complex amides such as cyanoformamide (NH2COCN) and glycolamide (HOCH2C(O)NH2) in the ISM have been attempted without success (Colzi et al., 2021; Ligterink et al., 2022; Sanz-Novo et al., 2022).
To get insight into how complex the interstellar chemistry is and what prebiotic molecules can be synthesised in space, it is essential to understand the chemical processes that result in the formation of simpler amides detected in the ISM. For the aforementioned amides, both gas-phase and grain formation routes have been discussed to explain their observed abundance in the regions where they reside (e.g. Jones et al., 2011; Skouteris et al., 2017; Quénard et al., 2018; Belloche et al., 2019; Douglas et al., 2022; Garrod et al., 2022).
For example, tight column density correlation is found between NH2CHO and CH3C(O)NH2, which might indicate these two species are formed through related chemical processes or have the same responses to similar physical conditions (Colzi et al., 2021; Ligterink et al., 2022). However, detection of several amides from the same regions are still relatively sparse and they are biased towards the physical conditions of star-forming regions. The chemical networks that include amides may therefore lack of further constraints to elucidate the chemical link between these species and the interplay with the physical conditions especially at earliest stage of star formation.
In this work, the most complete inventory of amide species is investigated in detail towards the quiescent molecular cloud G+0.693-0.027 (hereafter G+0.693). G+0.693 is located within the Sgr B2 star-forming complex in the center of our Galaxy. Despite the fact it does not shown signs of on-going star-formation activity (Zeng et al., 2020), it represents one of the most chemically rich sources in our Galaxy. With plentiful of nitrogen-bearing species detected towards G+0.693, the family of nitrile (CN) and amines (NH2) as well as several complex organic molecules (COMs) that are of pre-biotic interest have also been reported in previous studies (Zeng et al., 2018; Rivilla et al., 2019, 2020, 2021a, 2021b, 2022b; Bizzocchi et al., 2020; Rodríguez-Almeida et al., 2021a; Zeng et al., 2021). Following up the detection of NH2CHO (Zeng et al., 2018) and NH2C(O)NH2 (Jiménez-Serra et al., 2020), additional transitions of these species along with the first detection of CH3C(O)NH2 and CH3NHCHO towards G+0.693 is presented in Section 2 and 3. The possible formation routes for each amide are discussed in 4 whilst the conclusions are given in Section 5.
| Molecule | FWHM | ||||
| (K) | (km s-1) | (km s-1) | (1013 cm -2) | (10-10) | |
| NH213CHO | 5.00.3 | 69.10.6 | 211 | 0.620.04 | 0.460.03 |
| NH2CHOc | - | - | - | 251 | 181 |
| CH3C(O)NH2 A | 7.40.2 | 68.70.3 | 19.50.6 | 3.40.1 | 2.500.07 |
| CH3C(O)NH2 E | 7.80.1 | 68.70.2 | 21.60.4 | 8.10.1 | 6.00.1 |
| CH3C(O)NH2 (A+E) | - | - | - | 11.50.2 | 8.50.1 |
| trans-CH3NHCHO | 7.10.4 | 68.20.5 | 191 | 4.30.4 | 3.20.3 |
| NH2C(O)NH2 | 8.00.7 | 69d | 20b | 0.710.05 | 0.520.05 |
-
a
=1.351023 cm-2 (Martín et al., 2008).
-
b
Value of FWHM fixed in the madcuba fit.
-
c
Column density and abundance derived from the 13C-isotopologue by multiplying 12C/13C=40 (Colzi et al. in prep).
-
d
Value of fixed in the madcuba fit.
2 Observations
The high-sensitivity spectral surveys towards G+0.693 molecular cloud were carried out with IRAM 30 m111IRAM is supported by INSU/CNRS (France), MPG (Germany), and IGN (Spain) and Yebes 40 m222The 40 m radiotelescope at Yebes Observatory is operated by the Spanish Geographic Institute (IGN, Ministerio de Transportes, Movilidad y Agenda Urbana.) http://rt40m.oan.es/rt40men.php telescopes. The IRAM 30 m observations were performed during three sessions in 2019: 1016th of April, 1319th of August, and 1115th of December whilst the observations with the Yebes 40 m telescope were carried out through project 20A008 between 39th and 1522nd of February 2020. The observations were centred at (J2000) = 17h47m22s, (J2000) = -28∘21′27′′. The position switching mode was used in all observations with the reference position located at , = 885′′,290′′ with respect to the source position. The IRAM 30 m observations covered the frequency ranges of 71.8116.7 GHz, 124.8175.5 GHz, 199.8222.3 GHz, and 223.3238.3 GHz. The halfpower beam width (HPBW) of the telescope spanned between 34. The spectral coverage of Yebes 40 m observations ranged from 31.3 GHz to 50.6 GHz. The HPBW of the telescope was in a range of 54. The data from both surveys were smoothed to a velocity resolution of 1.02.6 km s-1 and the intensity was measured in the unit of antenna temperature, T, as the molecular emission towards G+0.693 is extended over the beam (Requena-Torres et al., 2006; Requena-Torres et al., 2008; Zeng et al., 2020). Depending on the frequency, the noise of the spectra for the Yebes 40 m data is 1.0 mK, whilst in some intervals can increase up to 4.05.0 mK; whereas 1.3 to 2.8 mK (7190 GHz), 1.5 to 5.8 mK (90115 GHz), 10 mK (115116 GHz), 3.1 to 6.8 mK (124175 GHz), and 4.5 to 10.6 mK (199238 GHz), for the IRAM 30 m data. More detailed information of these observations is provided in Zeng et al. (2020); Rodríguez-Almeida et al. (2021b).
3 Analysis and results
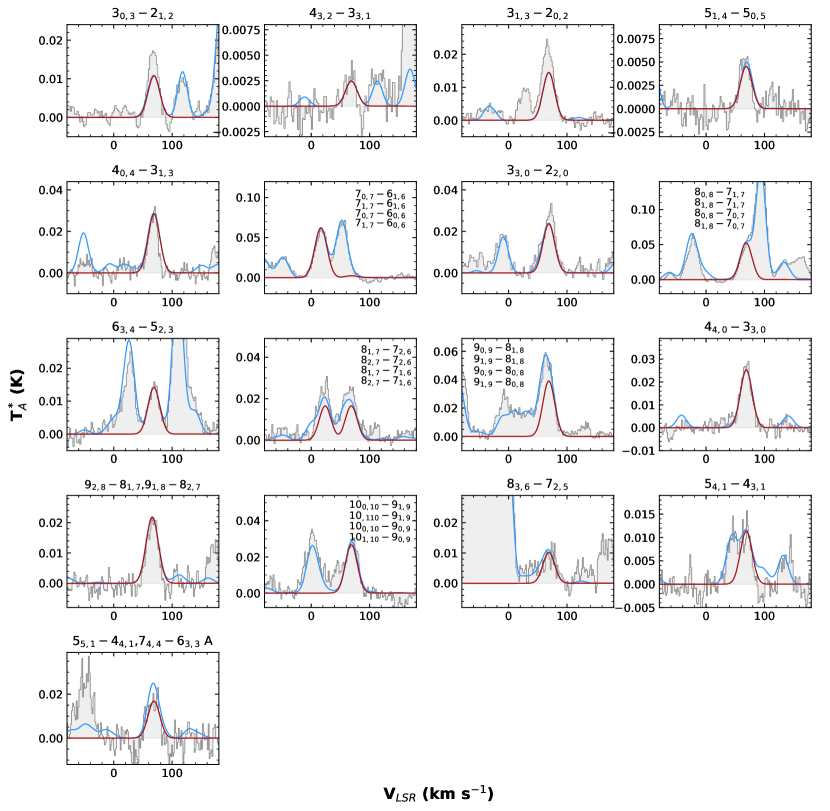
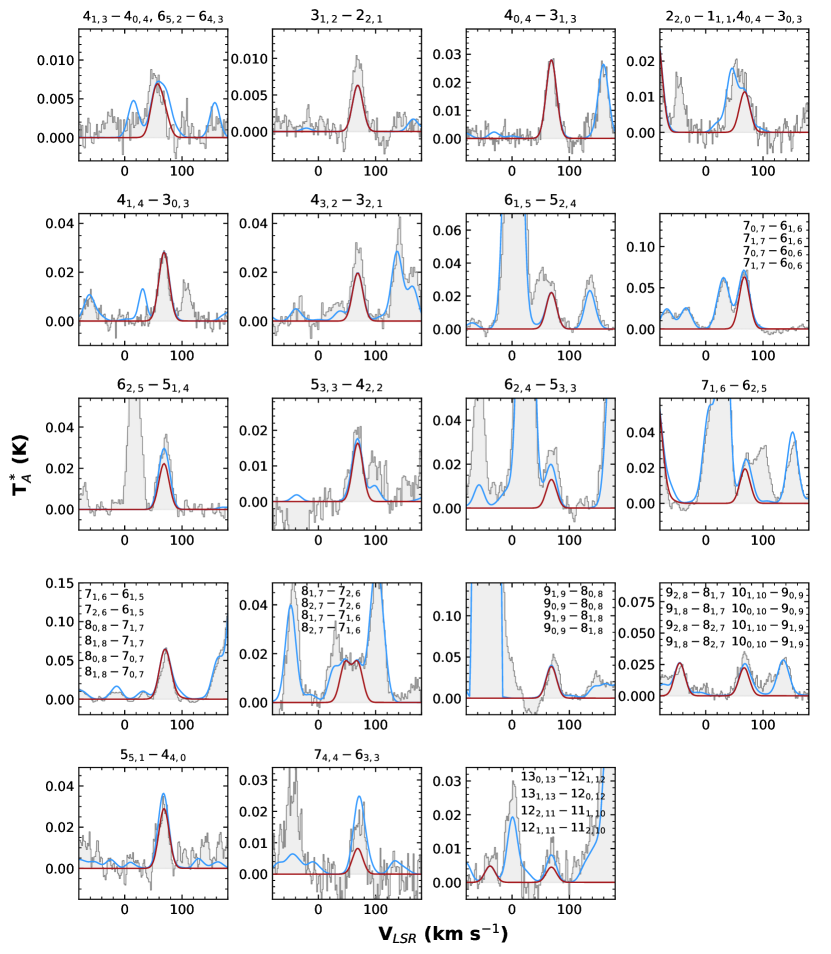
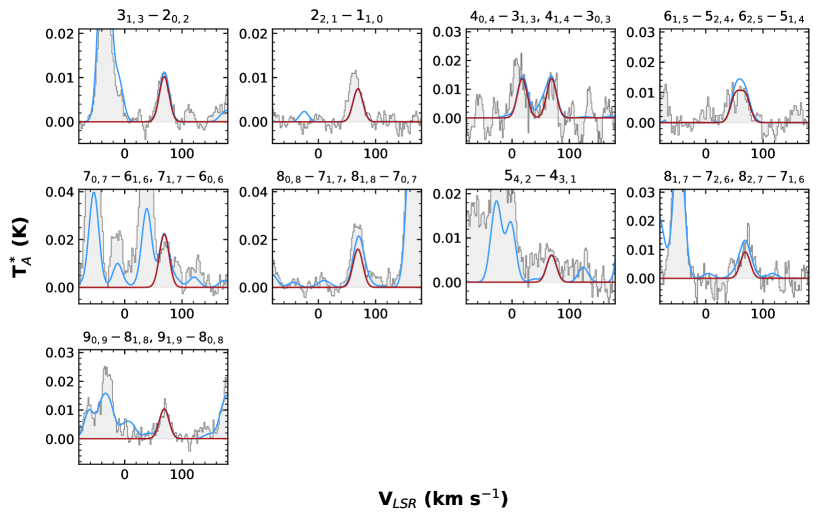
The line identification and the analysis were carried out using the SLIM (Spectral Line Identification and Modelling) tool implemented within the madcuba package333Madrid Data Cube Analysis on ImageJ is a software developed at the Center of Astrobiology (CAB) in Madrid; http://cab.inta-csic.es/madcuba/(version 10/03/2022, Martín et al., 2019). SLIM uses the spectroscopic entries from the Cologne Database for Molecular Spectroscopy444https://cdms.astro.uni-koeln.de/classic/ (CDMS, Endres et al., 2016), the Jet Propulsion Laboratory555https://spec.jpl.nasa.gov/ftp/pub/catalog/catdir.html (JPL, Pickett et al., 1998), and our own database with added entries for species that are not included in the previous catalogue by using available spectroscopic literature. SLIM generates synthetic spectra under the assumption of Local Thermodynamic Equilibrium (LTE) conditions and taking into account the line opacity. For the molecules presented in this work, the spectroscopic information is given in Table 2 in Appendix A. In order to properly evaluate the potential line contamination, the emission from over 125 molecules identified towards G+0.693 have been considered (Requena-Torres et al., 2006; Requena-Torres et al., 2008; Rivilla et al., 2018, 2019, 2020, 2021a, 2021b, 2022a, 2022b, 2022c; Bizzocchi et al., 2020; Jiménez-Serra et al., 2020, 2022; Rodríguez-Almeida et al., 2021a, b; Zeng et al., 2018, 2021). The AUTOFIT tool of SLIM was used to provide the best non-linear least-squares LTE fit to the data using the Levenberg-Marquardt algorithm, which provides the value and uncertainty of the physical parameters for each molecular species (see detailed description in Martín et al., 2019). The free parameters of the model are: molecular column density (), excitation temperature (), central radial velocity (), and full width half maximum (FWHM). Figure 15 present, in the order of increasing rest frequency, the unblended or slightly blended transitions of the molecules studied in this work. The emission of the other transitions as predicted by LTE are consistent with the fitted spectra, but they are severely blended with lines arising from other molecular species. The fitting parameters together with the derived column density and the molecular abundance with respect to molecular hydrogen, assuming =1.351023 cm-2 (Martín et al., 2008), of each molecule are summarised in Table 1. The transitions used for the LTE fits are listed in Table LABEL:tab:mol_trans.
3.1 New detections
Acetamide (CH3C(O)NH2)
Acetamide (CH3C(O)NH2) is an asymmetric top molecule that has an internal rotation of the methyl group, making its spectrum complicated. The dipole moments of CH3C(O)NH2 are =1.14 D and =3.5 D (Hollis et al., 2006). In this work, both a and btype transitions at the ground torsional state were detected but b-type were predominant. For clarity, we adopt the same labelling convention JJ for the A and Estates of acetamide as Hollis et al. (2006). Out of 79 unblended or slightly blended transitions, the energy range covered in the 34 Estate transitions (Figure 1) and the 45 Astate transitions (Figure 2) is Eu=9.735.7 K and Eu=3.048.2 K respectively. The best LTE fit finds good agreement in excitation conditions between A and Estate transitions. For Estate, =7.80.1 K, =68.70.2 km s-1 and FWHM=21.60.4 km s-1 whilst for Astate, =7.40.2 K, =68.70.3 km s-1, and FWHM=19.50.6 km s-1. The derived column density for E and Astate is =(8.11013 cm-2 and =(3.41013 cm-2 respectively, yielding an E/A ratio of 2.40.1 towards G+0.693 which is in agreement with the one, E/A = 1.9, derived from the colder more extended molecular gas towards Sgr B2(N) at an excitation temperature of 5.8 K (Remijan et al., 2022). In contrast, an E/A ratio of 0.75 is obtained from the hot core region towards Sgr B2(N) at an excitation temperature of 170 K (Belloche et al., 2013). While the E/A ratio of CH3C(O)NH2 seems to vary with the excitation temperature, more detections of both E- and A-type CH3C(O)NH2 are needed to reach a conclusion. The total column density by summing up both states is =(1.150.02)1014 cm-2, which translates to a molecular abundance of (8.50.1)10-10.
Trans-N-methylformamide (CH3NHCHO)
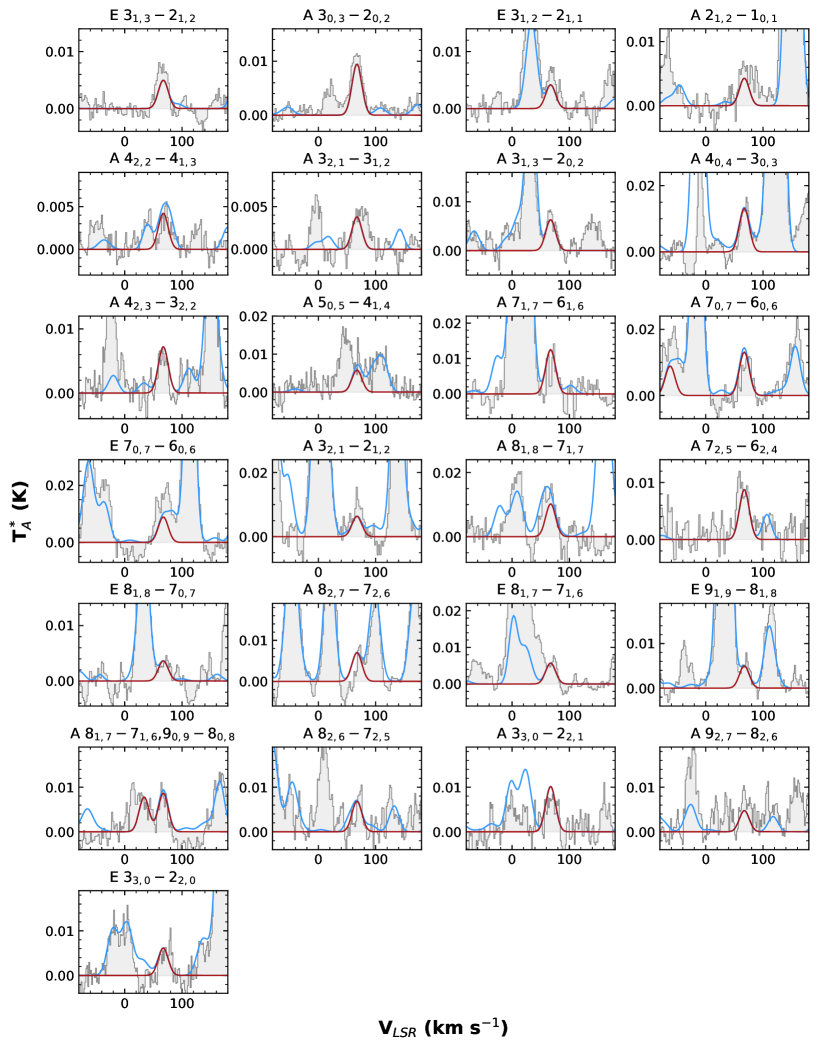
N-methylformamide is an isomer of CH3C(O)NH2 and it exists in two forms, trans and cis, with the former being more stable (by 466 cm-1 or 666 K; Kawashima et al., 2010). In this work, both E and Astate transitions from the ground torsional state of transNCH3NHCHO are detected. Unlike CH3C(O)NH2, the same physical parameters as well as column densities were derived from both E and Astate transCH3NHCHO. In total, 26 unblended or slightly blended transitions, 7 Estate transitions and 19 Astate transitions, were detected towards G+0.693 (Figure 3). The upper state energy ranges in Eu=2.228.2 K. The best LTE fit gives =7.10.4 K, =68.20.5 km s-1, FWHM=191 km s-1, and =(4.31013 cm-2. This translates into a molecular abundance of (3.20.3)10-10.
3.2 Revisit
Formamide (NH2CHO)
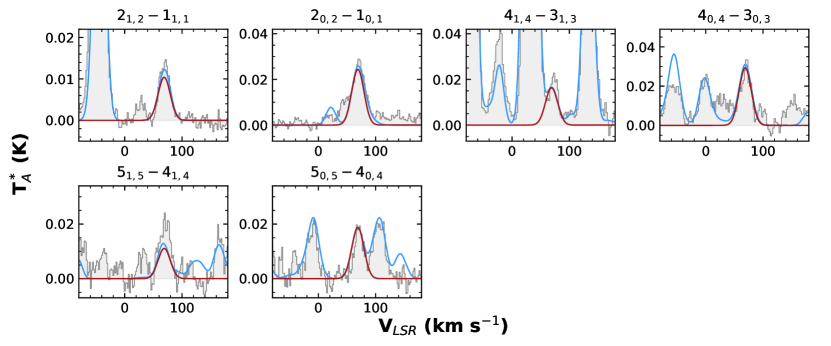
The detection of formamide (NH2CHO) was reported towards G+0.693 by Zeng et al. (2018). However, with the new dataset used in this study, it is confirmed that the NH2CHO emission suffers from optical depth effect. Therefore, we have derived the column density of NH2CHO using the optically thin 13C isotopologue. Six unblended or slightly blended transitions (Eu = 3.115.2 K; Figure 4) are identified. The best-fit parameters obtained by AUTOFIT are =5.00.3 K, =69.10.6 km s-1, FWHM=211 km s-1, and =(6.20.4)1012 cm-2. Assuming 12C/13C=40 measured in G+0.693 by Colzi et al. (in prep.), the inferred column density for NH2CHO is (2.50.1)1014 cm-2 and the corresponding molecular abundance for NH2CHO is of (1.80.1)10-9.
3.3 Urea (NH2C(O)NH2)
Urea (NH2C(O)NH2), also known as carbamide, has a dipole moment of ==3.83 D (Brown et al., 1975). A total of 15, among which 8 transitions have already been reported by Jiménez-Serra et al. (2020), unblended or slightly blended transitions were detected towards G+0.693. The upper state energy ranges Eu=2.925.7 K. With and FWHM fixed to 69 km s-1 and 20 km s-1, the best LTE fit gives =8.00.7 K and =(7.11012 cm-2. This translates into a molecular abundance of (5.20.5)10-11, which is consistent to that reported by Jiménez-Serra et al. (2020).
4 Discussion
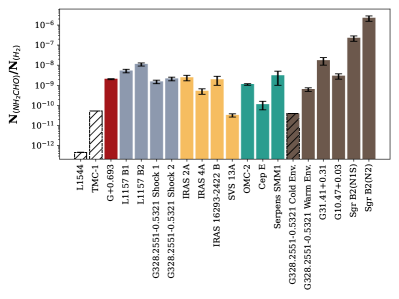
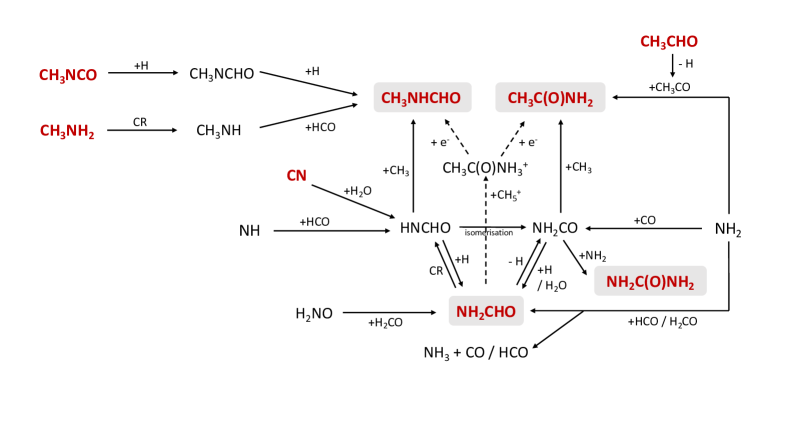
The amides detection presented in Section 3 has not only expanded the number of species identified in G+0.693, but also offers an opportunity to study the chemical processes leading to amides formation in a region unaffected by star formation. Although G+0.693 is located in the same molecular cloud complex as the high-mass star-forming region Sgr B2(N), the kinematic and chemical study of Zeng et al. (2020) showed that the overall distribution of molecular gas towards G+0.693 depicted a different morphology and structure to that of Sgr B2(N). Furthermore, observational signatures of a cloud-cloud collision have been detected at small scales (0.2 pc), which agrees well with previous observations at larger scales in the Sgr B2 region as reported in literature (e.g. Hasegawa et al., 1994; Tsuboi et al., 2015). As a consequence, shocks associated with the cloud-cloud collision are expected to sputter efficiently the icy grain mantles in G+0.693, subsequently ejecting materials formed on grains into the gas phase including complex organic molecules. Note that G+0.693 is located at a about 2.4 pc away in projected distance from the Sgr B2(N) high-mass star-forming region (assuming a distance of 8.178 kpc for the Galactic Centre; GRAVITY Collaboration et al., 2019), distant enough to make it unlikely that the star-formation activity of the Sgr B2(N) star cluster affects the chemistry of the G+0.693 cloud. Recent study of deuteration fractionation towards this source proposed that G+0.693 is on the verge of star formation (Colzi et al., 2022) i.e. under prestellar conditions, which is likely due to the event of a cloud-cloud collision. All this makes the conditions driving the chemistry of G+0.693 differ substantially from typical star-forming sources such as the nearby Sgr B2(N) hot core since the lack of protostellar heating implies that the thermal evaporation of ices is not yet playing a relevant role. Because amides have mostly been studied in star-forming regions, a comparison between these regions and G+0.693 could be useful to provide better constraints on the formation routes of amide species. In the following sections, comparison of molecular abundance of NH2CHO with respect to H2 is presented in Fig. 6 whilst molecular ratios with respect to NH2CHO derived towards G+0.603 are are compared to those obtained from other interstellar sources (see Fig. 7). The comparison are made primarily towards star-forming sources in which the inventory of amides has been investigated in detail. The possible formation mechanisms of amide species, as summarised in Figure 8, are discussed along with available laboratory experiments, chemical models, and theoretical studies. To clarify, the term fast, medium, and slow models mentioned in the following section is referred to the model with warm-up timescales of 5 104 yr, 2 105 yr, and 1 106 yr, respectively as they are defined in Belloche et al. (2017); Belloche et al. (2019) and Garrod et al. (2022).
4.1 Formamide
NH2CHO is the smallest molecule to contain a peptide bond and hence often considered as a potential precursor of a wide variety of organic compounds essential to life. As reviewed by López-Sepulcre et al. (2019), both theoretical and experimental studies have investigated the formation mechanism of NH2CHO. However, it is still strongly debated whether its formation is governed by gas-phase reactions or grain-surface chemistry. On grain surfaces, the popular route of successive HNCO hydrogenation (reaction 1 and 2) was ruled out by the experimental work of Noble et al. (2015) but disputed with the dual-cyclic mechanism of H-atom abstraction and addition reactions by Haupa et al. (2019).
| (1) | |||
Another frequently studied formation route on the grain surface is the radical-radical recombination of NH2 and HCO (reaction 3). It should proceed without any activation barrier; however, the two radicals are required to be in close proximity and a competing reaction (reaction 4) could lead back to the formation of NH3 and CO (Rimola et al., 2018; Chuang et al., 2022).
| (2) | |||
Similar to reaction (3), a competing H-abstraction reaction is expected for radical-molecule reaction proposed by Fedoseev et al. (2016):
| (3) | |||
Other surface reactions involving different precursors have also been proposed for the NH2CHO formation. Through quantum chemical computations, Rimola et al. (2018) suggested a series of reactions forming NH2CHO started by CN:
| (4) | |||
| (5) | |||
Laboratory experiments performed by Dulieu et al. (2019) demonstrated that NH2CHO formation is possible from barrierless hydrogenation of NO followed by the radical-radical addition reaction with H2CO (reaction 10). However, under the conditions of typical molecular cloud i.e. at 10 K, NO and H2CO are not mobile on the grain surface and hence their proximity represents the limiting factor of this formation route.
In the gas phase, reaction (5) has been studied theoretically as a gas-phase pathway (Barone et al., 2015; Skouteris et al., 2017). However, its feasibility was challenged by Song & Kästner (2016) and more recently by Douglas et al. (2022). The latter reported a significant energy barrier of the reaction and concluded that it is not an important source of NH2CHO at low temperatures in interstellar environments. Note that at high temperatures, Quénard et al. (2018) also showed that the formation of NH2CHO is dominated by grain surface reactions, thus its gas phase formation is not sufficient to reproduce the observations.
In Figure 6, the molecular abundance of NH2CHO with respect to H2 derived towards G+0.693 is compared to a diverse set of interstellar regions, including pre-stellar sources (L1544 and TMC-1), shocked regions (G+0.693, L1157, and G328.2551-0.5321 shock 1,2), low-mass (IRAS 2A, IRAS 4A, IRAS 16293-2422 B, SVS 13A), intermediate-mass (OMC-2, Cep E, Serpens SMM1), and high-mass star-forming sources (G31.41+0.31, G10.47+0.03, G328.2551-0.5321, Sgr B2N). To simplify, only sources with determined H2 column densities were selected. In line with the conclusions of Colzi et al. (2021) and Ligterink et al. (2022), the lack of detection towards pre-stellar sources and the comparable abundance of NH2CHO between shocked regions and star-forming regions reveal that NH2CHO is commonly formed in the ice mantles of grains and released back to gas-phase via non-thermal/thermal processes. In particular, the NH2CHO abundance in G+0.693 is comparable, within a factor of 6, to the ones obtained in the shocked region L1157, G328.2551-0.5321 shock 1 and 2, suggesting that molecules detected towards G+0.693 have been freshly desorbed from the dust mantles as a result of grain-sputtering. The large abundance of NH2CHO found in high-mass star-forming regions suggests that its formation could be boosted by the warm up of the grains due to star formation. However, this seems to be inconsistent with the constant abundance ratios, indicating that the formation might partly be occcuring during the pre-stellar phase as supported by recent chemical modelling (Garrod et al., 2022). In addition, relatively lower abundance of NH2CHO in low-mass and intermediate-mass star-forming regions hints at a difference in the heating timescale.

4.2 Acetamide
The formation of CH3C(O)NH2 has been suggested to be dependent on the production of NH2CHO (e.g. Hollis et al., 2006). From an observational point of view, the column density of CH3C(O)NH2 is found to tightly correlate with that of NH2CHO (e.g. Colzi et al., 2021; Ligterink et al., 2022). The origin of this correlation could indicate a direct chemical link or the same response to the environmental conditions such as temperature for HNCO and NH2CHO (Quénard et al., 2018).
Chemically, the ion-molecule reaction (reaction 11 and 12)between protonated methane (CH) and neutral NH2CHO followed by electron recombination is considered to be the most efficient process among various gas phase reactions proposed for CH3C(O)NH2 formation (Halfen et al., 2011; Redondo et al., 2014).
| (6) | |||
On the surface of dust grains, CH3C(O)NH2 is considered to be predominately formed by the addition of CH3 to NH2CO radical (reaction 13) and the latter links CH3C(O)NH2 and NH2CHO through several possible reactions.
In recent chemical models, this radical is considered to be formed by H-abstraction from NH2CHO, addition of H to HNCO, and/or radical addition of NH2 + CO (Belloche et al., 2017; Belloche et al., 2019; Garrod et al., 2022). In the case of H-abstraction from NH2CHO, Belloche et al. (2017) found a CH3C(O)NH2/NH2CHO ratio of 0.060.07 (denoted as pink shaded area in Figure 7-(a-i)). In contrast, Garrod et al. (2022) determined the ratio of 0.080.19 (denoted as brown shaded area in Figure 7-(a-i)) by considering both the H addition to HNCO and reaction of NH2 with CO in the bulk ice for the NH2CO radical production. The derived CH3C(O)NH2/NH2CHO ratio in G+0.693 is 0.430.03 which is at least a factor of two higher than the model predicted ratios. We note that these models are for hot cores where thermal desorption dominates the ejection of molecules to gas phase from grains. But since the formation of CH3C(O)NH2 is likely dominated by grain surface chemistry, some insights might be provided by making the comparison between the observational results in G+0.693 and these chemical models. In fact, several high-mass star-forming regions such as Orion KL, NGC 6334I (MM1-iv, MM2-i, and MM2-ii), and G31.41+0.31 also show CH3C(O)NH2/NH2CHO ratios close to that found in G+0.693 (see Figure 7-(a-i)). Additionally, this ratio determined towards G+0.693 is consistent with the results from laboratory experiment in which CH4–HNCO ice mixtures at 20 K were irradiated with far-UV photons to produce the radicals required for the formation of the amides (green shaded area in 7-(a-i); Ligterink et al., 2018). The resulting CH3C(O)NH2/NH2CHO ratio is 0.4 and the NH2CO radical is proposed to form via the radical addition of NH2 + CO. The good match suggests that the formation pathway of both NH2CHO and CH3C(O)NH2 on dust grains in G+0.693 are similar to the chemical processes mimicked on laboratory ices i.e. NH2CHO formed via reaction (3) and CH3C(O)NH2 formed via reaction (13), of which the NH2CO radical is the product of NH2 + CO. Therefore, both species might not be directly connected in chemistry but likely share a common chemical origin, similar to the scenario explained by Garrod et al. (2022) for HNCO and NH2CO. Since G+0.693 is shielded from direct UV irradiation, the key intermediate radicals are likely produced by cosmic ray-induced UV field instead. It is noteworthy that the reaction of NH2 + HCO is found to be negligible compared with both the abstraction of hydrogen from NH2CHO and the addition of H to HNCO in chemical models by setting a typical value of activation energy barrier to 2500 K (Belloche et al., 2019). Therefore, constraining the activation barriers and rate coefficient of the processes that lead to NH2CO, the key intermediate, is one essential step to better elucidate the formation of CH3C(O)NH2.
In the literature, there are other alternative mechanisms proposed for the formation of CH3C(O)NH2. For instance, one involves addition of NH2 radical to CH3CO (reaction (14)), which may also be important to form CH3C(O)NH2 on dust grain surfaces (Belloche et al., 2017; Ligterink et al., 2018; Belloche et al., 2019; Garrod et al., 2022).
The CH3CO could be formed by H-abstraction of acetaldehyde (CH3CHO) which is similar to the H abstraction of NH2CHO. Towards G+0.693, the abundance of CH3CHO is derived to be 3.710-9 (Sanz-Novo et al., 2022) and it is approximately as abundant as NH2CHO. Therefore the formation pathway of NH2 + CH3CO seems to be feasible in G+0.693. In the study of Ligterink et al. (2018), CH3CHO was not detected in the laboratory experiments which raised the speculation of this formation route to proceed on ices, but it could not be completely ruled out. In recent chemical models (see brown shaded area in Figure 7-(a-ii) Belloche et al., 2019; Garrod et al., 2022), this formation route is included as modest contribution to form CH3C(O)NH2 and it is found to become important at around T=50 K in a slow warm-up model. However, the ratio of CH3C(O)NH2/CH3CHO does not vary significantly (within a factor of 5) between G+0.693, whose dust temperature typically lie below 20 K (Rodríguez-Fernández et al., 2004; Guzmán et al., 2015), and star-forming sources (Figure 7-(a-ii)). The comparison here points towards the idea that reaction (14) may have contribution to the formation of CH3C(O)NH2 but not the dominant mechanism on the grain surface.
4.3 Trans-N-methylformamide
As for the trans-N-CH3NHCHO/NH2CHO ratio, a scatter of less than a factor of 3, except Sgr B2(N2), is found across various sources. The consistent results between G+0.693 and star-forming sources indicates that the tentative correlation between trans-N-CH3NHCHO and NH2CHO hold also at an early stage of star formation and the formation route of trans-N-CH3NHCHO could be similar among all these sources.
On grain surfaces, trans-N-CH3NHCHO is considered to be linked to NH2CHO by the reaction of HNCHO + CH3 (Belloche et al., 2017; Ligterink et al., 2018; Garrod et al., 2022):
The HNCHO radical is an isomer of NH2CO. Although it is unclear how these two species differ in term of reactivity, HNCHO should be more stable than NH2CO since the molecular orbital of the unpaired electron held by the nitrogen atom could be stabilised by hyperconjugation by the CO bond (J. Garcia de la Concepcion, private communication). HNCHO can be formed via the radical addition of NH + CHO, but H-addition yielding NH2CHO is expected to occur subsequently. Whilst H-abstraction from NH2CHO seems to strongly favour the production of NH2CO (Belloche et al., 2017), cosmic ray-induced photo-dissociation of NH2CHO as another possible formation route of HNCHO (Belloche et al., 2017; Ligterink et al., 2018). Consequently, the production of trans-N-CH3NHCHO largely depend on the availability of HNCHO which may not be formed efficiently or could be easily consumed in the formation of other molecules. As indicated in brown shaded area and yellow dashed line in the upper-middle panel of Figure 7-(b-i), chemical models yield a ratio of trans-N-CH3NHCHO/NH2CHO nearly an order of magnitude lower than the observational values.
In the chemical model of Belloche et al. (2017), trans-N-CH3NHCHO is proposed to also form via hydrogenation of methyl isocyanate (CH3NCO):
| (7) | |||
However, Ligterink et al. (2018) have cast doubt on this pathway based on the non-detection of trans-N-CH3NHCHO in laboratory ice experiments whilst CH3NCO was formed abundantly. With the secure detection of trans-N-CH3NHCHO for the first time in ISM towards Sgr B2 (N1S), chemical models of Belloche et al. (2019) indicated that hydrogenation dominates in trans-N-CH3NHCHO formation. The best matching model resulted in a trans-N-CH3NHCHO/CH3NCO ratio of 0.23 which is denoted as yellow dashed line in Figure 7-(b-ii). The ratio obtained from observations towards different sources is consistent within the uncertainties of the modelling results, implying that the hydrogenation of CH3NCO is one plausible source of trans-N-CH3NHCHO production on grain surfaces. The same chemical network of trans-N-CH3NHCHO has also been adopted in Garrod et al. (2022), but the trans-N-CH3NHCHO/CH3NCO ratio ranged between 7 to 24. The authors noted that the activation-energy barriers of the grain-surface reaction for CH3NCO production are poorly defined, which results in substantially under-production of CH3NCO.
Alternatively, Frigge et al. (2018) demonstrated the formation of trans-N-CH3NHCHO via reaction (18) in a mixture of methylamine (CH3NH2) and CO ices where the HNCH3 radical is created from CH3NH2 by irradiation with energetic electrons i.e. by simulating cosmic rays.
Using the column density of CH3NH2 derived towards G+0.693 by Zeng et al. (2018), the CH3C(O)NH2/CH3NH2 ratio is 0.01. The comparison of this ratio is currently not available as detections of CH3NH2 are very limited in the literature, especially towards the same emitting regions with similar spatial resolution. For instance, CH3NH2 has been reported towards Sgr B2(N) using single-dish observations (Belloche et al., 2013) whilst the emission of trans-N-CH3NHCHO is detected towards Sgr B2(N1S) and Sgr B2(N2) with ALMA (Belloche et al., 2019). Furthermore, high abundance of trans-N-CH3NHCHO has been reported in G31.41 but the existence of CH3NH2 is not yet clear (Ohishi et al., 2019). Increasing the number of trans-N-CH3NHCHO detections together with NH2CHO, CH3NCO, and CH3NH2 will better constrain the chemical models and unravel the contributions of different formation pathways.
4.4 Urea
Up to date, G+0.693 is the only other source besides Sgr B2(N1S) where NH2C(O)NH2 is securely detected (Belloche et al., 2019; Jiménez-Serra et al., 2020). In this work, the derived NH2C(O)NH2/NH2CHO ratio is 0.0300.003 which is consistent to the tentative detection towards NGC 6334I MM1-v (0.03 Ligterink et al., 2020) but a factor of 3 higher than the one obtained in Sgr B2(N1S) (0.009; Belloche et al., 2019). The comparison is shown in Figure 7-(c).
The chemical model by Belloche et al. (2019) considered NH2C(O)NH2 is formed directly by reaction (19) in the grain-surface ices:
It has also been suggested to be one of the most promising formation pathways for NH2C(O)NH2 in both experimental and computational studies (Ligterink et al., 2018; Slate et al., 2020). However, as mentioned in Section 4.2, the formation of NH2CO radical is still a subject of debate. Unlike the case of CH3C(O)NH2, there is no information about the relative abundance between NH2C(O)NH2 and NH2CHO in the laboratory experiment by Ligterink et al. (2018). Thus, it is unclear if a consistent result can be found between observation towards G+0.693 and the experimental studies for NH2C(O)NH2. On the other hand, the NH2C(O)NH2/NH2CHO ratio derived in G+0.693 is marginally consistent with the value estimated by the fast model of Belloche et al. (2019) (0.039; see yellow dotted line in Figure 7-(c)). However, the ratio from the medium model of Garrod et al. (2022), which appears to reproduce best other amide species, is at least a factor of a few higher than observed. This indicates that the formation pathways considered may be too efficient on the grains. It was pointed out by the authors that a higher barrier to the production of NH2 from H-abstraction of ammonia and an efficient destruction route in the gas phase would help to ameliorate the disagreement. Furthermore, the fast model of Belloche et al. (2019) revealed that the solid-phase urea is seen to be produced most strongly after around 55 K, which is the temperature of rapid production and diffusion of NH2 radical. Owing to the fact that the dust temperature in G+0.693 is low, a higher ratio of NH2C(O)NH2/NH2CHO derived towards G+0.693 in comparison to Sgr B2 (N1S) suggests that either another formation route might at play at lower temperatures, or a destruction route at high temperature in the gas phase.
Besides radicals, formation pathways involving charged species have been put forward to produce NH2C(O)NH2 in the ISM. Theoretical calculation by Jeanvoine & Spezia (2019) proposed that the reaction of protonated hydroxylamine (NH2OH) with neutral NH2CHO could be one alternative route. Whilst the authors concluded that this pathway would not be readily accessible in the gas phase without certain conditions being met, the presence of ice mantle may facilitate the overall reaction process. The neutral hydroxylamine (NH2OH) is detected with an abundance of 2.110-10 (Rivilla et al., 2020) towards G+0.693, but it is unclear how efficient its cation can be formed on grain surfaces. In addition, the ion-molecule reaction between N-protonated isocyanic acid (H2NCO+) and NH3 have considered to be responsible for the NH2C(O)NH2 formation, both in the gas phase and solid state (Slate et al., 2020, and references therein). With the H2NCO+ abundance of 10-11 derived towards G+0.693 (Rodríguez-Almeida et al., 2021a), which is lower than the one derived for NH2C(O)NH2, this route therefore does not appears to be viable in G+0.693.
At present, the formation of NH2C(O)NH2 in the ISM is best described by the particular radical-radical reaction of NH2CO and NH2. Further exploration of not only ion-molecule reactions on the grain surfaces but also gas-phase formation route of NH2C(O)NH2, which has not been given a great deal of attention, are required to improve our understanding of the NH2C(O)NH2 chemistry in the ISM.
5 Conclusions
In this work the amide inventory of the Galactic Centre molecular cloud G+0.693 is studied. As a molecular cloud that is proposed to be on the verge of star formation, G+0.693 is a well-suited testbed to study the interstellar chemistry at an early evolutionary stage. With high-sensitivity observations, the robust detection of all NH2CHO, CH3C(O)NH2, trans-N-CH3NHCHO, and NH2C(O)NH2 is reported, for the first time, towards a region that does not show any star-formation activities. Abundances of amides, derived with respect to H2 and NH2CHO, are compared with those obtained across various astronomical sources. The column density ratios of amide species with respect to NH2CHO do not vary more than an order of magnitude regardless of physical conditions of different sources. This suggests that they are either chemically linked to NH2CHO or share a common chemical origin with NH2CHO. Based on the current available literature, the formation pathway of the amide species discussed in the study are generally dominated by grain surface chemistry but the specific chemical process(es) are unclear. However the rather constant abundance ratios found between G+0.693 and star-forming regions suggests that the amide related chemistry, which drives the observed relative abundances, are already set in early evolutionary stages of molecular cloud, and star formation process neither destroys these ratios, nor enhances them through the warm up process. One way to gain insight would be by constraining the formation route of the key precursor, the NH2CO radical. Considering that several precursors have been detected in G+0.693, attention should not be limited to NH2CHO but should be to alternative routes involving other molecular species. The prolific amide inventory in G+0.693 confirms it is one of the largest molecular repositories of very complex molecules in the Galaxy.
Acknowledgements
We would like to thank Miguel Sanz-Novo and Juan García de la Concepción for helpful discussions. We thank the anonymous referee for a constructive report that improved the quality of this manuscript. We are grateful to the IRAM 30m telescope staff for their help during the different observing runs. IRAM is supported by INSU/CNRS (France), MPG (Germany) and IGN (Spain). We thank Arnaud Belloche and Vadim Ilyushin for providing us the spectroscopic entry of CH3C(O)NH2 and trans-N-CH3NHCHO. V.M.R. has received support from the project RYC2020-029387-I funded by MCIN/AEI /10.13039/501100011033, and from the Comunidad de Madrid through the Atracción de Talento Investigador Modalidad 1 (Doctores con experiencia) Grant (COOL: Cosmic Origins Of Life; 2019-T1/TIC-5379). I.J.-S., J.M.-P. and L. C. acknowledge support from grant No. PID2019-105552RB-C41 by the Spanish Ministry of Science and Innovation/State Agency of Research MCIN/AEI/10.13039/501100011033 and by "ERDF A way of making Europe". P.d.V. and B.T. thank the support from the Spanish Ministerio de Ciencia e Innovacion (MICIU) through project PID2019-107115GB-C21. B.T. also acknowledges the Spanish MICIU for funding support from grant PID2019-106235GB-I00.
Data Availability
The data underlying this article will be shared on reasonable request to the corresponding author.
References
- Altwegg et al. (2016) Altwegg K., et al., 2016, Science Advances, 2, e1600285
- Barone et al. (2015) Barone V., Latouche C., Skouteris D., Vazart F., Balucani N., Ceccarelli C., Lefloch B., 2015, MNRAS, 453, L31
- Belloche et al. (2013) Belloche A., Müller H. S. P., Menten K. M., Schilke P., Comito C., 2013, A&A, 559, A47
- Belloche et al. (2017) Belloche A., et al., 2017, A&A, 601, A49
- Belloche et al. (2019) Belloche A., Garrod R. T., Müller H. S. P., Menten K. M., Medvedev I., Thomas J., Kisiel Z., 2019, A&A, 628, A10
- Bizzocchi et al. (2020) Bizzocchi L., et al., 2020, A&A, 640, A98
- Blanco et al. (2006) Blanco S., López J. C., Lesarri A., Alonso J. L., 2006, Journal of the American Chemical Society, 128, 12111
- Bonfand et al. (2017) Bonfand M., Belloche A., Menten K. M., Garrod R. T., Müller H. S. P., 2017, A&A, 604, A60
- Bouscasse et al. (2022) Bouscasse L., Csengeri T., Belloche A., Wyrowski F., Bontemps S., Güsten R., Menten K. M., 2022, A&A, 662, A32
- Brown et al. (1975) Brown R. D., Godfrey P. D., Storey J., 1975, Journal of Molecular Spectroscopy, 58, 445
- Cernicharo et al. (2016) Cernicharo J., et al., 2016, A&A, 587, L4
- Chuang et al. (2022) Chuang K. J., Jäger C., Krasnokutski S. A., Fulvio D., Henning T., 2022, ApJ, 933, 107
- Colzi et al. (2021) Colzi L., et al., 2021, A&A, 653, A129
- Colzi et al. (2022) Colzi L., et al., 2022, ApJ, 926, L22
- Coutens et al. (2016) Coutens A., et al., 2016, A&A, 590, L6
- Douglas et al. (2022) Douglas K. M., Lucas D., Walsh C., West N. A., Blitz M. A., Heard D. E., 2022, arXiv e-prints, p. arXiv:2208.12658
- Dulieu et al. (2019) Dulieu F., Nguyen T., Congiu E., Baouche S., Taquet V., 2019, MNRAS, 484, L119
- Endres et al. (2016) Endres C. P., Schlemmer S., Schilke P., Stutzki J., Müller H. S. P., 2016, Journal of Molecular Spectroscopy, 327, 95
- Fedoseev et al. (2016) Fedoseev G., Chuang K. J., van Dishoeck E. F., Ioppolo S., Linnartz H., 2016, MNRAS, 460, 4297
- Frigge et al. (2018) Frigge R., et al., 2018, ApJ, 862, 84
- GRAVITY Collaboration et al. (2019) GRAVITY Collaboration et al., 2019, A&A, 625, L10
- Gardner et al. (1980) Gardner F. F., Godfrey P. D., Williams D. R., 1980, MNRAS, 193, 713
- Garrod et al. (2022) Garrod R. T., Jin M., Matis K. A., Jones D., Willis E. R., Herbst E., 2022, ApJS, 259, 1
- Gorai et al. (2020) Gorai P., Bhat B., Sil M., Mondal S. K., Ghosh R., Chakrabarti S. K., Das A., 2020, ApJ, 895, 86
- Guzmán et al. (2015) Guzmán A. E., Sanhueza P., Contreras Y., Smith H. A., Jackson J. M., Hoq S., Rathborne J. M., 2015, ApJ, 815, 130
- Halfen et al. (2011) Halfen D. T., Ilyushin V., Ziurys L. M., 2011, ApJ, 743, 60
- Hasegawa et al. (1994) Hasegawa T., Sato F., Whiteoak J. B., Miyawaki R., 1994, ApJ, 429, L77
- Haupa et al. (2019) Haupa K. A., Tarczay G., Lee Y.-P., 2019, Journal of the American Chemical Society, 141, 11614
- Hirota et al. (1974) Hirota E., Sugisaki R., Nielsen C. J., Sørensen G. O., 1974, Journal of Molecular Spectroscopy, 49, 251
- Hollis et al. (2006) Hollis J. M., Lovas F. J., Remijan A. J., Jewell P. R., Ilyushin V. V., Kleiner I., 2006, ApJ, 643, L25
- Ilyushin et al. (2004) Ilyushin V. V., Alekseev E. A., Dyubko S. F., Kleiner I., Hougen J. T., 2004, Journal of Molecular Spectroscopy, 227, 115
- Jeanvoine & Spezia (2019) Jeanvoine Y., Spezia R., 2019, Theor Chem Acc, 138, 1
- Jiménez-Serra et al. (2020) Jiménez-Serra I., et al., 2020, Astrobiology, 20, 1048
- Jiménez-Serra et al. (2022) Jiménez-Serra I., et al., 2022, A&A, 663, A181
- Jones et al. (2011) Jones B. M., Bennett C. J., Kaiser R. I., 2011, ApJ, 734, 78
- Kasten & Dreizler (1986) Kasten W., Dreizler H., 1986, Zeitschrift Naturforschung Teil A, 41, 1173
- Kawashima et al. (2010) Kawashima Y., Usami T., Suenram R. D., Golubiatnikov G. Y., Hirota E., 2010, Journal of Molecular Spectroscopy, 263, 11
- Kretschmer et al. (1996) Kretschmer U., Consalvo D., Knaack A., Schade W., Stahl W., Dreizler H., 1996, Molecular Physics, 87, 1159
- Kryvda et al. (2009) Kryvda A. V., Gerasimov V. G., Dyubko S. F., Alekseev E. A., Motiyenko R. A., 2009, Journal of Molecular Spectroscopy, 254, 28
- Kukolich & Nelson (1971) Kukolich S. G., Nelson A. C., 1971, Chemical Physics Letters, 11, 383
- Ligterink et al. (2018) Ligterink N. F. W., Terwisscha van Scheltinga J., Taquet V., Jørgensen J. K., Cazaux S., van Dishoeck E. F., Linnartz H., 2018, MNRAS, 480, 3628
- Ligterink et al. (2020) Ligterink N. F. W., El-Abd S. J., Brogan C. L., Hunter T. R., Remijan A. J., Garrod R. T., McGuire B. M., 2020, ApJ, 901, 37
- Ligterink et al. (2022) Ligterink N. F. W., et al., 2022, ACS Earth and Space Chemistry, 6, 455
- López-Sepulcre et al. (2015) López-Sepulcre A., et al., 2015, MNRAS, 449, 2438
- López-Sepulcre et al. (2019) López-Sepulcre A., Balucani N., Ceccarelli C., Codella C., Dulieu F., Theulé P., 2019, ACS Earth and Space Chemistry, 3, 2122
- Lykke et al. (2017) Lykke J. M., et al., 2017, A&A, 597, A53
- Martín-Doménech et al. (2017) Martín-Doménech R., Rivilla V. M., Jiménez-Serra I., Quénard D., Testi L., Martín-Pintado J., 2017, MNRAS, 469, 2230
- Martín et al. (2008) Martín S., Requena-Torres M. A., Martín-Pintado J., Mauersberger R., 2008, ApJ, 678, 245
- Martín et al. (2019) Martín S., Martín-Pintado J., Blanco-Sánchez C., Rivilla V. M., Rodríguez-Franco A., Rico-Villas F., 2019, A&A, 631, A159
- Mendoza et al. (2014) Mendoza E., Lefloch B., López-Sepulcre A., Ceccarelli C., Codella C., Boechat-Roberty H. M., Bachiller R., 2014, MNRAS, 445, 151
- Moskienko & Dyubko (1991) Moskienko E. M., Dyubko S. F., 1991, Radiophysics and Quantum Electronics, 34, 181
- Motiyenko et al. (2012) Motiyenko R. A., Tercero B., Cernicharo J., Margulès L., 2012, A&A, 548, A71
- Noble et al. (2015) Noble J. A., et al., 2015, A&A, 576, A91
- Ohishi et al. (2019) Ohishi M., Suzuki T., Hirota T., Saito M., Kaifu N., 2019, PASJ, 71, 86
- Patel et al. (2015) Patel B. H., Percivalle C., Ritson D. J., Duffy C. D., Sutherland J. D., 2015, Nature Chemistry, 7, 301
- Pickett et al. (1998) Pickett H. M., Poynter R. L., Cohen E. A., Delitsky M. L., Pearson J. C., Müller H. S. P., 1998, J. Quant. Spectrosc. Radiative Transfer, 60, 883
- Quénard et al. (2018) Quénard D., Jiménez-Serra I., Viti S., Holdship J., Coutens A., 2018, MNRAS, 474, 2796
- Redondo et al. (2014) Redondo P., Barrientos C., Largo A., 2014, ApJ, 793, 32
- Remijan et al. (2014) Remijan A. J., et al., 2014, ApJ, 783, 77
- Remijan et al. (2022) Remijan A., et al., 2022, A&A, 658, A85
- Requena-Torres et al. (2006) Requena-Torres M. A., Martín-Pintado J., Rodríguez-Franco A., Martín S., Rodríguez-Fernández N. J., de Vicente P., 2006, A&A, 455, 971
- Requena-Torres et al. (2008) Requena-Torres M. A., Martín-Pintado J., Martín S., Morris M. R., 2008, ApJ, 672, 352
- Rimola et al. (2018) Rimola A., Skouteris D., Balucani N., Ceccarelli C., Enrique-Romero J., Taquet V., Ugliengo P., 2018, ACS Earth and Space Chemistry, 2, 720
- Rivilla et al. (2018) Rivilla V. M., et al., 2018, MNRAS, 475, L30
- Rivilla et al. (2019) Rivilla V. M., et al., 2019, MNRAS, 483, L114
- Rivilla et al. (2020) Rivilla V. M., et al., 2020, ApJ, 899, L28
- Rivilla et al. (2021a) Rivilla V. M., et al., 2021a, Proceedings of the National Academy of Science, 118, e2101314118
- Rivilla et al. (2021b) Rivilla V. M., et al., 2021b, MNRAS, 506, L79
- Rivilla et al. (2022a) Rivilla V. M., et al., 2022a, Frontiers in Astronomy and Space Sciences, 9, 829288
- Rivilla et al. (2022b) Rivilla V. M., et al., 2022b, Frontiers in Astronomy and Space Sciences, 9, 876870
- Rivilla et al. (2022c) Rivilla V. M., et al., 2022c, ApJ, 929, L11
- Rodríguez-Almeida et al. (2021a) Rodríguez-Almeida L. F., et al., 2021a, A&A, 654, L1
- Rodríguez-Almeida et al. (2021b) Rodríguez-Almeida L. F., et al., 2021b, ApJ, 912, L11
- Rodríguez-Fernández et al. (2004) Rodríguez-Fernández N. J., Martín-Pintado J., Fuente A., Wilson T. L., 2004, A&A, 427, 217
- Rubin et al. (1971) Rubin R. H., Swenson G. W. J., Benson R. C., Tigelaar H. L., Flygare W. H., 1971, ApJ, 169, L39
- Ruiz-Mirazo et al. (2014) Ruiz-Mirazo K., Briones C., de la Escosura A., 2014, Chemical Reviews, 114, 285
- Sanz-Novo et al. (2022) Sanz-Novo M., et al., 2022, arXiv e-prints, p. arXiv:2203.07334
- Skouteris et al. (2017) Skouteris D., Vazart F., Ceccarelli C., Balucani N., Puzzarini C., Barone V., 2017, MNRAS, 468, L1
- Slate et al. (2020) Slate E. C. S., Barker R., Euesden R. T., Revels M. R., Meijer A. J. H. M., 2020, MNRAS, 497, 5413
- Song & Kästner (2016) Song L., Kästner J., 2016, Physical Chemistry Chemical Physics (Incorporating Faraday Transactions), 18, 29278
- Stubgaard (1978) Stubgaard M., 1978, PhD thesis, Københavns Universitet
- Taquet et al. (2015) Taquet V., López-Sepulcre A., Ceccarelli C., Neri R., Kahane C., Charnley S. B., 2015, ApJ, 804, 81
- Tsuboi et al. (2015) Tsuboi M., Miyazaki A., Uehara K., 2015, PASJ, 67, 90
- Vorob’eva & Dyubko (1994) Vorob’eva E. M., Dyubko S. F., 1994, Radiophysics and Quantum Electronics, 37, 155
- Zeng et al. (2018) Zeng S., et al., 2018, MNRAS, 478, 2962
- Zeng et al. (2020) Zeng S., et al., 2020, MNRAS, 497, 4896
- Zeng et al. (2021) Zeng S., et al., 2021, ApJ, 920, L27
Appendix A Molecular spectroscopy
| Molecule | Catalogue | Entry | Date | Reference |
| NH2CHO | CDMS | 45512 | April 2013 | (1), (2), (3), (4), (5), (6), (7), (8) |
| NHCHO | CDMS | 46512 | April 2013 | (3), (6), (7), (8), (9) |
| CH3C(O)NH2 | This work | December 2020 | (10), (11) | |
| trans-N-CH3NHCHO | This work | December 2020 | (11) | |
| NH2C(O)NH2 | CDMS | 60517 | October 2017 | (12), (13), (14), (15) |
-
•
Notes. The species labelled with MADCUBA were imported into madcuba, using the spectroscopic works indicated in the table.
-
•
References. (1)Kukolich & Nelson (1971); (2)Hirota et al. (1974); (3)Gardner et al. (1980); (4)Moskienko & Dyubko (1991); (5)Vorob’eva & Dyubko (1994); (6)Blanco et al. (2006); (7)Kryvda et al. (2009); (8)Motiyenko et al. (2012); (9)Stubgaard (1978); (10)Ilyushin et al. (2004); (11)Belloche et al. (2017); (12)Remijan et al. (2014); (13)Brown et al. (1975); (14)Kasten & Dreizler (1986); (15)Kretschmer et al. (1996)
| Molecule | Frequency | Transition | logI(300K) | Eu | Blending |
|---|---|---|---|---|---|
| (GHz) | (JJ E/A) | (nm2MHz) | (K) | ||
| CH3C(O)NH2 | 32.640032 | 321,2 E | -6.344 | 9.71 | unblended or blended with U |
| CH3C(O)NH2 | 35.226603 | 433,1 E | -6.687 | 15.04 | unblended |
| CH3C(O)NH2 | 39.338502 | 320,2 E | -6.137 | 9.74 | unblended or blended with U |
| CH3C(O)NH2 | 40.755758 | 550,5 E | -6.285 | 16.67 | unblended |
| CH3C(O)NH2 | 46.534292 | 431,3 E | -5.668 | 11.98 | unblended |
| CH3C(O)NH2 | 77.317157 | 321,2 E | -6.476 | 13.45 | unblended |
| CH3C(O)NH2 | 77.329953 | 761,6 E | -4.950 | 21.64 | unblended |
| CH3C(O)NH2 | 77.330094 | 761,6 E | -6.473 | 21.64 | unblended |
| CH3C(O)NH2 | 77.331133 | 760,6 E | -6.473 | 21.64 | unblended |
| CH3C(O)NH2 | 77.331275 | 760,6 E | -4.950 | 21.64 | unblended |
| CH3C(O)NH2 | 77.900349 | 322,0 E | -5.404 | 14.90 | unblended |
| CH3C(O)NH2 | 87.604693 | 871,7 E | -4.785 | 25.85 | shoulder of HNCO and HN13CO |
| CH3C(O)NH2 | 87.604710 | 871,7 E | -6.252 | 25.85 | shoulder of HNCO and HN13CO |
| CH3C(O)NH2 | 87.604835 | 870,7 E | -6.252 | 25.85 | shoulder of HNCO and HN13CO |
| CH3C(O)NH2 | 87.604852 | 870,7 E | -4.785 | 25.85 | shoulder of HNCO and HN13CO |
| CH3C(O)NH2 | 93.680900 | 652,3 E | -5.187 | 22.36 | unblended |
| CH3C(O)NH2 | 97.810915 | 872,6 E | -4.771 | 29.32 | blended with Ga-n-C3H7OH |
| CH3C(O)NH2 | 97.812712 | 872,6 E | -6.242 | 29.32 | blended with Ga-n-C3H7OH |
| CH3C(O)NH2 | 97.823791 | 871,6 E | -6.243 | 29.32 | blended with H2CCCHCN |
| CH3C(O)NH2 | 97.825588 | 871,6 E | -4.771 | 29.32 | blended with H2CCCHCN |
| CH3C(O)NH2 | 97.893420 | 81,8 E | -4.640 | 30.54 | blended with aGg(CH2OH)2 |
| CH3C(O)NH2 | 97.893422 | 81,8 E | -6.069 | 30.54 | blended with aGg(CH2OH)2 |
| CH3C(O)NH2 | 97.893437 | 80,8 E | -6.069 | 30.54 | blended with aGg(CH2OH)2 |
| CH3C(O)NH2 | 97.893439 | 80,8 E | -4.640 | 30.54 | blended with aGg(CH2OH)2 |
| CH3C(O)NH2 | 98.113341 | 33,0 E | -5.055 | 19.61 | unblended |
| CH3C(O)NH2 | 107.988285 | 82,7 E | -4.626 | 34.51 | unblended |
| CH3C(O)NH2 | 107.990327 | 81,7 E | -4.626 | 34.51 | unblended |
| CH3C(O)NH2 | 108.190197 | 91,9 E | -4.511 | 35.74 | unblended |
| CH3C(O)NH2 | 108.190197 | 91,9 E | -5.912 | 35.74 | unblended |
| CH3C(O)NH2 | 108.190199 | 90,9 E | -5.912 | 35.74 | unblended |
| CH3C(O)NH2 | 108.190200 | 90,9 E | -4.511 | 35.74 | unblended |
| CH3C(O)NH2 | 108.606162 | 72,5 E | -4.784 | 32.27 | unblended |
| CH3C(O)NH2 | 109.349123 | 43,1 E | -5.266 | 21.54 | blended with aGg(CH2OH)2 |
| CH3C(O)NH2 | 113.867594 | 44,1 E | -4.993 | 23.30 | share with CH3C(O)NH2 63,3 A |
| CH3C(O)NH2 | 34.987857 | 664,3 A | -5.997 | 20.20 | blended with anti-C2H5NH2 |
| CH3C(O)NH2 | 34.989515 | 440,4 A | -6.372 | 7.61 | blended with anti-C2H5NH2 |
| CH3C(O)NH2 | 40.302903 | 322,1 A | -6.417 | 4.84 | unblended or blended with U |
| CH3C(O)NH2 | 46.312309 | 431,3 A | -5.662 | 5.93 | unblended |
| CH3C(O)NH2 | 46.449611 | 211,1 A | -6.262 | 3.03 | blended with H2CCCHCN |
| CH3C(O)NH2 | 46.450396 | 430,3 A | -6.844 | 5.93 | blended with H2CCCHCN |
| CH3C(O)NH2 | 46.473480 | 430,3 A | -5.658 | 5.93 | unblended |
| CH3C(O)NH2 | 74.172527 | 432,1 A | -5.479 | 9.00 | unblended or blended with U |
| CH3C(O)NH2 | 77.199071 | 652,4 A | -5.136 | 14.56 | blended with U |
| CH3C(O)NH2 | 77.320853 | 761,6 A | -4.951 | 15.58 | unblended |
| CH3C(O)NH2 | 77.320920 | 761,6 A | -6.153 | 15.58 | unblended |
| CH3C(O)NH2 | 77.321347 | 760,6 A | -6.153 | 15.58 | unblended |
| CH3C(O)NH2 | 77.321414 | 760,6 A | -4.950 | 15.58 | unblended |
| CH3C(O)NH2 | 77.435420 | 651,4 A | -5.133 | 14.56 | unblended or blended with U |
| CH3C(O)NH2 | 82.338160 | 542,2 A | -5.341 | 12.59 | unblended |
| CH3C(O)NH2 | 85.746007 | 653,3 A | -5.221 | 16.70 | blended with C2H5OH |
| CH3C(O)NH2 | 87.586466 | 762,5 A | -4.938 | 18.76 | blended with H2CCCHCN |
| CH3C(O)NH2 | 87.623526 | 761,5 A | -6.098 | 18.76 | unblended |
| CH3C(O)NH2 | 87.629757 | 761,5 A | -4.937 | 18.76 | unblended |
| CH3C(O)NH2 | 87.632434 | 871,7 A | -4.784 | 19.79 | unblended |
| CH3C(O)NH2 | 87.632443 | 871,7 A | -5.989 | 19.79 | unblended |
| CH3C(O)NH2 | 87.632501 | 870,7 A | -5.989 | 19.79 | unblended |
| CH3C(O)NH2 | 87.632510 | 870,7 A | -4.784 | 19.79 | unblended |
| CH3C(O)NH2 | 97.905697 | 72,6 A | -4.77 | 23.46 | unblended |
| CH3C(O)NH2 | 97.906677 | 72,6 A | -5.941 | 23.46 | unblended |
| CH3C(O)NH2 | 97.911929 | 71,6 A | -5.941 | 23.46 | unblended |
| CH3C(O)NH2 | 97.912908 | 71,6 A | -4.77 | 23.46 | unblended |
| CH3C(O)NH2 | 97.943873 | 81,8 A | -4.639 | 24.49 | unblended |
| CH3C(O)NH2 | 97.943874 | 81,8 A | -5.846 | 24.49 | unblended |
| CH3C(O)NH2 | 97.943882 | 80,8 A | -5.846 | 24.49 | unblended |
| CH3C(O)NH2 | 97.943883 | 80,8 A | -4.639 | 24.49 | unblended |
| CH3C(O)NH2 | 108.214105 | 82,7 A | -4.625 | 28.66 | blended with C2H5CN |
| CH3C(O)NH2 | 108.214251 | 82,7 A | -5.803 | 28.66 | blended with C2H5CN |
| CH3C(O)NH2 | 108.215083 | 81,7 A | -5.803 | 28.66 | blended with C2H5CN |
| CH3C(O)NH2 | 108.215230 | 81,7 A | -4.625 | 28.66 | blended with C2H5CN |
| CH3C(O)NH2 | 108.255232 | 91,9 A | -4.51 | 29.68 | unblended |
| CH3C(O)NH2 | 108.255232 | 91,9 A | -5.719 | 29.68 | unblended |
| CH3C(O)NH2 | 108.255234 | 90,9 A | -5.719 | 29.68 | unblended |
| CH3C(O)NH2 | 108.255234 | 90,9 A | -4.510 | 29.68 | unblended |
| CH3C(O)NH2 | 110.952601 | 44,0 A | -4.828 | 15.69 | blended with CH3COOH |
| CH3C(O)NH2 | 113.868958 | 63,3 A | -4.972 | 23.61 | share with CH3C(O)NH2 44,1 E |
| CH3C(O)NH2 | 139.138720 | 112,10 A | -4.281 | 47.21 | blended with HCCCH2CN |
| CH3C(O)NH2 | 139.138723 | 111,10 A | -4.281 | 47.21 | blended with HCCCH2CN |
| CH3C(O)NH2 | 139.188418 | 121,12 A | -4.199 | 48.24 | unblended |
| CH3C(O)NH2 | 139.188418 | 120,12 A | -4.199 | 48.24 | unblended |
| trans-N-CH3NHCHO | 32.550890 | 321,2 E | -6.223 | 7.48 | unblended |
| trans-N-CH3NHCHO | 33.455906 | 320,2 A | -6.154 | 3.23 | unblended |
| trans-N-CH3NHCHO | 34.461458 | 321,1 E | -6.230 | 8.42 | unblended |
| trans-N-CH3NHCHO | 34.693486 | 210,1 A | -6.537 | 2.21 | unblended |
| trans-N-CH3NHCHO | 37.428359 | 441,3 A | -6.200 | 8.26 | blended with C6H |
| trans-N-CH3NHCHO | 39.138171 | 331,2 A | -6.343 | 6.04 | blended with U |
| trans-N-CH3NHCHO | 43.793726 | 320,2 A | -6.199 | 3.72 | unblended |
| trans-N-CH3NHCHO | 44.092441 | 430,3 A | -5.793 | 5.34 | unblended |
| trans-N-CH3NHCHO | 45.131824 | 432,2 A | -5.899 | 8.18 | unblended |
| trans-N-CH3NHCHO | 46.120191 | 541,4 A | -3.990 | 7.95 | blended with HOCH2CN |
| trans-N-CH3NHCHO | 72.670325 | 761,6 A | -5.135 | 14.74 | unblended |
| trans-N-CH3NHCHO | 74.090940 | 760,6 A | -5.115 | 14.60 | unblended |
| trans-N-CH3NHCHO | 74.122946 | 760,6 E | -5.094 | 18.24 | blended with 13CH2CHCN |
| trans-N-CH3NHCHO | 79.741415 | 321,2 A | -5.847 | 6.03 | unblended |
| trans-N-CH3NHCHO | 82.715063 | 871,7 A | -4.969 | 18.71 | blended with H2CCCHCN |
| trans-N-CH3NHCHO | 83.253887 | 762,4 A | -5.047 | 18.45 | unblended |
| trans-N-CH3NHCHO | 87.496110 | 870,7 E | -5.204 | 22.44 | unblended |
| trans-N-CH3NHCHO | 89.031261 | 872,6 A | -4.930 | 22.13 | unblended |
| trans-N-CH3NHCHO | 89.935665 | 871,6 E | -4.886 | 24.61 | unblended |
| trans-N-CH3NHCHO | 92.415560 | 981,8 E | -4.817 | 26.87 | unblended |
| trans-N-CH3NHCHO | 93.395965 | 871,6 A | -4.869 | 21.18 | unblended |
| trans-N-CH3NHCHO | 93.406380 | 980,8 A | -4.816 | 23.10 | unblended |
| trans-N-CH3NHCHO | 95.642981 | 872,5 A | -4.866 | 23.04 | blended with C2H5OCH3 |
| trans-N-CH3NHCHO | 105.608314 | 322,1 A | -5.362 | 9.45 | unblended |
| trans-N-CH3NHCHO | 107.852547 | 982,6 A | -4.712 | 28.22 | unblended |
| trans-N-CH3NHCHO | 109.325438 | 322,0 E | -5.314 | 14.35 | unblended |
| NHCHO | 40.778439 | 211,1 | -4.664 | 5.8 | unblended |
| NHCHO | 42.318061 | 210,1 | -4.503 | 3.0 | unblended |
| NHCHO | 81.495632 | 431,3 | -3.674 | 12.7 | unblended |
| NHCHO | 84.390679 | 430,3 | -3.612 | 10.1 | unblended |
| NHCHO | 101.813583 | 541,4 | -3.379 | 17.6 | unblended |
| NHCHO | 105.260270 | 540,4 | -3.330 | 15.2 | unblended |
| NH2C(O)NH2 | 37.926700 | 320,2 | -5.011 | 3.89 | unblended |
| NH2C(O)NH2 | 39.116400 | 211,0 | -5.195 | 2.91 | blended with U |
| NH2C(O)NH2 | 48.697422 | 431,3 | -4.648 | 6.23 | unblended |
| NH2C(O)NH2 | 48.705728 | 430,3 | -4.648 | 6.23 | blended with U |
| ∗NH2C(O)NH2 | 81.104130 | 652,4 | -4.107 | 15.29 | blended with DNCO |
| ∗NH2C(O)NH2 | 81.108770 | 651,4 | -4.107 | 15.29 | blended with DNCO |
| ∗NH2C(O)NH2 | 81.199200 | 761,6 | -3.945 | 16.36 | unblended |
| ∗NH2C(O)NH2 | 81.199200 | 760,6 | -3.945 | 16.36 | unblended |
| NH2C(O)NH2 | 92.031820 | 871,7 | -3.780 | 20.78 | blended with CH2CH13CN |
| NH2C(O)NH2 | 92.031820 | 870,7 | -3.780 | 20.78 | blended with CH2CH13CN |
| NH2C(O)NH2 | 96.185230 | 543,1 | -4.253 | 14.53 | blended with U |
| ∗NH2C(O)NH2 | 102.76756 | 872,6 | -3.754 | 24.64 | blended with CH3COCH3 |
| ∗NH2C(O)NH2 | 102.76756 | 871,6 | -3.754 | 24.64 | blended with CH3COCH3 |
| ∗NH2C(O)NH2 | 102.86432 | 981,8 | -3.635 | 25.71 | unblended |
| ∗NH2C(O)NH2 | 102.86432 | 980,8 | -3.635 | 25.71 | unblended |