Selective Query Processing: a Risk-Sensitive Selection of System Configurations
IRIT, UMR5505 CNRS
Université de Toulouse
Toulouse, France
Josiane.Mothe@irit.fr
&
IRIT, UMR5505 CNRS
Université de Toulouse
Toulouse, France
zuacsea@gmail.com
Abstract
In information retrieval systems, search parameters are optimized to ensure high effectiveness based on a set of past searches and these optimized parameters are then used as the system configuration for all subsequent queries. A better approach, however, would be to adapt the parameters to fit the query at hand. Selective query expansion is one such an approach, in which the system decides automatically whether or not to expand the query, resulting in two possible system configurations. This approach was extended recently to include many other parameters, leading to many possible system configurations where the system automatically selects the best configuration on a per-query basis. One problem with this approach is the system training which requires evaluation of each training query with every possible configuration. In real-world systems, so many parameters and possible values must be evaluated that this approach is impractical, especially when the system must be updated frequently, as is the case for commercial search engines. In general, the more configurations, the greater the effectiveness when configuration selection is appropriate but also the greater the risk of decreasing effectiveness in the case of an inappropriate configuration selection. To determine the ideal configurations to use on a per-query basis in real-world systems we developed a method in which a restricted number of possible configurations is pre-selected and then used in a meta-search engine that decides the best search configuration on a per query basis. We define a risk-sensitive approach for configuration pre-selection that considers the risk-reward trade-off between the number of configurations kept, and system effectiveness. We define two alternative risk functions to apply to different goals. For final configuration selection, the decision is based on query feature similarities. We compare two alternative risk functions on two query types: ad hoc and diversity and compare these to more sophisticated machine learning-based methods. We find that a relatively small number of configurations (20) selected by our risk-sensitive model is sufficient to obtain results close to the best achievable results for each query. Effectiveness is increased by about 15% according to the P@10 and nDCG@10 evaluation metrics when compared to traditional grid search using a single configuration and by about 20% when compared to learning to rank documents. Our risk-sensitive approach works for both diversity- and ad hoc-oriented searches. Moreover, the similarity-based selection method outperforms the more sophisticated approaches. Thus, we demonstrate the feasibility of developing per-query information retrieval systems, which will guide future research in this direction.
Keywords Information system Information retrieval Adaptive information retrieval Query driven parameterisation Learning to rank Search engine parameters Risk sensitive systems
1 Introduction
Information retrieval (IR) systems involve several distinct component processes. These include indexing to extract the document terms that will be used for query-document matching, automatic query expansion, search weighting to decide which documents to retrieve, and ranking of retrieved documents. Each component must be set properly to optimize system effectiveness. A variety of models for each component are described in the literature. For example, the search weighting model may be BM25 Robertson et al. (2009), language modeling Ponte and Croft (1998) or another; query expansion can be implemented using Bo1, Bo2 Amati (2003), RM3 Ponte and Croft (1998), or other models. Each model has hyperparameters that influence system effectiveness and can have a variety of values. For example, and are parameters for the BM25 search weighting model, whereas the number of terms to be added to the query is one of the parameters for query expansion models. In this paper, we will call these components and their hyperparameter values a ‘system configuration’. Current practice in most research search contexts, and perhaps in commercial searches also, is to select the components and hyperparameters for all the training queries or past searches only once by jointly searching and optimizing system effectiveness over the hyperparameter space Li and Kanoulas (2018). Hyperparameter optimization is usually done on a per-collection basis Taylor et al. (2006). One popular method is ‘grid search’, in which a set of possible values is defined for each parameter, then grid search determines the best value for each parameter to maximize the system effectiveness on a query set Metzler and Croft (2007). Alternative methods include ‘line search’ Luenberger et al. (1984), ‘Bayesian optimization’ Li et al. (2018), and ‘transfer learning’ Macdonald et al. (2015).
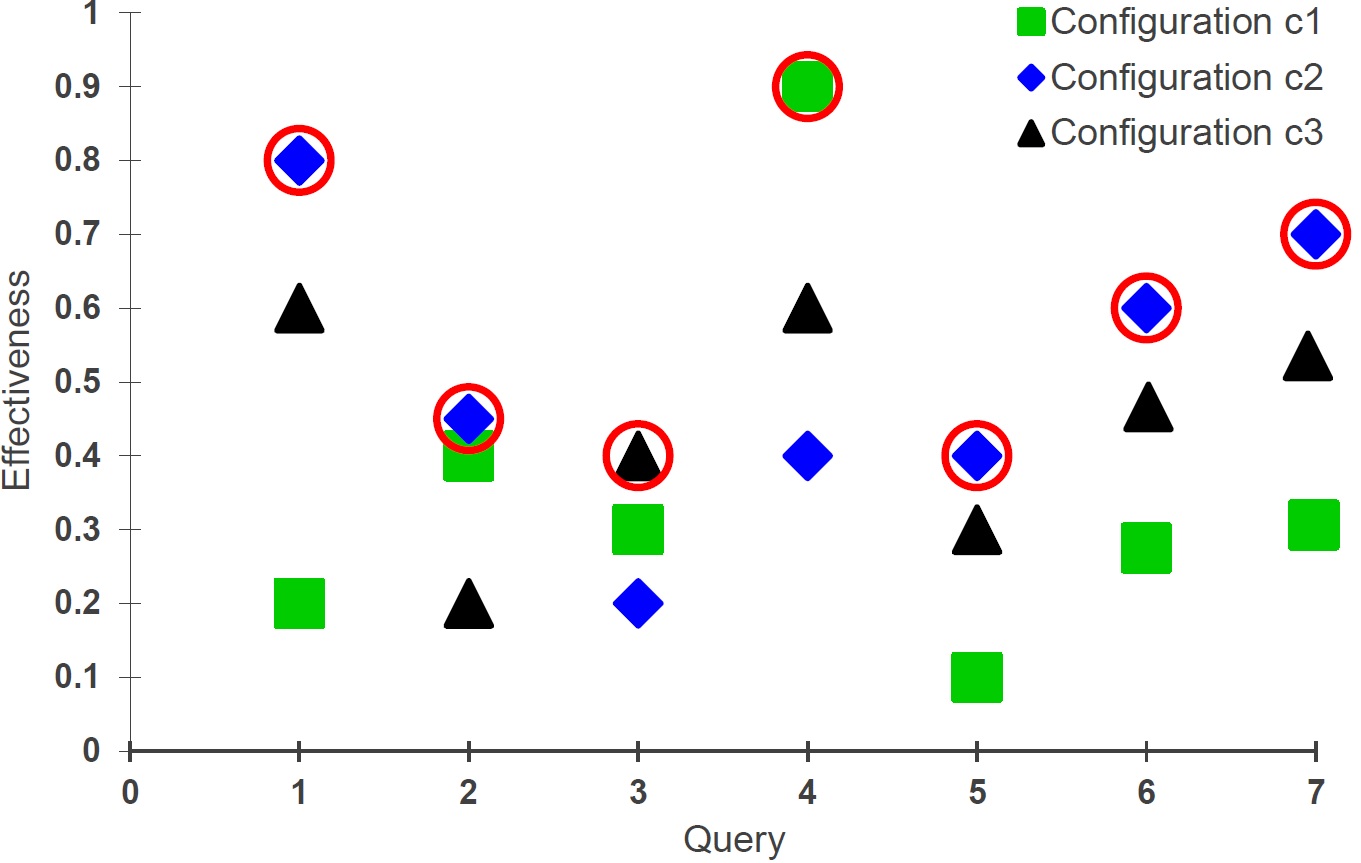
The hyperparameter optimization approaches described above assume that it is possible to select a single system configuration that will fit any query. In reality, this is false: the optimal configurations for various queries differ. This has been demonstrated by the TREC111TREC: Text REtrieval Conference trec.nist.gov, where, for example, system A performs better than system B on certain queries whereas system B performs better than system A for other queries Harman and Buckley (2009). One query may need extensive query expansion, for example, whereas another does not. Ideally, query expansion parameters should be set differently for different queries. The same is true for other system components and hyperparameters. Even if a single system configuration could optimize effectiveness on average over a set of queries, other configurations may be more effective for each individual query. It would be better, therefore, to adapt the hyperparameter values to fit each given query (Figure 1).
Data fusion may be an alternative to selecting the best configuration for each query. It uses different configurations and then merges the results based on document ranks or scores Fox et al. (1993). Potentially, data fusion might perform better than the single best configuration selected by an Oracle, however, it would require more time to compute the ranking across configurations for each query and more complex calculations.
In this paper, we will consider how to determine a hopefully good configuration for each query without taking into account the complexity and time required for computing. Previous work made some attempts in this direction. Selective query expansion (SQE), for example, tries to determine whether or not a query needs to be expanded; it is used only for those queries that need to be expanded Cronen-Townsend et al. (2004); Cao et al. (2008); Xu et al. (2016). The use of only two search strategies in SQE does not improve search engine performance very much, however, thus it is no longer used.
Recently, the SQE idea has been expanded to include many other system parameters, including indexing schema, retrieval models (BM25, language model, etc.) and the feedback methods Bigot et al. (2015); Mothe and Washha (2017); Deveaud et al. (2018); Arslan and Dinçer (2019); Mothe and Md Zia (2021). When a large number of possible parameters are involved they may be mutually dependent. For example, the number of terms selected for query expansion may depend on the number of feedback documents from which the terms are selected. It is difficult to optimize the selection of each parameter value separately Mothe and Washha (2017). Also, following on Ferro and Silvello’ deep analysis of the influence of system parameters on results Ferro and Silvello (2016), we previously defined a large set of possible system configurations that use different parameter values Deveaud et al. (2018). This creates many possible system configurations that the engine must choose between to best fit a given query. A model is then trained to select the best one among these configurations depending on the query. In this way, the parameters can influence each other within the same configuration and the problem of dependencies among parameters can be tackled implicitly. The model is trained using learning to rank: query features are extracted from a given query and the model learns to rank the configurations in order to select the best one Deveaud et al. (2018); Mothe and Md Zia (2021). The assumption in this case is that a specific configuration can best cope with the specific needs of a given query.
To implement this method, each training query must be evaluated with every configuration to obtain a measure of the effectiveness of that configuration, which serves as the ground truth. Even though the learning to rank model trained in this way can outperform previous state-of-the-art methods, the cost of preparing the training data is huge: about configurations were used by Deveaud et al. Deveaud et al. (2018), but, in practice, many more may be needed and some of the parameters have continuous values. This approach is thus difficult to use in practice, especially when the number of training queries is large. If we limit the number of training queries to make the approach more feasible, however, we face the problem of model overfitting: the selected configurations may tend to fit a few training queries, but are hard to generalize to other queries.
In our recent work Mothe and Md Zia (2021), we hypothesized that it is not necessary to consider all the possible configurations all of the time. Some may be very similar to others and will produce similar results, so they might be considered redundant. Specific setting of some parameters may also not be important in some contexts given the setting of other parameters. Indeed, Compaoré et al. Compaoré et al. (2011) and Ferro and Silvello Ferro and Silvello (2016) showed that some parameters have a much higher impact than others. If it were feasible to reduce the large number of possible configurations to a much smaller set of representative configurations that work well for different queries in different situations, the configuration selection approach would then be usable in practice, especially for Web search engines, which need to be updated regularly. This paper extends our previous work Mothe and Md Zia (2021) by proposing a formal method to select a small set of system configurations from the many configurations such that for each query one configuration can be found that produces the best or near-best effectiveness.
The problem is not trivial. Consider again the case in Figure 1. Suppose that we want to limit the number of candidate configurations to a subset of, say, two configurations. Since is best for many queries, it should be kept as a first choice. For second configuration, either or would improve effectiveness by one query, but the gain from choosing for query is much higher than that from choosing for query . Therefore, is a better choice, even though the average effectiveness of on all the queries is higher than that of . For the subsequent choices, it is important to consider whether a configuration is complementary to those already selected. This example shows that we need an optimizer to decide which configurations to keep.
In deciding which configurations to keep, one consideration is that the more configurations we keep (up to a certain point), the greater the effectiveness. Another is that the more diverse the configurations in terms of their optimal treatment of some types, the better. The third consideration is that at a certain point adding configurations leads to overfitting, specifically if there are few training queries. We propose a ‘greedy’ approach in which we add one representative configuration at a time according to the above principle. The added configuration must contribute to improving global performance, i.e., the number of queries that improved effectiveness or the overall improvement in effectiveness.
Returning to our example in Figure 1, if we use a single configuration for all the queries, using rather than for query is risky because it will lead to lower effectiveness. The overall risk of using rather than can be evaluated by considering all the queries and calculating the accumulated risk for all the individual queries. If, instead, we use , the risk will be different. Risk can be estimated in several ways but, for an individual query, it is the amount we can expect to decrease retrieval quality by using one configuration over a reference configuration Wang et al. (2012); Dinçer et al. (2016); Benham and Culpepper (2017).
The configuration selection method we propose here is based on sensitivity to risk. Inspired by the risk-sensitive learning to rank approach, which aims to reduce the risk of poor effectiveness for some queries Wang et al. (2012); Collins-Thompson et al. (2014); Dinçer et al. (2016); Sousa et al. (2016), we suggest a risk-based criterion to decide which configurations should be included as candidate in the system. The risk is defined as the loss of performance when choosing a particular system compared to the baseline. Our model thus combines risk and reward functions to select a small set of candidate configurations. The resulting reduced set of configurations can then be used by a meta-search engine to select the best configuration for a new query.
In our previous work Mothe and Md Zia (2021), we considered a risk-reward function that accumulates the risk (or reward) relative to queries in terms of effectiveness when applied to the training query set, i.e., the size of the decrease (or increase) in system effectiveness due to adding a given configuration. Here, we consider an alternative risk-reward function that focuses instead on the number of queries that may be affected by a decrease (or increase) in system effectiveness. This new function is more user-oriented than the previous one, which was oriented towards system evaluation and, therefore, likely to work well in evaluation campaigns like TREC. Another novelty compared to earlier related work is how we select the best configuration for a given query. While related work, including ours, has considered complex machine learning models, here we use a simpler method: given a new query and its features, we find the configuration associated with the best-matched training query and use it for the underlying query. Thus, the similarity based on the query features only is used.
To evaluate our method, we consider six reference test collections from TREC. We extend our previous analysis to the diversity task and the ad hoc task and include the MS MARCO data collection. We compare our method with state-of-the-art methods, including grid search to select the best single configuration, learning to rank methods for document ranking, selective query expansion, data fusion (CombSUM), and Oracle. Our analyses show that the proposed method can significantly reduce the number of candidate configurations while retaining a similar level of overall effectiveness as when using many more configurations, making it usable in practice. We show empirically that our method is superior to state-of-the-art approaches on both ad hoc retrieval and diversity test collections, considering many collections, baselines and related work.
The rest of the paper is organized as follows: Section 2 presents the related work. In Section 3, we introduce the risk-based criteria to select the candidate configurations as a preliminary step of any per-query configuration selection model. Section 4 describes the evaluation framework, and Section 5 reports the results and discusses them. Section 6 concludes the paper and provides some perspective.
2 Related work
The related work falls into two categories: methods that aims at using selective query processing strategy on a per-query basis and risk-sensitive criteria in learning to rank.
2.1 Selective query processing
In information retrieval, selective strategies have been introduced either to increase efficiency or effectiveness. Selective search mainly refers to techniques to improve the response time by limiting the part of the data the system is searching from, like in shard selection, for example Baeza-Yates et al. (2009); Aly et al. (2013). On the other hand, other selective approaches have been introduced that focus on different aspects of the query processing. For example, selective query expansion was introduced to name a system that decides whether a query should be automatically expanded or not before the system retrieves the documents. Our paper focuses on this second type of selective approaches, so do this related work section.
A few studies explored the idea of applying different processes according to queries. A selective query processing aims to select the most appropriate search or system configuration among many to apply to each individual query (He and Ounis, 2004); it thus differs from data fusion, which fuses the retrieved document lists obtained by several system configurations Fox and Shaw (1994), but still uses a single strategy to process all the queries Fox and Shaw (1994); Nuray and Can (2006); Hsu and Taksa (2005); Kurland and Culpepper (2018). It also differs from double fusion, which fuses the retrieved document lists over query variations for a single system (query fusion) and over multiple systems for a single query (system fusion) McCabe et al. (2001); Bailey et al. (2016); Benham and Culpepper (2017). Finally, it differs from distributed selective search, which aims at avoiding to search the entire corpus for each query Mohammad et al. (2018).
Selective query expansion (SQE) is probably the first approach toward selecting the process to apply for each individual query Amati et al. (2004); Cronen-Townsend et al. (2004); He and Ounis (2007); Zhao and Callan (2012). For each query, the SQE approach selects one of two query processing strategies or system configurations: either the original, unexpanded query is used or the query is expanded first. Most studies on SQE focused on how this decision is made. Cronen-Townsend et al. Cronen-Townsend et al. (2004) and Amati et al. Amati et al. (2004) estimated how much the results of the expanded query strayed away from the sense of the original query to decide whether it should be expanded. Amati et al. Amati et al. (2004) reports that an Oracle that could decide which queries would need expansion and which would not make an increase of about 10% to 13% on MAP and P@10 compared to a single configuration without expansion (on early TREC collections). About the same percentage was reported in Cronen-Townsend et al. Cronen-Townsend et al. (2004) (+7% for TREC7 and +11% on TREC8). This considers an Oracle could decide, and this Oracle could not be achieved automatically.
The two configurations used in SQE, however, had only limited effectiveness. The following attempts focused on query expansion since query expansion has shown to be effective on average, specifically for difficult queries (Compaoré et al., 2011). Xu et al. Xu et al. (2009) improved SQE such that the system chooses between more options and consider different query expansion strategies according to the type of query. They defined three types of query: ambiguous queries, queries about a specific entity and broader queries, and proposed different methods to treat each type of queries. Kevyn Collins-Thompson Collins-Thompson (2009) introduced a constraint optimization framework for SQE by reducing the risk of query expansion without hurting the average gain.
Other attempts to use a selective query processing strategy have considered more than two configurations. Arslan and Dinçer Arslan and Dinçer (2019) used eight configurations consisting of eight term-weighting models in which the hyperparameters were first optimized by using grid search Taylor et al. (2006). In their approach, the selection of a configuration to process a new query is based on the distributions of the frequency of query terms on the document collection. By considering more configurations in this selective strategy, the system performance improved when compared to SQE Xu et al. (2009); Arslan and Dinçer (2019). Dinçcer et al. Arslan and Dinçer (2019) applied the selective approach to 11 term weighting approaches. They reported a potential increase of 34% (oracle) when compare to the best system of the pool but achieved +3% only with their model on Clueweb09A.
The most recent selective query processing strategies make the configuration selection decision based on training by machine learning from sample queries He and Ounis (2004); Xu et al. (2016); Mothe and Washha (2017); Deveaud et al. (2018) rather than making the decision based on a query score or feature as was done previously Cronen-Townsend et al. (2004); Xu et al. (2009); Arslan and Dinçer (2019). He and Ounis He and Ounis (2004) introduced a model selection approach in which queries were clustered considering three pre-retrieval features and the best-performing retrieval model was attributed to each cluster. For a given query, the retrieval model attributed to the closest cluster was then selected to treat the query. The same group of authors reported an increase of about 3% on WT10G compared to a unique optimized configuration but did not report the Oracle in their selective query expansion model based on document fields He and Ounis (2007).
The per-parameter learning (PPL) method by Mothe and Washha Mothe and Washha (2017) predicts the best configuration to use for a query by considering independently each of the query processing component and hyperparameters. PPL trains a multi-class classifier for each component process and hyperparameter. Seven such classifiers were trained corresponding to more than configurations in total. These classifiers were then used to predict the best component and hyperparameter values for an unseen query, considering the query features. An independently trained classifier for each parameter may not effectively model system performance since the parameters might be mutually dependent Ferro and Silvello (2016). In this paper, compared to the PPL, we combine all the components and hyperparameters in a single configuration and generate different configurations by varying the components and their hyperparameters. In this way, interaction among components and hyperparameters is allowed within the configurations.
Xu et al. Xu et al. (2016) focused on the automatic query expansion component of selective query processing strategy. They adapt the standard learning to rank documents model whose purpose is to rank a sample of documents retrieved by a search system according to their supposed relevance by learning from examples of query-document preferences Trotman (2005); Li (2011). The adaption was that the model does not learn document ranking but, rather, it learns to rank the candidate expansion terms based on query-term preferences. In Deveaud et al. Deveaud et al. (2016, 2018), the configuration selection for new queries was also cast as a problem of learning to rank. Their model learns to rank a set of configurations according to their potential ability to retrieve relevant documents for a given query based on examples of query-configuration preferences. They considered various components and hyperparameters and built more than configurations. Although this approach has been shown to be effective, it is not applicable in practice because the huge number of configurations it considers is too costly in terms of computing time and maintenance. None of the related work considers the problem of the choice of the candidate configurations in selective query processing strategy. In many of the previous studies just a few configurations were considered but their choice was not argued. When there were too many to be handled, they were selected randomly.
In this paper, we solve this problem with a risk-reward-based method that pre-selects a manageable number of the candidate configurations. A commercial search engine cannot maintain thousands of search configurations or thousands of query reformulations and search components, specifically because they also need to be regularly tuned according to the evolution of queries. Our method requires that only a small, manageable number of configurations be maintained. Once the set of candidate configurations is obtained, then any selective query processing strategy can be applied.
2.2 Risk-sensitive criteria in L2R
In information retrieval, risk has been defined as the reduction in effectiveness of a system when compared to a given baseline system Wang et al. (2012); Dinçer et al. (2014, 2016); Benham and Culpepper (2017); Benham et al. (2019a). Risk-sensitive functions have been studied in the context of learning to rank documents where a document ranking function is learned. De Sousa et al. Sousa et al. (2019) applied it to feature selection and show their models got a good trade-off between effectiveness and robustness. In this model, however, both this learned function and the search strategy are the same for any query.
Inspired by the modern portfolio theory, Wang and Zhu Wang and Zhu (2009) presented a risk-averse ranking algorithm by considering the mean-variance analysis of a ranked list. Wang et al. Wang et al. (2012) defined , which estimates the average reduction in effectiveness by using a given document ranking model rather than a reference model. Also, they proposed a risk-reward trade-off function, , to directly optimize a risk-sensitive learning to rank model that lowers the risk and enhances the reward of the document ranking model performance. The authors use this principle to select the best unique ranking model to be applied to any query. They show that risk-sensitive optimization for ranking models leads toward both robust and effective models.
The problem of is that it is unclear whether the estimated loss of a system over a baseline is statistically significant Dinçer et al. (2014). Other variants of risk-reward trade-off functions have been proposed in the literature based on Dinçer et al. (2014, 2016); Benham et al. (2019a) to overcome the problem of . Dinçer et al. Dinçer et al. (2014) introduced , an inferential version of that follows a Student’s t-distribution. The estimated risk-reward trade-off of a system over a baseline is tested in terms of its statistical significance, based on . Later, Dinçer et al. Dinçer et al. (2016) also proposed and to compare the risk-reward trade-off of a system against multiple baselines.
As an interesting application of risk functions, De Sousa et al. Sousa et al. (2016) incorporated risk functions for feature selection in learning to rank documents. They compared the models obtained by considering different subsets of features in order to select the most important ones. Benham et al. Benham and Culpepper (2017) introduced the risk function to estimate the risk-reward trade-off in rank fusion. Later, Benham et al. tried an S-shaped weighting function instead of the linear weighting function in risk measures; they found no conclusive differences in risk sensitivity Benham et al. (2019a). They also suggested a naming convention and a reversed signed version of the existing risk measures so that higher values correspond to higher risk. Benham et al. Benham et al. (2019b) studied the inferential behavior of risk measures and the stability of its confidence intervals. They found that the distribution of risk-adjusted scores is asymmetrical, undermining the normality assumption of the t-test statistic used in . Therefore, the inferential statistic on is not stable.
In the approach described below, we develop risk-sensitive criteria that aim to determine which configurations should be included in a pool for a selective query processing strategy, the candidate configurations. We develop two variants of penalty and reward functions; one is based on the overall system effectiveness whereas the other considers the number of queries that are improved/degraded. The former considers cumulative effectiveness and thus is likely to be more appropriate to perform well in shared tasks; the latter considers cumulative number of queries and thus is more likely to satisfy a larger number of users.
3 Risk-based criteria to select candidate configurations
The overview of the model training for our risk-sensitive selective approach is presented in Figure 2. The model is trained to automatically decide which system configuration is the most appropriate for a new query.
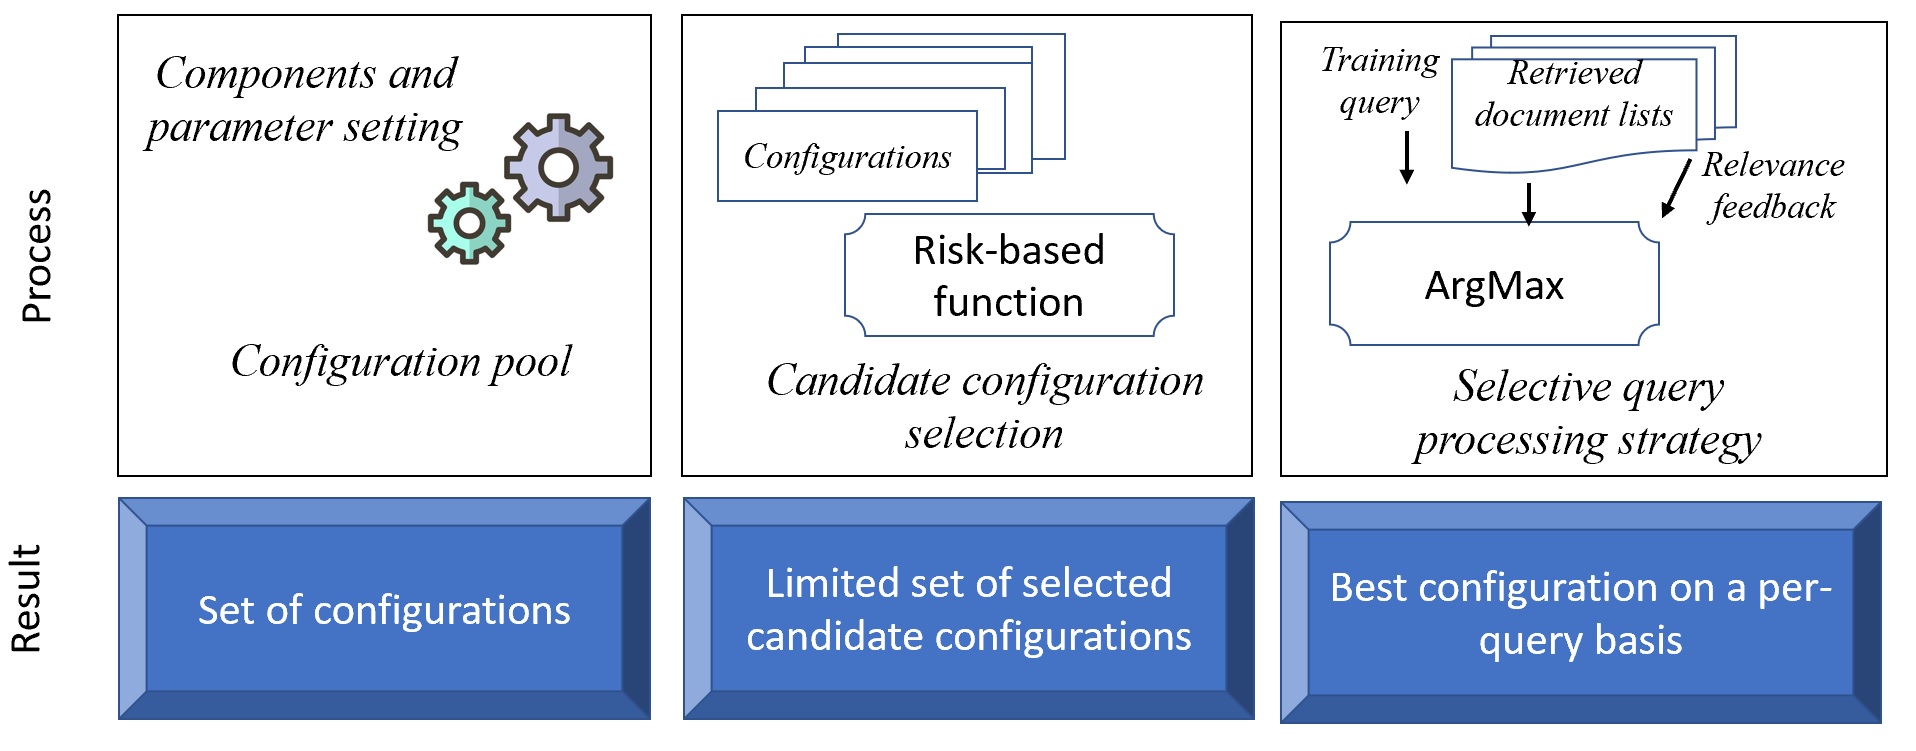
This model training consists into three main phases as follows:
-
1.
Configuration generation: on the server point of view, a search relies on various components or modules (indexing, searching, document scoring and ranking), each implying many hyperparameters. The configuration generator creates system configurations; each configuration is able to run any query and can provide a ranked list of documents it considers to be appropriate to deliver. Depending on the query, some configurations will be more successful than others. The number of configurations can be huge considering the variety of the different components and their hyperparameters that have been suggested in the literature;
-
2.
Candidate configuration selection: this second phase consists in reducing the above mentioned set of configurations. Indeed, some configurations may be poor in terms of effectiveness whatever the query is; some configurations may be very close one to the other. The risk-reward-based function for candidate configuration selection has been defined for this purpose. This phase is crucial to make the model applicable in real-world environments but also to avoid overfitting when the number of example queries is limited.
-
3.
Query processing selection for training queries: the unique configuration from the candidate set that should treat a query is decided. It is based on the configuration effectiveness on that query.
After training, the model is able to decide which configuration it should choose to process a new query. The most similar training query based on query features is estimated; then the model selects the configuration that was associated with it during the training. In the rest of the paper, we use meta-system or meta-search engine when referring to the retrieval that selects a configuration on a per-query basis. Configuration thus refers to a specific setting of the combination of modules along with the value of their hyperparameters (e.g., BM25 using the default values of and , with no query expansion); A configuration is a query processing strategy. And candidate configurations are the configurations the meta-system can choose among for processing a given query.
The rest of this section is devoted to the detailed description of this model.
3.1 Configuration pool
In IR evaluation, it is usual to tune the system components and their hyperparameters in order to optimize the system effectiveness; once done the obtained configuration is used for all the queries. System components are the retrieval model used in the search process (e.g., LM, BM25, etc.), the query expansion model (e.g., Bo2), the re-ranking algorithm used, etc. Their influence on the system effectiveness has been studied in various work Compaoré et al. (2011); Bigot et al. (2015); Ferro and Silvello (2016). The hyperparameters of those components are the and parameters for BM25 model, the for the LM model, etc. Lv and Zhai Lv and Zhai (2011) and Trotman et al. Trotman et al. (2014) for example studied the case of BM25 inner parameters.
The various configurations are built by varying them. The framework we propose later in this paper can be applied at the component level, hyperparameter level, or both component and hyperparameter levels. In the evaluation part of the framework, we will detail the components and hyperparameters we considered in the more than configurations we used.
3.2 Risk functions to choose the candidate configurations
A crucial issue to make query-based configuration selection applicable in real systems is the number of candidate configurations to be embedded in the meta-system.
Obviously, the more configurations, the more costly the meta-system. Moreover, we hypothesize that the more candidate configurations the meta-system can choose among (i.e., the larger the space of possible configurations), the greater the overall model effectiveness (in case of appropriate selection) but also the greater the risk (in case of bad selection of). To solve the problem of effectiveness/cost trade-off, we need an optimized number of complementary configurations in the meta-system.
Configurations used by the meta-system can be selected randomly from a set of candidate configurations using random search Bergstra and Bengio (2012) as it is done in our previous work Deveaud et al. (2018), but we believe that a risk-based model can be better.
In this paper, we developed a theoretical framework leading to a principled process, starting from one effective configuration and adding complementary effective configurations. Intuitively, a straightforward choice for the first configuration to select could be the configuration that maximizes the average effectiveness over the training queries ( in our toy example). Now, if we would like to select a second configuration, then it should be chosen as complementary to the first one: it should be more effective than the first configuration at least on a few queries (it can get a reward for that) and at the same time, it should not hurt many queries (bring risk into the system) in case the selection model chooses it by mistake for a given query. The process of selecting the candidate configurations can be modeled as a trade-off between minimizing the risk if the meta-system does not pick-up the best candidate configuration and maximizing the reward if the meta-system selects the best candidate configuration for a given query.
Our starting point is the risk-based approach suggested by Wang et al. Wang et al. (2012) for the case of L2R documents and which is defined as follows:
| (1) |
where is the training query set, is the baseline effectiveness for query , and is the effectiveness of the document ranking model for which risk is estimated.
The thus calculates the average decrease over the training queries in terms of effectiveness when comparing two document ranking models or a baseline and a ranking model. Inspired by this function, we define two variants that measure the risk associated with selecting, on a per-query basis, the configuration rather than the reference configuration . The risk is here to have better than .
We define two risk-sensitive functions that result in two gain functions, both consisting in a risk and a reward parts. The first risk-sensitive function, aims at optimizing the overall effectiveness on the training query set; it measures risk and reward in terms of cumulative effectiveness over queries. The second risk-sensitive function, aims at optimizing the number of queries for which the effectiveness is improved.
Effectiveness-based function. For effectiveness, Eq. 1 can be transposed into :
| (2) |
where is the training query set, is the performance (effectiveness) of the reference configuration for the query , and is the candidate configuration.
It accumulate the risk, that is to say the decrease in effectiveness, due to being a lower performing configuration than the reference configuration over the queries.
The corresponding reward function is based on the potential increase of the overall effectiveness on the training query set and is defined in Eq. 3 as:
| (3) |
It aggregates the effectiveness improvement that would result if the system considers for the queries where performs better than the reference configuration .
Once risk and reward are defined, we have to adapt the above formulas to fit the problem of selecting a set of candidate configurations to be used in the per-query configuration selection meta-system.
Let be the set of all candidate configurations, be the set of configurations that have already been selected at the step with an initial . is the set of training queries, denotes the retrieval effectiveness (e.g. ERR-IA@20) for the query processed by the configuration .
Given and , we define the risk for selecting the new configuration to be added in at step using Eq. 2 in terms of effectiveness as follows:
| (4) |
where is the maximum effectiveness for the query over the set of configurations that have already been selected in . In Eq. 4, the risk for adding the configuration is measured as the cumulative decrease in effectiveness the meta-system can get if it chooses rather than the best configuration in for each of the training queries; it thus adapts Eq. 2. The value is in between 0 and 1 when the effectiveness measure is in between 0 and 1.
Likewise, we define the reward function using Eq. 3 regarding the effectiveness as follows:
| (5) |
The overall gain for the configuration over the set of training queries and already selected configurations is defined as:
| (6) |
is a risk-sensitive parameter that controls the trade-off between risk and reward. Here, we set to weight risk and reward equally. We keep the analysis of this risk-sensitive parameter for future work. This aspect has been considered in other contexts Dinçer et al. (2016); Benham et al. (2019b).
Number of impacted queries based function. For , the risk is defined in terms of the number of queries for which the query effectiveness would decrease if the candidate configuration was selected in place of the reference configuration . In that case, Eq. 1 can be transposed into :
| (7) |
where when the condition is true and using the same notation as previously. This is the maximum possible risk. It is a proportion of queries.
The corresponding reward function corresponds to the potential number of queries that can be improved using configuration (Eq. 8). It is defined as:
| (8) |
where we count the number of queries when configuration performs better than the reference configuration .
We define the risk function which adapts Eq. 7 to the selective meta-system by focusing on the number of queries which degrade the effectiveness as follows:
| (9) |
In Eq. 9, the risk for adding the configuration is measured as the number of queries in the training query set for which the effectiveness is lower for than for the best configuration in .
We also define the alternative reward function using Eq. 8 in terms of the number of queries for which the configuration gets the best effectiveness as follows:
| (10) |
The overall gain in that case is defined as:
| (11) |
Gain to update the pool of candidate configurations.
Finally, at step , we select the configuration which maximizes the overall gain according to the following Eq.:
| (12) |
Where Gain refers either to Eq. 6 for effectiveness optimization (in that case the gain is the mean improvement of the effectiveness over the training queries) or Eq. 11 for the number of improved queries optimization (in that case the gain is the proportion of improved queries).
We then update as follows:
| (13) |
where is the set of risk-sensitive configurations selected for a set of training queries .
The risk-based criteria model we propose is generic enough so that it could be applied to any configuration selection meta-system.
We present the pseudo-code for selecting candidate configurations using the risk-reward function in Algorithms 1 and 2. To build a set of candidate configurations, Algorithm 1 runs an iterative process that adds a new configuration each time. Algorithm 2 describes how the best candidate to be added is selected.
Algorithm 1 requires the following input to build the set of candidate configurations:
-
•
The set of training queries ,
-
•
The set of an initial pool of system configurations ,
-
•
An effectiveness matrix of dimension containing the effectiveness value of a metric (e.g., AP) for the configurations over different queries ,
-
•
The baseline configuration model (e.g,. BM25),
-
•
The risk-sensitive parameter ,
-
•
The number of configurations to be selected ,
- •
3.3 Selecting the best configuration for a query
3.3.1 Configuration selection.
The risk-based criteria we defined aim at optimizing the set of configurations to be used in a per-query configuration selection meta-system. In Deveaud et al. Deveaud et al. (2018) or in Mothe and Ullah Mothe and Md Zia (2021), the query-configuration association problem is cast as a learning to rank problem where L2R algorithms are applied to decide which of the configuration from the candidate set should be used. He and Ounis He and Ounis (2004) rather considered a classification model where queries are clustered and a configuration is associated to each cluster.
The rationale has been that L2R worked well in various contexts such as learning to rank documents, learning to rank terms to add to a query in query expansion. We thus developed a model to adapt the principle of L2R documents to L2R configurations so that the L2R model learns to rank the possible configurations in order to select the best one Deveaud et al. (2018); Mothe and Md Zia (2021). In traditional L2R documents, the model’s goal is to learn a global ranking function for all the queries while in L2R configurations, the model aims at determining a query-specific retrieval process. Intuitively that sounded and worked. To implement this, we needed examples, they consisted in query features and configuration features plus a label which was the effectiveness on the query-configuration pair.
In this L2R configuration pipeline, after training, when ranking multiple configurations and choosing the best one for treating unseen or test query, the query features are obviously the same across the testing examples and the configuration features (component used, hyperparameters used) are different. We observe that the configuration features are not discriminatory enough to differentiate the candidate configurations. Therefore, the L2R configuration model may not consistently predict the best configuration to treat a query. To solve this issue, here, we choose a much simpler method. For each training query, we select the best configuration from the pool of risk-sensitive configurations and assign it to the training query. After the model is trained, for unseen queries, we search the best-matched training query based on the Cosine similarity between the testing query and the training query in terms of query features. We use the configuration associated with the best-matched training query for each testing query. This is similar to first-nearest-neighbor method.
The hypothesis behind this approach is that although queries are indeed diverse, some search queries share common retrieval characteristics that could help in deciding how the query should be processed. If we could represent the queries with appropriate features that help in making the link between the query and the best query processing to be applied, we could then rely on these features for unseen queries. The approach is related in some ways to query performance prediction, but here, we do not predict the performance but rather the query processing that should be applied. It is also linked to multi-task learning where one query could be considered as one task (finding the best configuration) and the similar tasks could be tackled by similar treatments (similar configurations). We keep the analysis on these points for future study.
In concrete terms, the idea of this simple yet effective approach is quite straightforward. We present the process of selecting the best configuration for a given test query in Algorithm 3. Given the set of training queries , the set of risk-reward based selected configurations , the effectiveness matrix of training queries by configurations , and the query feature vector of testing query, we first develop an index, for keeping the best configuration for each training query from Steps 2 to 4. That is, for each training query , we search the best configuration from and assign the in by associating it with the training query . Second, From Steps 7 to 10, we compute the Cosine similarity score for the set of training queries with the given test query using query features-based representations. Third, in Step 12 we find the training query which gets the maximum similarity with the testing query. Finally, in Step 13, we look up the respective configuration from the query-configuration index and recommend it for treating the underlying test query.
Query representation. With regard to query features, our framework is generic enough so that we could use any kind. In the literature, many different query features have been used for different tasks. Query features have been defined for L2R documents Macdonald et al. (2013); Cao et al. (2007); Lin et al. (2017) or query difficulty prediction Mothe and Tanguy (2005); Guo et al. (2010); Shtok et al. (2012). We adapt the query features usually used for L2R documents Cao et al. (2007); Lin et al. (2017). We choose to use LETOR features that were successfully used in both L2R documents and query performance prediction application Chifu et al. (2018). In L2R documents, LETOR features indicate how relevant or important the document is with respect to the query Qin et al. (2010). Examples of such features are the BM25 score, the term frequency of the query terms, etc. Each of these features is associated with a query-document pair.
Here, instead of features associated with query-document pairs, we need features associated with query-configuration pairs since the training is to decide which configuration better fits a query. LETOR features are query-document scores; they thus could be calculated for each query and each configuration . It would be, however, quite costly. Thus, we consider a unique fair configuration (in our experiments, we chose as this reference configuration -BM25 without query expansion) to calculate the LETOR query features. This option is a reasonable trade-off between computing costs and accurate query representation.
Since the LETOR functions are associated with query-document pairs rather than query-configuration pairs, we need to aggregate them over the documents that have been retrieved for a query. Let be the top retrieved documents for the given query based on the reference configuration. We can estimate a set of scores , where with a set of aggregation functions and a set of LETOR scoring functions. A similar principle was used for query performance prediction Balasubramanian et al. (2010); Chifu et al. (2018). With regard to , we can use any kind of statistical aggregation functions.
In the next section, we present the evaluation framework of our risk sensitive model.
4 Evaluation
4.1 Objectives of the experiments
We developed a series of experiments that aim at evaluating several aspects of the proposed risk-based functions as follows:
-
•
After the generation of the configurations, the phase 2 of the model training (see Figure 2), the model selects the configurations using our risk functions (phase 2), then phase 3 is selective query processing that decides which of the configurations should treat a given query. We need to evaluate this framework as much as possible;
- •
- •
- •
- •
- •
-
•
Some insights on the results are discussed in Section 5.6.
4.2 Configuration settings
We consider two search components: the retrieval model used (e.g., LM, BM25, etc.), the query expansion model (e.g., Bo2), and three hyperparameters from the query expansion component: the number of documents, the number of terms, and the minimum number of documents in which the terms should occur. We made these choices based on our previous studies that show that the retrieval and query expansion module are the most important, specifically for difficult queries, the hyperparamerters of query expansion are of help Compaoré et al. (2011). The possible values we considered for these five features are stated in Table 1. Alternatively, we could have considered the retrieval component hyper parameters, however, we keep this analysis and related experimental part for future work.
We used Terrier that implements these retrieval and query expansion models. For retrieval models, we used Terrier default hyperparameter values.
| Parameters | Values |
|---|---|
| Retrieval model | BB2, BM25, DFRee, DirichletLM, HiemstraLM, |
| InB2, InL2, JsKLs, PL2, DFI0, XSqrAM, DLH13, | |
| DLH, DPH, IFB2, TFIDF, InexpB2, DFRBM25, | |
| LGD, LemurTFIDF, InexpC2 | |
| QE model | No, KL, Bo1, Bo2, KLCorrect, Information, |
| KLComplete | |
| # of Exp. doc. | 2, 5, 10, 20, 50, 100 |
| # of Exp. terms | 2, 5, 10, 15, 20 |
| Min. # of doc. | 2, 5, 10, 20, 50 |
4.3 Query features and labels for training
Query features. We need features to represent queries. Given a query, we extract the LETOR features (LETOR scoring functions ) that are implemented in the Terrier FAT framework222http://www.terrier.org/docs/v4.0/javadoc/index.html?org/terrier/matching/models/WeightingModel.html provides the details of the features and their implementation Macdonald et al. (2013). The Terrier FAT framework uses DAAT Turtle and Flood (1995) retrieval strategy to identify the initial sample of documents and keeps all the posting of these documents in memory. This strategy allows fast computation of any scoring function (i.e., weighting function) without resorting the expensive inverted index in real-time.
We extract the query-document features using Terrier’s weighting model333http://terrier.org/docs/v5.2/javadoc/org/terrier/matching/models/WeightingModel.html) (See Table 2).
| WMODEL:Tf | WMODEL:TF_IDF | WMODEL:LemurTF_IDF |
| WMODEL:BM25 | WMODEL:Js_KLs | WMODEL:In_expC2 |
| WMODEL:InB2 | WMODEL:DLH | WMODEL:ML2 |
| WMODEL:BB2 | WMODEL:DFIC | WMODEL:IFB2 |
| WMODEL:InL2 | WMODEL:PL2 | WMODEL:LGD |
| WMODEL:MDL2 | WMODEL:DirichletLM | WMODEL:DFRee |
| WMODEL:Hiemstra_LM |
LETOR features are extracted for the initial documents retrieved based on the reference configuration Macdonald et al. (2013). We aggregate these features over the documents for a given query as to obtain LETOR features at a document set level Chifu et al. (2018); Balasubramanian et al. (2010). We use the mean, standard deviation, and maximum summary functions to obtain the feature vectors that represent each query-configuration pair. We chose these aggregation functions as Chifu et al. showed that they are complementary for query performance prediction Chifu et al. (2018).
Labels for the training examples and evaluation measures. For the training queries, the label is the effectiveness of the configuration when treating the query. We keep both the configuration and the associate effectiveness for each query and each configuration. We performed a series of experiments in which the type of label, that is to say, the effectiveness measure we use, changes. We considered successively different types of labels, either ad hoc-oriented or diversity-oriented effectiveness measures (see Subsection 4.5).
4.4 Data collection
We considered six standard TREC collections: TREC78, WT10G, GOV2, MS MARCO from the ad hoc task and Clueweb09, and Clueweb12 from the diversity task.
For TREC78, there are approximately 500K newspaper articles. The WT10G collection is composed of approximately 1.6 million Web/Blog page documents. GOV2 collection includes 25 million web pages, a crawl of .gov domain. MS MARCO collection includes 3.2 million documents. Clueweb09B and Clueweb12B contain 50 and 52 million web pages.
The TREC test collections include topics. The “standard" format of a TREC topic statement comprises a topic ID, a title, a description, and a narrative. The title contains two or three words on average that represent the keywords a user could have used to issue a query to a search engine. We use the title part only in the evaluation.
| Collection | #Docs | Queries (title only) | Avg. Rel. | Avg. Irrel. | |
| Ad hoc | TREC78 | 528K | 100 (351 – 450) | 92.02 | 1577.73 |
| WT10G | 1.692M | 100 (451 – 550) | 59.80 | 1344.90 | |
| GOV2 | 25M | 150 (701 – 850) | 179.45 | 722.90 | |
| MS MARCO | 3.2M | 5,193 (Dev set) | 1.00 | 0.00 | |
| Diversity | Clueweb09B | 50M | 200 (001 – 200) | 166.26 | 633.45 |
| Clueweb12B | 52M | 100 (201 – 300) | 197.50 | 689.04 |
Table 3 summarizes a few features about these collections. There are 100 topics in TREC78 (merging topics from TREC7 and TREC8), 100 topics in WT10G, 150 topics in GOV2, 5193 topics in MS MARCO (Development set), 200 topics in Clueweb09B (merging the 2009 to 2012 web track queries), and 100 topics in Clueweb12B (merging the 2013 and 2014 queries).
Finally, the collections provide qrels (i.e., judged documents with eventually graded relevance for each topic). Table 3 also reports the average number of judged relevant (Avg. Rel.) and irrelevant (Avg. Irrel.) documents for each of the collections. Except for MS MARCO, each collection has deep relevance judgments. MS MARCO has a shallow relevance judgment and has only one relevant document per query.
4.5 Evaluation measures
We used the common evaluation measures to estimate the retrieval effectiveness for a query with a configuration.
-
•
Precision at the cut-off 10 documents (P@10), Average Precision (AP) Carterette and Voorhees (2011); Sakai (2007), normalized Discounted Cumulative Gain (nDCG) Järvelin and Kekäläinen (2017), and Ranked Biased Precision (RBP) Moffat and Zobel (2008) documents are used for ad hoc search evaluation of the queries from TREC78, WT10G, GOV2, and MS MARCO collections (in the latter AP is replaced by RR). We use evaluation program trec_eval444http://trec.nist.gov/trec_eval/ to estimate AP, nDCG@10, and P@10 metrics and rbp_eval555https://github.com/jsc/rbp_eval to compute the RBP metric with persistence levels 0.50, 0.80, and 0.95, respectively. The P@k and AP are defined based on binary relevance, while nDCG@k is based on graded relevance. The RBP metric is defined based on either binary or graded relevance. Unlike other metrics, RBP metric includes a user persistence parameter which can be used to observe users’ browsing behavior in the ranked list. Moreover, the RBP metric helps us to explore the limits of residual error, considering the unjudged documents in the ranked list as judged and relevant. Thus, the analysis of the effect of shallow vs. deep relevance judgments could be feasible using RBP metric.
-
•
Intent-aware expected reciprocal rank at the cut off 20 (ERR-IA@20) (Official metric) Chapelle et al. (2009), -nDCG@20 where is set to 0.5, and novelty & rank-biased precision (NRBP) Clarke et al. (2008) are used for diversity-oriented search evaluation on Clueweb09B and Clueweb12B collections. We use evaluation program ndeval666https://trec.nist.gov/data/web/11/ndeval.c to calculate the effectiveness measures for diversity metrics.
4.6 Cross-validation
Learning is based on the training queries, then the trained meta-search model is applied to the test queries. We used two-fold cross validation to ensure independent sets and keep enough queries in both the training and test sets Wong and Yang (2017). We proceeded as follows: half of the queries, let us call this query set , are used for training while the other half, , is used for testing. Then, in a reverse sense, is used for training while is used for testing. We made draws to randomly split queries into and and averaged the results. To prepare the folds for three trials, we randomly shuffled the queries using R’s sample function (random seed=42) and divide the query set into two subsets for each trial. We report the mean and standard deviation across the three trials and two directions. Thus, each mean and standard deviation is over a total of six measurements. The same splits are used whatever the method that needs training.
For statistical significance analysis, we use two-tailed paired t-test with Bonferroni correction (p-value 0.05).
4.7 Baselines and related work methods
Non selective baselines. We consider the following baseline methods for which the same process is applied what ever the query is (non-selective query processing methods thus) :
-
•
BM25 is obtained using Terrier BM25 with default parameters b=0.75 and k=1.2 (default hyperparameter values) Robertson et al. (2009) on the entire set of the queries;
-
•
L2R-D SVMr is the usual learning to rank documents where the initial ranking is obtained using BM25. L2R is based on SVM-rank for which we obtained the best results compared to other L2R algorithms (we tried Random Forest, SVM-rank, -MART and LISTNet). L2R ranks needs positive and negative examples. To select positive and negative examples, we consider the relevance judgment of each collection. Given a query the documents with an effectiveness label greater than 0 are considered positive examples, while documents labeled as less than or equal to 0 are considered negative examples. If there is no document labeled with a negative grade, we retrieve 1,000 ranked documents as baseline retrieval for a query using BM25 model and consider the same number of positive documents from bottom-ranked one of baseline retrieval as the negative examples;
-
•
GS is Grid Search that learns the best value for each parameter to maximize the effectiveness for a set of queries Taylor et al. (2006);
-
•
Best trained is the best configuration among the entire configuration set, the one that maximized the effectiveness measure considered: it is chosen for and applied to and vice versa;
-
•
CombSum: It implements data fusion as the combinations of system document lists; we consider the CombSum Fox and Shaw (1994) on the two first configurations selected by .
Among all these baselines, BM25 is the only one that does not need training but rather is applied on the entire query set. Thus, BM25 is deterministic. The other baselines are reported considering 2-fold cross-validation for three random trials. The same three splits are used whatever the method is. We report the average over the three trials and the two test folds as well as the standard deviation.
Selective approaches.
In the evaluation section, in addition to our selective query processing strategy (ERisk-Cosine), we report :
-
•
Trained SQE considers two configurations: one with query expansion and one without query expansion. We took the best configuration ("Best conf.") and its query expansion/non query expansion counterpart. In cases where the best configuration did not include query expansion, we chose the best configuration with query expansion from the pool as its counterpart. Then we trained the meta-system for selective query expansion.
-
•
Random20-RF: L2R configuration selection as presented in Deveaud et al. Deveaud et al. (2018). Like in L2R documents, for L2R configuration, the ranking model can learn from the training data by minimizing the loss function . The results with various L2R models (Linear Regression, Random Forest (RF), SVM-Rank, and LambdaMart Wu et al. (2010)) are not significantly different. We report RF only. Here the 20 candidate configurations are selected randomly.
-
•
ERisk-RF: Like Random20-RF but here the configuration selection is using the function, following the framework of our previous work in CIKM Mothe and Md Zia (2021).
The ERisk-Cosine is similar to ERisk-RF but here, the selective query processing step does not rely on a heavy training but just on the query feature similarities; which is an extension of this current paper. All these methods are based on a training/testing principle. We use exactly the same three random splits as for the baselines that need training; we report the average and standard deviation.
Oracles. We also report the following Oracle methods:
-
•
Best conf.: the best configuration in the pool of configurations; the one that maximizes the considered evaluation measure (the configuration may be different according to the measure);
-
•
Oracle: for each of the queries, this is the best configuration among the possible configurations;
-
•
Oracle20ERisk: for each of the queries, this is the best configuration among the possible configurations selected using the corresponding Risk function, and
-
•
Oracle20Random: for each of the queries, this is the best configuration among the possible configurations selected randomly.
Oracle methods are not deterministic: it is impossible to select them automatically. Rather, Oracles would need a perfect system that chooses the most appropriate configuration per query that in practice can not be obtained automatically. We report the result for the first random split for Oracles.
5 Results and discussion
In the first series of experiments, we evaluate the function with a fixed number of configuration candidates on ad hoc retrieval (Section 5.1) and on the diversity task (Section 5.2). We analyze the impact of , the number of configuration candidates (Section 5.3) and compare and (Section 5.4) on both tasks. We study the specific case of sparse feedback with the MS MARCO data set (Section 5.5). Finally, we provide some insights into our results (Section 5.6).
5.1 function for ad hoc search
Our framework consists of two selective stages the first being to select the most appropriate candidate configurations from the entire configuration set and then to choose the best configuration for each query.
To evaluate the impact of the function, we compare its results against where configurations are randomly selected as in Deveaud et al. Deveaud et al. (2018). We consider a fixed number of configurations. Following initial experiments we set this number to 20 (see also Section 5.3). We thus consider either 20 randomly777We use https://docs.python.org/3/library/random.html#random.samplefunction selected configurations (Random20-RF row) or 20 configurations chosen using . These configurations are then used in phase 3 by either the L2R configuration-based model888The results slightly differ from the ones in Mothe and Ullah Mothe and Md Zia (2021) where we consider 20 configurations in phase 2 but only 2 configurations in phase 3. (ERisk-RF) or the Cosine -based model (ERisk-Cosine).
| GOV2 | |||||||
| Absolute values | Percentage (%) | ||||||
| Methods | AP | nDCG@10 | P@10 | AP | nDCG@10 | P@10 | |
| Baselines | BM25 | .27 | .46 | .54 | -04% (-23%) | -06% (-12%) | -05% (-13%) |
| L2R-D SVMr | .28[.001] | .49[.002] | .57[.003] | na (-20%) | na (-06%) | na (-08%) | |
| GS | .35[.005] | .52[.003] | .62[.008] | +25% (na) | +06% (na) | +09% (na) | |
| Best trained | .35[.005] | .49[.012] | .59[.010] | +25%(+00%) | +00% (-06%) | +04% (-05%) | |
| CombSUM | .36 [.003] | .54 [.005] | .65 [.008] | +29% (+03%) | +10% (+04%) | +14% (+05%) | |
| SQP | Trained SQE | .35 [.005] | .52 [.003] | .63 [.007] | +25% (+00%) | +06% (+00%) | +11% (+02%) |
| Random20-RF | .33△↓ [.003] | .48↓ [.007] | .58 [.009] | +17% (-05%) | -02% (-08%) | +02% (-06%) | |
| ERisk-RF | .39△↑ [.002] | .61△↑ [.010] | .73△↑ [.015] | +39% (+11%) | +24% (+17%) | +28% (+17%) | |
| ERisk-Cosine | .40△↑ [.003] | .62△↑ [.003] | .76△↑ [.019] | +43%(+14%) | +27% (+19%) | +33% (+23%) | |
| Oracles | Best conf. | .36 | .52 | .63 | +29% (+03%) | +06% (+00%) | +10% (+02%) |
| Oracle20ERisk | .42 | .68 | .80 | +50% (+20%) | +39% (+31%) | +40% (+29%) | |
| Oracle20Random | .41 | .68 | .79 | +46% (+17%) | +39% (+31%) | +39% (+27%) | |
| Oracle | .50 | .85 | .94 | +79% (+43%) | +73% (+63%) | +65% (+52%) | |
Tables 4 and 5 report the results on the three ad hoc collections for . Table 4 reports the results for the function on the GOV2 collection; this is the largest collection of the three ad hoc collections we considered. Horizontally, the first block reports the baselines we described in Section 4.7, the second block is the variants of the risk-based and selective query processing approaches and finally the last block is the Oracles. The left column of results in the table reports the absolute values of the measures when averaged over three different random splits for 2-fold cross validation. We also report the standard deviation in square brackets. On the right column, we report the percentage increase/decrease when compared to, on the one hand L2R documents and on the other hand grid search (in parenthesis).
From these results, we can observe that models (the two last rows from the 2nd horizontal block, the first one as presented at CIKM and the second being specific to this extended version) outperform all the baselines (1st horizontal block) as well as the other selective approaches when considering randomly selected configurations. The differences are statistically significant when compared to both grid search () and L2R document () baselines.
Compared to previous selective query processing strategies, the very impact of the second phase of the process, the risk-based selection, can be evaluated by comparing Random20-RF and both ERisk-RF, where the third phase is identical for both. The impact of the third phase of the process can be evaluated when comparing ERisk-RF and ERisk-Cosine. Finally, the overall process can be evaluated when comparing ERisk-Cosine and L2R-D SVM; both make use of LETOR features in a training process. The overall process can also be compared to a single optimal configuration (e.g. GS) and to data fusion (CombSUM).
From the results in Table 4, we can conclude that the component of the process with greatest impact is the configuration selection part that we developed in this research. Within the selective query processing (SQP) block, when we compare the randomly selected configurations and the selection, we can observe that models outperform (statistically significantly) the Random one. We can also observe that the results are robust according to the standard deviation across the three random train/test splits.
Among more than different configurations, the configuration that maximizes P@10 (Best conf. in Table 4) obtains 0.63 (InB2 retrieval model with expansion model KLCorrect with 5 expansion documents, 20 expansion terms, and 2 minimum documents that those terms should occur in); the same configuration also maximizes nDCG@10 and obtains 0.52. The one that maximizes AP obtains 0.36 (DFRee model with expansion model Bo1 with 20 expansion documents 20, 20 expansion terms, and 5 minimum documents). The best configuration from among the is also the best configuration from among the 20 functions. By definition, the best configuration for a given measure cannot be surpassed by any other single configuration. It is not possible however to decide in advance what will be the best configuration for a given collection as this is something only an Oracle can do.
The best trained configuration (second to last row in the baseline block) uses exactly the same train/test splits as our models and selects a single configuration based on the training queries. This selected configuration is then used for all the test queries. It is thus a fair baseline since, as our methods, it can be trained. Best trained model obtains P@10 of 0.59. It is important to mention that none of our initial configurations use document re-ranking. This is what L2R-D (L2R documents) does (2nd line in the baseline block). L2R-D surpasses BM25 on which it is based for the initial document ranking but is not the best trained on P@10 or AP. Some other single configurations, including the best, surpass L2R-D but this best configuration cannot be decided prior to evaluation. The grid search (GS) is able to find a configuration close to the best configuration (P@10 is 0.62). The same comments hold also for AP and nDCG@10. GS is the best among the baselines that use a single configuration, then best trained and L2R-D are relatively close one another. Both require training and both use a single configuration for all the test queries. CombSUM uses several configurations for which the resulting document lists are fused, surpasses the baselines that use a single configuration. CombSUM is very close to the Train SQE method and to the best configuration oracle. All the selective query processing methods have, however, the further advantage of single query processing for each query once decided, while CombSUM needs to evaluate several and thus CombSUM is less efficient. The based models are also much more effective than CombSUM.
Regarding the variants of our models that differ according to the third phase, either Cosine () or L2R using random forest (), we can see that the simplest method (Cosine) is also the most effective. The reason may be because of the quality of the representation: in learning to rank, the training features consist of the LETOR features plus the configuration features where configuration features are the ones presented in Table 1 transformed into numerical values. This representation is less effective than in the second case where we compare queries with LETOR features only. We used three trials for randomly splitting training and test queries. As we mentioned earlier, the table reports the average values and standard deviations. Most of the standard deviations are in of the order of , which means the method is robust. This also holds for baseline results.
Finally, Oracles indicate the maximum effectiveness that we could reach with a perfect match between a query and the best configuration for that query, whatever the query is. Although our models can still be improved to reach these maxima, we can observe that the training works pretty well and our models are at the midway point when considering the best configuration of the pool on the one hand (e.g., P@10 0.59) and the oracle on the other (e.g., P@10 0.80). Oracle20ERisk is when the perfect query-configuration match is based on the 20 configurations that are selected by the function, Oracle20Random is when this perfect match is based on 20 randomly selected configurations while Oracle is when all configurations are used and there is no risk function applied. Comparing Oracle20Erisk and Oracle we see that although Oracle is better than Oracle20ERisk, the decrease in the number of configurations by a factor of 1,000 (from to 20) does not drastically affect performance. This shows that the candidate selection phase with is effective.
The right column of Table 4 reports the percentage of decrease/increase compared to L2R-D and GS. We can see that using different configurations rather than a single one in an adaptive way leads to +11 to +17 % for ERisk-RF (+14 to +22 % for ERisk-Cosine) of effectiveness when compared to using a single optimized configuration (grid search). We think percentages are also worth reporting to show the impact of our model.
More surprising are the results of Oracle20Random compared to Oracle20Erisk in Table 4 (e.g., P@10 is 0.79 and 0.80). These results imply that even randomly chosen configurations can lead to high effectiveness if they are appropriately associated with the queries to process. There are two possible reasons for this. First GOV2 is indeed an “easy" collection where a majority of configurations work well on queries. The second is that some configurations may be effective by chance but it is likely that training will not generalize well on these configurations.
We looked at the number of queries that were improved by our method using . For example, when considering and P@10 on GOV2, there are 90 queries that are improved compared to GS; on TREC78 and WT10G, there are 73 queries that are improved.
Table 5 reports the results for both TREC78 and WT10G collections, still for function and with configurations.
| TREC78 | WT10G | ||||||
| Methods | AP | nDCG@10 | P@10 | AP | nDCG@10 | P@10 | |
| Baselines | BM25 | .21 | .47 | .45 | .22 | .39 | .38 |
| L2R-D SVMr | .22[.000] | .48[.001] | .46[.004] | .20[.002] | .34[.002] | .32[.005] | |
| GS | .24[.003] | .51[.019] | .47[.003] | .24[.001] | .40[.001] | .38[.020] | |
| Best trained | .25 [.010] | .52 [.008] | .47 [.009] | .22 [.006] | .40 [.002] | .40 [.012] | |
| CombSUM | .25 [.002] | .53 [.003] | .50 [.002] | .25 [.005] | .42 [.003] | .40 [.004] | |
| SQP | Trained SQE | .25 [.002] | .53 [.007] | .49 [.006] | .24 [.002] | .40 [.016] | .39 [.018] |
| Random20-RF | .22 [.003] | .49 [.007] | .46 [.004] | .26△ [.009] | .41△ [.003] | .39△ [.008] | |
| ERisk-RF | .27△↑ [.005] | .58△↑ [.006] | .55△↑ [.014] | .28△↑ [.017] | .47△↑ [.014] | .43△↑ [.015] | |
| ERisk-Cosine | .28△↑ [.002] | .60△↑ [.002] | .57△↑ [.010] | .30△↑ [.011] | .51△↑ [.002] | .49△↑ [.008] | |
| Oracles | Best conf. | .26 | .54 | .51 | .25 | .42 | .41 |
| Oracle20Erisk | .29 | .63 | .61 | .33 | .53 | .52 | |
| Oracle20Random | .24 | .58 | .55 | .31 | .52 | .49 | |
| Oracle | .39 | .83 | .80 | .45 | .72 | .69 | |
In Table 5, we can observe that for these two other ad hoc collections, models also outperform (statistically significantly) all the baselines. We also can draw the same conclusion as for Table 4 regarding baselines where GS is close to the best possible configuration (Best conf.). L2R-D is slightly lower than the best trained and sometimes surpasses the initial BM25. CombSUM and Trained SQE are close one to the other, also close to best trained.
Again, our methods are at the midway point between the best possible configuration of our pool (e.g., on TREC78, nDCG@10 is 0.54 for the best configuration in the ones while our models achieve 0.58 or 0.60, the oracle20Random when using 20 configurations randomly gets 0.58 while the oracle20ERisk is 0.63 when using the 20 configurations selected by .) With regard to the percentage effectiveness increase compared to best trained (not reported in the Table), for example, this is (resp. ) for nDCG@10 on TREC78 (resp. WT10G).
Separately from GOV2, on these two additional collections, when the 20 configurations are selected randomly rather than selected using , the effectiveness is low both for the L2R model and for the Oracle20Random which would perfectly decide which of the 20 configurations should treat a given query (e.g., nDCG@10 is 0.49 for L2R with Random20 and 0.58 for Oracle20Random, while BM25 is 0.47 on TREC78). These collections are harder than GOV2 and some configurations fail on some queries. Our risk-based methods are very effective on such hard collections.
5.2 function for diversity-oriented search
The next question we target is whether the model generalizes well on a different task. Table 6 reports results when considering diversity-oriented search for both the Clueweb09B and Clueweb12B collections, still using the function with 20 configurations.
| Clueweb09B | Clueweb12B | ||||||
| Methods | ERR-IA | -nDCG | NRBP | ERR-IA | -nDCG | NRBP | |
| Baselines | BM25 | .21 | .18 | .21 | .35 | .33 | .34 |
| L2R-D. (SVMr) | .23 [.001] | .33 [.001] | .20 [.001] | .37 [.013] | .46 [.010] | .32 [.014] | |
| GS | .29 [.001] | .24 [.002] | .28 [.001] | .41 [.004] | .40 [.002] | .42 [.003] | |
| Best trained | .27 [.022] | .22 [.018] | .26 [.022] | .40 [.019] | .37 [.025] | .38 [.019] | |
| CombSUM | .27 [.004] | .35 [.007] | .25 [.004] | .46 [.007] | .52 [.008] | .43 [.014] | |
| SQP | Train-SQE | .22 [.009] | .19 [.009] | .22 [.009] | .35 [.009] | .33 [.013] | .34 [.012] |
| Random20-RF | .24↓ [.013] | .20▽↓ [.008] | .24△↓ [.014] | .38 [.012] | .36▽ [.003] | .36 [.004] | |
| ERisk-RF | .33△↑ [.011] | .27▽↑ [.009] | .33△↑ [.010] | .52△↑ [.019] | .51↑ [.015] | .53△↑ [.011] | |
| ERisk-Cosine | .33△↑ [.004] | .43△↑ [.016] | .32△ [.007] | .58△↑ [.009] | .63△↑ [.003] | .58△↑ [.005] | |
| Oracles | Best conf. | .29 | .24 | .29 | .45 | .42 | .44 |
| Oracle20Erisk | .59 | .48 | .60 | .74 | .72 | .75 | |
| Oracle20Random | .44 | .36 | .44 | .62 | .60 | .63 | |
| Oracle | .67 | .55 | .68 | .80 | .77 | .81 | |
For diversity search, methods surpass (statistically significantly) L2R documents on both collection for ERR-IA, -nDCG, and NRBP (see Table 6) while methods surpass (statistically significantly) GS on any measures and for both collections except for NRBP on Clueweb09B collection. They are also higher than the best configuration that GS finds in the case of Clueweb09B and is close to the best in the case of Clueweb12B. There is no statistically significant differences among the variants of the models. Erisk-Cosine is better than Erisk-RF for -nDCG on Clueweb09B and across all metrics on Clueweb12B. Like for ad hoc search, Oracle20ERisk and Oracle20Random are obviously lower than Oracle, but Oracle20ERisk is much higher than Oracle20Random. This shows that the selection method is as good as for the ad hoc task. Regarding the third phase of training, when comparing ERisk-RF and ERisk-Cosine we can see that like for ad hoc, the results are better using the Cosine query-configuration association (one exception is for NRBP which decreases slightly from RF to Cosine variants). With regards to the percentage of effectiveness increase, for example, ERR-IA increases by (resp. +41%) on Clueweb09B (resp. Clueweb12B) compared to GS. We did not report the percentages here to limit the size of the tables.
5.3 Influence of the number of candidate configurations
The model is designed to select and use a pre-defined number of configurations . The higher the number of configurations, the more complex the meta-system is. It is also likely that the number of configurations will impact on the final results. One could hypothesize that the higher the number of configurations, the better the meta-system effectiveness. However, there is a risk of a non-optimized model if there are too few configurations, and on the other hand there is the risk of overfitting if there are too many configurations compared to the number of examples used in training.
In this section, we focus on evaluating the ability of the risk functions that we developed to select the appropriate minimal set of configurations. Our objective is not to decide the exact optimized value because it is likely to be dependent on the collection and machine learning method but rather the objective is to get an insight into the evolution of results according to the number of configurations used.
For this, we report in Figure 3 the results with the function on the three collections for ad hoc and on two collections for diversity, for different values of . is the number of configurations that are selected by from among the pool of configurations that are then candidates for selection in the third phase. We use a single query trial since we have shown in Section 5.1 that the results are stable and robust.
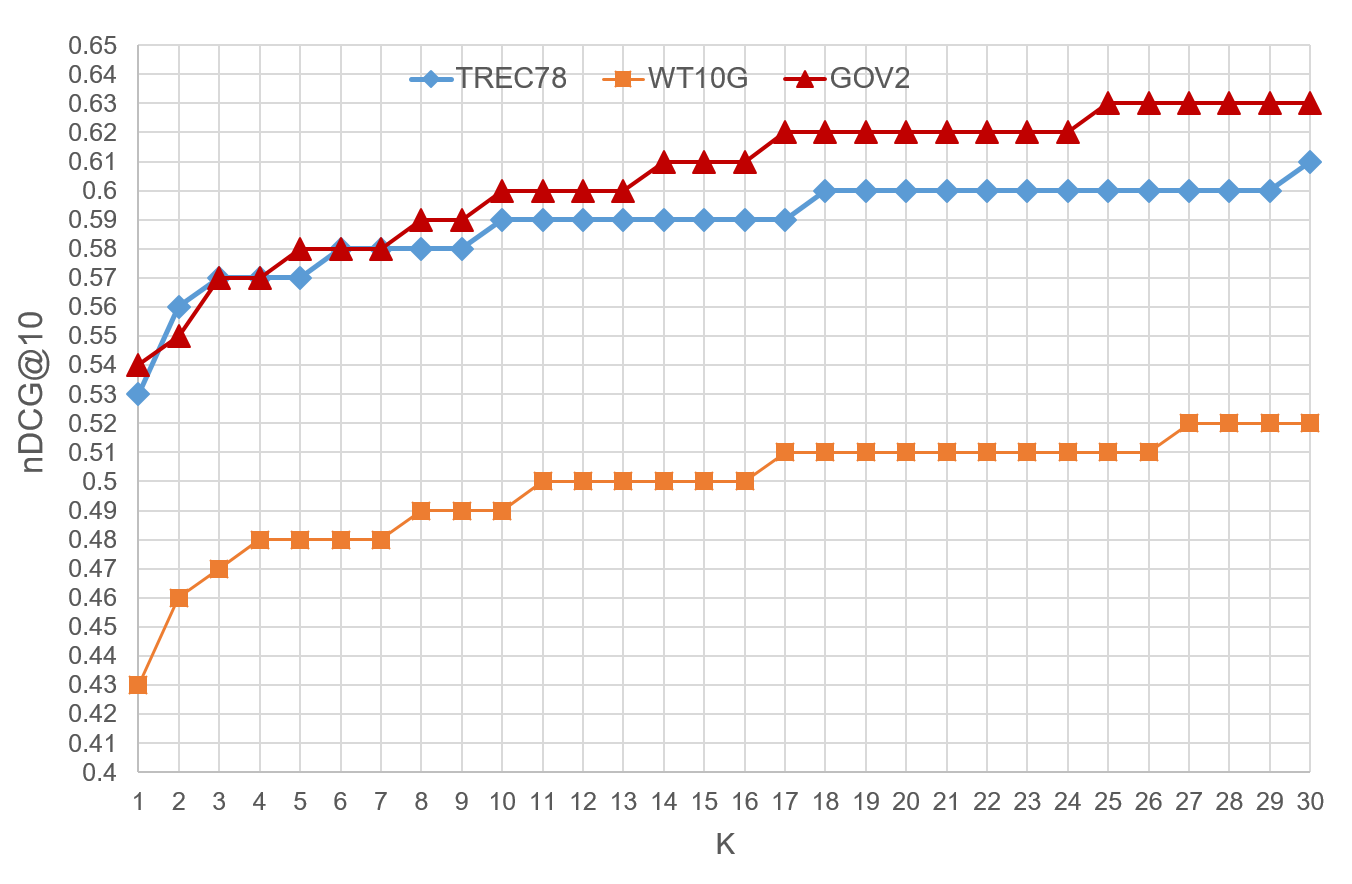
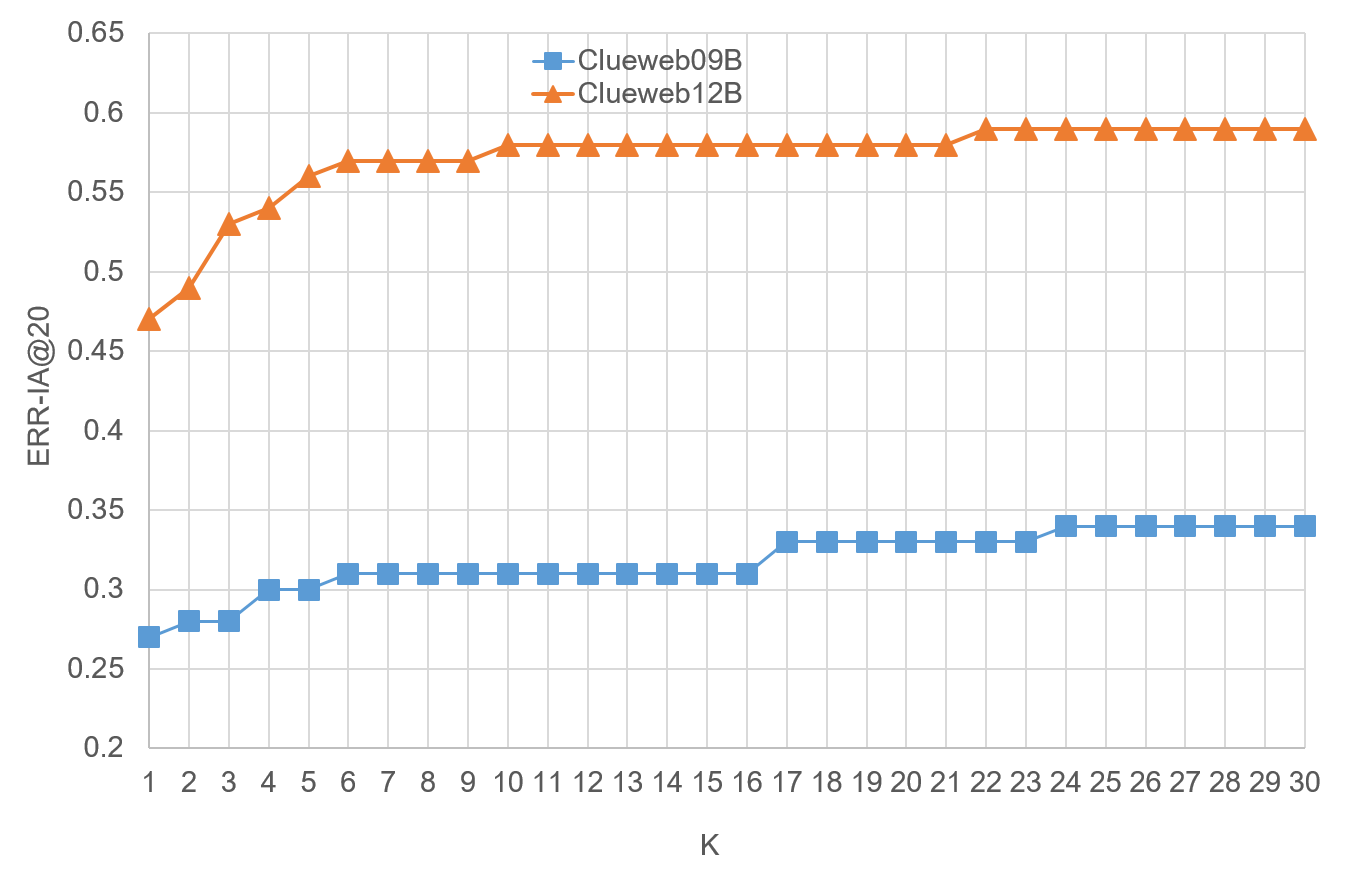
(a) Ad hoc search (b) Diversity-oriented search
We can observe from Figure 3 that effectiveness increases with the number of configurations used, growing in increments. We can observe some stages on the curves which mean that an added configuration does not increase overall performance. Considering the iterative process, that means that either the newly added configuration just improves slightly the effectiveness on one or very few queries which is not visible once averaged over the query set, or that this configuration is not selected in the third phase of the process. In that latter case, that means that the configuration would be useful if the query-configuration matching was appropriate.
5.4 vs functions
In Section 3, we developed two risk functions that do not have the same objectives. While aims at optimizing the effectiveness values, aims at optimizing the number of queries for which effectiveness will be improved. As a result, overall effectiveness for cannot be higher than that for , but the expected advantage of over is that it minimizes the number of queries that have poor results and is thus a user-oriented function. Indeed overall effectiveness can be improved because the results of “easy" queries have been improved while search engines should also care about the problem of “hard" queries. In the past, Mizzaro and Roberts mentioned that “a system that wants to be effective in TREC needs to be effective on easy topics" Mizzaro and Robertson (2007). tackles this problem by trying to improve all the queries, considering it is more appropriate to improve slightly a lot of query results rather than improving a lot a few queries that may be already well answered by the system.
| GOV2 | ||||
| AP | nDCG@10 | P@10 | ||
| Baselines | BM25 | .27 031 - 118 | .46 048 - 85 | .54 31 - 78 |
| L2R-D. (SVMr) | .28 035 - 113 | .49 052 - 78 | .57 37 - 65 | |
| Best trained. | .35 065 - 039 | .49 059 - 72 | .59 47 - 58 | |
| CombSUM | .36 096 - 051 | .54 072 - 56 | .65 44 - 36 | |
| GS | .35 | .52 | .62 | |
| SQP | Random20 | .33△↓ 047 - 101 | .48↓ 053 - 80 | .58 044 - 70 |
| NRisk-RF | .38△↑ 103 - 045 | .60△↑ 099 - 40 | .73△↑ 083 - 17 | |
| NRisk-Cosine | .45△↑ 147 - 001 | .75△↑ 139 - 00 | .84△↑ 107 - 00 | |
| Best conf. | .35 079 - 054 | .49 054 - 54 | .59 16 - 16 | |
| Clueweb12B | ||||
| ERR-IA | -nDCG | NRBP | ||
| Baselines | BM25 | .35 38 - 52 | .33 47 - 41 | .34 27 - 61 |
| L2R-D. (SVMr) | .37 45 - 48 | .46 59 - 33 | .32 36 - 55 | |
| Best trained. | .40 32 - 34 | .37 50 - 42 | .37 50 - 42 | |
| CombSUM | .46 58 - 33 | .52 66 - 23 | .43 52 - 38 | |
| GS | .41 | .40 | .42 | |
| SQP | Random20 | .3835 - 49 | .37▽45 - 43 | .3844 - 47 |
| NRisk-RF | .3831 - 56 | .36▽46 - 50 | .3749 - 43 | |
| NRisk-Cosine | .67△↑ 94 - 5 | .70△↑ 92 - 7 | .67△↑ 89 - 9 | |
| Best conf. | .45 59 - 35 | .42 68 - 26 | .44 55 - 39 | |
Table 7 describes the results for . We report the average effectiveness and standard deviations as well as the number of queries for which the models improve/decrease the effectiveness of the query compared to grid search (GS, the best baseline, see Tables 4 and 5).
Compared to , we expect to be slightly less efficient on average but to improve more queries than baselines. The difference between and in terms of effectiveness is small (e.g., -3% on GOV2 for nDCG@10 and P@10) and it is slightly larger for diversity-oriented search.
targets the number of improved queries and improves more queries than does. For example, considering Risk-RF on GOV2 with P@10, when compared with GS, there are 107 queries that are improved with , while there are 80 with . More surprisingly, the overall effectiveness is also higher with than with which however targets effectiveness: on GOV2, P@10 is 0.76 for and 0.84 for , nDCG@10 is 0.62 for , and 0.75 for . The same holds for the Clueweb12B collection. Most of the comments we made on regarding comparisons between the baselines among them and with on the one hand selective methods and on the other hand Oracle, also hold for . The BM25 baseline is the lowest. Learning to rank improves that baseline but a single configuration that involved training is better. Selective query processing are the best and among them the Cosine version of our risk-based method is the best performing and surpasses the best single configuration an Oracle would choose. The Cosine version is also the best in terms of improved queries; more than 3/4 of the queries are improved.
Since these two objective functions and do not target the same goal, they could also be combined. We keep this for future work.
5.5 Impact of Shallow vs. Deep Relevance Judgments
In the previous series of experiments, we considered collections for which the number of judged documents (positive and negative) is rather high (see Table 3). For example, on the GOV2 collection, on average there are 902 assessed documents per query, 179 of which are marked as relevant. In this section, we consider the MS MARCO document ranking collection999https://microsoft.github.io/MS-MARCO-Document-Ranking-Submissions/leaderboard/, which has shallow relevance judgments. We consider the development set for which there are 5,193 queries with only one relevant document per query and no negative judgments. This collection thus offers a completely different evaluation context for ad hoc retrieval.
We first report the results when using the usual ad hoc metrics (see Table 8)101010MAP is replaced here by mean reciprocal rank (MRR) since there is a single known relevant document. Reciprocal rank is defined as 1/rank where rank is the rank of the relevant document. MRR is RR averaged over the topics. The results for are consistent with those found for other ad hoc collections and diversity collections. Specifically, combined with a Cosine similarity in the third phase is very effective. It is slightly better than our other version of the risk function. The differences compared to other trained methods is less impressive for the other collections, but MS-MARCO evaluation has biases. However, the better performance of the over both learning to rank documents and the best trained single configuration is statistically significant.
| MS MARCO | ||||
| Absolute values | ||||
| Methods | RR | nDCG@10 | P@10 | |
| Baselines | BM25 | .27 | .32 | .05 |
| L2R-D SVMr | .28 [.000] | .33 [.000] | .05 [.000] | |
| Best trained | .27 [.002] | .32 [.002] | .05 [.000] | |
| CombSUM | .28 [.001] | .33 [.001] | .05 [.000] | |
| SQP | Trained SQE | .28 [.000] | .32 [.001] | .05 [.000] |
| Random20-SVMr | .22▽↓ [.045] | .27▽↓ [.055] | .05▽↓ [.004] | |
| ERisk-SVMr | .28 [.000] | .32 [.001] | .05 [.000] | |
| ERisk-Cosine | .29△↑ [.006] | .34△↑ [.005] | .05△↑ [.000] | |
| Oracles | Best conf. | .28 | .32 | .05 |
| Oracle20Random | .44 | .49 | .07 | |
| Oracle20ERisk | .33 | .38 | .06 | |
| Oracle | .70 | .73 | .08 | |
5.6 Insights into the results
Insights on the selected configurations
While our risk-sensitive functions choose some configurations as candidates for the meta-system, we are not sure if they are selected for the test/unseen queries. Figure 4 shows the distribution of the test queries according to the candidate configurations that the meta-system chose on the test queries after training on the training queries. We randomly select one of the trials of our three-cross validation for 20 configurations. We plot AP for the GOV2 collection but the others have the same general shape.
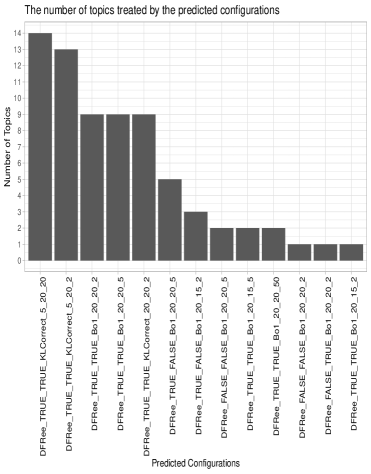
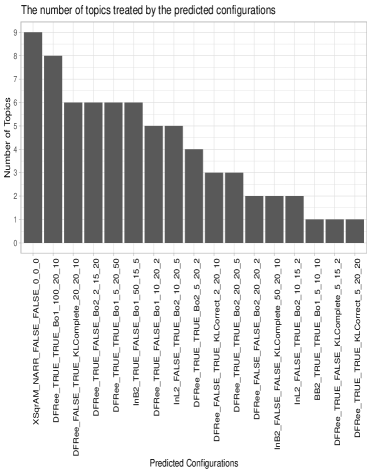
We can see that some configurations are not selected. There are 20 configurations in total but here 13 and 17 configurations were selected for at least one query. Some configurations are used for just one query, but several configurations are chosen for several queries. For example, the most used configuration is selected for 14 queries with and for 8 queries with on GOV2 and AP measure. Deeper analysis could be conducted in order to better optimize the number of configurations. This optimization could also take into consideration the query processing time (an automatically expanded query is more expansive to process than an initial query for example).
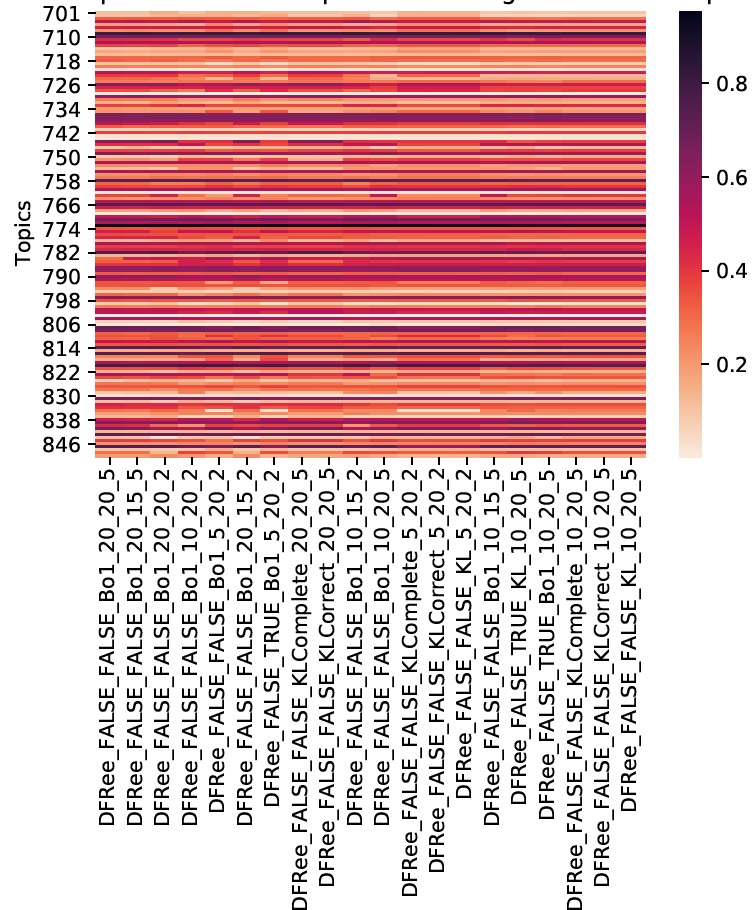
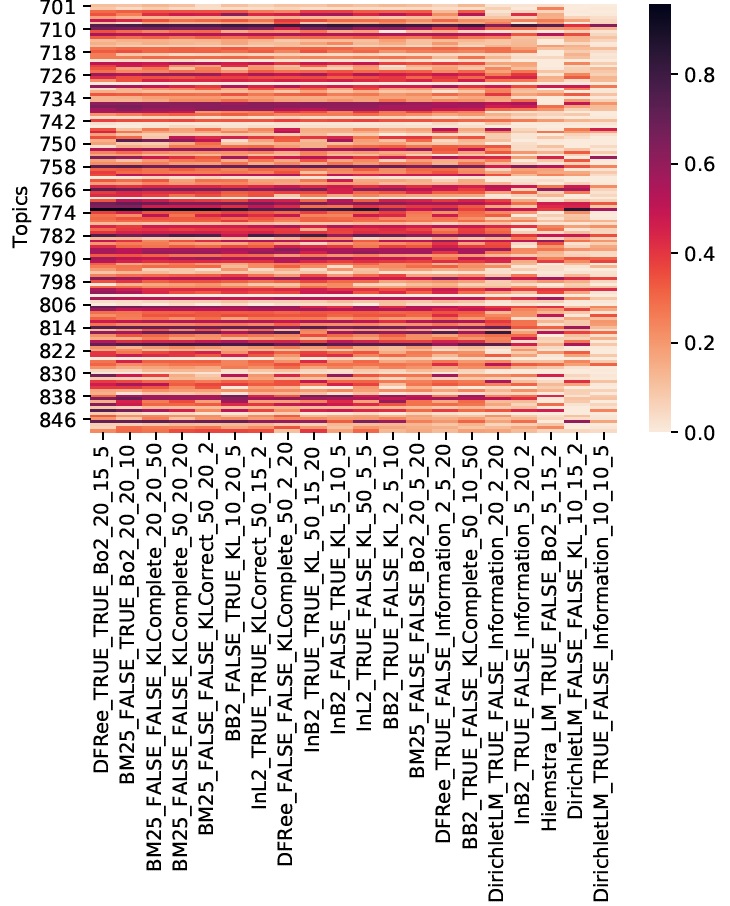
Figure 5 provides another interesting insight into the selected configurations. We observe that the risk of drastically decreasing effectiveness is much higher in random selection than if the association of configurations with the query is wrong (see Figure 5).
In this figure the heatmap on the left side shows the effectiveness (AP) of 20 configurations in the case of while the heatmap on the right side is the one with random selection. We can see that for GOV2, the is much more effective in general on the queries (the overall heatmap is darker in Figure 5). The same type of results were obtained for the other collections. Even if the system does not associate the best configuration with the query, the effectiveness will not drastically decrease in the case of while the best match is more crucial in the case of random selection. Indeed, while the perfect match using Oracle works almost the same for both random and selections, it is not the case for the automatic matching.
Impact of relevance judgments in the Top-n
The relevance judgments in each collection (qrels) include relevant or irrelevant documents except for MS MARCO (see Figure 3). Thus, given a query, the top-n retrieved documents from a corpus may include unjudged documents, which could be either relevant or irrelevant for the underlying query. We analyzed the coverage of judged (qrels) documents in the top-n documents retrieved from the corpus by the configurations and the 20 candidate configurations (ERisk) corresponding to each collection.
This coverage gives insights with regard to the reliable use of a performance metric at a particular cutoff. When comparing the coverage in between the initial configuration pool and the subset that the risk-sensitive function chooses, we can see the potential of the configurations.
We report the percentage of the top-n documents retrieved by the configurations that had been judged in Table 9. The percentage of the top-n documents retrieved by the configurations that had been judged is computed as follows:
where is the set of configurations, is the entire set of queries, is the ratio of the number of judged documents in the top-n documents retrieved for the -th query of the -th configuration to the top-n cutoff rank.
From Table 9, we can observe that when considering the full set of configurations, they can retrieve more than 80% of the judged documents in the top-10 rank for the TREC78, WT10G, and GOV2 collections. This is only 3.7% for the MS MARCO collection but this low coverage is expected because queries have only one judged (relevant) document. Regarding diversity collections, the configurations can retrieve 54% of the judged documents in the top-10 rank for Clueweb09B and 46% for Clueweb12B. This latter collection contains many noisy documents. Additionally, we report the statistics of judged documents retrieved for the 20 candidate configurations selected by the ERisk function. We can see that these 20 candidate configurations generally bring more relevant documents in the top-n, the only exception being for TREC78. We will see in the next sub-section that this is likely to be due to a better selection of relevant documents and not due to filtering out non-judged documents.
Although the percentage of relevant documents is relatively high in the top-10 cutoff ranks for the 20 candidate configurations, our proposed approach should still work at higher depth rank positions, for example, top-50 or top-100 ranks when we have a few relevant documents. We keep the analysis of the impact of higher depth ranks for future work.
| Collection | #Conf. | Top-10 | Top-20 | Top-30 | Top-50 | Top-100 | |
|---|---|---|---|---|---|---|---|
| Ad hoc | TREC78 | 25520 | 89% | 88% | 86% | 84% | 79% |
| TREC78 () | 20 | 80% | 80% | 79% | 78% | 76% | |
| WT10G | 25520 | 81% | 78% | 76% | 74% | 69% | |
| WT10G () | 20 | 99% | 99% | 99% | 98% | 95% | |
| GOV2 | 25520 | 86% | 83% | 81% | 78% | 72% | |
| GOV2 () | 20 | 99% | 98% | 97% | 96% | 92% | |
| MS MARCO | 5080 | 3.7% | 2.3% | 1.7% | 1.1% | 0.6% | |
| MS MARCO () | 20 | 5.2% | 3.1% | 2.3% | 1.5% | 0.8% | |
| Diversity | Clueweb09B | 25520 | 54% | 48% | 43% | 36% | 27% |
| Clueweb09B () | 20 | 68% | 61% | 55% | 47% | 35% | |
| Clueweb12B | 25520 | 46% | 39% | 35% | 29% | 20% | |
| Clueweb12B () | 20 | 67% | 54% | 51% | 41% | 29% |
Uncertainty of performance
To observe the approximate uncertainty of performance, we consider the RBP metric Moffat and Zobel (2008) and report the results for both the MS MARCO (shallow) and TREC78 (deep) collections. We also report the results of the RBP lower bound as well as the residual error, RBP+Error (see Table 10). This will give us insights into whether our methods just filter out unjudged documents from the retrieved document list.
From the right side and upper-part of Table 10, we can observe the residual error RBP+Error, which highlights the RBP upper bound if we consider the unjudged documents in the retrieved list as judged and relevant. In the case of the shallow judgments collection (MS MARCO top part of the Table), the residual error is very high, the reason being that the qrels has only one judged and relevant document per query and in other words, 99% of the documents are unjudged. We can observe that the residual error is very high whatever method used. Even Oracle with configurations has a high residual error and MS MARCO is also known for having biases Gupta and MacAvaney (2022).
| MS MARCO | |||||||
| RBP | RBP+Error | ||||||
| Methods | .50 | .80 | .95 | .50 | .80 | .95 | |
| Baselines | BM25 | .09 | .06 | .02 | .91 | .94 | .98 |
| L2R-D SVMr | .12 [.000] | .07 [.000] | .03 [.000] | .88 [.000] | .93 [.000] | .97 [.000] | |
| Best trained | .13 [.001] | .07 [.000] | .03 [.000] | .88 [.000] | .93 [.000] | .97 [.000] | |
| CombSUM | .12 [.000] | .07 [.000] | .03 [.000] | .88 [.000] | .93 [.000] | .97 [.000] | |
| SQP | Random-SVMr | .09 [.022] | .06 [.005] | .02 [.003] | .91 [.023] | .94 [.006] | .98 [.006] |
| ERisk-SVMr | .12 [.001] | .07 [.000] | .03 [.000] | .88 [.000] | .93 [.000] | .97 [.000] | |
| ERisk-Cosine | .13△↑ [.010] | .07 [.000] | .03 [.000] | .92 [.006] | .95 [.006] | .98 [.000] | |
| Oracles | Best conf. | .12 | .07 | .03 | .88 | .93 | .97 |
| Oracle20Random | .22 | .11 | .04 | .78 | .89 | .96 | |
| Oracle20ERisk | .14 | .08 | .03 | .86 | .92 | .97 | |
| Oracle | .38 | .17 | .05 | .56 | .75 | .86 | |
| TREC78 | |||||||
| RBP | RBP+Error | ||||||
| Methods | .50 | .80 | .95 | .50 | .80 | .95 | |
| Baselines | BM25 | .49 | .45 | .32 | .01 | .01 | .01 |
| L2R-D SVMr | .51 [.006] | .46 [.000] | .34 [.001] | .00 [.000] | .00 [.000] | .01 [.006] | |
| Best trained | .56 [.001] | .49 [.006] | .35 [.004] | .00 [.000] | .01 [.006] | .02 [.006] | |
| CombSUM | .59 [.002] | .51 [.001] | .36 [.001] | .00 [.000] | .00 [.000] | .01 [.000] | |
| SQP | Random-SVMr | .46 [.033] | .39 [.002] | .27 [.019] | .03 [.021] | .03 [.020] | .10 [.058] |
| ERisk-SVMr | .56 [.018] | .49 [.040] | .35 [.018] | .01 [.012] | .01 [.006] | .02 [.010] | |
| ERisk-Cosine | .70△↑ [.012] | .58△↑ [.009] | .40△↑ [.003] | .01 [.010] | .01 [.006] | .02 [.006] | |
| Oracles | Best conf. | .57 | .49 | .35 | .00 | .01 | .02 |
| Oracle20Random | .76 | .60 | .39 | .00 | .00 | .01 | |
| Oracle20ERisk | .73 | .60 | .41 | .00 | .00 | .00 | |
| Oracle | .93 | .78 | .52 | .00 | .00 | .00 | |
To compare with deep judgments, we also provide the results using the RBP metric on the TREC78 collection (see lower-part of Table 10) which has deep relevance judgments. We report the results using baselines, SQP methods, and Oracles. From the right side and lower-part of Table 10, we can observe the residual error (RBP+Error) estimate. As expected the residual error for TREC78 is much smaller than for MS MARCO. We can also observe that is it robust over the different trials. This means that for the TREC78 collection, the judgments are already deep, and the results would not be changed drastically even if we collect more judged documents for the TREC78 collection. Since the residual error estimate is low across different methods, we can say that the learning-based methods do not filter out the unjudged documents but bring relevant documents into the retrieved list. We can also observe that has a lower residual than when the configurations are randomly chosen.
6 Conclusion
In this paper, we developed a risk-based approach for selective query processing in information retrieval. From a large number of different search configurations where both search and query expansion components and their hyperparameters vary, the model first learns from past queries which configurations are worth keeping. This selection is based on an objective function. We considered two different objective functions: focuses on the overall effectiveness; focuses on the number of queries for which the system should obtain good performance. Increasing the number of queries that are enhanced is of importance from a user point of view as it has been shown that it is easier to improve the results on easy queries to increase overall system effectiveness. It also opens a new track for system evaluation.
The objective functions are implemented under risk functions and consider both penalty and reward. After this selection is done, the system further learns which configuration is best for which queries. After training, the system can decide which configuration is the most appropriate to treat a new query. In addition to a machine learning based method that was used in our previous work (both classification and learning to rank was used), here we consider a Cosine measure between trained queries and the unseen query for which the model predicts the configuration to use.
This risk-based model has been evaluated on two tasks: ad hoc search and diversity-oriented search for which they have been proven to be effective when compared to learning to rank documents or when compared to an optimized unique configuration. The risk functions are also more effective than a random choice of configurations combined with the same selective query processing.
Selective query expansion Amati et al. (2004); Cronen-Townsend et al. (2004) was the first attempt toward selective query processing. With two configurations only, the possibilities for the system are too few to make the difference. In our approach we consider much more configurations and both term weighting approaches through the retrieval model component and query expansion through the QE component and its hyperparameters. This generalizes the previous attempts where either the queries were expanded He and Ounis (2007) or the term weighting were varying Arslan and Dinçer (2019). We show that the risk-sensitive functions we developed are both robust and effective. With our approach, on GOV2, for example, the Oracle could increase nDCG@10 by 31% and our method achieves +26% (Best configuration achieves 0.52, Oracle is 0.85 and our model is 0.62). The increase using our models is (resp. ) for nDCG@10 on TREC78 (resp. WT10G) compared to best trained. This shows that using a limited number of appropriate configurations (20 in most of the experiments) plus a selective query processing strategy on a per-query basis is effective.
In future work, we would like to conduct a qualitative data analysis to better understand which are the configurations that are selected by the and functions; how much these configurations overlap and how diverse they are. As another extension, we would like to measure the expected decrease in effectiveness when the configurations are learned on one collection and applied to another collection (transfer learning). As another extension, we would like to enhance the features used to represent training examples and test examples. Indeed, here we use a reference configuration (BM25) to calculate the (query-configuration) features. We believe that if we could rather use the genuine LETOR features associated with the query and each possible configuration, the representation would be more accurate and so will be the training. Since our risk-sensitive criteria enable us to limit the number of configurations; the extra cost would be limited.
References
- Robertson et al. [2009] Stephen Robertson, Hugo Zaragoza, et al. The probabilistic relevance framework: Bm25 and beyond. Foundations and Trends® in Information Retrieval, 3(4):333–389, 2009.
- Ponte and Croft [1998] Jay M. Ponte and W. Bruce Croft. A language modeling approach to information retrieval. In Proceedings of the 21st Annual International ACM SIGIR Conference on Research and Development in Information Retrieval, SIGIR ’98, pages 275–281, New York, NY, USA, 1998. ACM. ISBN 1-58113-015-5. doi:10.1145/290941.291008.
- Amati [2003] Giambattista Amati. Probability models for information retrieval based on divergence from randomness. PhD thesis, University of Glasgow, 2003.
- Li and Kanoulas [2018] Dan Li and Evangelos Kanoulas. Bayesian optimization for optimizing retrieval systems. In Proceedings of the Eleventh ACM International Conference on Web Search and Data Mining, WSDM ’18, pages 360–368, New York, NY, USA, 2018. ACM. ISBN 978-1-4503-5581-0. doi:10.1145/3159652.3159665.
- Taylor et al. [2006] Michael Taylor, Hugo Zaragoza, Nick Craswell, Stephen Robertson, and Chris Burges. Optimisation methods for ranking functions with multiple parameters. In Proc. of the 15th ACM Inter. Conference on Information and Knowledge Management, CIKM, pages 585–593, New York, NY, USA, 2006. ACM.
- Metzler and Croft [2007] Donald Metzler and W Bruce Croft. Linear feature-based models for information retrieval. Information Retrieval, 10(3):257–274, 2007.
- Luenberger et al. [1984] David G Luenberger, Yinyu Ye, et al. Linear and nonlinear programming, volume 2. Springer, 1984.
- Li et al. [2018] Chang Li, Ilya Markov, Maarten de Rijke, and Masrour Zoghi. Merge double thompson sampling for large scale online ranker evaluation. arXiv preprint arXiv:1812.04412, 2018.
- Macdonald et al. [2015] Craig Macdonald, B Taner Dinçer, and Iadh Ounis. Transferring learning to rank models for web search. In Proceedings of the 2015 international conference on the theory of information retrieval, pages 41–50, New York, NY, USA, 2015. ACM.
- Harman and Buckley [2009] Donna Harman and Chris Buckley. Overview of the reliable information access workshop. Information Retrieval, 12(6):615, 2009.
- Fox et al. [1993] Edward A Fox, M Prabhakar Koushik, Joseph Shaw, Russell Modlin, Durgesh Rao, et al. Combining evidence from multiple searches. In The first text retrieval conference (TREC-1), pages 319–328, USA, 1993. NIST.
- Cronen-Townsend et al. [2004] Steve Cronen-Townsend, Yun Zhou, and W. Bruce Croft. A framework for selective query expansion. In Proceedings of the Thirteenth ACM International Conference on Information and Knowledge Management, CIKM ’04, pages 236–237, New York, NY, USA, 2004. ACM. ISBN 1-58113-874-1. doi:10.1145/1031171.1031220.
- Cao et al. [2008] Guihong Cao, Jian-Yun Nie, Jianfeng Gao, and Stephen Robertson. Selecting good expansion terms for pseudo-relevance feedback. In Proceedings of the 31st Annual International ACM SIGIR Conference on Research and Development in Information Retrieval, SIGIR ’08, pages 243–250, New York, NY, USA, 2008. ACM. ISBN 978-1-60558-164-4. doi:10.1145/1390334.1390377. URL http://doi.acm.org/10.1145/1390334.1390377.
- Xu et al. [2016] Bo Xu, Hongfei Lin, and Yuan Lin. Assessment of learning to rank methods for query expansion. Journal of the Association for Information Science & Technology, 67(6):1345–1357, 2016. URL https://EconPapers.repec.org/RePEc:bla:jinfst:v:67:y:2016:i:6:p:1345-1357.
- Bigot et al. [2015] Anthony Bigot, Sébastien Déjean, and Josiane Mothe. Learning to choose the best system configuration in information retrieval: the case of repeated queries. J. UCS, 21(13):1726–1745, 2015. URL http://www.jucs.org/jucs_21_13/learning_to_choose_the.
- Mothe and Washha [2017] Josiane Mothe and Mahdi Washha. Predicting the best system parameter configuration: the (per parameter learning) ppl method. Procedia Computer Science, 112:1308 – 1317, 2017. ISSN 1877-0509. Knowledge-Based and Intelligent Information and Engineering Systems: Proceedings of the 21st International Conference, KES-20176-8 September 2017, Marseille, France.
- Deveaud et al. [2018] Romain Deveaud, Josiane Mothe, Md Zia Ullah, and Jian-Yun Nie. Learning to adaptively rank document retrieval system configurations. ACM Transactions on Information Systems (TOIS), 37(1):3, 2018. doi:10.1145/3231937.
- Arslan and Dinçer [2019] Ahmet Arslan and Bekir Taner Dinçer. A selective approach to index term weighting for robust information retrieval based on the frequency distributions of query terms. Information Retrieval Journal, 22(6):543–569, 2019.
- Mothe and Md Zia [2021] Josiane Mothe and Ullah Md Zia. Defining an optimal configuration set for selective search strategy – a risk-sensitive approach. In Proceedings of the 30th ACM International on Conference on Information and Knowledge Management, CIKM ’21, pages 1335–1345, New York, NY, USA, 2021. ACM. doi:10.1145/3459637.3482422.
- Ferro and Silvello [2016] Nicola Ferro and Gianmaria Silvello. A general linear mixed models approach to study system component effects. In Proceedings of the 39th International ACM SIGIR Conference on Research and Development in Information Retrieval, SIGIR ’16, pages 25–34, New York, NY, USA, 2016. ACM. ISBN 978-1-4503-4069-4. doi:10.1145/2911451.2911530.
- Compaoré et al. [2011] Jonathan Compaoré, Sébastien Déjean, Adji Maŕram Gueye, Josiane Mothe, and Joelson Randriamparany. Mining information retrieval results: Significant ir parameters. Advances in Information Mining and Management, 74, 2011.
- Wang et al. [2012] Lidan Wang, Paul N. Bennett, and Kevyn Collins-Thompson. Robust ranking models via risk-sensitive optimization. In Proceedings of the 35th International ACM SIGIR Conference on Research and Development in Information Retrieval, SIGIR ’12, pages 761–770, New York, NY, USA, 2012. ACM. ISBN 978-1-4503-1472-5. doi:10.1145/2348283.2348385.
- Dinçer et al. [2016] B. Taner Dinçer, Craig Macdonald, and Iadh Ounis. Risk-sensitive evaluation and learning to rank using multiple baselines. In Proceedings of the 39th International ACM SIGIR Conference on Research and Development in Information Retrieval, SIGIR ’16, pages 483–492, New York, NY, USA, 2016. ACM. ISBN 978-1-4503-4069-4. doi:10.1145/2911451.2911511.
- Benham and Culpepper [2017] Rodger Benham and J. Shane Culpepper. Risk-reward trade-offs in rank fusion. In Proceedings of the 22Nd Australasian Document Computing Symposium, ADCS 2017, pages 1:1–1:8, New York, NY, USA, 2017. ACM. ISBN 978-1-4503-6391-4. doi:10.1145/3166072.3166084.
- Collins-Thompson et al. [2014] Kevyn Collins-Thompson, Paul Bennett, Charles L. A. Clarke, Fernando Diaz, and Ellen M Voorhees. Trec 2013 web track overview. Technical report, MICHIGAN UNIV ANN ARBOR, 2014.
- Sousa et al. [2016] Daniel Xavier De Sousa, Sérgio Daniel Canuto, Thierson Couto Rosa, Wellington Santos Martins, and Marcos André Gonçalves. Incorporating risk-sensitiveness into feature selection for learning to rank. In Proceedings of the 25th ACM International on Conference on Information and Knowledge Management, CIKM ’16, pages 257–266, New York, NY, USA, 2016. ACM. ISBN 978-1-4503-4073-1. doi:10.1145/2983323.2983792.
- Baeza-Yates et al. [2009] Ricardo Baeza-Yates, Vanessa Murdock, and Claudia Hauff. Efficiency trade-offs in two-tier web search systems. In Proceedings of the 32nd international ACM SIGIR conference on Research and development in information retrieval, pages 163–170, New York, NY, USA, 2009. ACM.
- Aly et al. [2013] Robin Aly, Djoerd Hiemstra, and Thomas Demeester. Taily: Shard selection using the tail of score distributions. In Proceedings of the 36th international ACM SIGIR conference on Research and development in information retrieval, pages 673–682, New York, NY, USA, 2013. ACM.
- He and Ounis [2004] Ben He and Iadh Ounis. A query-based pre-retrieval model selection approach to information retrieval. In RIAO, pages 706–719, Paris, France, 2004. CID.
- Fox and Shaw [1994] Edward A Fox and Joseph A Shaw. Combination of multiple searches. NIST special publication SP, 243:127–137, 1994.
- Nuray and Can [2006] Rabia Nuray and Fazli Can. Automatic ranking of information retrieval systems using data fusion. Information processing & management, 42(3):595–614, 2006.
- Hsu and Taksa [2005] D Frank Hsu and Isak Taksa. Comparing rank and score combination methods for data fusion in information retrieval. Information retrieval, 8(3):449–480, 2005.
- Kurland and Culpepper [2018] Oren Kurland and J Shane Culpepper. Fusion in information retrieval: Sigir 2018 half-day tutorial. In The 41st International ACM SIGIR Conference on Research & Development in Information Retrieval, pages 1383–1386, New York, NY, USA, 2018. ACM.
- McCabe et al. [2001] M Catherine McCabe, Abdur Chowdhury, D Grossman, and Ophir Frieder. System fusion for improving performance in information retrieval systems. In Proceedings International Conference on Information Technology: Coding and Computing, pages 639–643. IEEE, 2001.
- Bailey et al. [2016] Peter Bailey, Alistair Moffat, Falk Scholer, and Paul Thomas. Uqv100: A test collection with query variability. In Proceedings of the 39th International ACM SIGIR Conference on Research and Development in Information Retrieval, SIGIR ’16, pages 725–728, New York, NY, USA, 2016. ACM. ISBN 9781450340694. doi:10.1145/2911451.2914671. URL https://doi.org/10.1145/2911451.2914671.
- Mohammad et al. [2018] Hafeezul Rahman Mohammad, Keyang Xu, Jamie Callan, and J Shane Culpepper. Dynamic shard cutoff prediction for selective search. In The 41st International ACM SIGIR Conference on Research & Development in Information Retrieval, pages 85–94, New York, NY, USA, 2018. ACM.
- Amati et al. [2004] Giambattista Amati, Claudio Carpineto, and Giovanni Romano. Query difficulty, robustness, and selective application of query expansion. In Sharon McDonald and John Tait, editors, Advances in Information Retrieval, pages 127–137, Berlin, Heidelberg, 2004. Springer Berlin Heidelberg.
- He and Ounis [2007] Ben He and Iadh Ounis. Combining fields for query expansion and adaptive query expansion. Information processing & management, 43(5):1294–1307, 2007.
- Zhao and Callan [2012] Le Zhao and Jamie Callan. Automatic term mismatch diagnosis for selective query expansion. In Proceedings of the 35th International ACM SIGIR Conference on Research and Development in Information Retrieval, SIGIR ’12, pages 515–524, New York, NY, USA, 2012. ACM. ISBN 978-1-4503-1472-5. doi:10.1145/2348283.2348354.
- Xu et al. [2009] Yang Xu, Gareth J.F. Jones, and Bin Wang. Query dependent pseudo-relevance feedback based on wikipedia. In Proceedings of the 32nd International ACM SIGIR Conference on Research and Development in Information Retrieval, SIGIR ’09, page 59–66, New York, NY, USA, 2009. ACM. ISBN 9781605584836.
- Collins-Thompson [2009] Kevyn Collins-Thompson. Reducing the risk of query expansion via robust constrained optimization. In Proceedings of the 18th ACM conference on Information and knowledge management, pages 837–846, New York, NY, USA, 2009. ACM.
- Trotman [2005] Andrew Trotman. Learning to rank. Information Retrieval, 8(3):359–381, 2005.
- Li [2011] Hang Li. A short introduction to learning to rank. IEICE TRANSACTIONS on Information and Systems, 94(10):1854–1862, 2011.
- Deveaud et al. [2016] Romain Deveaud, Josiane Mothe, and Jian-Yun Nia. Learning to rank system configurations. In Proceedings of the 25th ACM International on Conference on Information and Knowledge Management, CIKM ’16, pages 2001–2004, New York, NY, USA, 2016. ACM. ISBN 978-1-4503-4073-1. doi:10.1145/2983323.2983894.
- Dinçer et al. [2014] B. Taner Dinçer, Craig Macdonald, and Iadh Ounis. Hypothesis testing for the risk-sensitive evaluation of retrieval systems. In Proceedings of the 37th International ACM SIGIR Conference on Research & Development in Information Retrieval, SIGIR ’14, pages 23–32, New York, NY, USA, 2014. ACM. ISBN 978-1-4503-2257-7. doi:10.1145/2600428.2609625.
- Benham et al. [2019a] Rodger Benham, Alistair Moffat, and J Shane Culpepper. On the pluses and minuses of risk. In Asia Information Retrieval Symposium, pages 81–93. Springer, 2019a.
- Sousa et al. [2019] Daniel Xavier Sousa, Sergio Canuto, Marcos Andre Goncalves, Thierson Couto Rosa, and Wellington Santos Martins. Risk-sensitive learning to rank with evolutionary multi-objective feature selection. ACM Transactions on Information Systems (TOIS), 37(2):1–34, 2019.
- Wang and Zhu [2009] Jun Wang and Jianhan Zhu. Portfolio theory of information retrieval. In Proceedings of the 32nd international ACM SIGIR conference on Research and development in information retrieval, pages 115–122, New York, NY, USA, 2009. ACM.
- Benham et al. [2019b] Rodger Benham, Ben Carterette, Alistair Moffat, and J Shane Culpepper. Taking risks with confidence. In Proceedings of the 24th Australasian Document Computing Symposium, pages 1–4, New York, NY, USA, 2019b. ACM.
- Lv and Zhai [2011] Yuanhua Lv and ChengXiang Zhai. When documents are very long, bm25 fails! In Proceedings of the 34th international ACM SIGIR conference on Research and development in Information Retrieval, pages 1103–1104, New York, NY, USA, 2011. ACM.
- Trotman et al. [2014] Andrew Trotman, Antti Puurula, and Blake Burgess. Improvements to bm25 and language models examined. In Proceedings of the 2014 Australasian Document Computing Symposium, ADCS ’14, page 58–65, New York, NY, USA, 2014. Association for Computing Machinery. ISBN 9781450330008. doi:10.1145/2682862.2682863. URL https://doi.org/10.1145/2682862.2682863.
- Bergstra and Bengio [2012] James Bergstra and Yoshua Bengio. Random search for hyper-parameter optimization. Journal of Machine Learning Research, 13(Feb):281–305, 2012.
- Macdonald et al. [2013] Craig Macdonald, Rodrygo LT Santos, Iadh Ounis, and Ben He. About learning models with multiple query-dependent features. ACM Transactions on Information Systems (TOIS), 31(3):11, 2013.
- Cao et al. [2007] Zhe Cao, Tao Qin, Tie-Yan Liu, Ming-Feng Tsai, and Hang Li. Learning to rank: From pairwise approach to listwise approach. In Proceedings of the 24th International Conference on Machine Learning, ICML ’07, pages 129–136, New York, NY, USA, 2007. ACM. ISBN 978-1-59593-793-3. doi:10.1145/1273496.1273513.
- Lin et al. [2017] Yuan Lin, Jiajin Wu, Bo Xu, Kan Xu, and Hongfei Lin. Learning to rank using multiple loss functions. International Journal of Machine Learning and Cybernetics, pages 1–10, 2017.
- Mothe and Tanguy [2005] Josiane Mothe and Ludovic Tanguy. Linguistic features to predict query difficulty. In ACM Conference on research and Development in Information Retrieval, Workshop, pages 7–10, New York, NY, USA, 2005. ACM.
- Guo et al. [2010] Qi Guo, Ryen W White, Susan T Dumais, Jue Wang, and Blake Anderson. Predicting query performance using query, result, and user interaction features. In Adaptivity, Personalization and Fusion of Heterogeneous Information, pages 198–201. CID, Paris, France, 2010.
- Shtok et al. [2012] Anna Shtok, Oren Kurland, David Carmel, Fiana Raiber, and Gad Markovits. Predicting query performance by query-drift estimation. ACM Transactions on Information Systems (TOIS), 30(2):11, 2012.
- Chifu et al. [2018] Adrian-Gabriel Chifu, Léa Laporte, Josiane Mothe, and Md Zia Ullah. Query performance prediction focused on summarized letor features. In The 41st International ACM SIGIR Conference on Research & Development in Information Retrieval, SIGIR ’18, pages 1177–1180, New York, NY, USA, 2018. ACM. ISBN 978-1-4503-5657-2. doi:10.1145/3209978.3210121.
- Qin et al. [2010] Tao Qin, Tie-Yan Liu, Jun Xu, and Hang Li. Letor: A benchmark collection for research on learning to rank for information retrieval. Information Retrieval, 13(4):346–374, 2010.
- Balasubramanian et al. [2010] Niranjan Balasubramanian, Giridhar Kumaran, and Vitor R. Carvalho. Predicting query performance on the web. In Proceedings of the 33rd International ACM SIGIR Conference on Research and Development in Information Retrieval, SIGIR ’10, pages 785–786, New York, NY, USA, 2010. ACM. ISBN 978-1-4503-0153-4. doi:10.1145/1835449.1835615.
- Turtle and Flood [1995] Howard Turtle and James Flood. Query evaluation: strategies and optimizations. Information Processing & Management, 31(6):831–850, 1995.
- Carterette and Voorhees [2011] Ben Carterette and Ellen M Voorhees. Overview of information retrieval evaluation. In Current challenges in patent information retrieval, pages 69–85. Springer, 2011.
- Sakai [2007] Tetsuya Sakai. On the reliability of information retrieval metrics based on graded relevance. Information processing & management, 43(2):531–548, 2007.
- Järvelin and Kekäläinen [2017] Kalervo Järvelin and Jaana Kekäläinen. Ir evaluation methods for retrieving highly relevant documents. In ACM SIGIR Forum, volume 51, pages 243–250, New York, NY, USA, 2017. ACM.
- Moffat and Zobel [2008] Alistair Moffat and Justin Zobel. Rank-biased precision for measurement of retrieval effectiveness. ACM Trans. Inf. Syst., 27(1), dec 2008. ISSN 1046-8188. doi:10.1145/1416950.1416952. URL https://doi.org/10.1145/1416950.1416952.
- Chapelle et al. [2009] Olivier Chapelle, Donald Metlzer, Ya Zhang, and Pierre Grinspan. Expected reciprocal rank for graded relevance. In Proceedings of the 18th ACM conference on Information and knowledge management, pages 621–630, New York, NY, USA, 2009. ACM.
- Clarke et al. [2008] Charles LA Clarke, Maheedhar Kolla, Gordon V Cormack, Olga Vechtomova, Azin Ashkan, Stefan Büttcher, and Ian MacKinnon. Novelty and diversity in information retrieval evaluation. In Proceedings of the 31st annual international ACM SIGIR conference on Research and development in information retrieval, pages 659–666, New York, NY, USA, 2008. ACM.
- Wong and Yang [2017] Tzu-Tsung Wong and Nai-Yu Yang. Dependency analysis of accuracy estimates in k-fold cross validation. IEEE Transactions on Knowledge and Data Engineering, 29(11):2417–2427, 2017.
- Wu et al. [2010] Qiang Wu, Christopher J. Burges, Krysta M. Svore, and Jianfeng Gao. Adapting boosting for information retrieval measures. Information Retrieval, 13(3):254–270, 2010. ISSN 1386-4564.
- Mizzaro and Robertson [2007] Stefano Mizzaro and Stephen Robertson. Hits hits trec: exploring ir evaluation results with network analysis. In Proceedings of the 30th annual international ACM SIGIR conference on Research and development in information retrieval, pages 479–486, New York, NY, USA, 2007. ACM.
- Gupta and MacAvaney [2022] Prashansa Gupta and Sean MacAvaney. On survivorship bias in ms marco. In Proceedings of the 45th international ACM SIGIR conference on Research and development in information retrieval, page 2214–2219, New York, NY, USA, 2022. ACM.