Evolution of QPOs in GX 3394 and EXO 1846031 with Insight-HXMT and NICER
Abstract
We conduct a spectral and timing analysis of GX 3394 and EXO 1846031 with the aim of studying the evolution of Type-C QPOs with spectral parameters. The high cadence data from Insight-HXMT and NICER allow us to track them. Type-C QPOs appear at the end of low-hard state and/or hard-intermediate state. The results reveal that the QPO frequency is closely related to the inner disk radius and mass accretion rate in the two sources. Such a correlation is nicely consistent with the dynamic frequency model.
Subject headings:
High energy astrophysics; X-ray astronomy; Low mass X-ray Binary; Stellar mass black holes1. Introduction
Quasi-periodic oscillations (QPOs) refers to narrow peaks structure in the power density spectrum (PDS) that are commonly observed in X-ray binaries (XRBs) (van der Klis, 2005). In black hole systems, QPOs are mainly split into low-frequency QPOs (LFQPOs, centroid frequency Hz), and high frequency QPOs (HFQPOs, centroid frequency Hz) (Belloni, 2010). Samimi et al. (1979) reported the ‘sporadic quasi-periodic behaviour’ in the light curve of GX 3394, and Motch et al. (1983) reported the first rigorous detection of QPOs for the same source. It was immediately recognized that the QPOs would have been a powerful tool to study the accretion process around black holes.
Over the last forty years, especially after the launch of RXTE, we have accumulated a lot of knowledge about QPOs. Using a truncated power-law to fit the broadband noise in PDS, and a Lorentz function with the center frequency of to fit the low-frequency QPOs, Wijnands et al. (1999) found that there is an obvious positive correlation between the truncation frequency and the frequency of the low-frequency QPOs . Psaltis et al. (1999) reported that there is also a good positive correlation between the frequency of low-frequency QPOs and the frequency of the broadband noise (or high-frequency QPOs) in low mass XRBs, including black holes and neutron stars.
We have observed QPOs in most black hole XRBs, and realized that low frequency QPOs can be divided into three types: Type-A, -B, and -C QPOs, based on quality factor, noise type, fractional rms, and phase delay (e.g., Wijnands et al. 1999; Sobczak et al. 2000; Casella et al. 2005; Motta et al. 2011). Different types QPOs occupy different regions on the hardness-intensity diagram, as well as obviously distribute in different areas on the center frequency and rms plots (e.g., Motta et al. 2011). The phenomenon of rapid transition between different types of QPOs has been found in some sources, and the time scale of this phenomenon can be very short (10 s) (e.g. Homan et al. 2020). In this work, we only focus on the Type-C QPOs.
Type-C QPOs appear in the early stage of the outburst, particularly in the hard-intermediate state and the end of low-hard state. The centroid frequency varies from a few mHz to Hz, and is tightly correlated with the spectral state. Vignarca et al. (2003) reported a positive correlation between the centroid frequency and the photon index . Motta et al. (2011) found Type-C QPOs trace out a well-defined track, and the centroid frequency obviously correlate with the corona flux and disk flux. The dependence of the QPO frequency and photon energy was illustrated by Qu et al. (2010).
In addition to the phenomenological study of QPOs, many studies has been done on the theoretical explanation behind it. Most theoretical models explain QPO phenomenon through the following two different mechanisms: instabilities of the corona-disk system (e.g., Titarchuk & Fiorito 2004; Mastichiadis et al. 2022; Varnière et al. 2012) or the geometrical effects of general relativity (e.g., Stella & Vietri 1998; Ingram et al. 2009). Titarchuk & Fiorito (2004) introduced a transition layer in corona-disk system that can explain the QPO phenomenon in XRBs. The disk-corona natural frequency model was proposed by Mastichiadis et al. (2022), and they argued that type-C QPOs arise from the interaction of the hot corona with the cold accretion disk. Varnière et al. (2012) suggested that LFQPOs could result from the relativistic accretion-ejection instability (AEI). The geometrical effects model mainly refers to the precession of the corona region. This model interprets the QPOs as a Lense–Thirring precession of the innermost region of the accretion disk (e.g., Stella & Vietri 1998; Ingram et al. 2009). In recent years, more and more observations have been analyzed to test these models. However, a unified model that can explain all QPO behaviors has not been found yet.
Recently, Misra et al. (2020) identified the QPO frequency of GRS 1915+105 as the relativistic dynamic frequency of a truncated accretion disk with AstroSat observations of that source. The authors found a strong correlation between the QPO frequency divided by the accretion rate and the inner disk radius. The correlation is actually consistent with the prediction of dynamic frequency under the assumption of a standard relativistic accretion model (Novikov & Thorne, 1973). Liu et al. (2021a) extended the relation to cover a wider range of variations, and confirmed the high spin nature of the black hole in GRS 1915+105 with the data of Insight-HXMT (dubbed HXMT; Zhang et al. 2014). We note that GRS 1915+105 is a persistent source with particular properties (Belloni et al., 2000). We would like to test if this relation holds for other sources different from GRS 1915+105, and we notice that there are two appropriate sources, GX 3394 and EXO 1846031, in the archive.
The XRB transient GX 3394 is a typical low mass X-ray binary (LMXB) discovered in 1973 (Markert et al., 1973). It goes into bright outburst every a few years and all four X-ray states typically seen in XRBs have been detected in this system (e.g., Miyamoto et al. 1995; Homan & Belloni 2005; Plant et al. 2014). GX 3394 is located at kpc with a black hole mass of M⨀ (Zdziarski et al., 2019). Strong relativistic reflection signatures have been found in this source in the hard and soft states (e.g., García et al. 2015; Miller et al. 2004; Liu et al. 2022). Previous studies have found that the black hole in GX 3394 has a very high spin (, García et al. 2015; Parker et al. 2016). The inclination angle of the accretion disk should have an intermediate value (Fürst et al. 2015; Parker et al. 2016). Motta et al. (2011) systematically studied the properties and the behaviour of QPOs, as a function of the integrated broad-band variability and the spectral parameters. The authors suggested that the frequencies of all QPOs (including Type-C QPOs) correlate with the disk flux.
EXO 1846031 was discovered by the European X-ray Observatory Satellite (EXOSAT) when it went into outburst in April 1985 and is considered a LMXB (Parmar et al. 1993; Draghis et al. 2020). CGRO/BATSE detected a second outburst in 1994 (Zhang et al., 1994). Since then, the source was in a quiescent state for 25 years. EXO 1846031 had a new outburst in 2019, which was monitored by X-ray missions (e.g., MAXI/GSC; HXMT; NuSTAR) and radio missions (e.g., MeerKAT; AMI-LA). NuSTAR conducted a high-quality observation on August 3, 2019 with a 22.2 ks exposure time. Draghis et al. (2020) reported strong relativistic reflection features with the extremely sensitive NuSTAR spectra, and argued that the source is a black hole with a nearly maximal spin parameter () at disk inclination of . EXO 1846031 is located at kpc according to the previous studies on X-ray and radio data (Parmar et al. 1993; Williams et al. 2022), with a black hole mass of M⨀ (Draghis et al. 2020; Williams et al. 2022). Liu et al. (2021b) reported the observational results from a detailed timing analysis of EXO 1846031 2019 outburst with the observations of HXMT and NICER.
In this work, we focus on the latest HXMT and NICER observations of GX 3394 and EXO 1846031, and present a detailed temporal and spectral analysis. The paper is organized as follows. Sec. 2 presents the observational data reduction. The spectral timing analysis is reported in Sec. 3. We discuss the results and report our conclusions in Sec. 4 and Sec. 5, respectively.
2. Observations and data reduction
2.1. Data selection
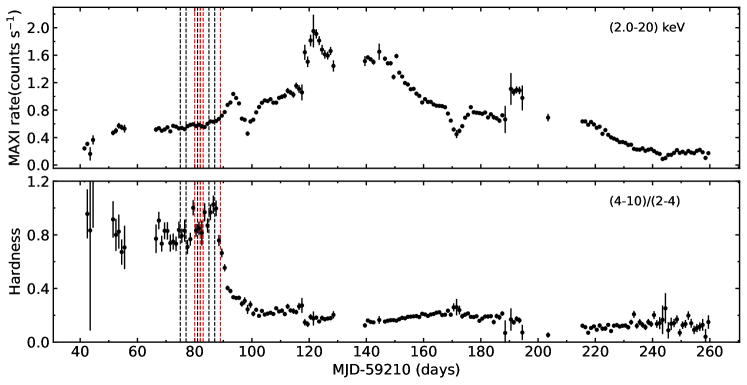
Starting from February 2021, GX 3394 went into a new outburst that lasted for a few months. Fig. 1 shows the long-term light curve in the keV band and the corresponding hardness ratio observed with MAXI GSC. The hardness is defined as the ratio between the count rates at keV and keV. HXMT and NICER extensively observed the 2021 outburst of the source. We went through all available HXMT and NICER data and picked out those observations that show Type–C QPO signatures. The selected observations analyzed in this work are marked in the light curve of GX 3394 in Fig. 1. Information about these observations is listed in Tab. A1.
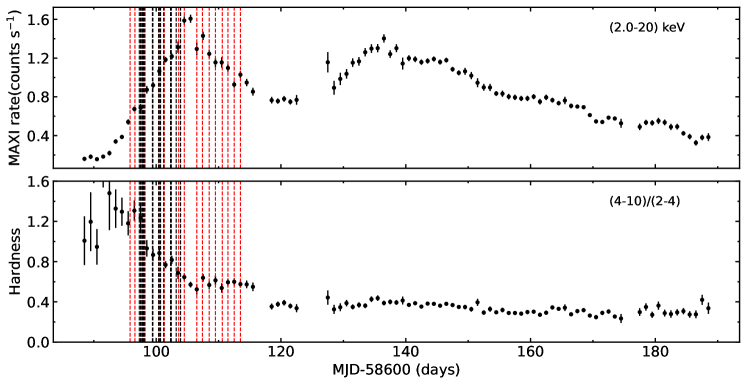
The 2019 outburst of EXO 1846031 was first detected by MAXI/GSC on 2019 July 23 (Negoro et al., 2019), and it lasted about 3 months. The MAXI X-ray Hardness–Intensity diagram (HID) of the outburst shows a characteristic q-shaped hysteresis of X-ray binaries in outburst (Williams et al. 2022; Liu et al. 2021a). The long-term MAXI light curve and the corresponding hardness ratio are shown in Fig. 2. HXMT and NICER conducted high–cadence pointing observations of EXO 1846031. Type–C QPOs appear during the transition from hard to soft state (Liu et al., 2021a). We selected observations showing Type–C QPO signatures. The selected observations are marked in the light curve in Fig. 2 and listed in Tab. A2.
2.2. Data reduction
HXMT covers the broadband energy range of 1–250 keV with low-energy, medium-energy, and high-energy detectors (Zhang et al. 2020; Chen et al. 2020; Cao et al. 2020; Liu et al. 2020). The light curves and spectra are extracted with the HXMT data analysis software (HXMTDAS) version 2.05 and CALDB version 2.06, following the official user guide. The background is estimated by the standalone scripts hebkgmap, mebkgmap, and lebkgmap (Guo et al. 2020; Liao et al. 2020a; Liao et al. 2020b). The data are screened following the recommended criteria, i.e., an elevation angle , a geomagnetic cutoff rigidity GeV, a pointing offset angle , and at least 300 s away from the South Atlantic Anomaly.
The NICER data are processed with the NICER data analysis software (NICERDAS) version 2021-04-01_V008 and CALDB version 20210707. We use the standard filtering criteria: the pointing offset is less than , and the pointing direction is more than away from the bright Earth limb, more than away from the dark Earth limb, and outside the South Atlantic Anomaly. In addition, we remove the data of detectors # 14 and # 34 which are affected by episodes of increased electronic noise, and we select events that are not flagged as “overshoot” or “undershoot” resets (EVENT_FLAGS = bxxxx00) or forced triggers (EVENT_FLAGS=bx1x000). The standard NICER reduction routine nicerl2 is used to process the data. The cleaned events are barycenter-corrected using the FTOOL barycorr. We extract the energy spectra of the background in each observation using the nibackgen3C50 tool (Remillard et al., 2022). The Redistribution Matrix File (RMF) and Ancillary Response File (ARF) are created by using the tasks nicerrmf and nicerarf, respectively.
3. Data analysis
3.1. Timing analysis
We extract HXMT LE and NICER XTI light curves with a time resolution of 1 ms from the full energy band (1-10 keV in HXMT; 0.5-10 keV in NICER) for each HXMT observation and NICER observation. In order to calculate hardness ratios, we also produce LE light curves from the 1-5 keV and 5–10 keV bands, and produce XTI light curves from the 0.5-4 keV and 4-10 keV bands.
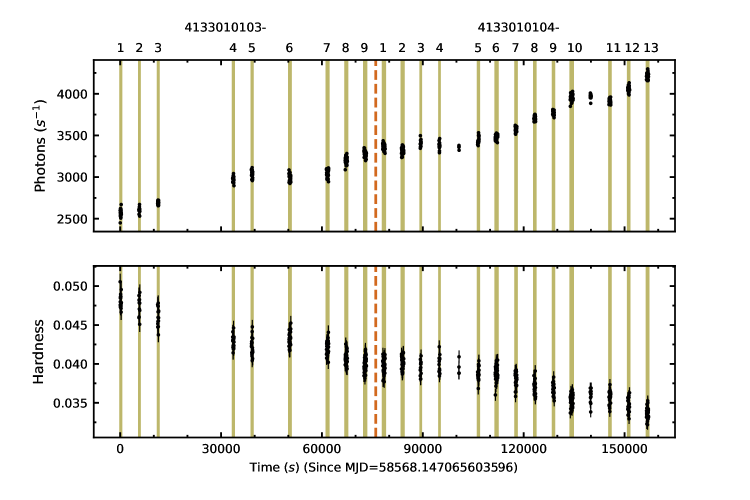
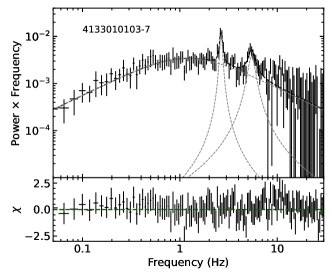
We carefully check the extracted light curves from all observations of GX 3394 and find there are two NICER observations (ObsID: 4133010103, 4133010104) that show a relatively strong variability of count rate and hardness. Fig. 3 shows the light curves of these two NICER observations. The gaps in the light curves are due to the low Earth orbit of the telescope or the SAA. We can clearly see that the source went through a period of luminosity increase and hardness decrease. Comparing with the location of these two observations in Fig. 1 (the last red dotted line; in fact, since the two lines are quite close, they look like one line), we conclude that the two observations are during the hard-to-soft transition so the hardness keeps getting lower. Then we divide the observations according to the light curve, counting each snapshot as a sub-observation. We check over all sub-observation data and pick out those with exposure s. The selected sub-observations are numbered 4133010103-1 through 4133010103-9, and 4133010104-1 through 4133010104-13, as shown in Fig. 3. The other light curves do not show strong variability in the count rate i.e., no distinctive evidence of flares, dips, or state transitions, making it safe for timing and spectral analysis to characterize the source properties.
For EXO 1846031, the count rate of the source remain fairly stable during each HXMT and NICER interval, and the hardness does not change dramatically. Therefore, we conclude that we can carry out timing and spectral analysis in the unit of one observation.
To measure the QPO frequency of GX 3394 and EXO 1846031, we employ the Python package Stingray (Huppenkothen et al., 2019) to create PDS for each observation. The light curve is splited into 64 s segments, and then the final PDS is generated by averaging all 64 s segments. The PDS is normalized according to the ”rms” method (Belloni & Hasinger, 1990), and logarithmically rebinned so that each bin size is 1.02 times larger than the previous bin. Note that we focus on the HXMT LE 1-10 keV light curve and the NICER XTI 0.5-10 keV light curve to extract PDS and search for QPO signal. The 8–30 keV HXMT ME light curves have been analyzed in the same way and return consistent measurements of the QPO frequencies. So we report only the results from LE data in this work.
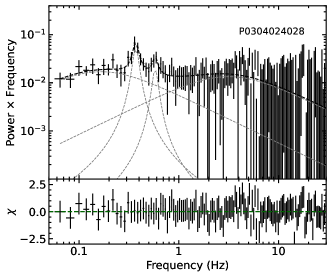
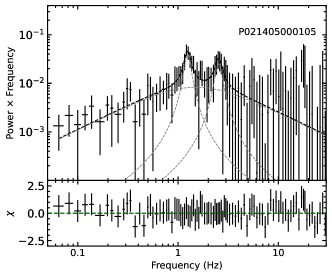
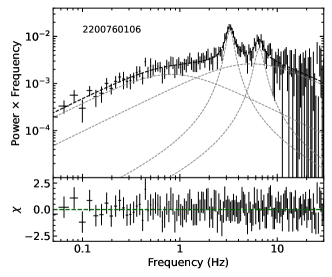
We use XSPEC v12.12.1 (Arnaud, 1996) to analyze the PDS. The typical PDS of XRBs manifests broad components and one or two narrow peaks at different frequencies, corresponding to broad band noise, the possible QPO fundamental and (sub) harmonics, respectively. We need at least one narrow Lorentzian for the QPO to fit the Poisson-extracted PDS (Belloni et al., 2002). More narrow Lorentzians are sometimes included to model harmonic peaks. All QPOs we detect have a quality factor (Q) greater than 4 and detection significance greater than . Fig. A1 and Fig. A2 show a typical PDS and the fit results with several Lorentzian models for GX 3394. Fig. A3 and Fig. A4 show the counterpart for EXO 1846031. The QPO frequencies for each observation are listed in Tab. A3 for GX 3394, and Tab. A4 for EXO 1846031.
3.2. Spectral analysis
For spectral analysis of the HXMT data, we consider the LE data in the 2–10 keV band and ME data in the 8–20 keV band. ME data above 20 keV and HE data are ignored because of the very high background. Note that we ignore the data below 2 keV of the LE instrument in spectral analysis (instead of the 1 keV for timing analysis) because of calibration uncertainties in the low energy band. For NICER data, we consider the 1-10 keV band in this section, ignoring the data below 1 keV because of calibration issues.
The HXMT and NICER spectra are fitted with the XSPEC (v12.12.1) package, using the recommended photoelectric cross sections of Verner et al. (1996) and element abundances of Wilms et al. (2000). The statistics is employed and all parameter uncertainties are estimated at 90% confidence level, corresponding to . All spectra are grouped to ensure a minimum counts of 20 per bin. A systematic error of 1% is added in the NICER spectra.
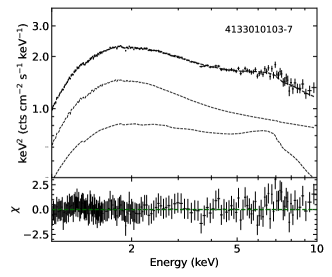
The HXMT and NICER spectra of GX 3394 are fitted with the model combination Tbabs (simpl kerrd + relxill). Tbabs is included to account for absorption by the interstellar medium. We set its column density () to be a free parameter for NICER spectra. While with HXMT spectra, we can not constrain its column density (), so we fix it at best-fit value, cm-2, which is consistent with the result of the NICER data and the value in literature (e.g., Wang et al. 2020; Liu et al. 2022). kerrd accounts for the thermal emission from the geometrically thin and optically thick accretion disk (Ebisawa et al., 2003), in which the black hole distance, mass, and inclination angle of the accretion disk are set to 8.4 kpc, 9.0 M⨀, and 30∘ (Parker et al., 2016), respectively. The spectral hardening factor of kerrd is set to 1.7 (Shimura & Takahara, 1995). simpl (Steiner et al., 2009) is used to take into account for the Comptonization of disk photons by the corona. The source has been found to have strong reflection features (Liu et al., 2022), and we use the full reflection model relxill (García et al., 2014) to fit them. The spin parameter () is fixed at 0.95 (Parker et al., 2016), and the index of the emissivity profile is fixed at 3 because it cannot be constrained by the fit. The best-fit values and uncertainties of GX 3394 are shown in Tab. A3. Fig. A1 and Fig. A2 show typical spectra and fit results of HXMT data and NICER data, respectively.
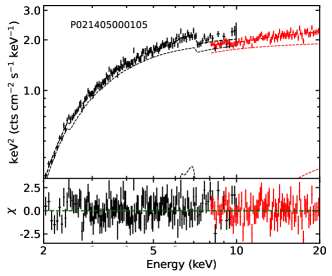
In the case of EXO 1846031, the best-fit model combination is Tbabs (simpl kerrd + relxill) for HXMT spectra. The black hole distance, mass, and inclination angle of the accretion disk are set to 4.5 kpc (Williams et al., 2022), 10.0 M⨀ (Williams et al. 2022, Draghis et al. 2020) and 73∘ (Draghis et al., 2020), respectively. The spin parameter () in relxill is fixed at 0.998 (Draghis et al., 2020). We use a simple power-law to model the emissivity profile ( free). The other parameters are set exactly as in the case of GX 3394. For NICER spectra, we notice that there are still some large residuals in the soft X-ray band with the same model, including a Gaussian-like emission near 1.1 keV and edge-like shapes near 1.8 keV. These energies correspond to features in the effective area of NICER versus energy (e.g., Wang et al. 2020), where 1.1 and 1.8 keV are attributed to sodium and silicon, respectively. Therefore, we adopt the following model for the NICER spectra: Tbabs (simpl kerrd + relxill + gaussian) edge. This calibration issue arises in EXO 1846031 because the source has a high interstellar absorption, which makes the photon count rate in the lower energy band relatively low, making the calibration issue prominent. Typical spectra and fit results of HXMT and NICER are shown in Fig. A3 and Fig. A4. In Tab. A4, we summarize the best-fit values and errors of EXO 1846031.
4. Results and discussion
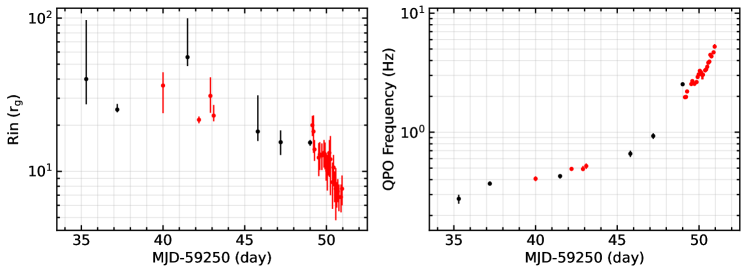
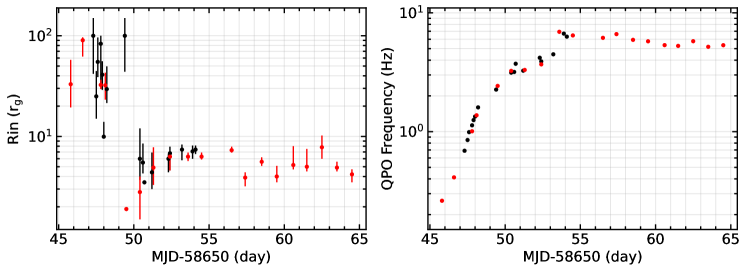
Fig. 4 and Fig. 5 show the evolution of inner radius () and QPO frequency () with time for GX 3394 and EXO 1846031, respectively. Generally speaking, we clearly see that the value of monotonically increases with time. The behaviour is consistent with that reported in Motta et al. (2011) and Liu et al. (2021b). It has also been observed in other XRBs, for example, XTE J1859+226 (Casella et al., 2004). In addition, a notable feature for both sources is the decrease of . For GX 3394, the inner disk moves toward the ISCO (Innermost Stable Circular Orbit), from to (, gravitional radius), which coincide with the result in the previous study (e.g. Wang-Ji et al. 2018; Wang et al. 2020). Although there is some variable feature, EXO 1846031 shows a similar trend.
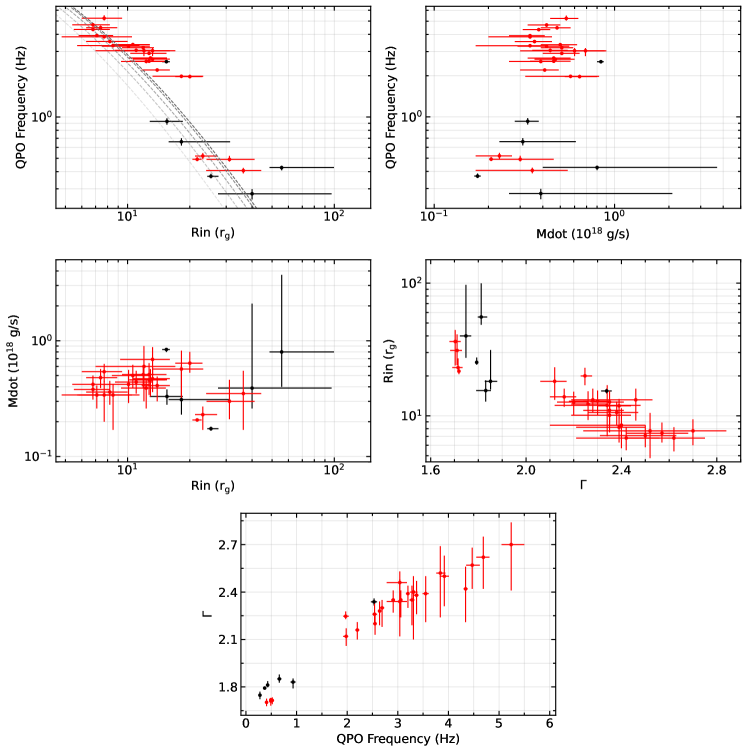
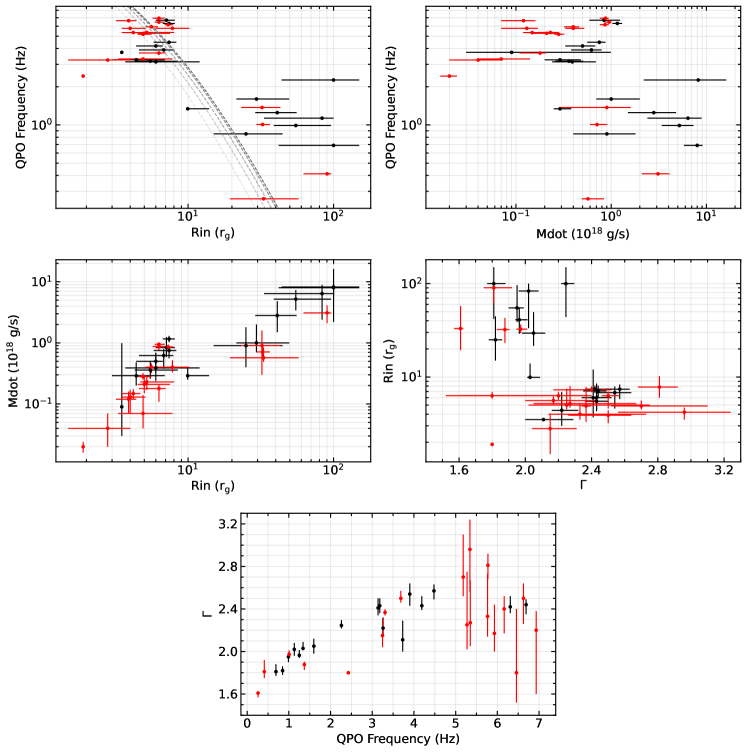
Correlation between the parameters involved in temporal and spectral analysis are shown in Fig. 6 and Fig. 7. An interesting result is the relationship between the photon index () and the QPO frequency (). The results we get from both sources share the same tendency, as shown in the bottom panels of Fig. 6 and Fig. 7. There is a strong positive correlation between and of the power-law in the beginning which flattens or starts reversing at the highest values of the . The turnoff in the correlation is not apparent in GX 3394, while it is evident in EXO 1846031 (around ). A similar kind of correlation have been reported in a number of other LMXBs (e.g., Vignarca et al. 2003; Titarchuk & Fiorito 2004; Titarchuk & Seifina 2009; Fürst et al. 2016). Titarchuk & Fiorito (2004) introduced the transition layer (TL) model to explain the observed correlations. The TL model depicts how the QPOs related to the corona properties (e.g., the size, optical depth, temperature and spectral index), and predicts the correlation between photon index and QPO frequency. The results we get are in good agreement with the model’s predictions, except for the observations of EXO 1846031 with , where a negative correlation between and appears. A universal explanation of this correlation between and is still missing.
The upper left panel of Fig. 6 shows a broad anti-correlation between the QPO frequency () and inner radius () in GX 3394. This anti-correlation is not particularly significant in EXO 1846031, and we can only see a general tendency of larger corresponding to a smaller frequency. The same correlation between the QPO frequency and the disk inner radius was reported in other sources (e.g., GRS 1915+105; Rodriguez et al. 2002). The Lense–Thirring precession model would predict anti-correlation between and , and a direct dependence of the QPO frequency on the inner radius (Ingram et al. 2009; Ingram & Done 2010). To check the possibility of modeling the results with the relativistic precession model, we use equation 2 in Ingram et al. (2009) to fit data points. The model cannot explain the results we obtained, both in the case of GX 3394 and EXO 1846031, as shown in the plot.
The variation of the frequency with the accretion rate is shown in the upper right panels of Fig. 6 and Fig. 7. Liu et al. (2021a) reported a strongest correlation between the QPO frequency () and mass accretion rate () in GRS 1915+105 with HXMT data. We do not find any significant correlation between them in GX 3394, while there is a weak anti-correlation in EXO 1846031. In fact, a positive correlation between and is proposed in the TL model by Titarchuk & Fiorito (2004), and in the disk-corona natural frequency model by Mastichiadis et al. (2022). Fig. 3 of Titarchuk & Fiorito (2004) depicts the positive correlation between and the -parameter (which is proportional to mass accretion rate), which is opposite to what we find. Besides, Mastichiadis et al. (2022) argue that type-C QPOs could arise from the interaction of the hot corona with the cold accretion disk, and predict a formula below a certain mass accretion rate (Fig. 5 of Mastichiadis et al. (2022)). The results we get do not fit well with the predictions of that model. These discrepancies may suggest that the “transition layer model” and the disk-corona natural frequency model are not favored in our case.
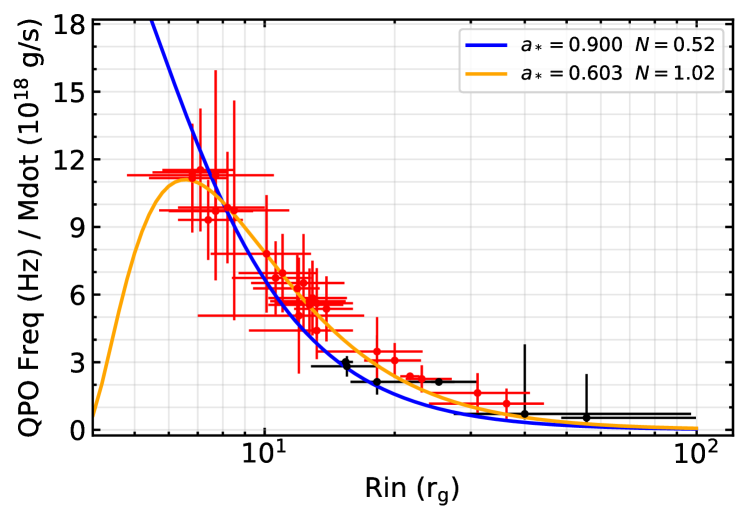
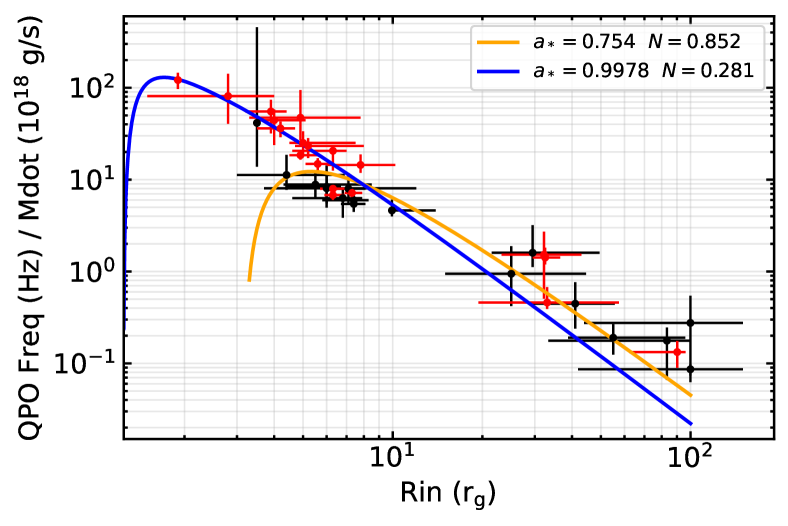
Misra et al. (2020) identified QPOs as the dynamic frequency of a truncated relativistic accretion disk in the case of GRS 1915+105. The dynamic frequency is defined as the ratio of the sound propagation velocity of the inner disk to the truncation radius, i.e., the inverse of the sound crossing time (Misra et al., 2020). Based on the assumption that the accretion disk is a standard relativistic accretion disk (Novikov & Thorne, 1973), the dynamic frequency is a function of the inner radius (), black hole spin (), mass accretion rate () and a normalization factor (). Liu et al. (2021a) extended the results in Misra et al. (2020) to a larger range of accretion rates with HXMT data of GRS 1915+105, and confirmed the high spin nature of the source. Following the work of Misra et al. (2020) and Liu et al. (2021a), we illustrate the relation between QPO frequency () divided by accretion rate () and disk inner radius () in Fig. 8 and Fig. 9. Both sources show negative correlation between and , Moreover, the correlation follows the prediction of the dynamic frequency model.
We fit the relation between and using Equation (3) in Misra et al. (2020). The fit returns and for EXO 1846031, indicating a rapidly spinning black hole. This result is consistent with what has been reported by analyzing the blurred reflection spectra (e.g., Draghis et al. 2020; Abdikamalov et al. 2021). The best-fit curve is shown in Fig. 9. In the case of GX 3394, the fit returns and . Such a low spin result is somewhat different from the result obtained by analyzing the blurred reflection spectra or thermal spectra (e.g. Reis et al. 2008; Ludlam et al. 2015; García et al. 2015; Parker et al. 2016; Wang et al. 2020). We note that for this source we do not have data below 6 . The relativistic effects are more evident at lower (3 5 ). Hence, data points at lower plays a crucial role in the estimation of spin parameter value. In Fig. 8, we simultaneously show two curves, and . It is worth noting that the most important difference between the two curves is reflected in the region with low . This also proves our view that a reasonable fitting value cannot be obtained because of the lack of data with relatively small .
The middle right panels of Fig. 6 and Fig. 7 show that the inner disk radius tends to decrease when the photon index () increases. The behaviour is consistent with that expected during a hard-to-soft transition. A noteworthy positive correlation between the mass accretion rate () and the inner radius () in EXO 1846031 is described in the middle left panel of Fig. 7. A similar relationship was reported in GRS 1915+105 (Misra et al. 2020; Liu et al. 2021a; Rawat et al. 2022) and MAXI J1535-571 (Garg et al., 2022). The correlation is beyond the expectation of truncated disk model (Done et al., 2007). But Dullemond & Spruit (2005) predicted a positive correlation between and (see their Fig. 8), calculating the evaporation of the cool accretion disk on account of the ion-bombardment. An alternative explanation is discussed in Abramowicz et al. (1978), where the authors suggested a larger inner edge is required when the mass accretion rate increases to dissipate the angular momentum of accretion material.
5. Conclusion
We investigate the temporal and spectral properties from the latest HXMT and NICER observing campaign of GX 3394 and EXO 1846031. Temporal and spectral analysis show that the evolution of the QPO frequency is closely related to mass accretion rate and inner disk radius in both sources. Comparing the relativistic precession model, the natural frequency model and the dynamic frequency model, we find the dynamic frequency model gives the best fit to our results. We extend the application of the model from GRS 1915+105, a persistent source, to these two transient sources, and confirm the high spin nature of the black hole in EXO 1846031.
Acknowledgements
This work was supported by the Natural Science Foundation of Shanghai, Grant No. 22ZR1403400, the Shanghai Municipal Education Commission, Grant No. 2019-01-07-00-07-E00035, and the National Natural Science Foundation of China (NSFC), Grant No. 12250610185, 11973019, and 12261131497.
Appendix A Appendix A
| Mission | Obs. ID | Start data | Exposure (s) |
|---|---|---|---|
| HXMT | P0304024026 | 2021-03-12 | 2274 |
| P0304024028 | 2021-03-14 | 1401 | |
| P0304024032 | 2021-03-18 | 1597 | |
| P0304024035 | 2021-03-22 | 1669 | |
| P0304024036 | 2021-03-24 | 1193 | |
| P0304024038 | 2021-03-26 | 2088 | |
| NICER | 3558011402 | 2021-03-17 | 1595 |
| 3558011501 | 2021-03-19 | 7560 | |
| 4133010101 | 2021-03-19 | 2030 | |
| 4133010102 | 2021-03-20 | 1860 | |
| 4133010103 | 2021-03-26 | 6111 | |
| 4133010104 | 2021-03-27 | 8709 |
| Mission | Obs. ID | Start data | Exposure (s) |
| HXMT | P021405000101 | 2019-08-02 | 718 |
| P021405000102 | 2019-08-02 | 1436 | |
| P021405000103 | 2019-08-02 | 762 | |
| P021405000104 | 2019-08-02 | 718 | |
| P021405000105 | 2019-08-02 | 1715 | |
| P021405000106 | 2019-08-03 | 563 | |
| P021405000107 | 2019-08-03 | 656 | |
| P021405000301 | 2019-08-05 | 700 | |
| P021405000302 | 2019-08-05 | 1102 | |
| P021405000303 | 2019-08-05 | 678 | |
| P021405000401 | 2019-08-06 | 718 | |
| P021405000502 | 2019-08-07 | 691 | |
| P021405000503 | 2019-08-07 | 539 | |
| P021405000601 | 2019-08-08 | 1130 | |
| P021405000701 | 2019-08-08 | 1163 | |
| P021405000702 | 2019-08-09 | 1795 | |
| NICER | 2200760101 | 2019-07-31 | 5658 |
| 2200760102 | 2019-08-01 | 1165 | |
| 2200760103 | 2019-08-02 | 2562 | |
| 2200760104 | 2019-08-03 | 1488 | |
| 2200760105 | 2019-08-04 | 1130 | |
| 2200760106 | 2019-08-05 | 3564 | |
| 2200760107 | 2019-08-06 | 912 | |
| 2200760108 | 2019-08-07 | 927 | |
| 2200760109 | 2019-08-08 | 3293 | |
| 2200760110 | 2019-08-09 | 4629 | |
| 2200760112 | 2019-08-11 | 2749 | |
| 2200760113 | 2019-08-12 | 3341 | |
| 2200760114 | 2019-08-13 | 7154 | |
| 2200760115 | 2019-08-13 | 8181 | |
| 2200760116 | 2019-08-15 | 4703 | |
| 2200760117 | 2019-08-16 | 8739 | |
| 2200760118 | 2019-08-17 | 4875 | |
| 2200760119 | 2019-08-17 | 3341 | |
| 2200760120 | 2019-08-19 | 3894 |

| Obs. ID | [ cm-2] | QPO frequency | [ g s-1] | [] | |||
|---|---|---|---|---|---|---|---|
| P0304024026 | |||||||
| P0304024028 | |||||||
| P0304024032 | |||||||
| P0304024035 | |||||||
| P0304024036 | |||||||
| P0304024038 | |||||||
| 3558011402 | |||||||
| 3558011501 | |||||||
| 4133010101 | |||||||
| 4133010102 | |||||||
| 4133010103-1 | |||||||
| 4133010103-2 | |||||||
| 4133010103-3 | |||||||
| 4133010103-4 | |||||||
| 4133010103-5 | |||||||
| 4133010103-6 | |||||||
| 4133010103-7 | |||||||
| 4133010103-8 | |||||||
| 4133010103-9 | |||||||
| 4133010104-1 | |||||||
| 4133010104-2 | |||||||
| 4133010104-3 | |||||||
| 4133010104-4 | |||||||
| 4133010104-5 | |||||||
| 4133010104-6 | |||||||
| 4133010104-7 | |||||||
| 4133010104-8 | |||||||
| 4133010104-9 | |||||||
| 4133010104-10 | |||||||
| 4133010104-11 | |||||||
| 4133010104-12 | |||||||
| 4133010104-13 |
| Obs. ID | [ cm-2] | QPO frequency | [ g s-1] | [] | |||
|---|---|---|---|---|---|---|---|
| P021405000101 | |||||||
| P021405000102 | |||||||
| P021405000103 | |||||||
| P021405000104 | |||||||
| P021405000105 | |||||||
| P021405000106 | |||||||
| P021405000107 | |||||||
| P021405000201 | |||||||
| P021405000301 | |||||||
| P021405000302 | |||||||
| P021405000303 | |||||||
| P021405000401 | |||||||
| P021405000502 | |||||||
| P021405000503 | |||||||
| P021405000601 | |||||||
| P021405000701 | |||||||
| P021405000702 | |||||||
| 2200760101 | |||||||
| 2200760102 | |||||||
| 2200760103 | |||||||
| 2200760104 | |||||||
| 2200760105 | |||||||
| 2200760106 | |||||||
| 2200760107 | |||||||
| 2200760108 | |||||||
| 2200760109 | |||||||
| 2200760110 | |||||||
| 2200760112 | |||||||
| 2200760113 | |||||||
| 2200760114 | |||||||
| 2200760115 | |||||||
| 2200760116 | |||||||
| 2200760117 | |||||||
| 2200760118 | |||||||
| 2200760119 | |||||||
| 2200760120 |
References
- Abdikamalov et al. (2021) Abdikamalov, A. B., Ayzenberg, D., Bambi, C., Liu, H., & Zhang, Y. 2021, Phys. Rev. D, 103, 103023, doi: 10.1103/PhysRevD.103.103023
- Abramowicz et al. (1978) Abramowicz, M., Jaroszynski, M., & Sikora, M. 1978, A&A, 63, 221
- Arnaud (1996) Arnaud, K. A. 1996, in Astronomical Society of the Pacific Conference Series, Vol. 101, Astronomical Data Analysis Software and Systems V, ed. G. H. Jacoby & J. Barnes, 17
- Belloni & Hasinger (1990) Belloni, T., & Hasinger, G. 1990, A&A, 227, L33
- Belloni et al. (2000) Belloni, T., Klein-Wolt, M., Méndez, M., van der Klis, M., & van Paradijs, J. 2000, A&A, 355, 271, doi: 10.48550/arXiv.astro-ph/0001103
- Belloni et al. (2002) Belloni, T., Psaltis, D., & van der Klis, M. 2002, ApJ, 572, 392, doi: 10.1086/340290
- Belloni (2010) Belloni, T. M. 2010, in Lecture Notes in Physics, Berlin Springer Verlag, ed. T. Belloni, Vol. 794, 53, doi: 10.1007/978-3-540-76937-8_3
- Cao et al. (2020) Cao, X., Jiang, W., Meng, B., et al. 2020, Science China Physics, Mechanics, and Astronomy, 63, 249504, doi: 10.1007/s11433-019-1506-1
- Casella et al. (2004) Casella, P., Belloni, T., Homan, J., & Stella, L. 2004, A&A, 426, 587, doi: 10.1051/0004-6361:20041231
- Casella et al. (2005) Casella, P., Belloni, T., & Stella, L. 2005, ApJ, 629, 403, doi: 10.1086/431174
- Chen et al. (2020) Chen, Y., Cui, W., Li, W., et al. 2020, Science China Physics, Mechanics, and Astronomy, 63, 249505, doi: 10.1007/s11433-019-1469-5
- Done et al. (2007) Done, C., Gierliński, M., & Kubota, A. 2007, A&A Rev., 15, 1, doi: 10.1007/s00159-007-0006-1
- Draghis et al. (2020) Draghis, P. A., Miller, J. M., Cackett, E. M., et al. 2020, ApJ, 900, 78, doi: 10.3847/1538-4357/aba2ec
- Dullemond & Spruit (2005) Dullemond, C. P., & Spruit, H. C. 2005, A&A, 434, 415, doi: 10.1051/0004-6361:20042517
- Ebisawa et al. (2003) Ebisawa, K., Życki, P., Kubota, A., Mizuno, T., & Watarai, K.-y. 2003, ApJ, 597, 780, doi: 10.1086/378586
- Fürst et al. (2015) Fürst, F., Nowak, M. A., Tomsick, J. A., et al. 2015, ApJ, 808, 122, doi: 10.1088/0004-637X/808/2/122
- Fürst et al. (2016) Fürst, F., Grinberg, V., Tomsick, J. A., et al. 2016, ApJ, 828, 34, doi: 10.3847/0004-637X/828/1/34
- García et al. (2014) García, J., Dauser, T., Lohfink, A., et al. 2014, ApJ, 782, 76, doi: 10.1088/0004-637X/782/2/76
- García et al. (2015) García, J. A., Steiner, J. F., McClintock, J. E., et al. 2015, ApJ, 813, 84, doi: 10.1088/0004-637X/813/2/84
- Garg et al. (2022) Garg, A., Misra, R., & Sen, S. 2022, MNRAS, 514, 3285, doi: 10.1093/mnras/stac1490
- Guo et al. (2020) Guo, C.-C., Liao, J.-Y., Zhang, S., et al. 2020, Journal of High Energy Astrophysics, 27, 44, doi: 10.1016/j.jheap.2020.02.008
- Homan & Belloni (2005) Homan, J., & Belloni, T. 2005, Ap&SS, 300, 107, doi: 10.1007/s10509-005-1197-4
- Homan et al. (2020) Homan, J., Bright, J., Motta, S. E., et al. 2020, ApJ, 891, L29, doi: 10.3847/2041-8213/ab7932
- Huppenkothen et al. (2019) Huppenkothen, D., Bachetti, M., Stevens, A. L., et al. 2019, ApJ, 881, 39, doi: 10.3847/1538-4357/ab258d
- Ingram & Done (2010) Ingram, A., & Done, C. 2010, MNRAS, 405, 2447, doi: 10.1111/j.1365-2966.2010.16614.x
- Ingram et al. (2009) Ingram, A., Done, C., & Fragile, P. C. 2009, MNRAS, 397, L101, doi: 10.1111/j.1745-3933.2009.00693.x
- Liao et al. (2020a) Liao, J.-Y., Zhang, S., Lu, X.-F., et al. 2020a, Journal of High Energy Astrophysics, 27, 14, doi: 10.1016/j.jheap.2020.04.002
- Liao et al. (2020b) Liao, J.-Y., Zhang, S., Chen, Y., et al. 2020b, Journal of High Energy Astrophysics, 27, 24, doi: 10.1016/j.jheap.2020.02.010
- Liu et al. (2020) Liu, C., Zhang, Y., Li, X., et al. 2020, Science China Physics, Mechanics, and Astronomy, 63, 249503, doi: 10.1007/s11433-019-1486-x
- Liu et al. (2021a) Liu, H., Ji, L., Bambi, C., et al. 2021a, ApJ, 909, 63, doi: 10.3847/1538-4357/abdf65
- Liu et al. (2022) Liu, H., Jiang, J., Zhang, Z., et al. 2022, MNRAS, 513, 4308, doi: 10.1093/mnras/stac1178
- Liu et al. (2021b) Liu, H.-X., Huang, Y., Xiao, G.-C., et al. 2021b, Research in Astronomy and Astrophysics, 21, 070, doi: 10.1088/1674-4527/21/3/70
- Ludlam et al. (2015) Ludlam, R. M., Miller, J. M., & Cackett, E. M. 2015, ApJ, 806, 262, doi: 10.1088/0004-637X/806/2/262
- Markert et al. (1973) Markert, T. H., Canizares, C. R., Clark, G. W., et al. 1973, ApJ, 184, L67, doi: 10.1086/181290
- Mastichiadis et al. (2022) Mastichiadis, A., Petropoulou, M., & Kylafis, N. D. 2022, A&A, 662, A118, doi: 10.1051/0004-6361/202243397
- Miller et al. (2004) Miller, J. M., Fabian, A. C., Reynolds, C. S., et al. 2004, ApJ, 606, L131, doi: 10.1086/421263
- Misra et al. (2020) Misra, R., Rawat, D., Yadav, J. S., & Jain, P. 2020, ApJ, 889, L36, doi: 10.3847/2041-8213/ab6ddc
- Miyamoto et al. (1995) Miyamoto, S., Kitamoto, S., Hayashida, K., & Egoshi, W. 1995, ApJ, 442, L13, doi: 10.1086/187804
- Motch et al. (1983) Motch, C., Ricketts, M. J., Page, C. G., Ilovaisky, S. A., & Chevalier, C. 1983, A&A, 119, 171
- Motta et al. (2011) Motta, S., Muñoz-Darias, T., Casella, P., Belloni, T., & Homan, J. 2011, MNRAS, 418, 2292, doi: 10.1111/j.1365-2966.2011.19566.x
- Negoro et al. (2019) Negoro, H., Nakajima, M., Sugita, S., et al. 2019, The Astronomer’s Telegram, 12968, 1
- Novikov & Thorne (1973) Novikov, I. D., & Thorne, K. S. 1973, in Black Holes (Les Astres Occlus), 343–450
- Parker et al. (2016) Parker, M. L., Tomsick, J. A., Kennea, J. A., et al. 2016, ApJ, 821, L6, doi: 10.3847/2041-8205/821/1/L6
- Parmar et al. (1993) Parmar, A. N., Angelini, L., Roche, P., & White, N. E. 1993, A&A, 279, 179
- Plant et al. (2014) Plant, D. S., Fender, R. P., Ponti, G., Muñoz-Darias, T., & Coriat, M. 2014, MNRAS, 442, 1767, doi: 10.1093/mnras/stu867
- Psaltis et al. (1999) Psaltis, D., Belloni, T., & van der Klis, M. 1999, ApJ, 520, 262, doi: 10.1086/307436
- Qu et al. (2010) Qu, J. L., Lu, F. J., Lu, Y., et al. 2010, ApJ, 710, 836, doi: 10.1088/0004-637X/710/1/836
- Rawat et al. (2022) Rawat, D., Misra, R., Jain, P., & Yadav, J. S. 2022, MNRAS, 511, 1841, doi: 10.1093/mnras/stac154
- Reis et al. (2008) Reis, R. C., Fabian, A. C., Ross, R. R., et al. 2008, MNRAS, 387, 1489, doi: 10.1111/j.1365-2966.2008.13358.x
- Remillard et al. (2022) Remillard, R. A., Loewenstein, M., Steiner, J. F., et al. 2022, AJ, 163, 130, doi: 10.3847/1538-3881/ac4ae6
- Rodriguez et al. (2002) Rodriguez, J., Varnière, P., Tagger, M., & Durouchoux, P. 2002, A&A, 387, 487, doi: 10.1051/0004-6361:20000524
- Samimi et al. (1979) Samimi, J., Share, G. H., Wood, K., et al. 1979, Nature, 278, 434, doi: 10.1038/278434a0
- Shimura & Takahara (1995) Shimura, T., & Takahara, F. 1995, ApJ, 445, 780, doi: 10.1086/175740
- Sobczak et al. (2000) Sobczak, G. J., Remillard, R. A., Muno, M. P., & McClintock, J. E. 2000, arXiv e-prints, astro, doi: 10.48550/arXiv.astro-ph/0004215
- Steiner et al. (2009) Steiner, J. F., Narayan, R., McClintock, J. E., & Ebisawa, K. 2009, PASP, 121, 1279, doi: 10.1086/648535
- Stella & Vietri (1998) Stella, L., & Vietri, M. 1998, ApJ, 492, L59, doi: 10.1086/311075
- Titarchuk & Fiorito (2004) Titarchuk, L., & Fiorito, R. 2004, ApJ, 612, 988, doi: 10.1086/422573
- Titarchuk & Seifina (2009) Titarchuk, L., & Seifina, E. 2009, ApJ, 706, 1463, doi: 10.1088/0004-637X/706/2/1463
- van der Klis (2005) van der Klis, M. 2005, Astronomische Nachrichten, 326, 798, doi: 10.1002/asna.200510416
- Varnière et al. (2012) Varnière, P., Tagger, M., & Rodriguez, J. 2012, A&A, 545, A40, doi: 10.1051/0004-6361/201116698
- Verner et al. (1996) Verner, D. A., Ferland, G. J., Korista, K. T., & Yakovlev, D. G. 1996, ApJ, 465, 487, doi: 10.1086/177435
- Vignarca et al. (2003) Vignarca, F., Migliari, S., Belloni, T., Psaltis, D., & van der Klis, M. 2003, A&A, 397, 729, doi: 10.1051/0004-6361:20021542
- Wang et al. (2020) Wang, J., Kara, E., Steiner, J. F., et al. 2020, ApJ, 899, 44, doi: 10.3847/1538-4357/ab9ec3
- Wang-Ji et al. (2018) Wang-Ji, J., García, J. A., Steiner, J. F., et al. 2018, ApJ, 855, 61, doi: 10.3847/1538-4357/aaa974
- Wijnands et al. (1999) Wijnands, R., Homan, J., & van der Klis, M. 1999, ApJ, 526, L33, doi: 10.1086/312365
- Williams et al. (2022) Williams, D. R. A., Motta, S. E., Fender, R., et al. 2022, MNRAS, 517, 2801, doi: 10.1093/mnras/stac2700
- Wilms et al. (2000) Wilms, J., Allen, A., & McCray, R. 2000, ApJ, 542, 914, doi: 10.1086/317016
- Zdziarski et al. (2019) Zdziarski, A. A., Ziółkowski, J., & Mikołajewska, J. 2019, MNRAS, 488, 1026, doi: 10.1093/mnras/stz1787
- Zhang et al. (2014) Zhang, S., Lu, F. J., Zhang, S. N., & Li, T. P. 2014, in Society of Photo-Optical Instrumentation Engineers (SPIE) Conference Series, Vol. 9144, Space Telescopes and Instrumentation 2014: Ultraviolet to Gamma Ray, ed. T. Takahashi, J.-W. A. den Herder, & M. Bautz, 914421, doi: 10.1117/12.2054144
- Zhang et al. (1994) Zhang, S. N., Harmon, B. A., Wilson, C. A., et al. 1994, IAU Circ., 6096, 1
- Zhang et al. (2020) Zhang, S.-N., Li, T., Lu, F., et al. 2020, Science China Physics, Mechanics, and Astronomy, 63, 249502, doi: 10.1007/s11433-019-1432-6