Linearly dispersive bands at the onset of correlations in KxC60 films
Abstract
Molecular crystals are a flexible platform to induce novel electronic phases. Due to the weak forces between molecules, intermolecular distances can be varied over relatively larger ranges than interatomic distances in atomic crystals. On the other hand, the hopping terms are generally small, which results in narrow bands, strong correlations and heavy electrons. Here, by growing KxC60 fullerides on hexagonal layered Bi2Se3, we show that upon doping the series undergoes a Mott transition from a molecular insulator to a correlated metal, and an in-gap state evolves into highly dispersive Dirac-like fermions at half filling, where superconductivity occurs. This picture challenges the commonly accepted description of the low energy quasiparticles as appearing from a gradual electron doping of the conduction states, and suggests an intriguing parallel with the more famous family of the cuprate superconductors. More in general, it indicates that molecular crystals offer a viable route to engineer electron-electron interactions.
Molecular assemblies are appealing systems for engineering correlations since, intermolecular forces being typically weak, they can often be patterned in a desired way by an appropriate choice of the substrate. As a notable example, C60 can be grown on a number of substrates, resulting in different lattice mismatch, moiré periodicities, rotational order and contact geometries between the C60 molecules Kiguchi et al. (2003); Wang and Cheng (2004); Kim et al. (2015); Ojeda-Aristizabal et al. (2017); Haag et al. (2020). Such flexibility allows acting on the balance between the on-site Coulomb repulsion and the bandwidth , thereby tuning correlations and driving qualitatively different ground states. In this sense, self-assembling molecular crystals can represent a valid alternative to the recently discovered twisted-layer structures of graphene or transition metal dichalcogenides, Cao et al. (2018a, b); Ugeda et al. (2014); Wang et al. (2020a); Xu et al. (2021). Although these have the quality of lending themselves naturally to gating experiments, the ability to select a given ground state relies on the precise control of the twist angle, which is difficult and also incompatible with any bottom-up fabrication technique, since that would necessarily privilege the rotational alignment of the layers.
Here we focus on the family of the AxC60 fullerides, where fullerene molecules act as anions and other elements, often alkali metals, act as cations. The majority of the AxC60 compounds are known to transition from insulating to metallic for increasing as the C molecular orbitals get progressively filled Gunnarsson (1997); Capone et al. (2009); Takabayashi and Prassides (2016). The trivalent members are mostly metallic and superconducting, but can be antiferromagnetic insulators for large intermolecular distances. The proximity of superconductivity to a Mott insulating ground state suggested the possibility that its nature, which remains to this day uncertain, may not be that of conventional BCS theory and derive instead from electron-electron interactions, bearing similarities with the case of other unconventional superconductors Capone et al. (2002); Durand et al. (2003); Capone et al. (2009); Manini and Tosatti (2006); Takabayashi and Prassides (2016); Steglich and Wirth (2016); Yamamoto (2021).
Although the effect of electron doping by alkali metals has already been studied in many instances by photoemission, providing evidence of a clear departure from a rigid band shift Chen et al. (1991); Merkel et al. (1993); Wertheim and Buchanan (1993), the lack of angular resolution has left many fundamental unanswered questions on how the metallic state emerges, what the nature of the low energy excitations is, and how correlated states such as superconductivity develop from this metallic phase. Part of the difficulty associated with revealing the mechanisms behind these open questions is that, similarly to what happens in other C-based structures, such as graphene McChesney et al. (2010); Hwang et al. (2012); Cao et al. (2018a), the low energy states of K3C60 appear to be extremely dependent on small modifications of the crystal structure, substrate or preparation conditions. In addition, the growth of AxC60 samples is known to be prone to phase separation Kawasaki et al. (2013); Brouet et al. (2006). Indeed, the sparse photoemission measurements available present a remarkable variety of results both for angle-integrated Hesper et al. (2000) and angle-resolved photoemission (ARPES) studies, spanning from a clear hole-like dispersion reported in films grown on Ag(111) Yang et al. (2003), electron-like states on Ag(100) Brouet et al. (2004) to a very shallow electron pocket on Cu(111) Pai et al. (2010).
Here, by using ARPES on in situ grown films, we found that when doped C60 molecules are deposited on top of the layered topological insulator Bi2Se3, a molecular subband develops, equivalent to a lower Hubbard band in a Mott scenario, accompanied by the evolution from massive to nearly massless quasiparticles as half filling is approached. These results place K3C60 in the regime of correlated metals, and point to the AxC60 series as a platform where highly dispersive, Dirac-like electrons coexist with, and possibly can be tuned or driven by, electron-electron interactions.
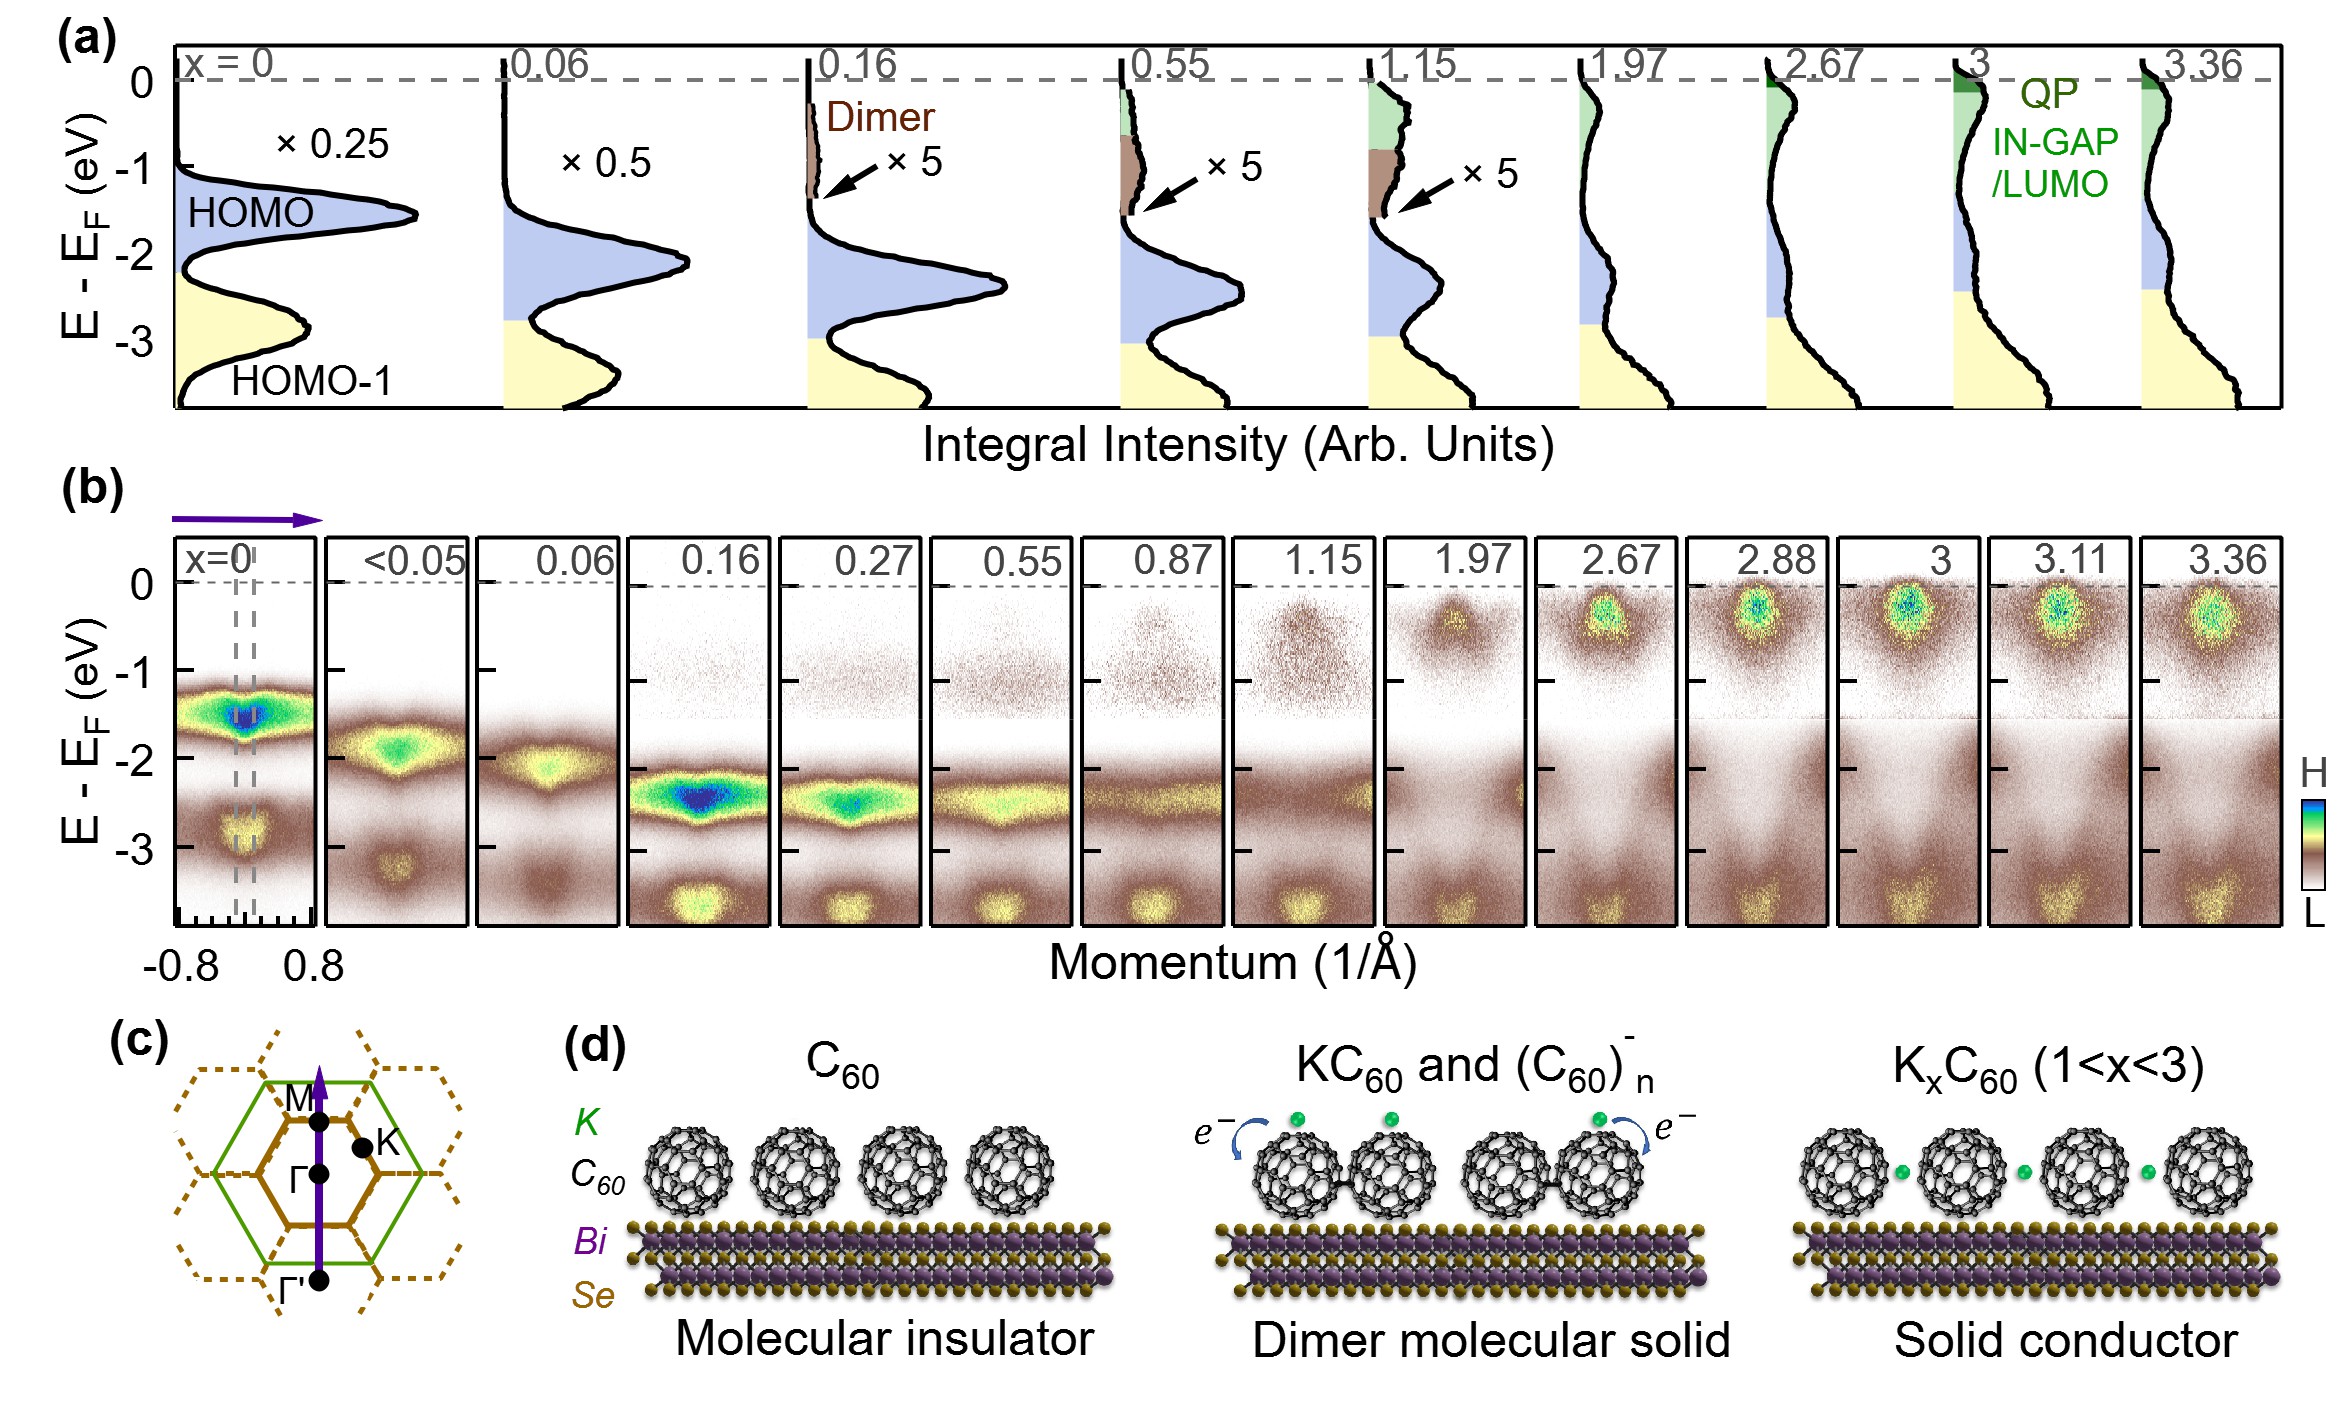
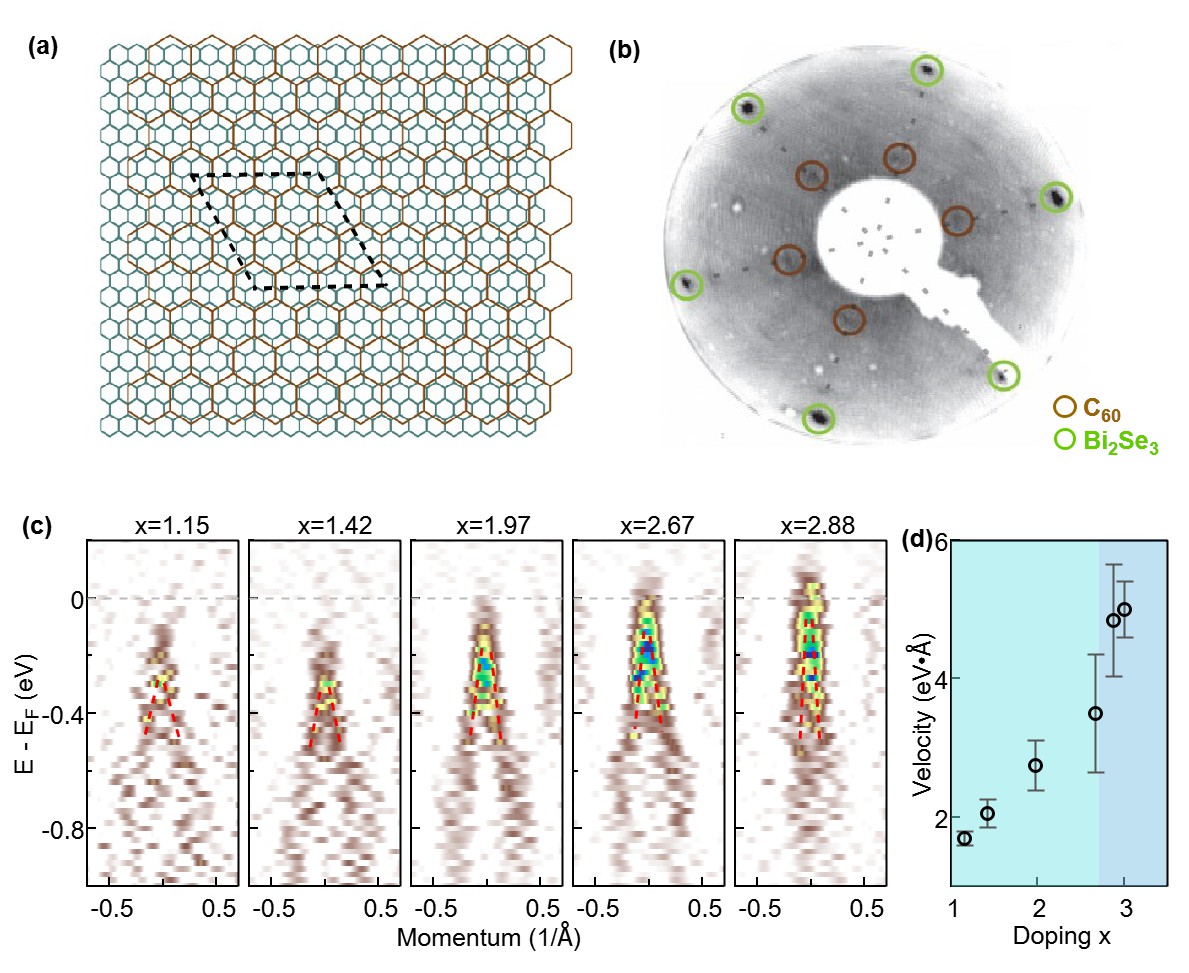
The samples measured in this work are KxC60 films with a thickness of five monolayers grown on Bi2Se3(0001), as described in the methods section sup and in Ref. Latzke et al. (2019b). The C60 molecules arrange along the (111) orientation in the same fcc structure as in the bulk, but with a 3.4% compressed lattice. Upon doping, the alkali ions progressively fill in the spaces in between the buckyballs until, for , they form three hexagonal lattice layers for each C60 layer, with stacking Stephens et al. (1991). The dispersion of the electronic bands remains mostly confined within the (111) planes (Supplementary Fig.S3)) and therefore we will discuss the data referring to the hexagonal surface Brillouin zone (BZ) of Fig. 1(c).
The evolution of the electronic structure of KxC60 from the insulating C60 to slightly above the “optimal” metallic state at half filling () is shown as a series of angle-integrated photoemission spectra in Fig. 1(a) and as ARPES maps along the direction, measured with polarization, in Fig. 1(b). In the angle-integrated data, the two peaks at are associated with the highest occupied molecular orbital (HOMO) and the next highest occupied molecular orbital (HOMO-1). Adding potassium, which ionizes and donates one charge per atom to the molecular solid Martins and Troullier (1992), for low doping levels both the HOMO and HOMO-1 spectral features shift toward higher binding energy as expected for a standard rigid band shift description upon electron doping, as well established from previous work Chen et al. (1991); Merkel et al. (1993); Wertheim and Buchanan (1993). The binding energy of the states is irrelevant in this regime since it depends on the pinning of the Fermi level () in the 1.6 eV band gap, further widened by the poor screening of the photohole Wertheim and Buchanan (1993).
For , a new in-gap state develops 1 eV below the Fermi level (brown in Fig. 1(a)). Its existence only over a finite doping range, , and its separation of 1.2 eV from the HOMO band (measured as peak-to-peak distance) suggests that it be related to the partial formation of C60 dimer pairs that can be stabilized below 270K and prevents a simple metallic state in K1C60 Zhu et al. (1995); Oszlányi et al. (1995); Pichler et al. (1997); Macovez et al. (2007); Konarev et al. (2010). For , an additional in-gap state emerges at -0.5eV (green in Fig. 1(a)), and in parallel an overall redistribution of the spectral intensity occurs between the HOMO and HOMO-1 bands. As we will show later (Fig. 1(b) and Fig. 3), this hybridization of the two molecular HOMO and HOMO-1 localized bands into a highly dispersive band for , much more dramatic than predicted by theory Erwin and Pickett (1991), marks the departure from a narrow bandwidth molecular orbital picture and the formation of a solid crystal as schematically illustrated in (Fig. 1(d)). As the doping approaches , a point which coincides with the minimum resistivity and superconductivity Merkel et al. (1993); Hesper et al. (2000), the in-gap state spectral weight is maximum and it crosses the Fermi level.
While the presence of both the insulating and metallic states has been previously reported, their origin has been matter of debate for a long time Gunnarsson et al. (1996); Han et al. (2000); Gunnarsson (1997). Approaching the problem from band theory, the insulating phase for =2,4 cannot be explained since the series is all expected to be metallic due to the partial filling of the manifold. Conversely, starting from a Mott-Hubbard approach it is the metallic phase for =3 that is equally puzzling, since the Coulomb repulsion is more than twice the bandwidth (0.5 eV) Satpathy et al. (1992). To unambiguously understand how metallicity develops, it is critical to have access to the energy and momentum dependence of each state upon doping of the manifold. We show in Fig. 1(b) such a study for the first time.
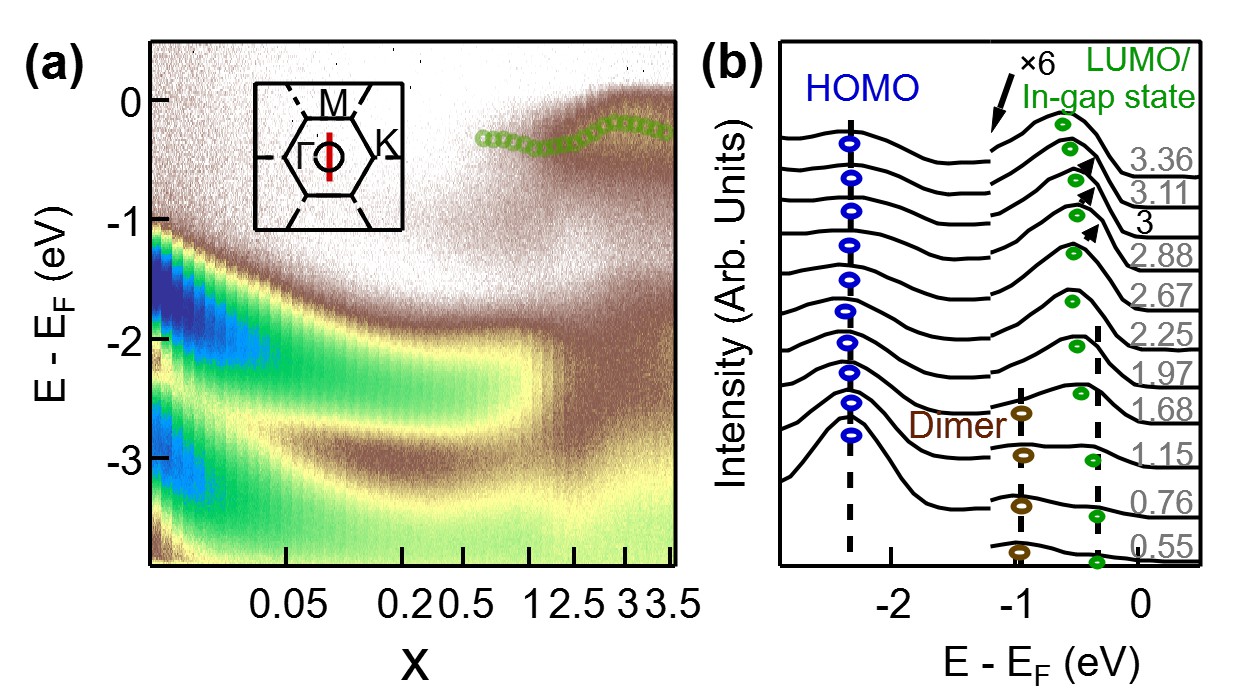
The data reveal a clear difference between the two in-gap states. Specifically, while the first one at -1 eV is strongly localized, the second state in proximity of the Fermi level is clearly dispersive, and its band velocity appears to increase approaching half filling, while its binding energy decreases (as discussed in detail later, see Supplementary Fig. S6). This doping dependence supports an intriguing scenario where the near- states are associated with the formation of a lower Hubbard band driven by correlations and are responsible for the transition to the insulating phase of a solid crystal on both sides of half filling (K2C60 and K4C60). This sets the KxC60 fulleride series within a Mott transition framework on both sides of , clearly different from the commonly accepted description where the low energy states are assigned to a lowest unoccupied molecular orbital (LUMO)-derived band, centered above , which shifts into the occupied states as the doping increases, and the transition is interpreted in a band filling picture Merkel et al. (1993); Wertheim and Buchanan (1993).
The doping dependence of the near- spectra is shown in Fig. 2 as an image plot of the ARPES intensity integrated over the momentum range along M indicated by the red line in the inset. All the spectral features mentioned in Fig. 1 very rapidly shift to higher binding energy (note the non linear scale for the axis) and starting from they start to gradually drift back toward . The shift to higher binding energies pins the Fermi level to the bottom of the unoccupied LUMO states Merkel et al. (1993); Wertheim and Buchanan (1993), whereas the opposite shift (Fig. 2(b)), not as clear in previous work and instead evident here, is almost certainly due to the more efficient screening approaching the metallic phase compared to that in the insulating one(s).
At half filling, the quasiparticle weight also includes contributions from LUMO-derived states. In this regime the distinction between Hubbard bands and in-gap state is of course ill-defined as the states hybridize and close the gap Wang et al. (2020b). The fact that this doping level also corresponds to the appearance of superconductivity represents an intriguing analogy with the case of cuprates, where the Fermi surface is best defined in the normal state at optimal doping, at the maximum of the superconducting dome.

In Fig. 3(a,b) we compare the ARPES spectra along the direction at the two extremes of the undoped insulating phase of C60 and of the optimally doped metallic phase of K3C60. As discussed in Fig. 1(b), in the optimally doped phase, the merging of the C60 molecular electronic levels with a bandwidth of 0.5 eV, into a single dispersive band with an overall bandwidth of 2 eV for K3C60 is observed. The K atoms therefore increase substantially the hopping terms between different fullerene buckyballs and the resulting bandwidth is now determined by the energy scale of the intermolecular forces Gunnarsson (1997). Indeed, because of the hybridization between the two manifolds, the description of the orbital composition following the icosahedral symmetry and the strict separation between (H-type) character for the HOMO states and (G-type) for the HOMO-1 states (Ref. Latzke et al. (2019a)) is no longer valid. Such hybridization is well visible also in the circular dichroism (CD) signal (See supplementary Fig. S7).
At half filling an additional state can be extracted from the momentum distribution curve (MDC) fits, overlapped to the image (see markers in Fig. 3(b)), which shows hole-like dispersion. At first sight it is reminiscent of the dispersive bands already reported for K3C60 grown on Ag(111) Yang et al. (2003); Brouet et al. (2004), yet a side by side comparison (Supplementary Fig. S4) reveals that the two cases are distinct with a difference in Fermi velocity of over 70% and a band minimum shallower than 0.2 eV in Ref. Yang et al. (2003) vs. a bandwidth larger than 0.4 eV in the present study.
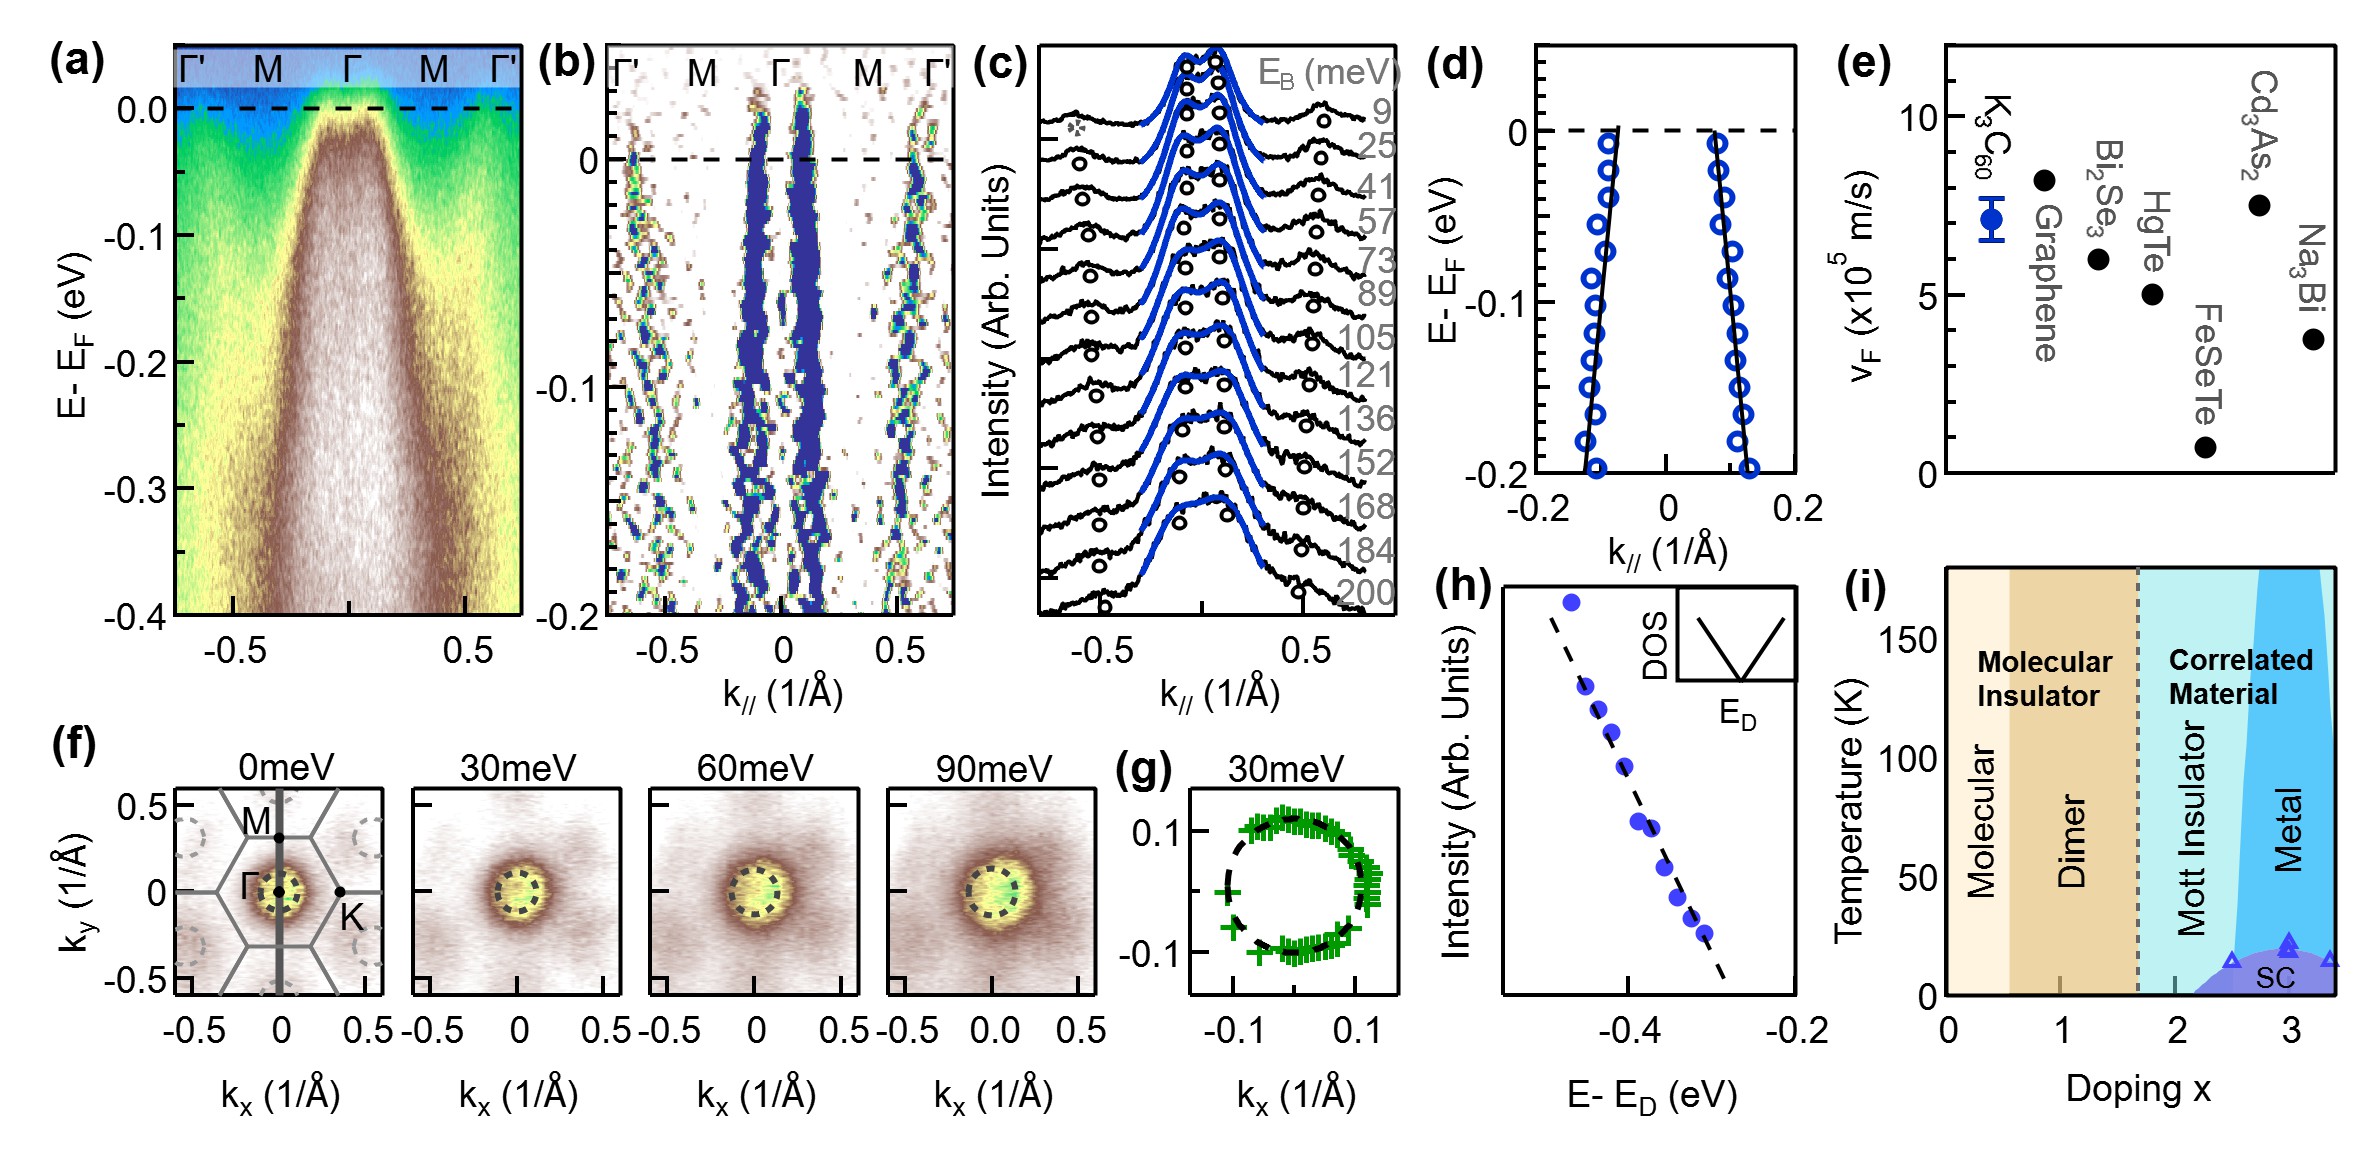
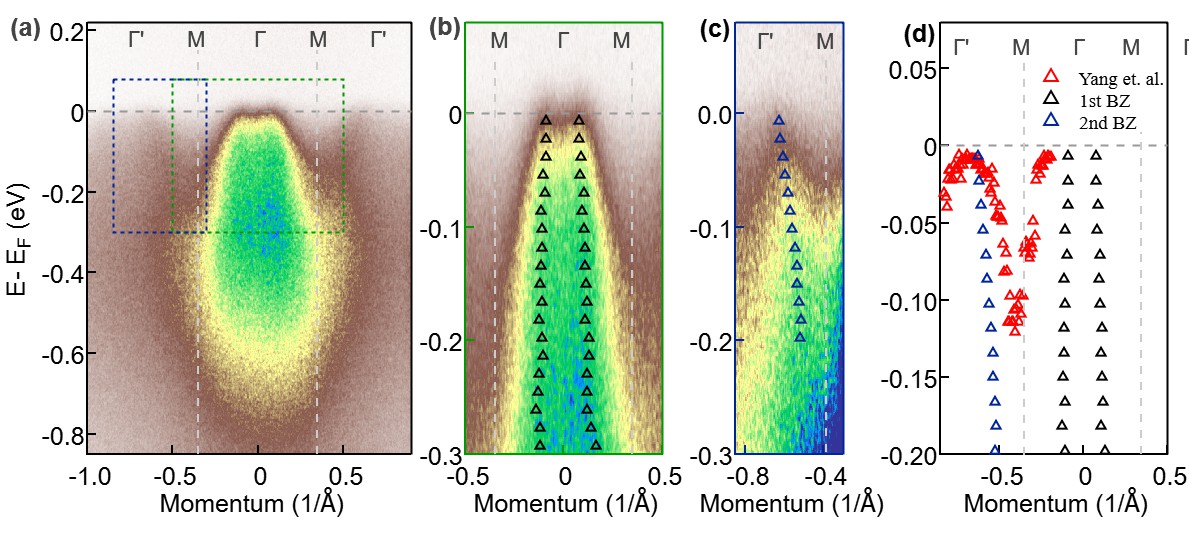
In Fig. 4(a,b), we report a high statistics image measured along across two BZs for . In contrast to the parabolic dispersion at lower doping, the data reveal a linear dispersion over the whole energy range up to 0.5 eV (see also supplementary Fig. S4), and is reminiscent of massless Dirac fermions. The exact dispersion is extracted in a quantitative way by using a standard Lorentzian fitting of the momentum distribution curves in Fig. 4(c,d). From a linear fit of the peak positions we find a Fermi velocity ms-1, comparable to some of the highest values reported for Dirac materials Castro Neto et al. (2009); Hwang et al. (2012); Xia et al. (2009); König et al. (2007); Zhang et al. (2018); Borisenko et al. (2014); Neupane et al. (2014); Liu et al. (2014) (see Fig. 4(e)). The position of the crossing point can be determined by extrapolating the dispersion to the unoccupied states, and is estimated to be (0.30.1) eV above the Fermi level. The constant energy maps ( vs. ), shown in Fig. 4(f), as well as the radial MDC fits of Fig. 4(g), prove the isotropic nature of the dispersion in the surface plane. Finally, the integrated spectral weight, which is proportional to the occupied density of states, as plotted in Fig. 4(h), reveals the same linear dependence as a function of the binding energy characteristic of Dirac fermions Zhou et al. (2006), in contrast to the more parabolic dispersion at lower doping. This description holds for a narrow doping range, with a transition to a parabolic hole-like dispersion for (Fig. 1(b)).
Since fullerides are widely studied materials and can be grown on a number of substrates, we are left with educated guesses of the reasons why the linearly dispersive states at have not been reported before. The Bi2Se3 substrate used here is known to reduce the rotational disorder of the C60 molecules Latzke et al. (2019b), and induces a compressive strain which lowers the intermolecular distance by 3.4% with respect to the bulk value. This unusual situation (most substrates induce a tensile strain, see Supplementary Table S1) results in an increase of the bandwidth , which is known to increase with the inverse of the intermolecular distance. Whereas on Ag(111) and Ag (100) values of 0.25 eV were found Yang et al. (2003); Brouet et al. (2004); not , here we extract a lower limit for of eV from the occupied portion of the states, and up to eV depending on the (non accessible) dispersion above the Fermi level. The Coulomb repulsion on the other hand is less straightforward to estimate from ARPES and would require a more involved analysis and comparison with Auger spectroscopy Lof et al. (1992). A dedicated theoretical treatment would be welcome to determine if the increase of is accompanied here by a lowering of the ratio, which may be the culprit of the observed emergence of carriers of higher mobility at . On the experimental side, a meaningful term of comparison will be provided by the recently synthesized fullerene crystals where the C60 molecules are covalently bonded and the intermolecular distance is reduced with respect to that in the fcc lattice Hou et al. (2022); Meirzadeh et al. (2023).
Regardless of the microscopic origin of the Dirac-like dispersion, the results presented reveal a transition from slow and massive electrons to fast and nearly massless quasiparticles which coexist and possibly are driven by electronic correlations. These findings put forward the exciting proposal that molecular crystals, with their adaptability to be patterned on multiple substrates, and in particular A3C60 compounds where even slight modifications of the bandwidth are known to result in different ground states, can provide a new flexible way to engineer correlations. In addition, the emergence of a metallic phase from an in-gap state in a fashion typical of a Mott transition hints at fascinating analogies with the case of superconducting cuprates. Interesting future developments will be to figure out how robust such massless fermions are in dependence of the intermolecular distance, as well as to explore the physics in the thin film limit, where the moiré potential would become important. K3C60 appears to be close to a sweet spot where the interplay between and allows for a crossover between an insulator and a correlated metal.
Acknowledgements.
I Acknowledgments
This work was primarily funded by the U.S. Department of Energy (DOE), Office of Science, Office of Basic Energy Sciences, Materials Sciences and Engineering Division under contract No. DE-AC02-05-CH11231 (Ultrafast Materials Science program KC2203). A.L. was partially supported as part of the Center for Novel Pathways to Quantum Coherence in Materials, an Energy Frontier Research Center funded by the US Department of Energy, Office of Science, Basic Energy Sciences. A.L. and L.M. also acknowledge support for sample growth from the Gordon and Betty Moore Foundation’s EPiQS Initiative through Grant No. GBMF4859. C.O.-A. was funded for data acquisition by DOE Office of Science, Office of Basic Energy Sciences under Contract No. DE-SC0018154. Sample growth was supported by the U.S. Department of Energy, Office of Science, Office of Basic Energy Sciences, Materials Sciences and Engineering Division under contract No. DE-AC02-05-CH11231, within the Van der Waals Heterostructures Program (KCWF16). The Advanced Light Source is supported by the DOE Office of Science User Facility under contract No. DEAC02-05CH11231.
II Supplementary materials
II.1 Materials and methods
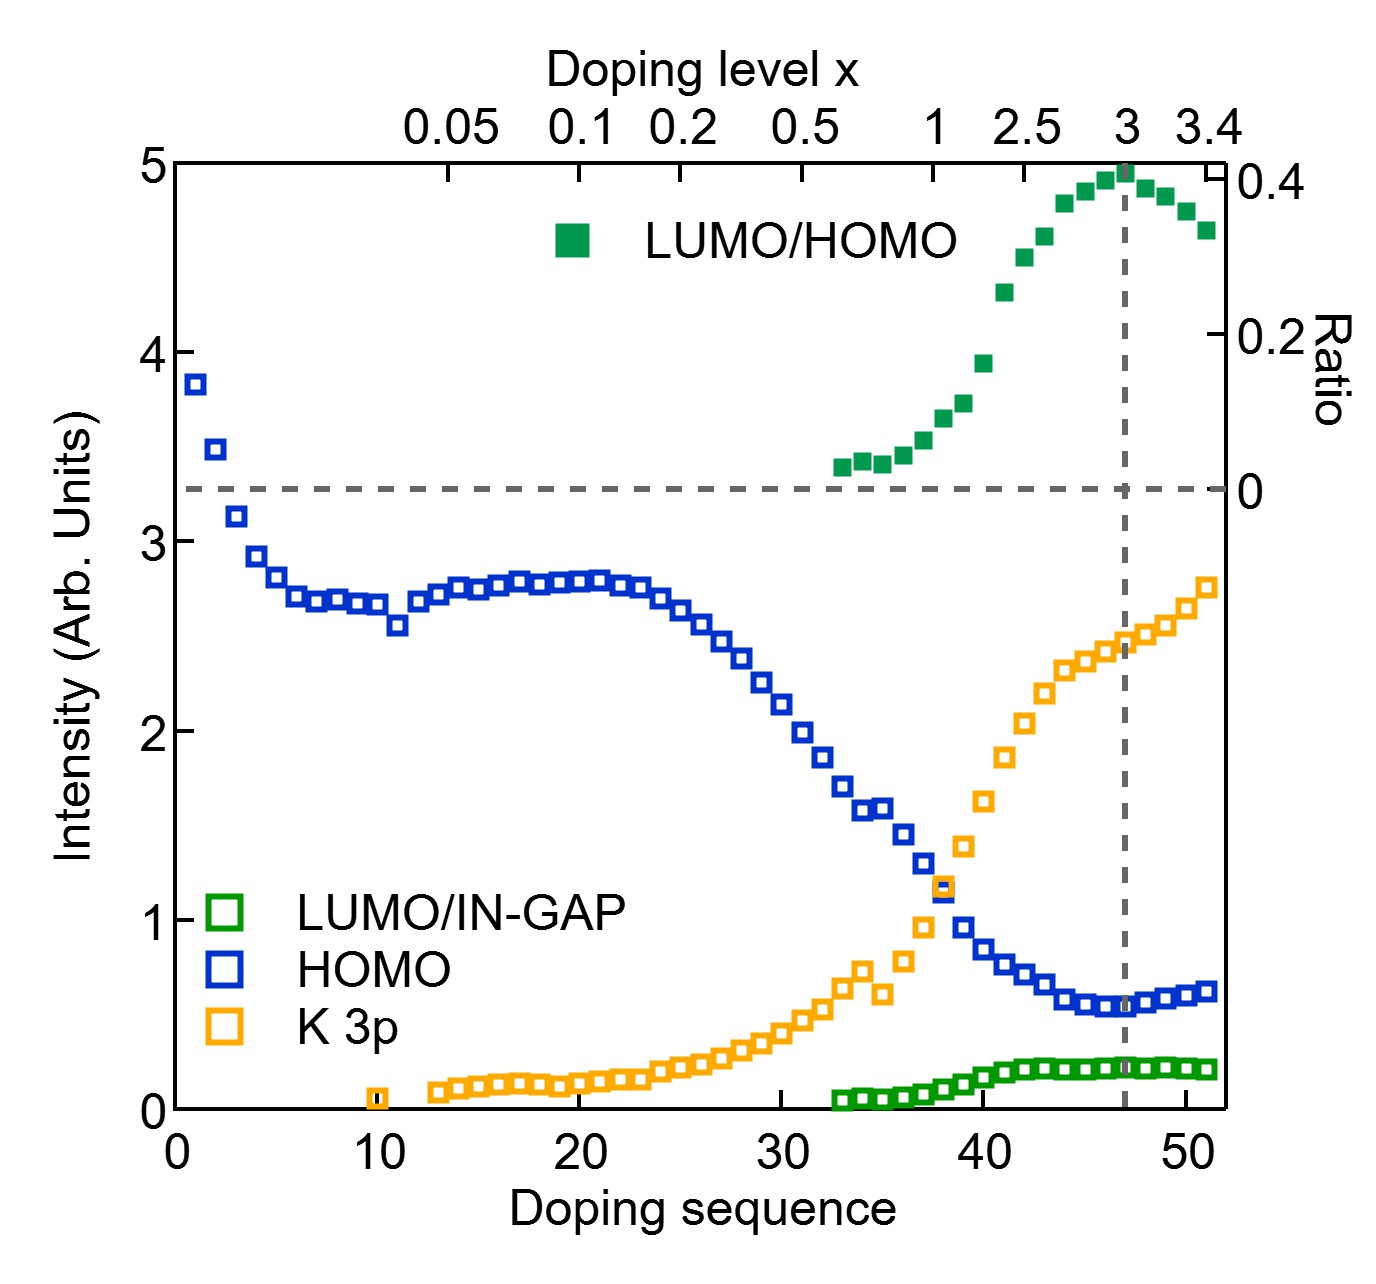
High-quality C60 thin film samples were grown in situ in ultrahigh vacuum on a bulk Bi2Se3 substrate as detailed elsewhere Latzke et al. (2019b). The film thickness was 50 Å. Potassium deposition is done in situ with a getter alkali evaporator. The angle-resolved and angle-integrated spectra are collected after each single deposition controlled by a timed shutter. The doping level is not linear with the dosing sequence and is estimated based on the relative ratio of the K 3 core level intensity with respect to the optimum doping () spectra. The latter is identified by the maximum value of the ratio between LUMO and HOMO band, in line with previous reports Merkel et al. (1993)). Note that, in view of our findings here, the LUMO intensity should be better identified as an in-gap (G) state, which hybridizes with the LUMO states only in proximity of half filling. High resolution ARPES experiments were performed at Beamline 4.0.3 (MERLIN) of the Advanced Light Source using 45 eV linearly or circularly polarized photons, and 70 eV photons (in supplementary Fig. S7) in vacuum better than Torr. The total-energy resolution was 20 meV with an angular resolution () of . Data were taken at 200 K during K-dosing and then cooled to 30 K for the high statistics maps of the massless states. No obvious change was noticed lowering the temperature except for a trivial sharpening of the spectral features.
II.2 Energy shifts upon electron doping
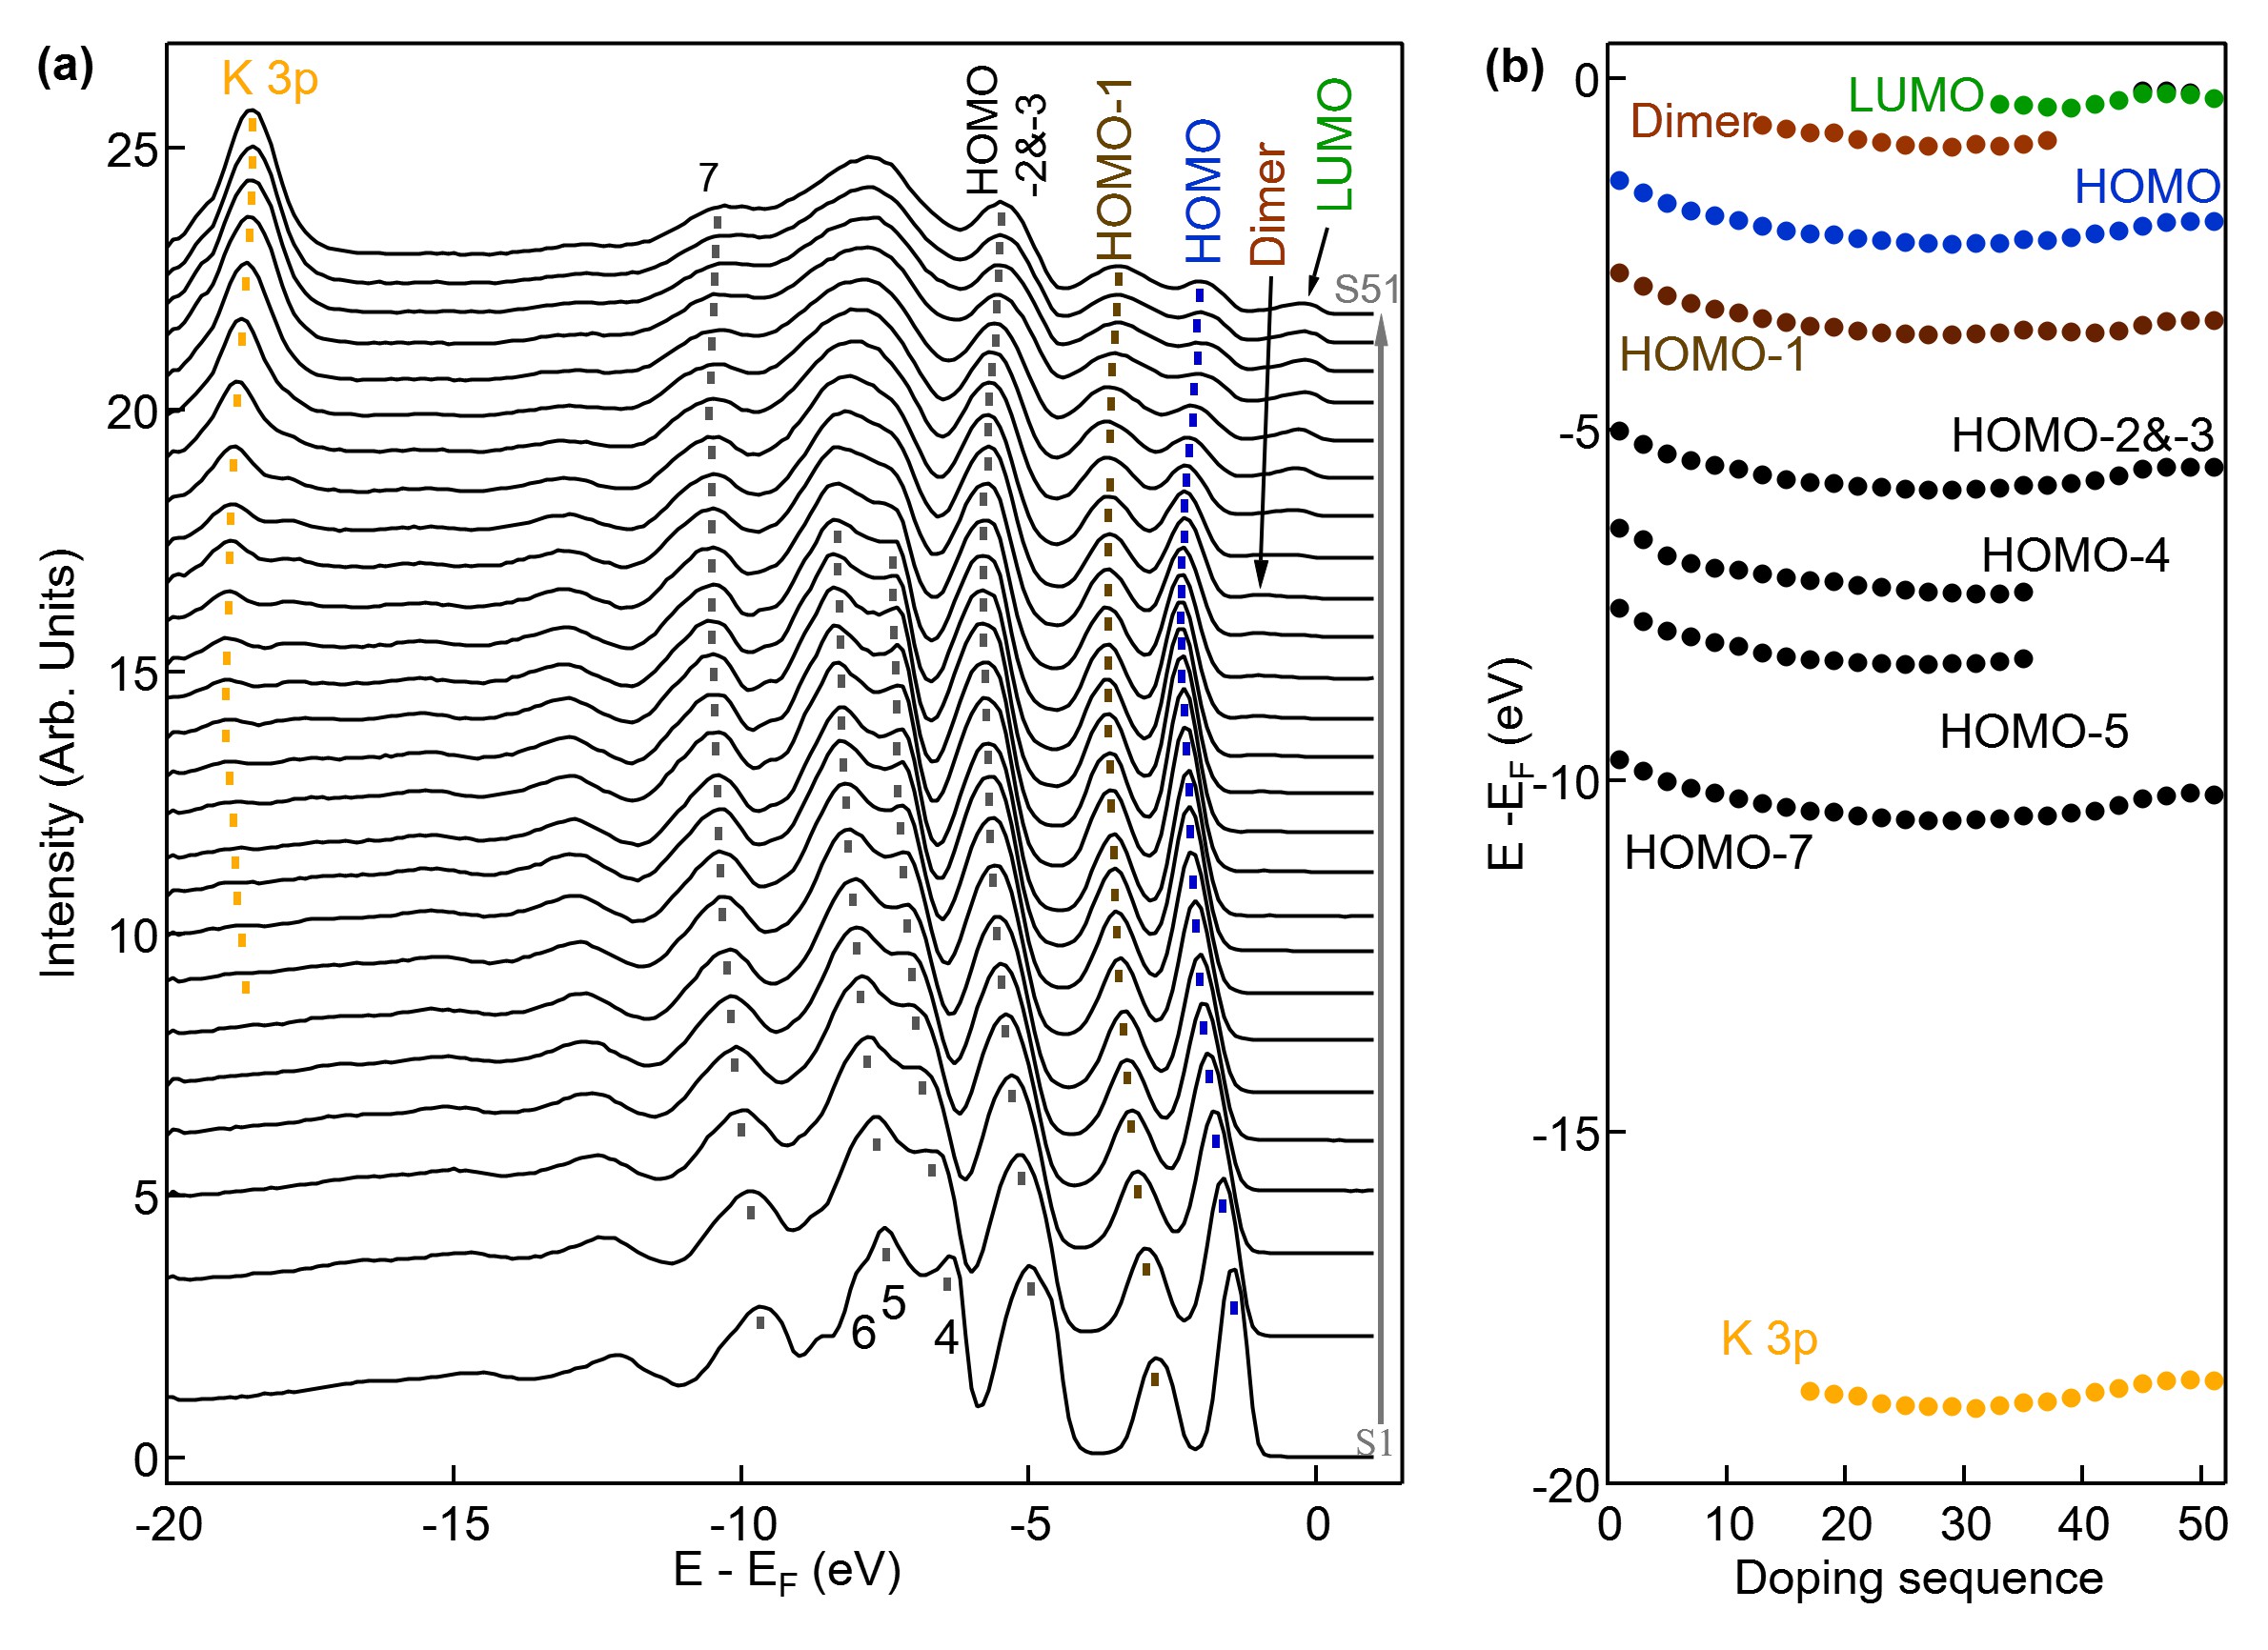
In Fig. S1 we show the evolution of the angle integrated photoemission spectra from undoped C60 to a doping level of . Overall, until the appearance of the G+LUMO states all the peaks including the K 3 level follow a rigid shift, as observed in previous photoemission studies Merkel et al. (1993); Wertheim and Buchanan (1993); Hesper et al. (2000). A more detailed dependence of the G+LUMO and HOMO energy shifts for doping levels approaching is shown in Fig. 2 of the main text.
Note that the energy shift changes sign as the sample starts to become more metallic, due to increased screening of the core hole, and that the HOMO and HOMO-1 peaks tend to merge, and same for the HOMO-4 and HOMO-5 features, as the addition of the K atoms increases the overlap between wavefunctions of different C60 molecules and causes a departure from the molecular orbital description of the electronic levels.
II.3 Doping level calibration
Although it is known to vary as a function of the photon energy, the ratio between the photemission intensity of the G+LUMO and HOMO states in the KxC60 series is highest for Merkel et al. (1993). In Fig. S2 we show separately the intensity of G+LUMO, HOMO and K 3 levels extracted from the angle integrated photemission data, as well as the (G+LUMO)/HOMO ratio. The doping level is then calibrated relative to the maximum ratio. While this estimate has some margin of error, this is certainly lower than for a calibration based on the deposition time, since the alkali atoms may not distribute uniformly across the layers. Note also that the first deposition cycles result into a large shift of the electronic levels (see Fig. S1) even though the K 3 is not yet visible in the spectra.
II.4 Photoemission intensity oscillation of C60 and K3C60
The photon-energy dependences of photoemission intensities of C60 were observed and discussed in previous papers Hasegawa et al. (1998b); Rüdel et al. (2002); Wang et al. (2008); Toffoli et al. (2011); Latzke et al. (2019a). Because of the unique molecular structure like a spherical shell and the large size of C60, the photoemission intensity shows an oscillation for each molecular orbitals, as shown in Fig. S3. Density functional theory (DFT) and time dependent DFT level (TDDFT) calculations considering the the symmetries of the ionized orbitals were carried out, which demonstrated the single-particle origin of the oscillations Toffoli et al. (2011).
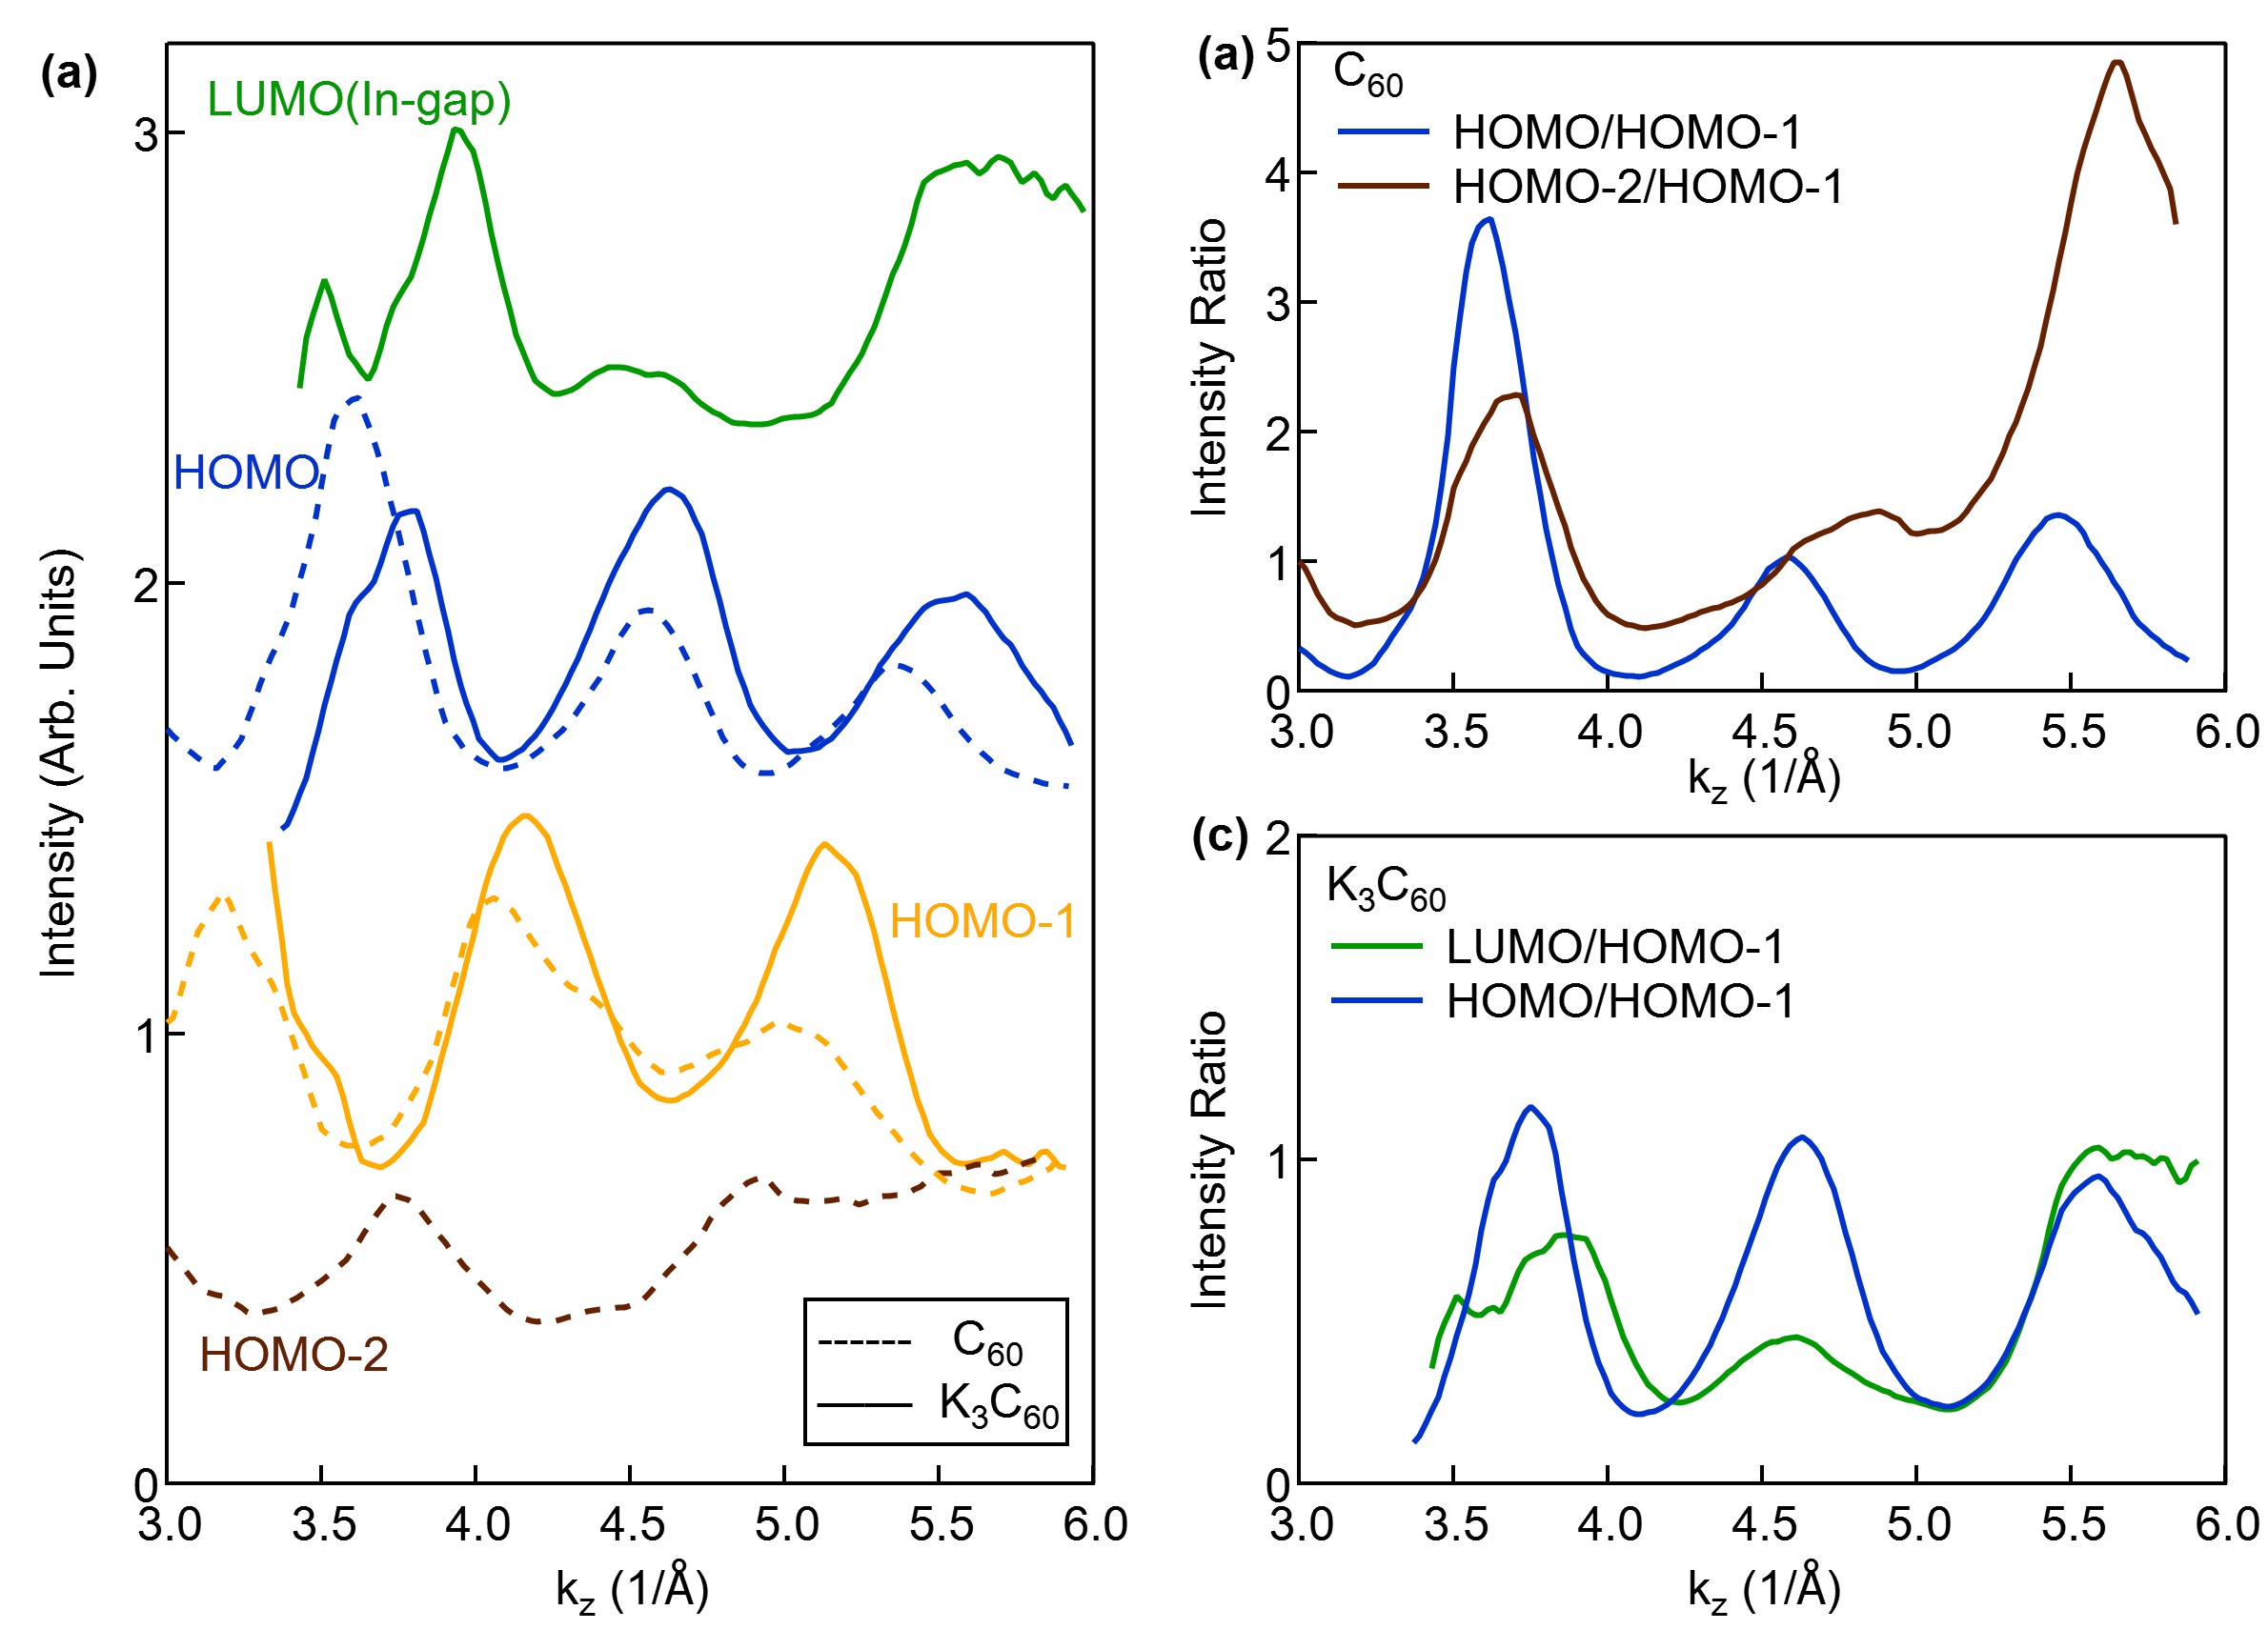
Here we compare the dependence on the surface-normal momentum of the photoemission intensity for C60 and K3C60 as total intensity (Fig. S3(a)) and as ratios of (G+LUMO)/HOMO, HOMO/HOMO-1 and HOMO-2/HOMO-1 (Fig. S3(b,c)) to help reduce the influence of the cross section variation. Clearly, although there are some differences among the overall intensity trends, the period of the oscillations is still dominated by the molecular properties of the C60 molecule rather than by the period of the crystal structure, which would result instead in a periodicity
II.5 Linear dispersion at
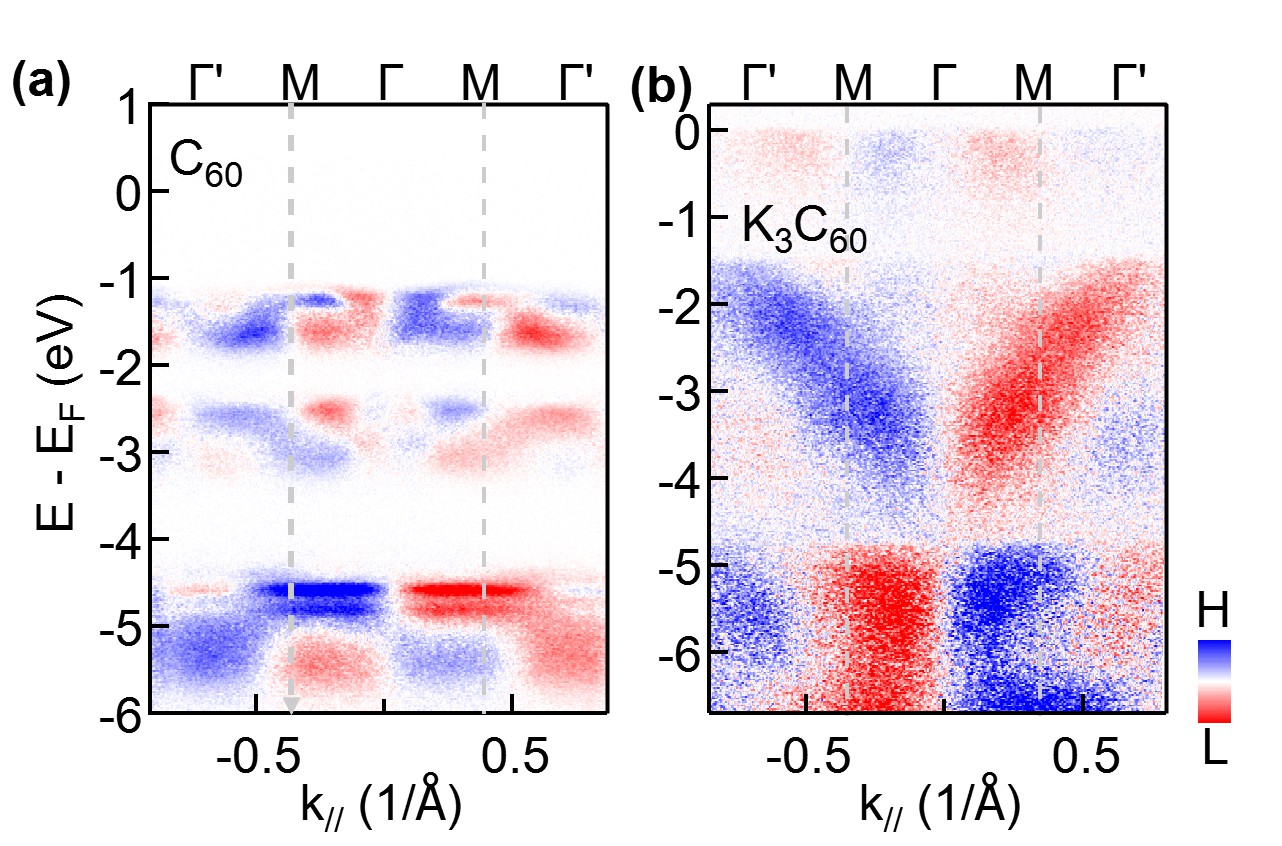
Figure S4 shows the raw ARPES data on a larger energy scale than in the 2nd derivative data of Fig. 3(a). The linear dispersion is better visible in the close-up in (b, c), where one branch at the side points is also present at . The bands are hole-like but have a qualitatively different dispersion than that reported in Ref. Yang et al. (2003) for K3C60 on a Ag(111) substrate, as evident in the comparison of (c). The latter data were taken on a single ML, even though the role of thickness in shaping the dispersion was not addressed. Extracting the Fermi velocity for the two cases we find ms-1 for K3C60 in Ref. Yang et al. (2003) vs. ms-1 in the present study.
II.6 Ruling out the presence of Dirac states from the substrate
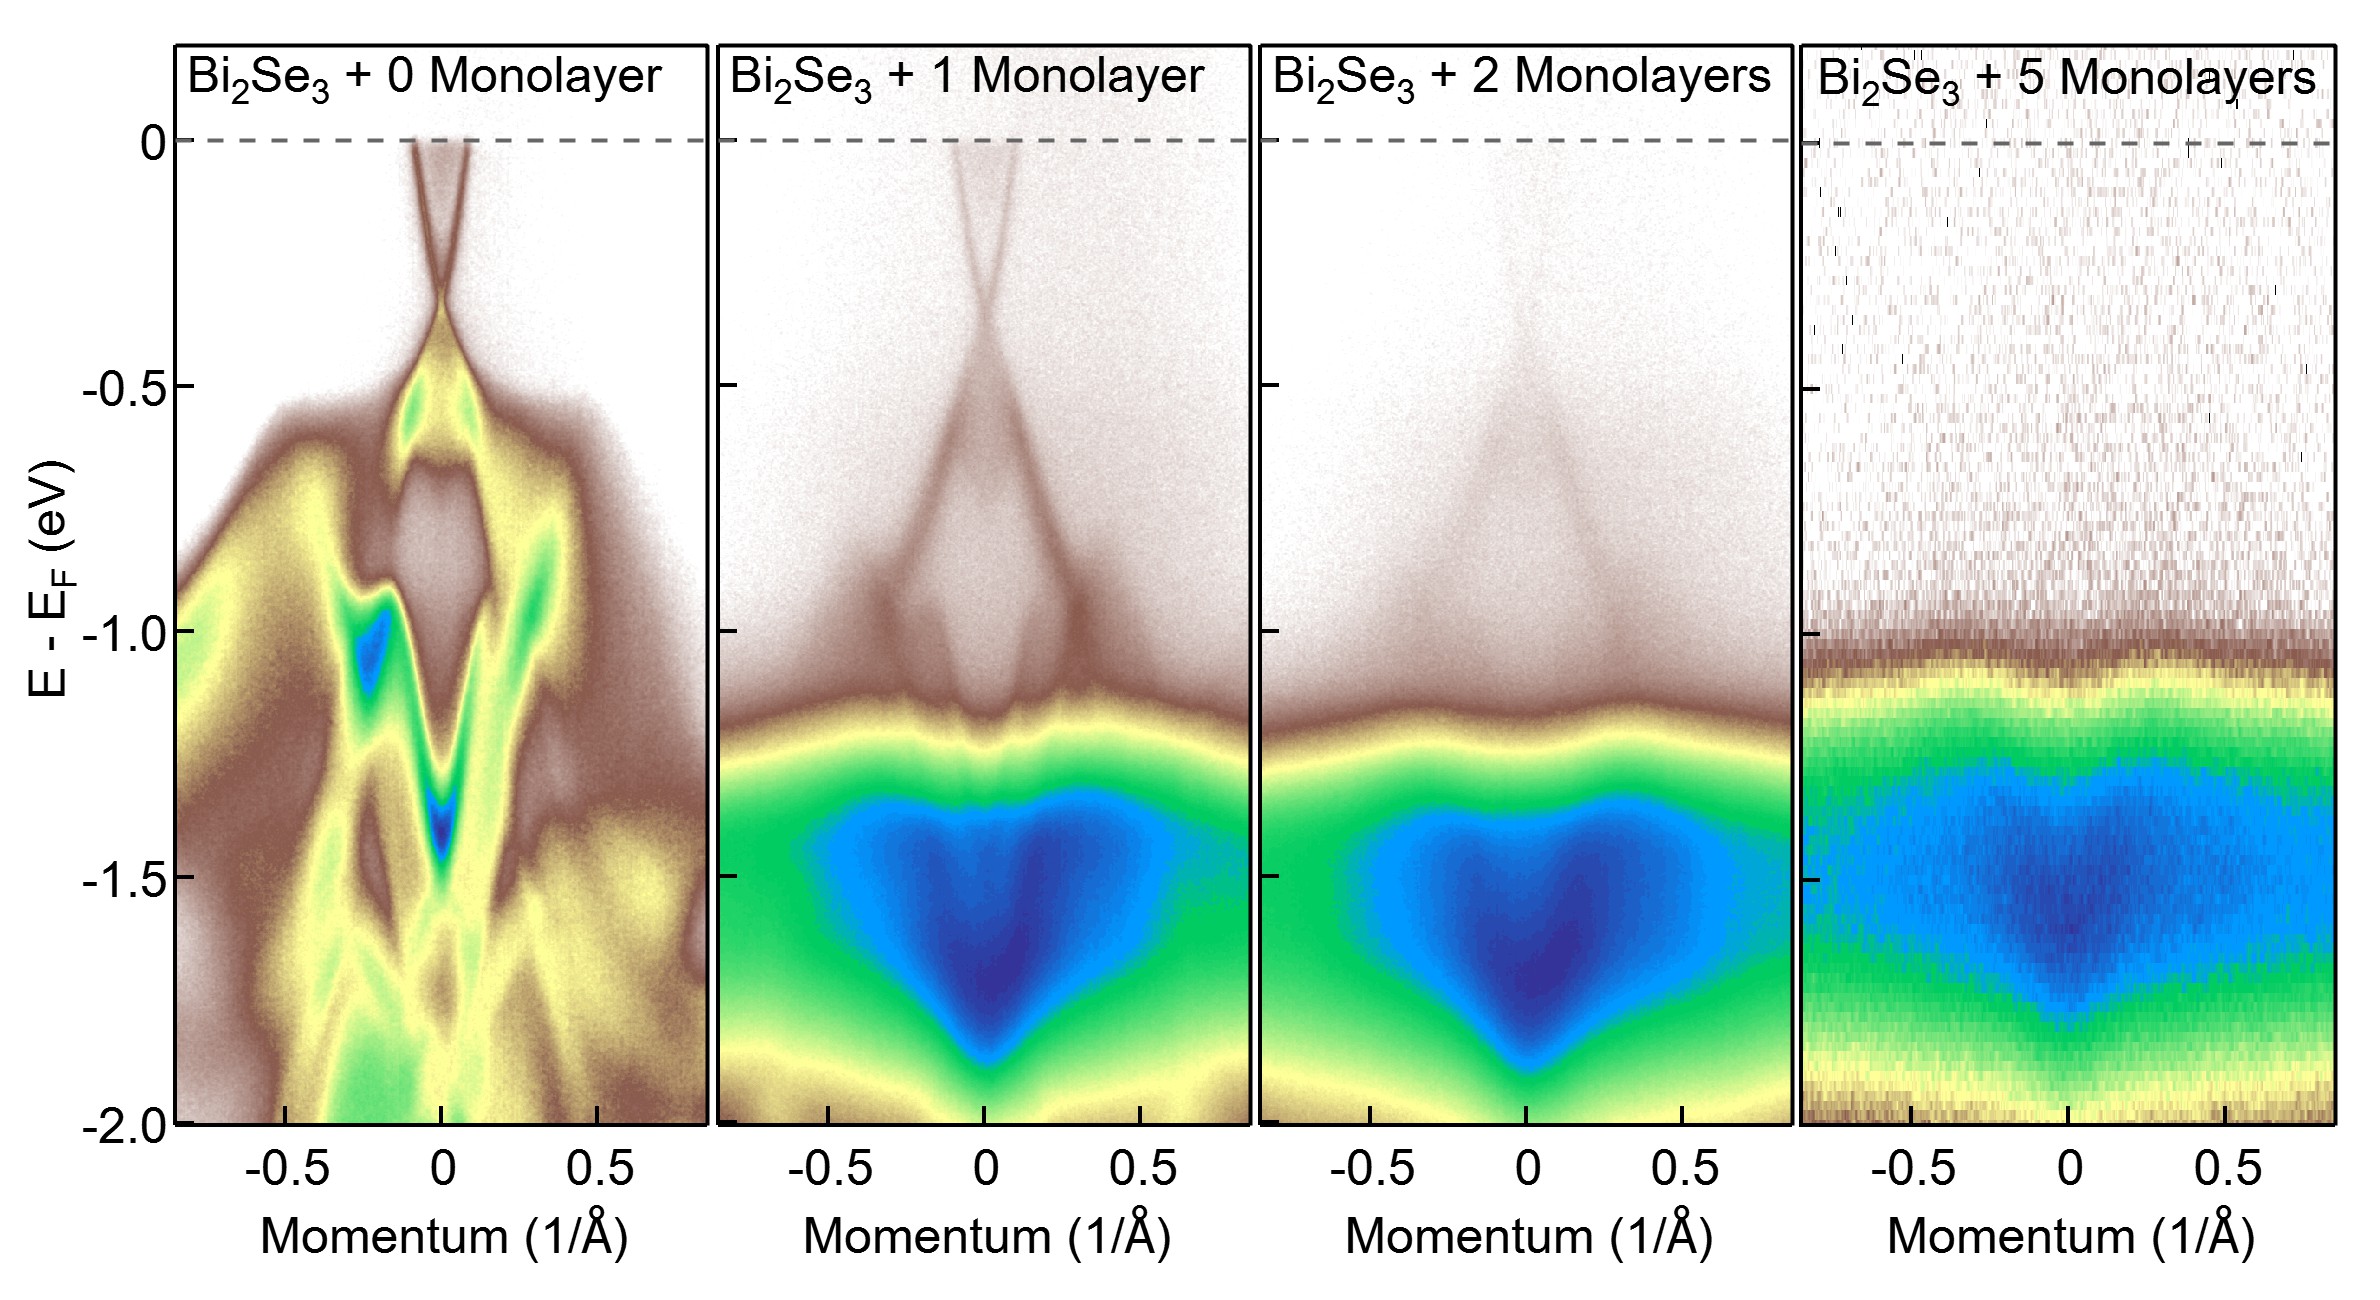
Figure S5 shows the Dirac cone of Bi2Se3 as its intensity fades upon increasing thickness of the C60 film. Note that the crossing is in the occupied states at a very different energy than the one extracted for K3C60, and that the Dirac cone is completely suppressed for a thickness of 3 MLs, lower than the 5 MLs of the films studied here. Therefore the possibility that the low energy states would originate from the substrate can be ruled out.
II.7 Crystal structure and in-gap band velocity
Comparing the lattice constants of C60 and Bi2Se3 we find that 3 times the C60 intermolecular distance is equivalent to 7 times the in-plane Se-Se distance for Bi2Se3 (Fig. S6(a). This is consistent with the LEED pattern shown in Fig. S6(b) and with the ratio of the distances between the center and the reciprocal lattice points. Such reconstruction would mean for the C60 films a 3.4 compression compared to the bulk value. This value is well within the range of the compressions/expansions observed on other substrates (see Table S1) and therefore we consider this a reasonable assumption for an epitaxially grown film.
As mentioned in main manuscript, the band velocity increases with increasing doping. Here we plot second derivative data taken along the momentum direction in the doping range , and extract the band velocity as . We do so assuming a linear dispersion for consistency across the doping range in Fig. S6(c) to simplify the comparison, even tough the dispersion appearing linear at low doping levels is an artifact of the derivative along the momentum axis. Note that, as reported in numerous instances, the second derivative data are more reliable for highly dispersive features when the derivative is applied along the momentum direction, and viceversa for bands with small dispersion when the derivative is applied along the energy axis. The results plotted in Fig. S6(d), along with an upward energy shift for increasing doping, clearly show an increase of the band velocity, and in particular a rather sudden jump, with a % change, at x3, where correlations and superconductivity develop.
II.8 Circular dichroism of HOMO/HOMO-1 states
As mentioned in the main text, the change in orbital character is also consistent with the circular dichroism (CD) signal from the HOMO/HOMO-1 states. In K3C60 (Fig. S7(b)) a single CD texture spans the whole bandwidth, supporting that the dispersion is associated with a single band, as opposed to undoped C60 (Fig. S7(a)), where the HOMO and HOMO-1 bands exhibit a clearly distinct CD signal Latzke et al. (2019a). Note that the transition to delocalized states can be also indirectly inferred from the ARPES matrix elements of Fig. 3(b): in K3C60 they nearly suppress the band maximum in the first BZ, yielding an apparent periodicity twice as large as the one of the unit cell, while the intensity distribution in C60 is fairly even within the first two BZs.
II.9 C60 growth on different substrates
C60 has been successfully grown on a number of substrates. In comparison with atomic crystals, for which films typically relax if exposed to values of epitaxial strain larger than 2-3%, molecular crystals are more malleable and can be expanded or compressed by more than 5%. Table S1 shows a list of the reconstructions reported so far on different substrates. In three cases the band structure was mapped by ARPES, with differing results: on Ag(111) the low energy states are hole-like Yang et al. (2003), on Ag(100) they are electron-like Brouet et al. (2004), and same on Cu(111) but with a very different dispersion Pai et al. (2010). In this last case, as noted in the main text, we believe that the observed bands are due to an interface state.
Naively one would expect lattice compression to favor metallicity via an increase of the bandwitdh , yet no obvious trend can be pointed out based on these sparse results since the effect on of the different reconstructions cannot be easily estimated. Note also that, out of the list in Table S1, only Refs. Yang et al. (2003), Li et al. (2009a) and Schull and Berndt (2007) are on monolayer-thick films. Whereas Ref. Yang et al. (2003) finds a more standard superstructure on Ag(111), confirmed later also in Ref. Li et al. (2009b), Ref. Li et al. (2009a) reports on Pb(111) a large unit cell with a moiré wavelength of 34Å aligned with the C60 lattice, and another of 46Å with a twist angle of 11∘, and Ref. Schull and Berndt (2007) finds Å on Au(111) and a rotational mismatch of 14.5∘. Based on the numerous reconstructions reported for thicker films it appears that the potential of fullerides for fabricating moiré heterostructures remains largely unexploited.
| substrate | Ag(111) | Al(111) | Pt(111) | Pb(111) | Au(111) | |||
| structure | HOC | |||||||
| intermolecular distance (Å) | 10.01 | 9.91 | 10.005 | 10.0 | 9.99 | |||
| expansion(+)/compression(-) | 1.1% | -0.1% | 1.1% | 1.0% | -0.9% | |||
| reference | Yang et al. (2003) | Stengel et al. (2003) | Felici et al. (2005) | Li et al. (2009a) | Altman and Colton (1993) | |||
| substrate | Cu(111) | Graphite | Si(111) | Si(100) | GaAs(001) | Au(111) | ||
| structure |
|
Unknown | ||||||
| intermolecular distance (Å) | 9.654 10.224 | 10.5 | unknown | 10.4 | 10.20 | 10.02 | ||
| expansion(+)/compression(-) | -2.5 3.3% | 6.1% | unknown | 5.1% | 3.0% | 1.2% | ||
| reference | Pai et al. (2004) | Li (1999) | Aversa et al. (2015) | Hashizume et al. (1992) | Xue et al. (1996) | Schull and Berndt (2007) | ||
| substrate | Pt(111) | Cd(0001) | Cu(111) | Ag(100) | Bi2Se3(0001) | |||
| structure | Unknown | c() | ||||||
| intermolecular distance (Å) | 9.5 | 10.5 | 10.2 | 10.42/11.56 (not hex) | 9.66 | |||
| expansion(+)/compression(-) | -4.0% | 6.1% | 3.0% | 4.2/5.6% | -3.4% | |||
| reference | Shi et al. (2011) | Wang et al. (2021) | Hashizume and Sakurai (1996) | Brouet et al. (2004) | This work | |||
References
- Kiguchi et al. (2003) M. Kiguchi, K.-i. Iizumi, K. Saiki, and A. Koma, Applied surface science 212, 101 (2003).
- Wang and Cheng (2004) L.-L. Wang and H.-P. Cheng, Physical Review B 69, 045404 (2004).
- Kim et al. (2015) K. Kim, T. H. Lee, E. J. G. Santos, P. S. Jo, A. Salleo, Y. Nishi, and Z. Bao, ACS Nano 9, 5922 (2015), pMID: 26027690.
- Ojeda-Aristizabal et al. (2017) C. Ojeda-Aristizabal, E. J. G. Santos, S. Onishi, A. Yan, H. I. Rasool, S. Kahn, Y. Lv, D. W. Latzke, J. Velasco, M. F. Crommie, M. Sorensen, K. Gotlieb, C.-Y. Lin, K. Watanabe, T. Taniguchi, A. Lanzara, and A. Zettl, ACS Nano 11, 4686 (2017), pMID: 28437062, https://doi.org/10.1021/acsnano.7b00551 .
- Haag et al. (2020) N. Haag, D. Lüftner, F. Haag, J. Seidel, L. L. Kelly, G. Zamborlini, M. Jugovac, V. Feyer, M. Aeschlimann, P. Puschnig, M. Cinchetti, and B. Stadtmüller, Physical Review B 101, 165422 (2020).
- Cao et al. (2018a) Y. Cao, V. Fatemi, A. Demir, S. Fang, S. L. Tomarken, J. Y. Luo, J. D. Sanchez-Yamagishi, K. Watanabe, T. Taniguchi, and E. Kaxiras, Nature 556, 80 (2018a).
- Cao et al. (2018b) Y. Cao, V. Fatemi, S. Fang, K. Watanabe, T. Taniguchi, E. Kaxiras, and P. Jarillo-Herrero, Nature 556, 43 (2018b).
- Ugeda et al. (2014) M. M. Ugeda, A. J. Bradley, S.-F. Shi, H. Felipe, Y. Zhang, D. Y. Qiu, W. Ruan, S.-K. Mo, Z. Hussain, Z.-X. Shen, et al., Nature materials 13, 1091 (2014).
- Wang et al. (2020a) L. Wang, E.-M. Shih, A. Ghiotto, L. Xian, D. A. Rhodes, C. Tan, M. Claassen, D. M. Kennes, Y. Bai, B. Kim, K. Watanabe, T. Taniguchi, X. Zhu, J. Hone, A. Rubio, A. N. Pasupathy, and C. R. Dean, Nature Materials 19, 861 (2020a).
- Xu et al. (2021) Y. Xu, C. Horn, J. Zhu, Y. Tang, L. Ma, L. Li, S. Liu, K. Watanabe, T. Taniguchi, J. C. Hone, J. Shan, and K. F. Mak, Nature Materials 20, 645 (2021).
- (11) Materials and methods are available as supplementary materials.
- Latzke et al. (2019a) D. W. Latzke, C. Ojeda-Aristizabal, J. D. Denlinger, R. Reno, A. Zettl, and A. Lanzara, ACS Nano 13, 12710 (2019a).
- Gunnarsson (1997) O. Gunnarsson, Reviews of modern physics 69, 575 (1997).
- Capone et al. (2009) M. Capone, M. Fabrizio, C. Castellani, and E. Tosatti, Reviews of Modern Physics 81, 943 (2009).
- Takabayashi and Prassides (2016) Y. Takabayashi and K. Prassides, Philosophical Transactions of the Royal Society A: Mathematical, Physical and Engineering Sciences 374, 20150320 (2016).
- Capone et al. (2002) M. Capone, M. Fabrizio, C. Castellani, and E. Tosatti, Science 296, 2364 (2002).
- Durand et al. (2003) P. Durand, G. R. Darling, Y. Dubitsky, A. Zaopo, and M. J. Rosseinsky, Nature Materials 2, 605 (2003).
- Manini and Tosatti (2006) N. Manini and E. Tosatti, arXiv preprint cond-mat/0602134 (2006).
- Steglich and Wirth (2016) F. Steglich and S. Wirth, Reports on Progress in Physics 79, 084502 (2016).
- Yamamoto (2021) H. M. Yamamoto, Bulletin of the Chemical Society of Japan 94, 2505 (2021).
- Chen et al. (1991) C. Chen, L. Tjeng, P. Rudolf, G. Meigs, J. Rowe, J. Chen, J. McCauley, A. Smith, A. McGhie, and W. Romanow, Nature 352, 603 (1991).
- Merkel et al. (1993) M. Merkel, M. Knupfer, M. Golden, J. Fink, R. Seemann, and R. Johnson, Physical Review B 47, 11470 (1993).
- Wertheim and Buchanan (1993) G. Wertheim and D. Buchanan, Physical Review B 47, 12912 (1993).
- McChesney et al. (2010) J. L. McChesney, A. Bostwick, T. Ohta, T. Seyller, K. Horn, J. González, and E. Rotenberg, Physical Review Letters 104, 136803 (2010).
- Hwang et al. (2012) C. Hwang, D. A. Siegel, S.-K. Mo, W. Regan, A. Ismach, Y. Zhang, A. Zettl, and A. Lanzara, Scientific Reports 2 (2012), 10.1038/srep00590.
- Kawasaki et al. (2013) S. Kawasaki, J. Fukui, T. Motoyama, Y. Suzuki, S. Shibasaki, and G. qing Zheng, Journal of the Physical Society of Japan 82, 014709 (2013).
- Brouet et al. (2006) V. Brouet, W. Yang, X. Zhou, Z. Hussain, and Z. Shen, Journal of Physics and Chemistry of Solids 67, 218 (2006).
- Hesper et al. (2000) R. Hesper, L. Tjeng, A. Heeres, and G. Sawatzky, Physical Review B 62, 16046 (2000).
- Yang et al. (2003) W. Yang, V. Brouet, X. Zhou, H. J. Choi, S. G. Louie, M. L. Cohen, S. Kellar, P. Bogdanov, A. Lanzara, and A. Goldoni, Science 300, 303 (2003).
- Brouet et al. (2004) V. Brouet, W. Yang, X. Zhou, H. Choi, S. Louie, M. Cohen, A. Goldoni, F. Parmigiani, Z. Hussain, and Z. Shen, Physical review letters 93, 197601 (2004).
- Pai et al. (2010) W. W. Pai, H. Jeng, C.-M. Cheng, C.-H. Lin, X. Xiao, A. Zhao, X. Zhang, G. Xu, X. Shi, and M. Van Hove, Physical Review Letters 104, 036103 (2010).
- Latzke et al. (2019b) D. W. Latzke, C. Ojeda-Aristizabal, S. M. Griffin, J. D. Denlinger, J. B. Neaton, A. Zettl, and A. Lanzara, Physical Review B 99, 045425 (2019b).
- Stephens et al. (1991) P. W. Stephens, L. Mihaly, P. L. Lee, R. L. Whetten, S.-M. Huang, R. Kaner, F. Deiderich, and K. Holczer, Nature 351, 632 (1991).
- Martins and Troullier (1992) J. L. Martins and N. Troullier, Physical Review B 46, 1766 (1992).
- Zhu et al. (1995) Q. Zhu, D. E. Cox, and J. E. Fischer, Physical Review B 51, 3966 (1995).
- Oszlányi et al. (1995) G. Oszlányi, G. Bortel, G. Faigel, M. Tegze, L. Gránásy, S. Pekker, P. W. Stephens, G. Bendele, R. Dinnebier, G. Mihály, A. Jánossy, O. Chauvet, and L. Forró, Physical Review B 51, 12228 (1995).
- Pichler et al. (1997) T. Pichler, M. Knupfer, M. S. Golden, S. Haffner, R. Friedlein, J. Fink, W. Andreoni, A. Curioni, M. Keshavarz-K, C. Bellavia-Lund, A. Sastre, J.-C. Hummelen, and F. Wudl, Physical Review Letters 78, 4249 (1997).
- Macovez et al. (2007) R. Macovez, P. Rudolf, I. Marenne, L. Kjeldgaard, P. A. Brühwiler, T. Pichler, P. Vilmercati, R. Larciprete, L. Petaccia, G. Bertoni, and A. Goldoni, Physical Review B 75, 195424 (2007).
- Konarev et al. (2010) D. Konarev, S. Khasanov, A. Otsuka, M. Maesato, G. Saito, and R. Lyubovskaya, Angewandte Chemie International Edition 49, 4829 (2010).
- Erwin and Pickett (1991) S. C. Erwin and W. E. Pickett, Science 254, 842 (1991).
- Gunnarsson et al. (1996) O. Gunnarsson, E. Koch, and R. M. Martin, Physical Review B 54, R11026 (1996).
- Han et al. (2000) J. E. Han, E. Koch, and O. Gunnarsson, Phys. Rev. Lett. 84, 1276 (2000).
- Satpathy et al. (1992) S. Satpathy, V. P. Antropov, O. K. Andersen, O. Jepsen, O. Gunnarsson, and A. I. Liechtenstein, Physical Review B 46, 1773 (1992).
- Wang et al. (2020b) Y. Wang, Y. He, K. Wohlfeld, M. Hashimoto, E. W. Huang, D. Lu, S.-K. Mo, S. Komiya, C. Jia, B. Moritz, Z.-X. Shen, and T. P. Devereaux, Communications Physics 3 (2020b), 10.1038/s42005-020-00480-5.
- Castro Neto et al. (2009) A. H. Castro Neto, F. Guinea, N. M. R. Peres, K. S. Novoselov, and A. K. Geim, Rev. Mod. Phys. 81, 109 (2009).
- Xia et al. (2009) Y. Xia, D. Qian, D. Hsieh, L. Wray, A. Pal, H. Lin, A. Bansil, D. Grauer, Y. S. Hor, R. J. Cava, et al., Nature physics 5, 398 (2009).
- König et al. (2007) M. König, S. Wiedmann, C. Brüne, A. Roth, H. Buhmann, L. W. Molenkamp, X.-L. Qi, and S.-C. Zhang, Science 318, 766 (2007).
- Zhang et al. (2018) P. Zhang, K. Yaji, T. Hashimoto, Y. Ota, T. Kondo, K. Okazaki, Z. Wang, J. Wen, G. D. Gu, H. Ding, and S. Shin, Science 360, 182 (2018).
- Borisenko et al. (2014) S. Borisenko, Q. Gibson, D. Evtushinsky, V. Zabolotnyy, B. Büchner, and R. J. Cava, Physical review letters 113, 027603 (2014).
- Neupane et al. (2014) M. Neupane, S.-Y. Xu, R. Sankar, N. Alidoust, G. Bian, C. Liu, I. Belopolski, T.-R. Chang, H.-T. Jeng, H. Lin, et al., Nature communications 5, 1 (2014).
- Liu et al. (2014) Z. K. Liu, B. Zhou, Y. Zhang, Z. J. Wang, H. M. Weng, D. Prabhakaran, S.-K. Mo, Z. X. Shen, Z. Fang, X. Dai, Z. Hussain, and Y. L. Chen, Science 343, 864 (2014).
- Ren et al. (2020) M.-Q. Ren, S. Han, S.-Z. Wang, J.-Q. Fan, C.-L. Song, X.-C. Ma, and Q.-K. Xue, Physical Review Letters 124 (2020), 10.1103/physrevlett.124.187001.
- Zhou et al. (2006) S. Zhou, G.-H. Gweon, J. Graf, A. Fedorov, C. Spataru, R. Diehl, Y. Kopelevich, D.-H. Lee, S. G. Louie, and A. Lanzara, Nature physics 2, 595 (2006).
- (54) Due to the completely different fermiology, it is our best guess that the band structure reported for doped C60 on Cu(111) in Ref. 29 be due to an interface state and largely unrelated to the K3C60 physics discussed here.
- Lof et al. (1992) R. W. Lof, M. A. van Veenendaal, B. Koopmans, H. T. Jonkman, and G. A. Sawatzky, Physical Review Letters 68, 3924 (1992).
- Hou et al. (2022) L. Hou, X. Cui, B. Guan, S. Wang, R. Li, Y. Liu, D. Zhu, and J. Zheng, Nature 606, 507 (2022).
- Meirzadeh et al. (2023) E. Meirzadeh, A. M. Evans, M. Rezaee, M. Milich, C. J. Dionne, T. P. Darlington, S. T. Bao, A. K. Bartholomew, T. Handa, D. J. Rizzo, R. A. Wiscons, M. Reza, A. Zangiabadi, N. Fardian-Melamed, A. C. Crowther, P. J. Schuck, D. N. Basov, X. Zhu, A. Giri, P. E. Hopkins, P. Kim, M. L. Steigerwald, J. Yang, C. Nuckolls, and X. Roy, Nature 613, 71 (2023).
- Hasegawa et al. (1998a) S. Hasegawa, T. Miyamae, K. Yakushi, H. Inokuchi, K. Seki, and N. Ueno, Physical Review B 58, 4927 (1998a).
- Kumar et al. (2009) A. Kumar, A. Podhorodecki, J. Misiewicz, D. K. Avasthi, and J. C. Pivin, Journal of Applied Physics 105, 024314 (2009).
- Hasegawa et al. (1998b) S. Hasegawa, T. Miyamae, K. Yakushi, H. Inokuchi, K. Seki, and N. Ueno, Phys. Rev. B 58, 4927 (1998b).
- Rüdel et al. (2002) A. Rüdel, R. Hentges, U. Becker, H. S. Chakraborty, M. E. Madjet, and J. M. Rost, Phys. Rev. Lett. 89, 125503 (2002).
- Wang et al. (2008) X.-X. Wang, Y.-B. Xu, H.-N. Li, W.-H. Zhang, and F.-Q. Xu, Journal of Electron Spectroscopy and Related Phenomena 165, 20 (2008).
- Toffoli et al. (2011) D. Toffoli, M. Stener, G. Fronzoni, and P. Decleva, Chemical Physics Letters 516, 154 (2011).
- Li et al. (2009a) H. I. Li, K. J. Franke, J. I. Pascual, L. W. Bruch, and R. D. Diehl, Phys. Rev. B 80, 085415 (2009a).
- Schull and Berndt (2007) G. Schull and R. Berndt, Phys. Rev. Lett. 99, 226105 (2007).
- Li et al. (2009b) H. I. Li, K. Pussi, K. J. Hanna, L.-L. Wang, D. D. Johnson, H.-P. Cheng, H. Shin, S. Curtarolo, W. Moritz, J. A. Smerdon, R. McGrath, and R. D. Diehl, Phys. Rev. Lett. 103, 056101 (2009b).
- Stengel et al. (2003) M. Stengel, A. D. Vita, and A. Baldereschi, Phys. Rev. Lett. 91, 166101 (2003).
- Felici et al. (2005) R. Felici, M. Pedio, F. Borgatti, S. Iannotta, M. Capozi, G. Ciullo, and A. Stierle, Nature materials 4, 688 (2005).
- Altman and Colton (1993) E. I. Altman and R. J. Colton, Phys. Rev. B 48, 18244 (1993).
- Pai et al. (2004) W. W. Pai, C.-L. Hsu, M. C. Lin, K. C. Lin, and T. B. Tang, Phys. Rev. B 69, 125405 (2004).
- Li (1999) Z. Li, Surface Science 441, 366 (1999).
- Aversa et al. (2015) L. Aversa, S. Taioli, M. V. Nardi, R. Tatti, R. Verucchi, and S. Iannotta, Frontiers in Materials 2, 46 (2015).
- Hashizume et al. (1992) T. Hashizume, X.-D. Wang, Y. Nishina, H. Shinohara, Y. Saito, Y. Kuk, and T. Sakurai, Japanese Journal of Applied Physics 31, L880 (1992).
- Xue et al. (1996) Q. Xue, T. Ogino, Y. Hasegawa, H. Shinohara, and T. Sakurai, Phys. Rev. B 53, 1985 (1996).
- Shi et al. (2011) X. Q. Shi, A. B. Pang, K. L. Man, R. Q. Zhang, C. Minot, M. S. Altman, and M. A. Van Hove, Phys. Rev. B 84, 235406 (2011).
- Wang et al. (2021) Z. Wang, M. Tao, D. Yang, Z. Li, M. Shi, K. Sun, J. Yang, and J. Wang, International Journal of Molecular Sciences 22, 6880 (2021).
- Hashizume and Sakurai (1996) T. Hashizume and T. Sakurai, Surface Review and Letters 03, 905 (1996).