The Host Galaxy of FRB 20171020A Revisited
Abstract
The putative host galaxy of FRB 20171020A was first identified as ESO 601-G036 in 2018, but as no repeat bursts have been detected, direct confirmation of the host remains elusive. In light of recent developments in the field, we re-examine this host and determine a new association confidence level of 98%. At 37 Mpc, this makes ESO 601-G036 the third closest FRB host galaxy to be identified to date and the closest to host an apparently non-repeating FRB (with an estimated repetition rate limit of bursts per day above erg). Due to its close distance, we are able to perform detailed multi-wavelength analysis on the ESO 601-G036 system. Follow-up observations confirm ESO 601-G036 to be a typical star-forming galaxy with H i and stellar masses of and , and a star formation rate of . We detect, for the first time, a diffuse gaseous tail () extending to the south-west that suggests recent interactions, likely with the confirmed nearby companion ESO 601-G037. ESO 601-G037 is a stellar shred located to the south of ESO 601-G036 that has an arc-like morphology, is about an order of magnitude less massive, and has a lower gas metallicity that is indicative of a younger stellar population. The properties of the ESO 601-G036 system indicate an ongoing minor merger event, which is affecting the overall gaseous component of the system and the stars within ESO 601-G037. Such activity is consistent with current FRB progenitor models involving magnetars and the signs of recent interactions in other nearby FRB host galaxies.
keywords:
fast radio bursts; galaxies: individual: ESO 601-G036; galaxies: interactionsCSIRO Space and Astronomy, P.O. Box 1130, Bentley WA 6102, Australia \alsoaffiliationInternational Centre for Radio Astronomy Research, Curtin University, Bentley, WA 6102, Australia \alsoaffiliationAstronomy, Astrophysics and Astrophotonics Research Centre, Macquarie University, Sydney, NSW 2109, Australia \alsoaffiliationSchool of Science, Western Sydney University, Locked Bag 1797, Penrith, NSW 2751, Australia \alsoaffiliationAstronomy, Astrophysics and Astrophotonics Research Centre, Macquarie University, Sydney, NSW 2109, Australia \alsoaffiliationCSIRO Space and Astronomy, Australia Telescope National Facility, P.O. Box 76, Epping, NSW 1710, Australia \alsoaffiliationARC Centre of Excellence for All Sky Astrophysics in 3 Dimensions (ASTRO 3D) \alsoaffiliationCSIRO Space and Astronomy, Australia Telescope National Facility, P.O. Box 76, Epping, NSW 1710, Australia \alsoaffiliationARC Centre of Excellence for All Sky Astrophysics in 3 Dimensions (ASTRO 3D) \alsoaffiliationARC Centre of Excellence for Gravitational Wave Discovery (OzGrav) \publisheddd Mmm YYYY
1 Introduction
Fast radio bursts (FRBs) are currently one of the most tantalising mysteries in astrophysics as they are particularly peculiar events arising from unknown origins. FRBs manifest themselves as extremely luminous (brightness temperature K) millisecond-duration radio pulses characterised by integrated electron column density contributions (as traced by the dispersion measure; DM) well in excess of the Galactic contribution along the line-of-sight (Thornton et al., 2013). Since their discovery by the Parkes 64m Murriyang radio-telescope by Lorimer et al. (2007), over 600 FRBs have been detected with numerous instruments (Petroff et al., 2022). With wide field-of-view and sensitive searches for FRBs ongoing, e.g. with the Australian Square Kilometer Array Pathfinder (ASKAP; Shannon et al., 2018), the Canadian Hydrogen Intensity Mapping Experiment (CHIME; CHIME/FRB Collaboration et al., 2021), MeerKAT (Rajwade et al., 2022), and the Deep Synoptic Array (DSA; Ravi et al., 2023), there will be a significant increase in the number of detected FRB events in future years.
The ms duration of FRBs places upper limits on their emission regions to 30–3000 km in size, allowing for smearing due to scattering and detector time resolution. A multitude of progenitor models have been proposed to explain the mechanism(s) to produce FRBs (Platts et al., 2019). Leading models invoke highly magnetised neutron stars (i.e. magnetars) that result from the core-collapse of massive stars, which is strongly supported by the association of the Galactic FRB-like source FRB 20200428 with the magnetar SGR 1935+2154 (Bochenek et al., 2020; CHIME/FRB Collaboration et al., 2020). The association of particularly active repeating FRBs with star-forming regions or persistent radio sources (Chatterjee et al., 2017; Marcote et al., 2020; Niu et al., 2022) is further evidence. The recent localisation of the repeating FRB 20200120E to a globular cluster in the M81 galactic system (Kirsten et al., 2022) challenges this scenario; nevertheless, it has been hypothesised that magnetars can also form from the accretion-induced collapse of a white dwarf or merger of compact stars in a binary system (Duncan & Thompson, 1992; Rosswog et al., 2003; Tauris et al., 2013).
Localisation of FRBs to host galaxies is also crucial for investigating other potential progenitor avenues through exploration of global properties and the general host galaxy population. Studies thus far have identified a wide diversity in current FRB host galaxies suggesting that the broader population of FRBs can arise from both young and (moderately) old progenitors (Bhandari et al., 2020; Heintz et al., 2020; Mannings et al., 2021; Bhandari et al., 2022). Detailed studies of these hosts, especially using multi-wavelength observations to fully characterise properties of the galaxy and its environment, would help in understanding the origin of FRBs. However, most FRB host galaxies are too distant to enable such analysis. Some nearby detections have provided useful upper limits on FRB counterparts at X-ray (Mereghetti et al., 2021) or optical wavelengths (Andreoni et al., 2020).
A small number of very nearby FRB host galaxies have been the subject of detailed radio wavelength investigations. Neutral hydrogen (H i) analysis by Michałowski (2021) of three galaxies — NGC 3252, M81, and the Milky Way — connects FRBs to recent enhancement of star formation due to galactic interactions. Kaur et al. (2022) come to a similar conclusion about the H i-rich host galaxy of FRB 20180916B, which appears to be involved in a recent minor merger (when a low-mass satellite galaxy merges with its host galaxy). Looking at the molecular gas of the host of FRB 20180924B, Hsu et al. (2023) report a disturbed kinetic gas structure in the galaxy. In these aforementioned systems, all five FRB host galaxies have highly asymmetric emission line spectra, linking FRB progenitors to recent galaxy interaction events. However, recent work by Glowacki et al. (2023), finds the H i in the host galaxy of FRB 20211127I to be relatively undisturbed. With only a handful of current examples, detailed analysis of the gas in and around FRB host galaxies is still an emerging topic. As such, additions to the sample size are required to draw better conclusions about FRB progenitors.
Shannon et al. (2018) presented the discovery of 20 FRBs in a fly’s eye survey conducted at a Galactic latitude of carried out as part of the Commensal Real-time ASKAP Fast Transients (CRAFT: Macquart et al., 2010) survey on ASKAP. Here we focus on one event from that survey, FRB 20171020A. Given the low DM of 114 pc cm-3, Mahony et al. (2018, hereafter M18) found ESO 601-G036 — an Sc galaxy located at RA 22:15:24.75, Dec -19:35:07.0 (J2000) — to be the most probable host galaxy candidate given its low redshift, , corresponding to a central velocity of 2584 measured from H i emission detected in the H i Parkes All Sky Survey (HIPASS; Meyer et al., 2004) and its position close to the center of the error ellipse, according to ASKAP’s beam. da Costa et al. (1998) found a comparable optical radial velocity for ESO 601-G036 of 2539 . Using the Mould et al. (2000) model, the distance to this galaxy is 37 Mpc. ESO 601-G036 contains no compact, persistent radio continuum source while ultraviolet (UV) imaging from GALEX (Martin et al., 2005) and spectroscopic observations reveal a low metallicity with a star formation rate (SFR) of (M18). A nearby stellar shred, ESO 601-G037, can be detected in the GALEX images and was treated by M18 as part of the ESO 601-G036 system.
At the time of the M18 analysis, the only FRB localised to its host galaxy was the first known repeater, FRB 20121102A in a dwarf galaxy (Tendulkar et al., 2017). Since then, more than two dozen FRBs have been localised to arcsecond-level precision, the majority of these by CRAFT (Shannon et al. 2023, in prep.) and showing no repeat bursts.
In this paper, we re-examine the case for ESO 601-G036 being the host galaxy of FRB 20171020A in light of improvements in the localisation algorithm, and present detailed multi-wavelength follow-up observations of ESO 601-G036 that help to constrain the nature of FRB host galaxies in general. This analysis is especially pertinent since, despite the plethora of new discoveries, ESO 601-G036 is potentially the third closest FRB host galaxy to be identified, after M81 (Bhardwaj et al., 2021b) and NGC 3252 (Bhardwaj et al., 2021a) and the closest system to host a non-repeating FRB. In Section 2, we demonstrate our improved probabilistic association of this FRB to its host galaxy and further support this association by calculating the most probable redshift for this event from the FRB’s properties. We present our multi-wavelength follow-up of the host galaxy in Section 3. In Section 4, we discuss the implications of the host galaxy properties on FRB progenitor models.
2 New constraints on the host galaxy of FRB 20171020A
2.1 Improved localisation of FRB 20171020A
The localisation region of FRB 20171020A presented in M18 was based on signal-to-noise ratio (SNR) measurements of the detection in adjacent ASKAP beams. A Bayesian algorithm, with flat priors on Right Ascension and Declination, and a prior on fluence (i.e. flat in log-space), was used to find posterior probabilities for the FRB arrival direction as per the method in Shannon et al. (2018). The results were then fitted with an elliptical function to obtain characteristic localisation bounds.
Here we present two updates to this method. Firstly, the FRB fluence distribution is now known to closely follow a Euclidean distribution, (James et al., 2019), arguing for a steeper prior on . However, such a prior is agnostic of DM, which is a proxy for distance, and the result is obtained by only averaging over distance. For FRBs constrained to a certain distance range (e.g. through DM cuts), the distribution of will approach that of the intrinsic FRB luminosity function, which is flatter — at least until any cutoff due to a maximum FRB energy. Such a result has been found recently by the CHIME/FRB Collaboration et al. (2021). We therefore use a prior on of , where is the differential power-law slope of the FRB luminosity function from James et al. (2022a). Secondly, we present results without the elliptical fit, i.e. using the full Bayesian posterior map, as shown in Figure 1. From this map, we define a localisation probability , where C.L. is the confidence limit at which the FRB is found (thus an FRB on the contour has ).
The effect of our updated prior on is that intrinsically dimmer FRBs are preferred, making it less likely that FRB 20171020A was observed far from the beam centre. This shifts the localisation region some 20′ to the south-west and emphasises the importance of the choice of prior in FRB localisations. The resulting 68% confidence region is well-fit by an ellipse, centred at RA = , Dec = (J2000), with semi-major axis oriented east from north, and semi-minor axis .
We therefore update the list of candidate host galaxies from M18 to include all those within the localisation and (the maximum redshift considered in M18). Using the NASA/IPAC Extragalactic Database (NED), we find five galaxies matching these criteria. Searching WISE SCOSPZ (Bilicki et al., 2016), which is deeper than NED and limited primarily by SuperCOSMOS completeness to optical magnitudes and , there are 32 such galaxies, including five co-located with those listed in NED. Two of these, however, are located at small “islands” of probability almost one degree to the north-east due to fluctuations in the MCMC fitting and are discounted. The remaining 30 candidates are listed in Table 1. While the most likely candidate, ESO 601-G036, is displaced to the contour, we note that the only other candidate host galaxy discussed by M18, WISEJ221621.59-191829.9 at z=0.024, is now excluded from the 3-sigma localisation region. As this method of localisation is not enough to uniquely identify a candidate galaxy, we proceed to consider other factors.
| Rank | Galaxy | z | Other designations | |||||||
|---|---|---|---|---|---|---|---|---|---|---|
| (1) | (2) | (3) | (4) | (5) | (6) | (7) | (8) | (9) | (10) | (11) |
| 1 | J221524.61-193504.8 | 0.046 | 0.00867 | 0.560 | 0.068 | 0.970 | 14.97 | 0.42 | 0.9845 | ESO 601-G036 |
| 2 | J221427.49-200156.0 | 0.072 | 0.047 | 0.049 | 1.772 | 0.003 | 18.36 | 0.01 | 0.0052 | |
| 3 | J221430.33-200013.6 | 0.088 | 0.049 | 0.037 | 2.343 | 0.002 | 17.55 | 0.02 | 0.0036 | |
| 4 | J221338.59-193704.2 | 0.008 | 0.036 | 0.152 | 1.535 | 0.012 | 18.27 | 0.01 | 0.0022 | |
| 5 | J221359.13-195106.0 | 0.125 | 0.055 | 0.011 | 2.741 | 0.000 | 17.66 | 0.01 | 0.0013 | |
| 6 | J221445.43-194502.2 | 0.155 | 0.056 | 0.009 | 2.829 | 0.000 | 18.42 | 0.01 | 0.0013 | |
| 7 | J221413.69-194032.1 | 0.106 | 0.056 | 0.009 | 2.838 | 0.000 | 18.34 | 0.01 | 0.0008 | |
| 8 | J221548.31-192225.0 | 0.004 | 0.043 | 0.080 | 1.320 | 0.007 | 18.08 | 0.01 | 0.0007 | |
| 9 | J221459.58-201030.4 | 0.010 | 0.056 | 0.010 | 2.756 | 0.000 | 18.65 | 0.00 | 0.0001 | |
| 10 | J221601.96-193251.4 | 0.008 | 0.055 | 0.011 | 2.750 | 0.000 | 17.61 | 0.02 | 0.0001 | |
| 11 | J221415.90-202202.4 | 0.001 | 0.046 | 0.056 | 2.005 | 0.003 | 18.43 | 0.01 | 0.0001 | |
| 12 | J221501.93-200730.5 | 0.014 | 0.059 | 0.005 | 2.955 | 0.000 | 16.41 | 0.07 | 0.0001 | |
| 13 | J221558.63-200327.8 | 0.004 | 0.057 | 0.008 | 2.852 | 0.000 | 18.19 | 0.01 | 0.0000 | |
| 14 | J221404.53-195840.5 | 0.107 | 0.066 | 0.000 | 4.583 | 0.000 | 17.88 | 0.01 | 0.0000 | |
| 15 | J221419.92-201529.1 | 0.007 | 0.063 | 0.001 | 2.527 | 0.000 | 16.42 | 0.07 | 0.0000 | |
| 16 | J221358.74-193215.9 | 0.009 | 0.067 | 0.000 | 2.174 | 0.000 | 18.64 | 0.00 | 0.0000 | |
| 17 | J221548.77-202123.1 | 0.001 | 0.063 | 0.001 | 4.186 | 0.000 | 17.22 | 0.02 | 0.0000 | |
| 18 | J221437.97-192453.2 | 0.005 | 0.068 | 0.000 | 3.862 | 0.000 | 17.88 | 0.01 | 0.0000 | |
| 19 | J221552.85-195808.4 | 0.009 | 0.070 | 0.000 | 3.447 | 0.000 | 18.03 | 0.01 | 0.0000 | |
| 20 | J221559.40-192629.3 | 0.004 | 0.070 | 0.000 | 3.955 | 0.000 | 16.22 | 0.08 | 0.0000 | |
| 21 | J221602.01-201021.0 | 0.001 | 0.066 | 0.000 | 4.588 | 0.000 | 18.07 | 0.01 | 0.0000 | |
| 22 | J221449.49-192207.4 | 0.003 | 0.071 | 0.000 | 3.452 | 0.000 | 18.12 | 0.01 | 0.0000 | WISEA J221437.05-191904.9 |
| 23 | J221357.33-195652.7 | 0.112 | 0.077 | 0.000 | 3.322 | 0.000 | 17.60 | 0.02 | 0.0000 | |
| 24 | J221528.16-193851.9 | 0.055 | 0.076 | 0.000 | 3.306 | 0.000 | 18.45 | 0.01 | 0.0000 | |
| 25 | J221458.56-185326.8 | 0.001 | 0.070 | 0.000 | 3.441 | 0.000 | 17.39 | 0.02 | 0.0000 | |
| 26 | J221552.86-190559.2 | 0.001 | 0.072 | 0.000 | 3.721 | 0.000 | 18.52 | 0.01 | 0.0000 | |
| 27 | J221645.10-195445.7 | 0.001 | 0.071 | 0.000 | 3.763 | 0.000 | 17.65 | 0.01 | 0.0000 | |
| 28 | J221421.41-192756.0 | 0.008 | 0.076 | 0.000 | 3.311 | 0.000 | 17.71 | 0.01 | 0.0000 | |
| 29 | J221416.08-193057.8 | 0.016 | 0.077 | 0.000 | 4.403 | 0.000 | 17.83 | 0.01 | 0.0000 | |
| 30 | J221612.70-192222.1 | 0.001 | 0.076 | 0.000 | 3.309 | 0.000 | 17.47 | 0.02 | 0.0000 | |
| 31 | J221503.26-192544.4 | 0.013 | 0.079 | 0.000 | 3.211 | 0.000 | 16.77 | 0.04 | 0.0000 | WISEA J221501.14-192536.9 |
| 32 | J221618.08-194206.2 | 0.006 | 0.079 | 0.000 | 3.207 | 0.000 | 16.93 | 0.03 | 0.0000 |
2.2 Likely redshift of FRB 20171020A
The DM of an FRB is a vital clue to its likely redshift due to the baryonic content of the Universe, as demonstrated by Macquart et al. (2020). However, there is significant scatter about the “Macquart relation” between DM and — due to different host galaxy contributions and inhomogeneities in the cosmic web — leading to a broad distribution of DMs for a given redshift, . However, has a robust lower bound due to the minimum density of voids and the (at least zero) contribution from host galaxies, leading to the reciprocal having a robust upper bound. Thus, the scatter in is smaller for low DMs. This probability is also a function of the properties of the detecting instrument, the intrinsic FRB population distribution and luminosity function (James et al., 2022a), and the signal-to-noise ratio (SNR) and time-width of the burst.
For FRB 20171020A , we have accurate measurements of its DM (114.1 pc cm-3) and SNR (19.5) from Shannon et al. (2018), and a suitable limit on ( ms, effectively ; Qiu et al., 2020), but no suitably reliable estimate of the detected beam position. These values do allow us to estimate . The measured SNR is important because bright FRBs are on-average closer than dimmer ones (Shannon et al., 2018), while wider burst widths also require closer proximity to compensate for the increased noise over their duration.
We estimate using the formulation from James et al. (2022b),
where is the FRB source evolution function; is the comoving volume per solid angle per redshift interval per proper time; is the intrinsic probability distribution of dispersion measure as a function of redshift (including cosmological and host components); is the solid angle viewed at beam sensitivity ; and reflects the FRB luminosity function, i.e. it is the fraction of all FRB bursts from redshift emitted with energy above , where , and is the FRB detection threshold. The energy threshold is dependent upon , , DM, and , where is the measured burst width. The constant of proportionality in Equation (2.2) is the inverse of the expression integrated over redshift, which we leave out for brevity. We use best-fit parameter values from James et al. (2022a), and refer readers to James et al. (2022b) for further details of the definitions of these functions.
Equation (2.2) is plotted in Figure 2, calculated for the best-fit FRB population parameters of James et al. (2022a). Since the best-fit slope of the luminosity function is relatively steep, a nearby host galaxy for FRB 20171020A is strongly preferred.
In order to use as a Bayesian prior on the probability of a candidate galaxy being the true host, we take as the probability of an FRB being detected from a given redshift range to . is then the sum of the per galaxy prior probability, , over all galaxies in that redshift range, i.e. . Thus, any calculation of should account for the increasing number of galaxies in the greater volume of the Universe probed in the interval at larger redshifts.
To account for possible incompleteness in the WISE SCOSPZ catalogue, we construct a histogram with linear bins of and correct by the number of galaxies in each bin , giving:
| (2) |
Table 1 lists these corrected probabilities , and the joint probability , which we use for ranking the candidates. We normalise all probabilities to sum to unity, which is equivalent to stating that the probability of the true host galaxy not being listed in the catalogues employed is zero. ESO 601-G036 is found to be the most likely host, with 98% confidence. While other galaxies have spatial probabilities up to four times higher than ESO 601-G036, the probability of the host galaxy lying at the redshift of ESO 601-G036 is at least four times higher than that from other galaxies. The greatest driver of the result however is the very low number density of galaxies at ESO 601-G036’s low redshift on the sky. At 0.68 per square degree, it would be an extraordinary coincidence for such a galaxy to be located in the localisation region purely by chance. We note however that this analysis does not consider the stellar shred ESO 601-G037 as a separate object, and cannot say anything about the relative likelihoods of it and ESO 601-G036 as host objects.
2.3 Comparison with PATH methodology
The Probabilistic Association of Transients to their Hosts (‘PATH’; Aggarwal et al., 2021) methodology has recently been formulated and applied to the identification of the host galaxies of FRBs. It uses a Bayesian framework with the specific formulation incorporating priors on the -band magnitude of the host galaxy, the offset distribution for an FRB from its putative host, and instrumental localisation uncertainties.
Our analysis in Sections 2.1 & 2.2 is equivalent to a PATH analysis. Given that the instrumental localisation uncertainty is so large, the offset distribution of an FRB from its host can be ignored. The standard prior on the -band magnitude distribution of FRB host galaxies used in PATH is a flat prior on an FRB originating in a galaxy with a given , so that the prior for any individual galaxy is inversely proportional to the spatial number density of such galaxies on the sky. This method is the equivalent to our use of normalised by the volumetric density of galaxies from the WISE SCOSPZ catalogue.
It is interesting to compare the statistical power of our use of a prior on redshift compared to a prior on magnitude in this case. Taking the corrected r-band magnitudes from the WISE SCOSPZ catalogue, we calculate the prior according to the prescription of PATH, i.e. the priors are inversely proportional to the number densities from Driver et al. (2016) and list the values in Table 1. Using alone clearly makes ESO 601-G036 the mostly likely host galaxy; however, the association only has a 42% confidence, whereas using alone yields a 97% confidence in the association. We caution that hosts derived using should not then be used as input for FRB population analyses since is itself derived from such an analysis (James et al., 2022b) and would result in a circular argument.
Ideally, and would be combined into a joint statistic since alone ignores the fact that larger galaxies are more likely to be FRB hosts (Bhandari et al., 2022). As they are correlated however — close galaxies are on-average brighter — this would be a non-trivial exercise, which we leave to a future work.
2.4 Limits on repetition
Our increased confidence in the association of FRB 20171020A with ESO 601-G036 makes it the closest apparently non-repeating FRB. An extensive follow-up program with the Murriyang (Parkes) radio telescope and the Robert C. Byrd Green Bank Telescope (GBT) has failed to find any repetitions from the source, in addition to the 1150 hours that ASKAP has spent observing it, albeit mostly with a single antenna (James et al., 2020). Those authors use these non-detections to place a 90% confidence level upper limit on the repetition rate of bursts above erg in energy of 0.181–0.057 per day, assuming a differential power-law spectrum , with . However, this was a conservative upper limit calculated assuming a maximum redshift of 0.0636.
The effective rate of visible bursts would be expected to scale (in a locally Euclidean Universe) as
| (3) |
where . Thus our 90% upper limits on the intrinsic rate of bursts will decrease by the same factor to 0.011–0.0007 bursts/day above erg. By contrast, the rate of approximately one burst per hour observed from FRB 20121102A by the Five-hundred-meter Aperture Spherical radio Telescope (FAST; Li et al. 2021) corresponds to a rate of approximately six per day when accounting for the 25% active duty cycle of that FRB (Cruces et al., 2021). Accordingly, FRB 20121102A is at least 545 to 8450 times more active than FRB 20171020A. Any model treating all FRBs as being intrinsically repeating sources must therefore account for at least 3–4 orders of magnitude difference in their rates.
3 Multi-wavelength follow-up of ESO 601-G036
3.1 HI observations
Previous single-dish neutral hydrogen (H i) observations from HIPASS (Figure 3) show that the spatial extent of the gas in and around ESO 601-G036 and the nearby stellar shred ESO 601-G037 could easily fit within the Australia Telescope Compact Array (ATCA) field of view at 1.4 GHz with a single pointing. In an attempt to resolve any H i associated with ESO 601-G037 from that of ESO 601-G036, we acquired 80 hours of observing time during semester 2019APR, under project code C3288. Preliminary test observations (project code CX417) indicated that the H i component of the system was readily detectable by ATCA. Different array configurations were used to sample various spatial scales of the uv-plane, as summarised in Table 2.
| Date | Project | Array | Integration | H i central frequency/ | Continuum central frequency/ |
|---|---|---|---|---|---|
| code | configuration | time (h) | bandwidth (MHz) | bandwidth (MHz) | |
| 13 Aug 2018 | C3211 | 1.5D | 9.0 | – | 5500/2048 and 9000/2048 |
| 16 Aug 2018 | C3211 | H214 | 5.8 | – | 16700/2048 and 21200/2048 |
| 4 Nov 2018 | CX417 | 750A | 2.4 | 1408/8.5 | 2100/2048 |
| 2 Dec 2018 | CX417 | H168 | 3.0 | 1408/8.5 | 2100/2048 |
| 12 Dec 2018 | CX417 | 1.5D | 5.6 | 1408/8.5 | 2100/2048 |
| 20 Apr 2019 | C3288 | 750C | 5.2 | 1408/8.5 | 2100/2048 |
| 21 Apr 2019 | C3288 | 750C | 6.8 | 1408/8.5 | 2100/2048 |
| 1 May 2019 | C3288 | 1.5B | 5.9 | 1408/8.5 | 2100/2048 |
| 10 May 2019 | C3288 | 1.5B | 5.7 | 1408/8.5 | 2100/2048 |
| 12 May 2019 | C3288 | 1.5B | 5.6 | 1408/8.5 | 2100/2048 |
| 15 May 2019 | C3288 | 1.5B | 6.2 | 1408/8.5 | 2100/2048 |
| 17 May 2019 | C3288 | 6A | 9.7 | 1408/8.5 | 2100/2048 |
| 18 May 2019 | C3288 | 6A | 10.3 | 1408/8.5 | 2100/2048 |
| 19 May 2019 | C3288 | 6A | 7.1 | 1408/8.5 | 2100/2048 |
| 24 May 2019 | C3288 | 6A | 9.1 | 1408/8.5 | 2100/2048 |
The observations used the ATCA Compact Array Broadband Backend (CABB; Wilson et al., 2011), 1M-0.5k correlator mode, and two zoom bands. Each zoom band had a bandwidth of 8.5 MHz divided into 17409 channels, for a spectral resolution of 0.5 kHz. Both zoom bands were centred at 1408.25 MHz. This redundancy helped to mitigate the effects of possible hardware issues occurring in either band, such as periodic correlator block dropouts during observations that would stop data recording for a specific frequency range in the affected zoom band.
Each observing run began with 10 minutes on the primary and bandpass calibrator PKS 1934-638, followed by a loop of alternating 3 minutes on the phase calibrator PKS 2135-209 and 40 minutes on the science target ESO 601-G036. Every four loops, PKS 1934-638 was observed for another 5 minutes before continuing the loop. Any correlator block dropouts were noted and the alternate band was used for processing and imaging.
The raw data were edited, calibrated, and imaged using miriad (Sault et al., 1995) version 1.5 and its standard library of tasks. Each night of observations was processed individually, in a uniform manner, that incorporated visual inspection and manual outlier excision. During the imaging stage, the processed data were incorporated together to make each image cube. At this point, the 0.5 kHz channels were combined for a coarser resolution of 18.7 kHz (4 km s-1). Different weighting schemes and imaging parameters were tested to determine optimal settings for the intended science.
For the most sensitive image cube we used natural weighting and did not include any data from ATCA antenna 6 (i.e. using only baselines 3 km). The shortest baselines (with uv-range 0.25 k) had strong radio frequency interference (RFI) that caused a large scale ripple across the entire field of view and were also not used for the naturally-weighted image cube. For a higher spatial resolution cube, we included all the processed data and used a Briggs robustness of 0.5. The parameters for these two cubes are summarised in Table 3. The root mean square (RMS) noise value for both cubes are comparable as the robust weighting incorporates additional baselines and is not as affected by the RFI in the shorter baselines.
| Natural | Robust | |
| weighting | weighting | |
| Processing parameters | ||
| Antennas included | 1–5 | 1–6 |
| uv-range (k) | 0.15–28.28 | |
| Image size (pixels) | 975 975 | 2250 2250 |
| Pixel size (arcsec) | 4 | 1.75 |
| Sidelobe suppression | 0 | – |
| Briggs robustness | – | 0.5 |
| Image cube details | ||
| Beam size (arcsec) | 109 20 | 44 9 |
| Spectral resolution (km s-1) | 4 | 4 |
| Per channel RMS (mJy beam-1) | 0.8 | 0.8 |
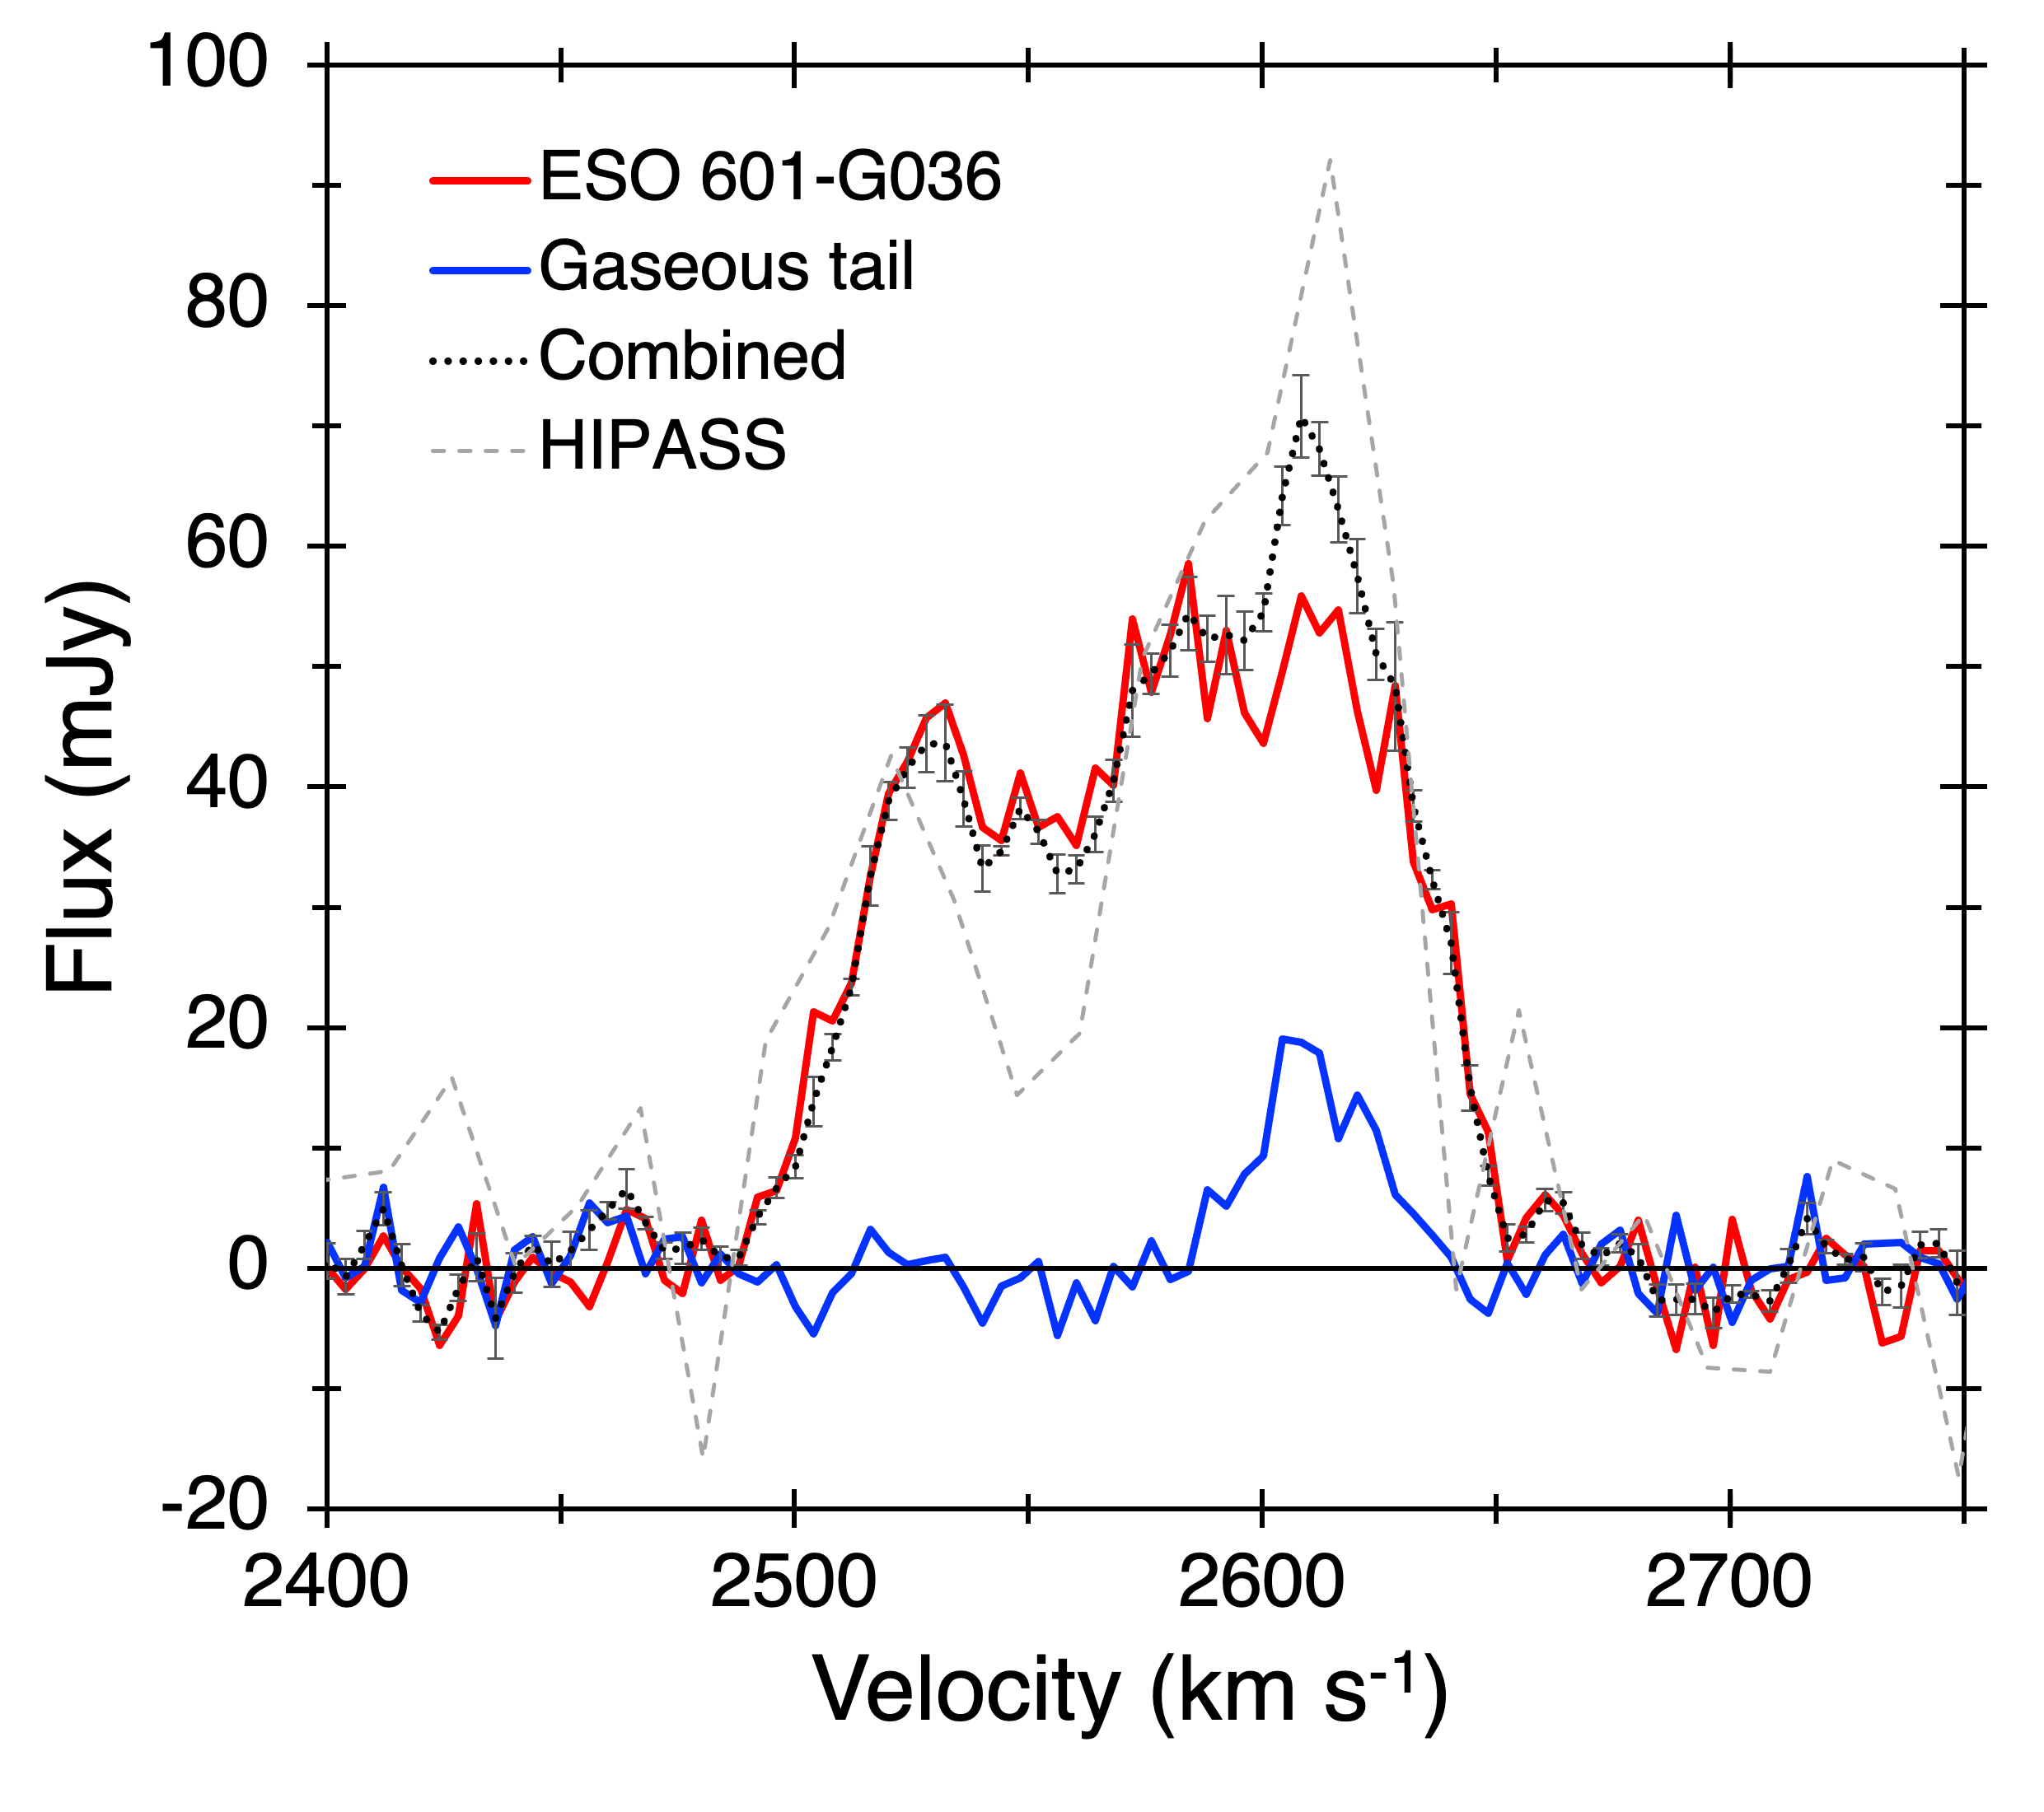
Figure 4 shows channel maps of the system using a 3-channel average for conciseness. Both weighting schemes are shown as natural weighting captures the diffuse H i and the robust weighting shows more detail of the higher density H i peaks. Moment maps showing the total H i intensity of the system as well as the velocity field are presented in Figure 5. The ATCA cubes have an elongated synthesised beam, due to the array’s east-west configuration, which hindered clear separation of the H i of ESO 601-G036 from ESO 601-G037. Nevertheless, a gaseous tail extending to the south-west of the stellar component of the system is clearly detected for the first time. The diffuse nature of the H i tail is evident as it is barely detectable in the higher spatial resolution image.
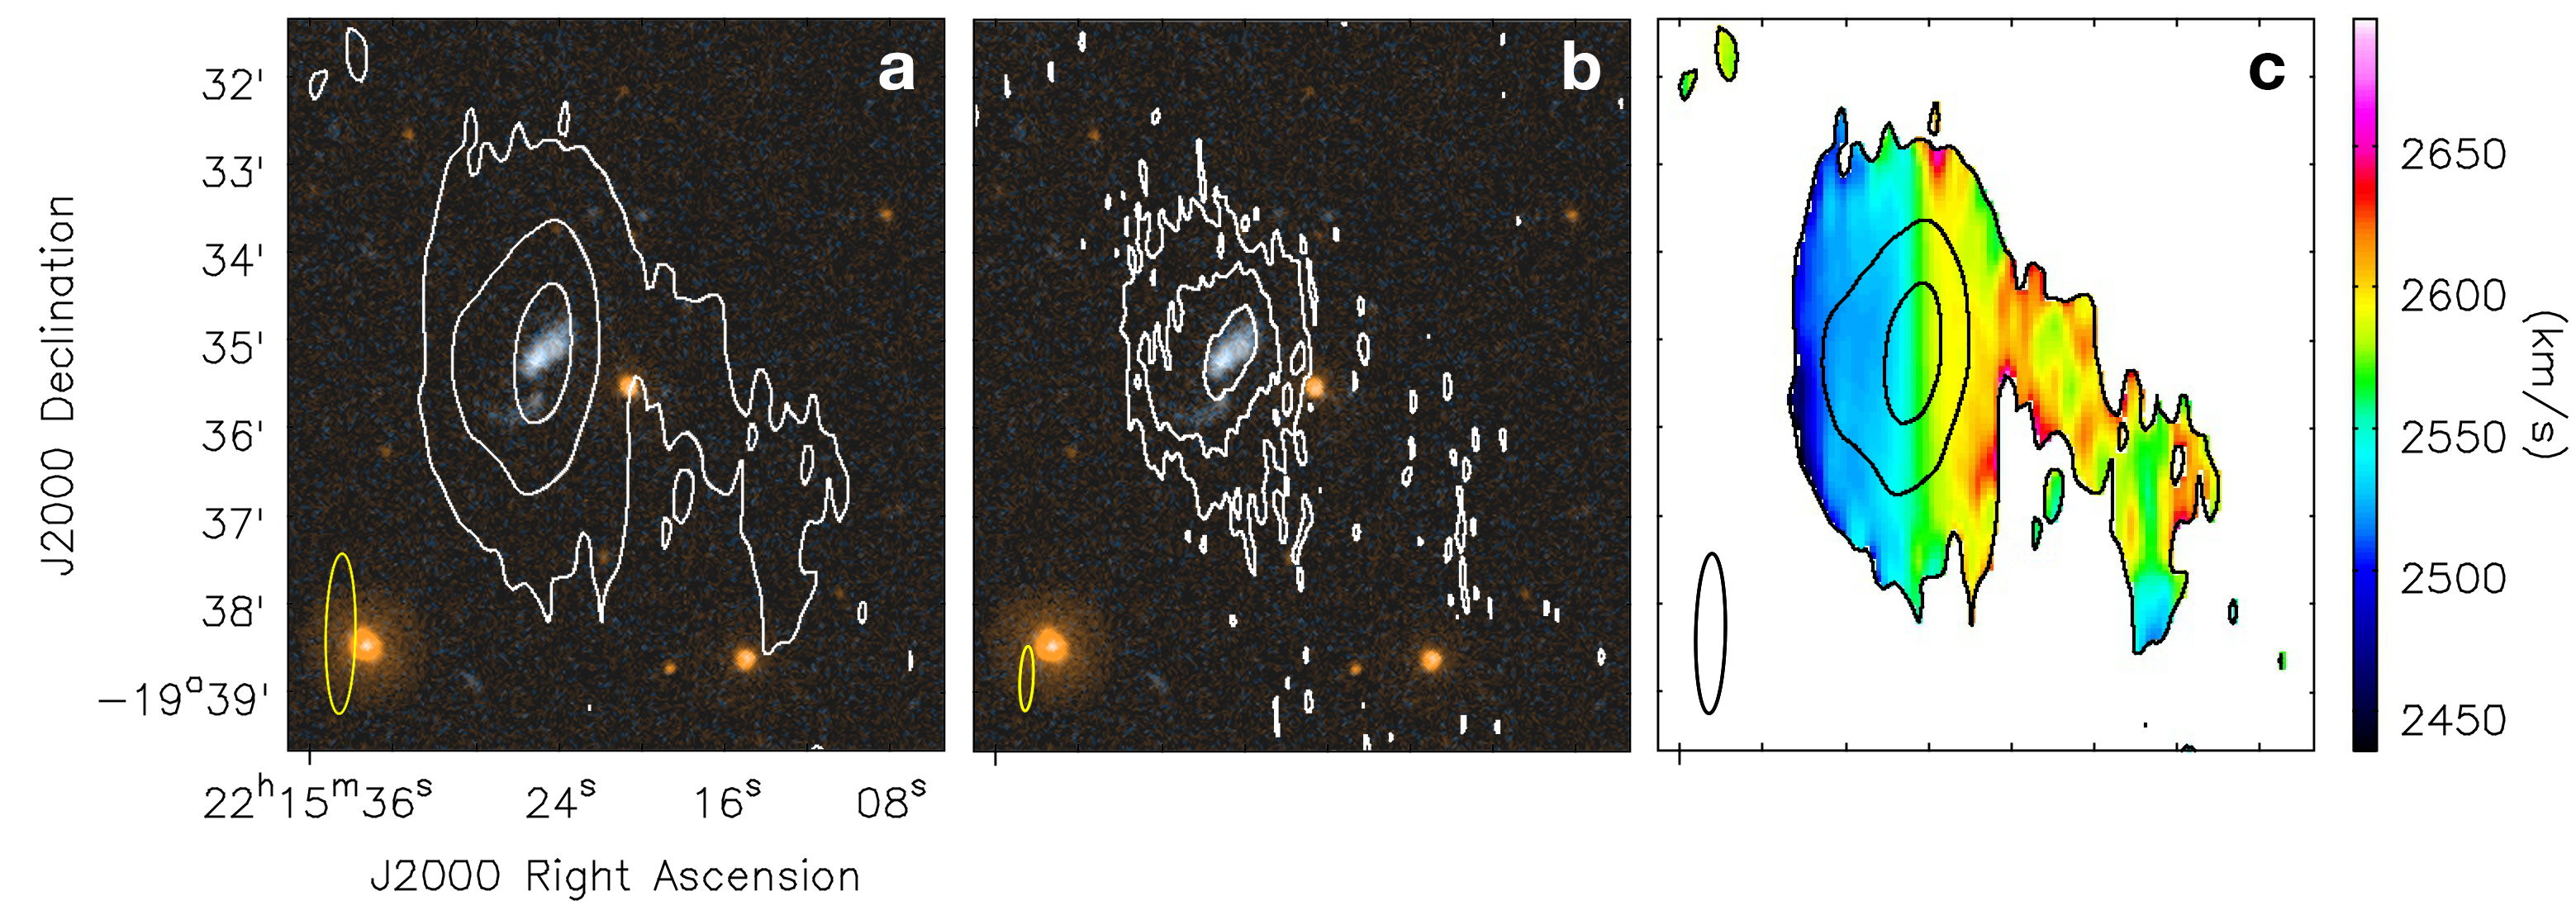
A combined spectral profile incorporating all detected H i within the immediate spatial and spectral vicinity of this system was measured both manually and using software tools such as mbspect in miriad and is presented in Figure 6 along with profiles for ESO 601-G036 (combined with ESO 601-G037) and the gaseous tail. Overall, the combined ATCA spectrum is in good agreement with the slightly noisier, yet higher sensitivity HIPASS spectrum.
The spectra for the individual features were measured manually since there is no clear spatial or spectral separation between ESO 601-G036 and its H i tail. As such, these plots represent an estimate of the flux contribution from each feature and no error bars have been included. Table 4 summarises the H i properties measured from the ATCA data.
| Source | vc | Peak flux | ||||
|---|---|---|---|---|---|---|
| (km s-1) | (km s-1) | (km s-1) | (mJy) | (Jy km s-1) | ||
| (1) | (2) | (3) | (4) | (5) | (6) | (7) |
| ESO 601-G036 | 2578 2 | 126 2 | 148 2 | 59 4 | 5.2 | 9.2 |
| Gaseous tail | 2613 2 | 26 2 | 48 2 | 19 1 | 0.5 | 8.3 |
| Combined | 2576 2 | 126 2 | 148 2 | 71 3 | 6.4 0.3 | 9.32 0.02 |
3.2 Radio continuum observations
Broadband radio continuum observations of ESO 601-G036 spanning 2.1 to 21.2 GHz were made with ATCA as summarised in Table 2. PKS 1934-638 was observed as the primary flux calibrator and the bandpass calibrator at frequencies below 10 GHz. Observations at 16.7 and 21.2 GHz central frequencies used PKS 1921-293 as the bandpass calibrator. PKS 2155-152 was used as the phase calibrator at all frequencies.
The radio continuum data were also reduced following standard flagging, calibration, and imaging tasks in miriad. To retain sensitivity to the diffuse radio emission without heavily degrading spatial resolution, a Briggs robustness of 0.5 was used at 5.5 and 9.0 GHz, and 0.0 at 2.1, 16.7 and 21.2 GHz in the imaging step.
An overlay of the radio emission detected at each frequency is shown in Figure 7. Extended radio emission was detected for ESO 601-G036 at all frequencies up to 16.7 GHz. No continuum emission was detected at 21.2 GHz. There is a hint of emission within the spatial vicinity of ESO 601-G037; however, since it is brightest at 16.7 GHz and not detected at 9.0 GHz, the peaks are likely from noise in the continuum data.
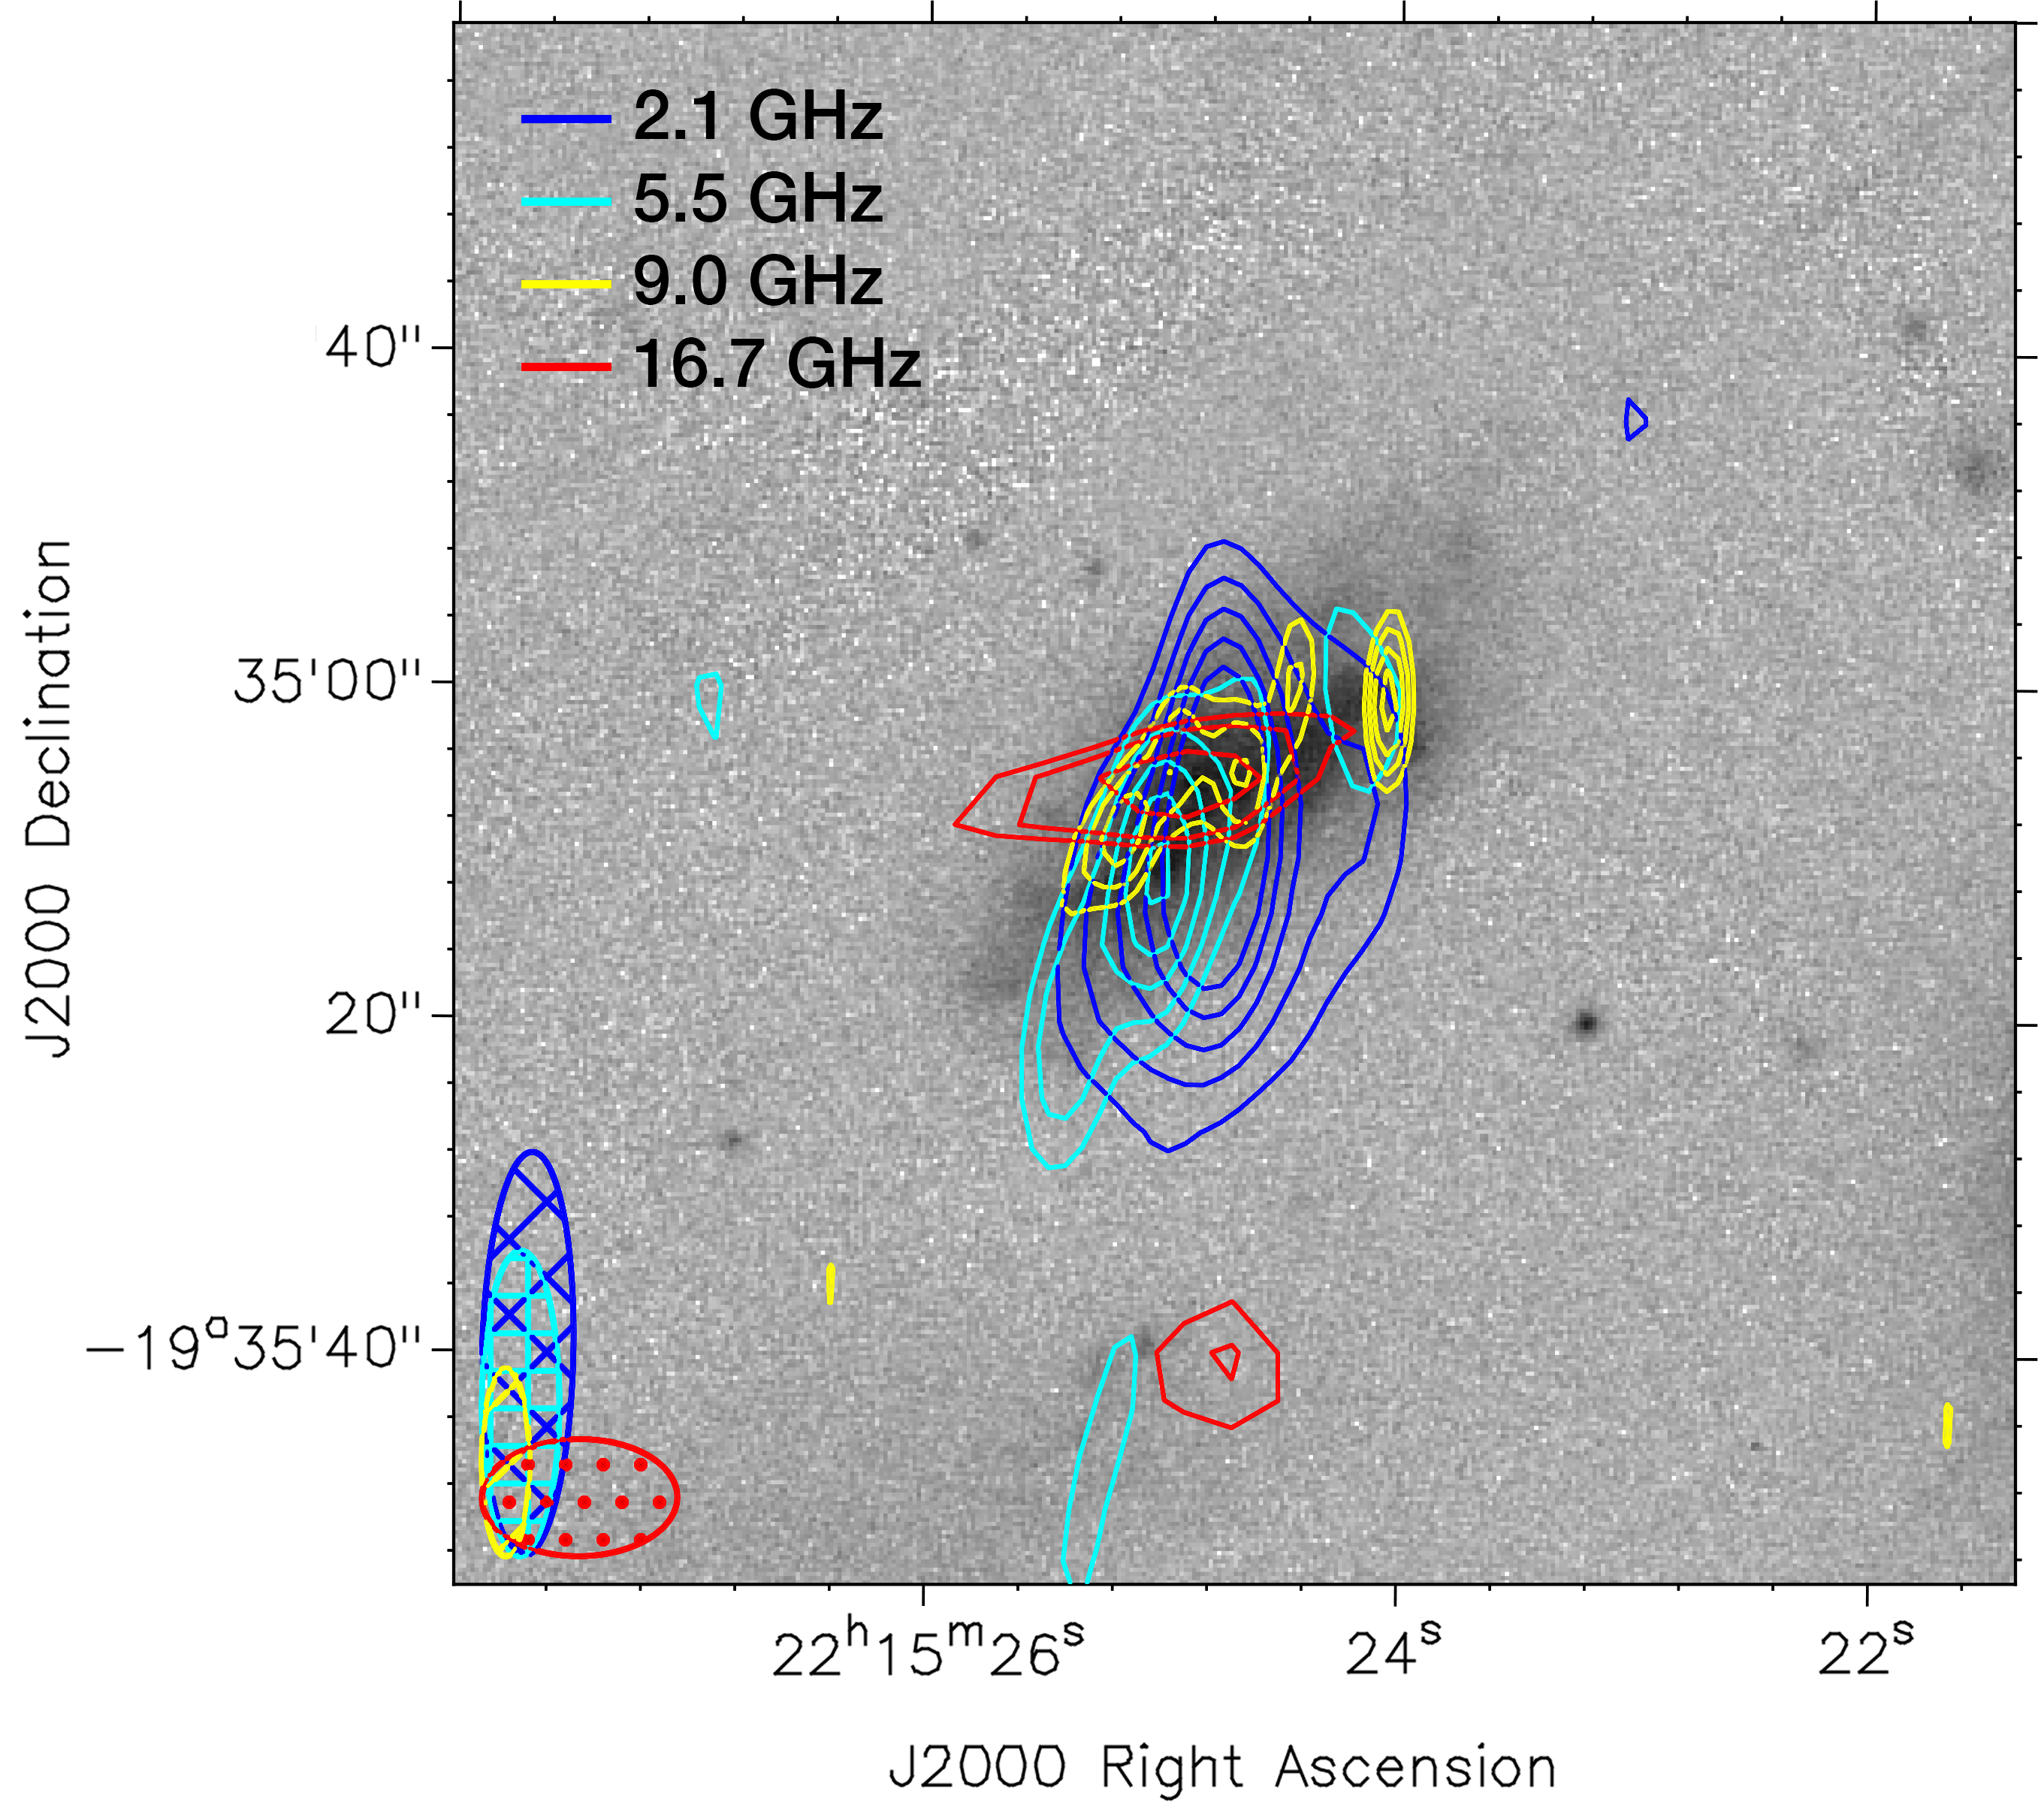
To measure the flux density across the wide range of observed frequencies and synthesised beam sizes, images were first convolved to match the lowest resolution image at 2.1 GHz. The flux density was then extracted at each frequency using the miriad task imfit over the same aperture defined by the source size at 2.1 GHz (a Gaussian of 37.8 19.7 arcsec and position angle of ). A summary of the measured flux densities along with the RMS and native resolution of each image are given in Table 5. A spectral index of is measured by fitting a simple power-law to the flux densities using the scipy package (Virtanen et al., 2020). This steep spectral index, combined with the clearly resolved nature of the continuum emission confirms that the radio emission is dominated by synchrotron radiation from star formation processes, consistent with what was presented in M18.
| Frequency | resolution | RMS | Flux density |
|---|---|---|---|
| (GHz) | (arcsec) | (Jy) | (Jy) |
| 2.1 | 24.25.5 | 20.8 | 734.7 5.4 |
| 5.5 | 18.34.6 | 12.7 | 271.5 2.7 |
| 9.0 | 11.12.9 | 8.0 | 263.8 1.6 |
| 16.7 | 11.77.0 | 11.0 | 76.7 2.8 |
| 21.2 | 9.45.3 | 17.5 | 52.5 |
3.3 Optical imaging and photometry
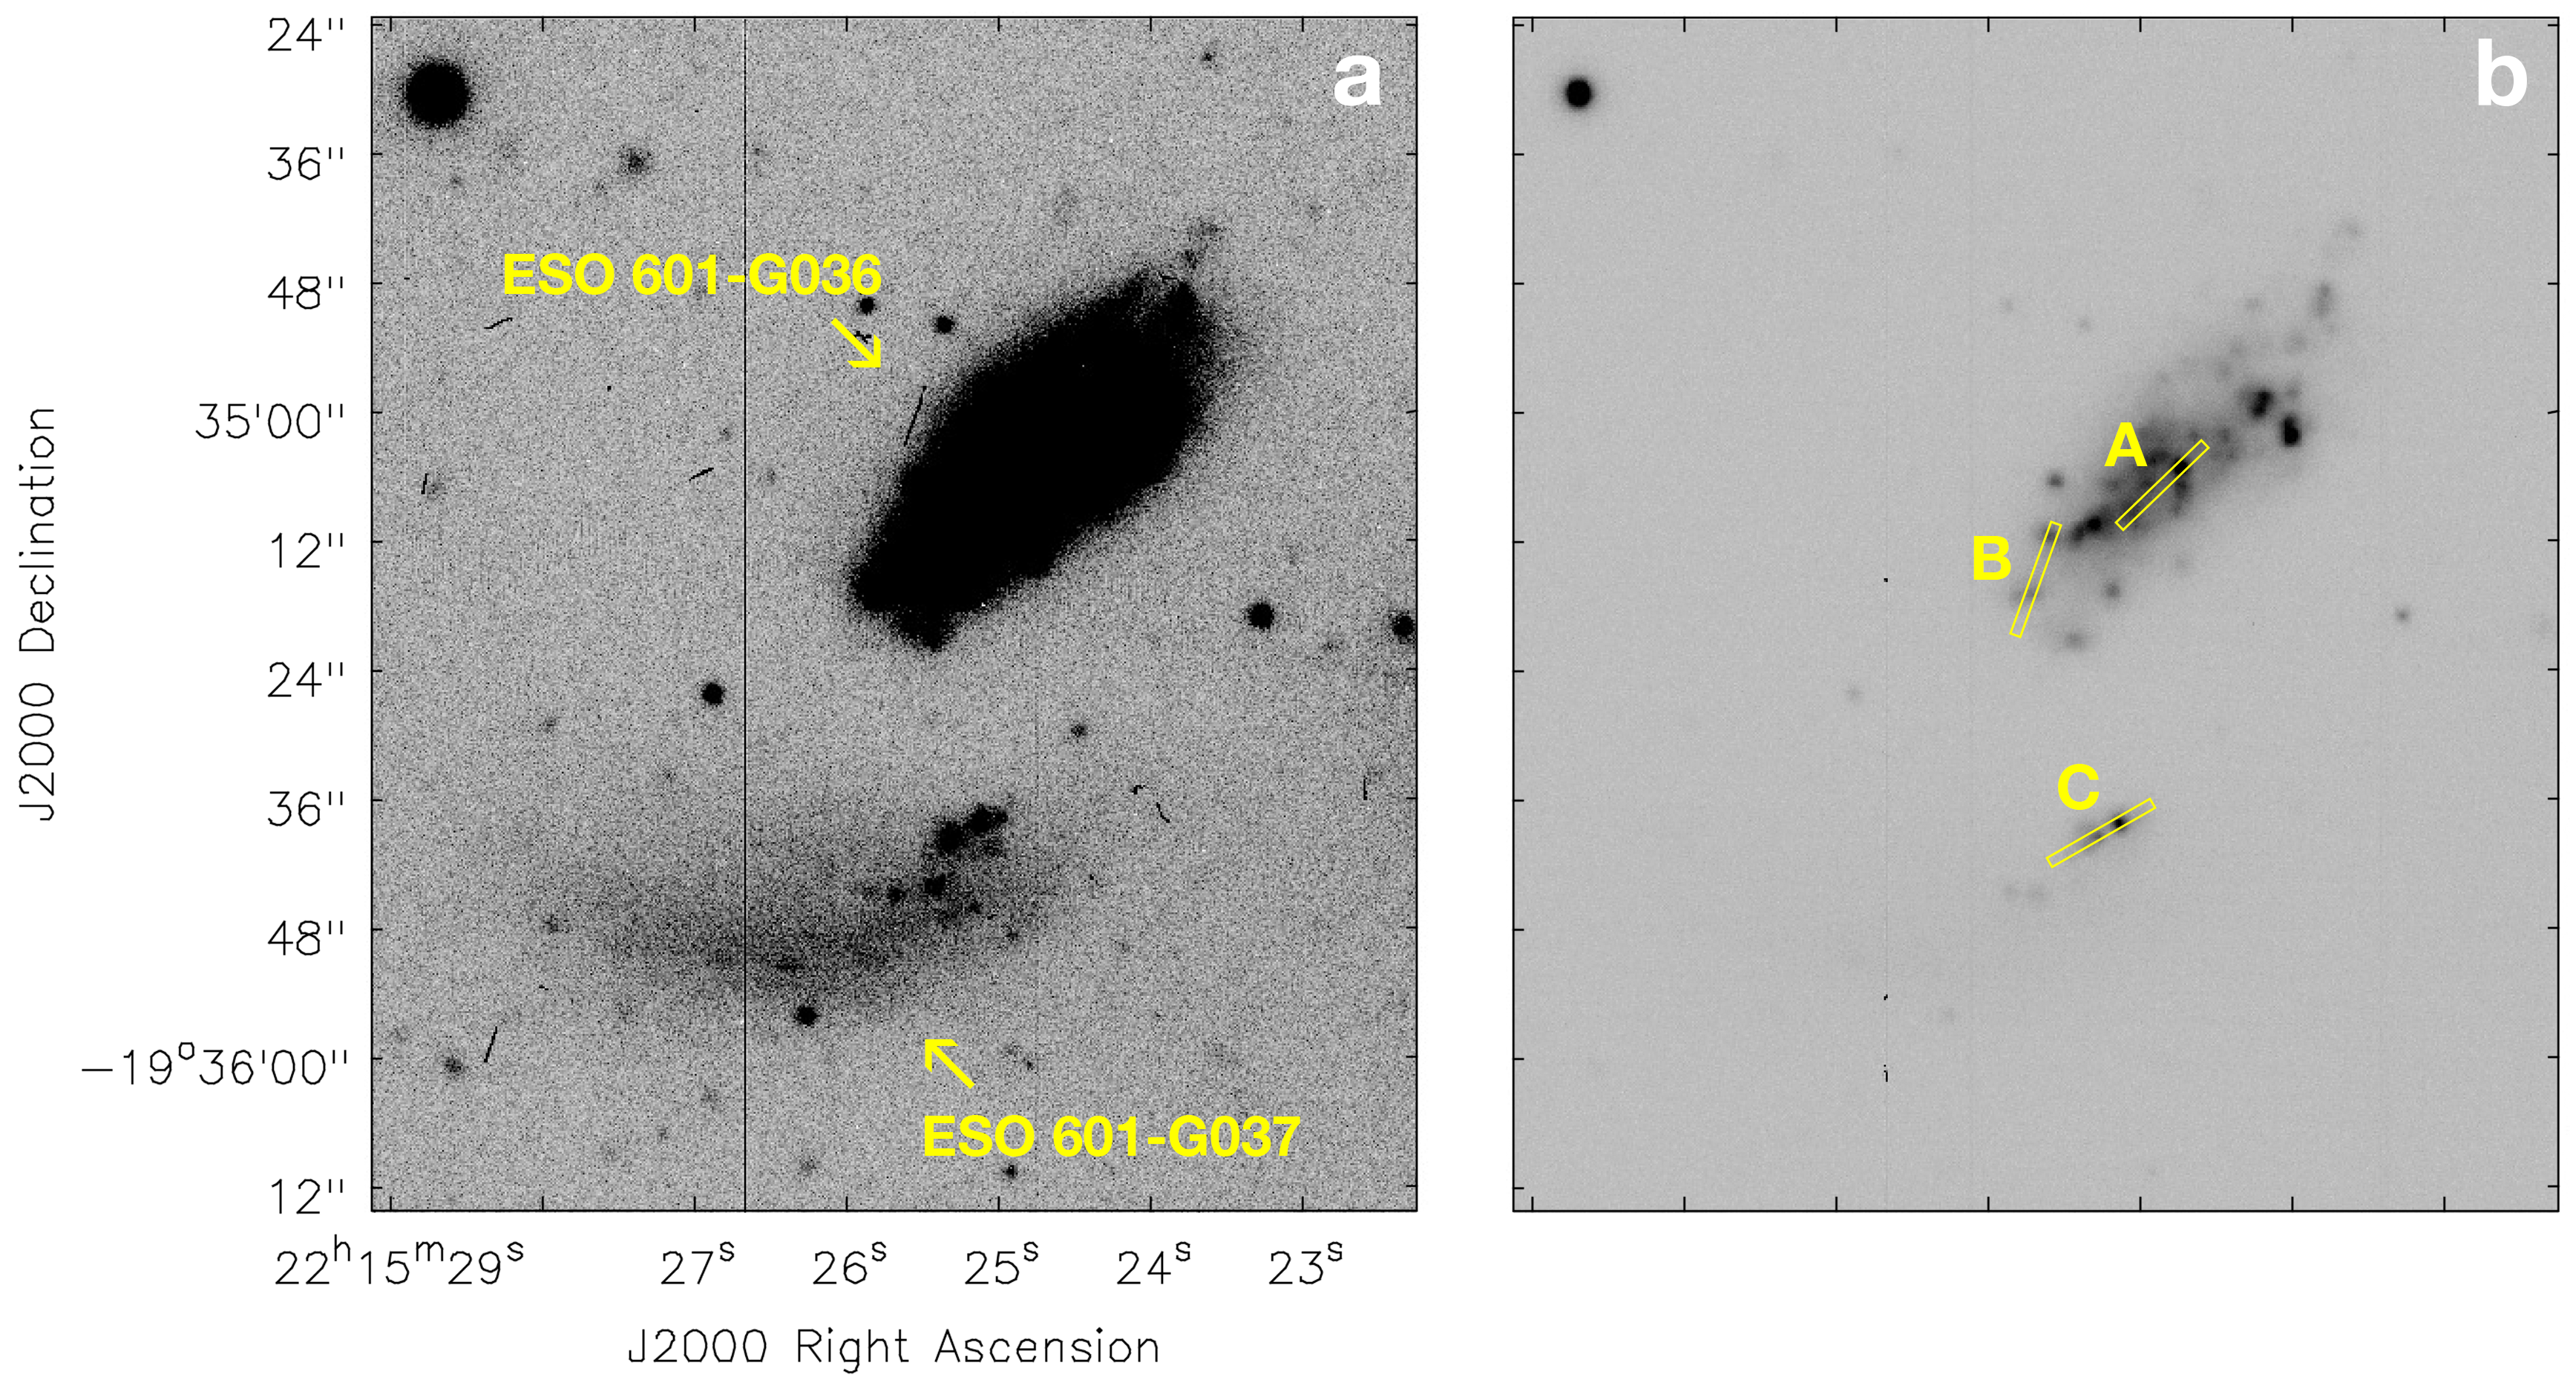
After initial localisation of FRB 20171020A, as part of a preliminary FRB follow-up strategy, optical imaging observations centred on ESO 601-G036 were taken on 15 July 2018 with Gemini-South (program GS-2018A-Q-205) using the GMOS HaC filter (6590–6650 Å) and the broadband r-filter (5620–6980 Å). We obtained s exposures with the HaC filter, and s exposure with the r-filter. The data was processed using the Data Reduction for Astronomy from Gemini Observatory North and South (DRAGONS) package111https://dragons.readthedocs.io using standard procedures. The resulting images are shown in Figure 8 and show an arc-like structure of ESO 601-G037 that corresponds to the galaxy’s shape revealed in the GALEX image (Figure 3). The HaC imaging enable positioning of the X-shooter spectroscopy slits (see Section 7).
The deeper Gemini r-band image was used as the reference image to determine flux-carrying pixels in the Pan-STARRS1 images (Chambers et al., 2016), taking advantage of data availability and self-consistent multi-band photometry provided by the latter dataset. After registering all images – including the Gemini r-band image and the Pan-STARRS1 g, i, z, and y images – to the Pan-STARRS1 r-band image, the detection mask and petrosain elliptical apertures were obtained from the Gemini image. Using the petrosain elliptical aperture, fluxes were derived for ESO 601-G036 from Pan-STARRS1 images and are presented in Table 6. For ESO601-G037, the Gemini detection mask was used to derive fluxes. The different methods were used because ESO 601-G036 has a relatively regular galactic morphology, while ESO601-G037 is a distorted stellar shred. During this process, a standard photometric procedure following Wang et al. (2021) was utilised to conduct background subtraction, source finding, segmentation, and characterisation of photometry and morphological properties. The weight maps of Pan-STARRS1 were used to derive photometric uncertainties. Foreground extinction was corrected with the reddening map of Schlafly & Finkbeiner (2011). The (g-r) colour-based r-band stellar-mass-to-light ratio from Zibetti et al. (2009) was then used to estimate stellar masses, , which are also listed in Table 6.
| ESO 601-G036 | ESO 601-G037 | |
|---|---|---|
| g-band mag | 15.382 0.003 | 17.66 0.01 |
| r-band mag | 15.141 0.002 | 17.49 0.01 |
| i-band mag | 15.102 0.002 | 17.31 0.01 |
| z-band mag | 15.06 0.01 | 17.33 0.02 |
| y-band mag | 14.88 0.01 | 17.23 0.06 |
| 8.5 | 7.4 |
3.4 Optical spectroscopy
| H ii Complex | A | B | C |
|---|---|---|---|
| Aperture width (′′) | 2.2 | 3.5 | 2.6 |
| Dereddened line fluxes (H=100) | |||
| [O ii] 3726 | 109.4 | 108.9 | 77.5 |
| [O ii] 3729 | 157.3 | 186.0 | 106.2 |
| H 4101 | 27.7 | 27.7 | 27.2 |
| H 4340 | 50.9 | 50.0 | 48.6 |
| [O iii] 4363 | 5.2 | 2.7 | 9.8 |
| H 4861 | 100.0 | 100.0 | 100.0 |
| [O iii] 4959 | 152.9 | 84.4 | 123.9 |
| [O iii] 5007 | 449.0 | 244.7 | 374.1 |
| [N ii] 6548 | 4.7 | 4.7 | 1.8 |
| H 6563 | 285.7 | 285.7 | 285.6 |
| [N ii] 6583 | 13.9 | 15.2 | 7.4 |
| [S ii] 6716 | 18.3 | 34.5 | 18.4 |
| [S ii] 6731 | 15.9 | 24.7 | 7.5 |
| (H) | 0.375 | 0.092 | 0.182 |
| 0.939 | 0.795 | 0.834 | |
| N2O2 | –1.282 | –1.287 | –1.397 |
| O32 | 0.226 | –0.081 | 0.309 |
| ( cm/s) | 3–5 | 0.8–1.0 | 3.5–6 |
| 12+log(O/H) | 8.450.05 | 8.430.02 | 8.230.05 |
| Mean redshift (km s-1) | 2558 | 2521 | 2587 |
M18 used the X-shooter spectrograph (Vernet et al., 2011) mounted on UT2 (Kueyen) of the European Southern Observatory’s Very Large Telescope to effectively filter out other potential host galaxies, by virtue of the fact that only one was bright (and thus potentially close) enough to yield a redshift with just 5–6 minutes of exposure time. The same instrument was also used that night to obtain spectroscopy at the locations of three H ii region complexes in and around the ESO 601-G036 system, to probe the ionised gas phase kinematics and metallicity. Complex A lies close to the nucleus of ESO 601-G036. Complex B is 10′′ to the south-east along the major axis, near the edge of the optical disk. Complex C corresponds to the bright knots of star formation along the northern edge of ESO 601-G037, closest to ESO 601-G036. These locations are marked in Figure 8b.
Slit widths of 10 (UVB) or 09 (VIS/NIR arms), and exposure times of 300 sec (VIS) or 360 sec (UVB/NIR arms) were used, but since diffuse gas emission tended to fill the 11′′ slit length at these locations, matching observations of blank sky regions up to 35′′ away were also obtained. Observations of the white dwarf EG 274 (Hamuy et al., 1992) and the B9.5 V star HD 123247 were used for relative spectrophotometric calibration and telluric feature removal, respectively.
The echellograms for each X-shooter arm were processed using ESOReflex (Freudling et al., 2013), including debiasing, flatfielding, rectification, as well as wavelength and instrumental response calibration. Although automatic extraction of a point source from the centre of the 2D (slit position, wavelength) image is performed, this is not optimal for our purposes. Instead, the apall task within V2.16.1 of iraf was used to extract a spectrum of consistent spatial width in all arms about the H peak, separately for each H ii Complex (Table 7). Gaussian fitting with the splot task yielded the centroids and continuum-subtracted integrated fluxes of key emission lines. The fluxes have been corrected for interstellar reddening by assuming the intrinsic Balmer decrement for Case B recombination appropriate to a K H ii region, i.e. (H)/(H) = 2.86, and the interstellar extinction curve of Cardelli et al. (1989). The corrected fluxes are presented in Table 7, along with the measured reddening parameter and mean velocity for each complex.
Traditionally the combined strength of the forbidden oxygen transitions can be used as an oxygen abundance diagnostic, via the parameter: = ([O ii] + [O iii] ) / H and its relationship to O/H. However is known to be sensitive to both the ionisation parameter and to temperature, with the latter resulting in an ambiguity between an ”upper” and a ”lower” abundance branch (Kewley & Ellison, 2008). In order to break this ambiguity, the prescription laid out by Poetrodjojo et al. (2018) has been followed, which employs the N2O2 diagnostic: N2O2 = log([N ii] / [O ii]) and the criterion that for N2O2 (as is the case for all three complexes, Table 7) the abundance falls on the ”lower” branch. Together with the value of the O32 diagnostic: O32 = log([O iii] / [O ii]), this initial metallicity estimate can place limits on the ionisation parameter using figure 5 of Kobulnicky & Kewley (2004). The oxygen abundance 12+log(O/H) is then given by the lower branch relation from eqn. 16 of Kobulnicky & Kewley (2004), with the uncertainty shown in Table 7 dominated by the range in . These abundances are found to be consistent with the M18 estimations.
3.5 X-ray observations
We observed ESO 601-G036 with the Neil Gehrels Swift observatory (Swift, Gehrels et al., 2004) on 2021 May 19, for 1.7 ks (ObsID 00014317001). The observation was performed with the X-ray Telescope (XRT, Burrows et al., 2005) in photon-counting mode and the Ultraviolet/Optical Telescope (UVOT, Roming et al., 2005) with the UVW2 filter. The XRT data was reduced using the xrtpipeline v 0.13.6, (HEASoft 6.29; Blackburn et al., 1999; NASA High Energy Astrophysics Science Archive Research Center (2014), Heasarc).
We do not detect any significant X-ray emission at the location of ESO 601-G036. Using Poisson statistics for low-count experiments (e.g., Gehrels, 1986; Kraft et al., 1991), we calculate a 3 upper limit of ct in the 0.3–10 keV band. Assuming a standard X-ray power law spectrum () with a photon index and the Galactic contribution to the hydrogen column density in the direction of the FRB, (HI4PI Collaboration et al., 2016), we estimate an upper limit of on the unabsorbed X-ray flux in the 0.3–10.0 keV band. This corresponds to an upper limit of on the X-ray luminosity. In comparison with the currently cataloged sample of ultra-luminous X-ray sources (ULXs), this limit is less than the observed luminosity of a small fraction of the brightest ULXs (Kovlakas et al., 2020), which have been proposed as FRB progenitors (Sridhar et al., 2021; Sridhar & Metzger, 2022).
3.6 Spectral energy distribution
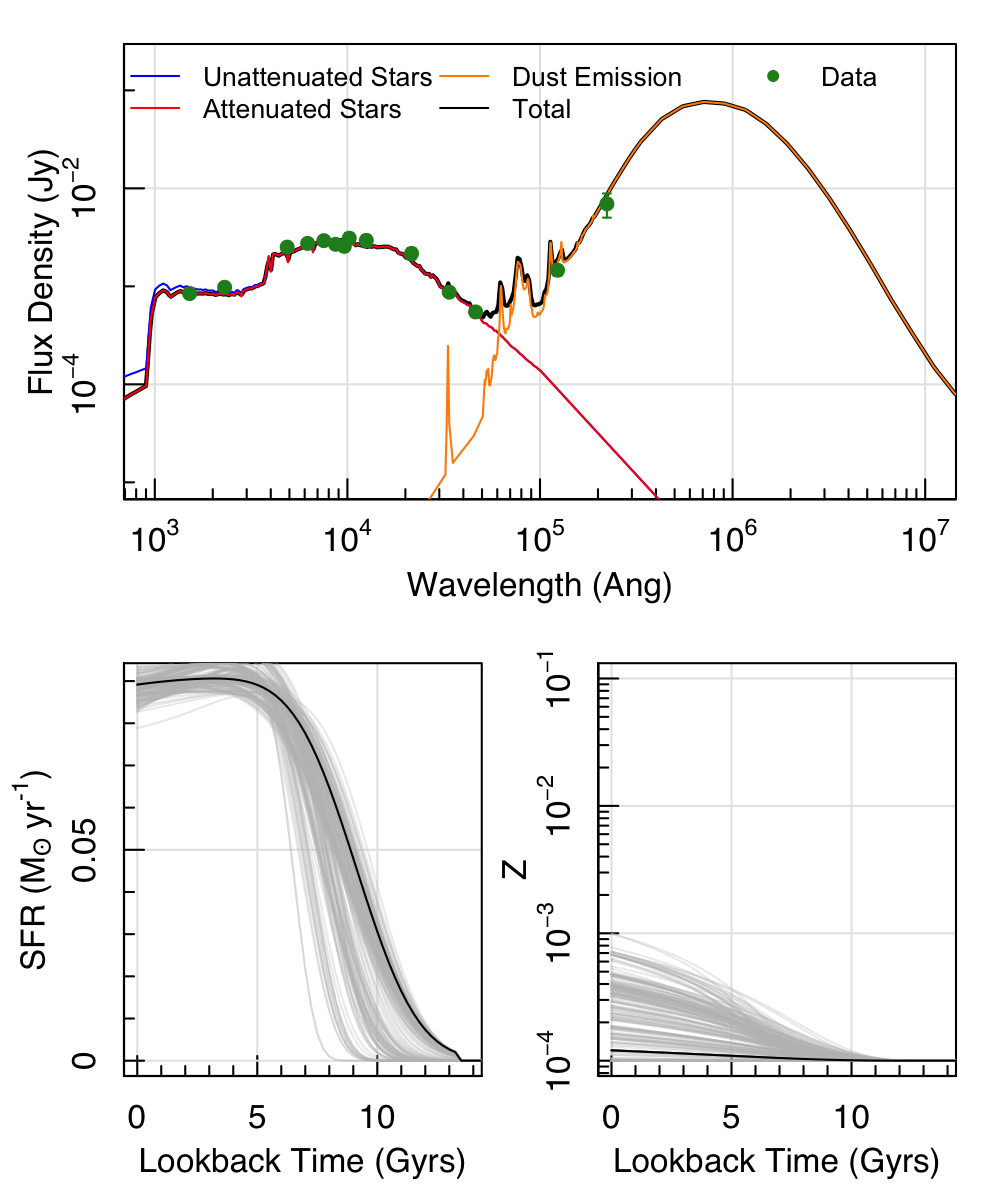
Using archival GALEX, Pan-STARRS1, VISTA, and WISE data, we fit the SED of ESO 601-G036 using the ProSpect SED fitting code (Robotham et al., 2020). We follow the implementation of ProSpect outlined in Thorne et al. (2021). Briefly, we use the Bruzual & Charlot (2003) stellar templates, assume a Chabrier (2003) initial mass function, and model the dust attenuation and re-emission using the Charlot & Fall (2000) and Dale et al. (2014) models respectively while assuming energy balance. We adopt a skewed Normal star formation history parameterisation and an evolving metallicity history where the metallicity growth is mapped linearly to the stellar mass growth and the final metallicity is modelled as a free parameter. We use the same priors as presented in table 2 of Thorne et al. (2021) and include a 10 per cent error floor across all bands to account for offsets between facilities and instruments.
Figure 9 shows the input photometry, best-fitting SED, and resulting star formation and metallicity histories for ESO 601-G036. From the ProSpect fit, we recover a stellar mass of (which is consistent to the mass calculated using the g-r colour method in Section 6) and a (which is consistent to the previously reported value in M18). These values place ESO 601-G036 on the star-forming main sequence at z0, derived by Thorne et al. (2021).
In addition, we fit available GALEX and Pan-STARRS1 photometry for ESO 601-G037 using the same ProSpect implementation as described above. ESO 601-G037 is undetected in the infrared imaging and so we limit our fitting to the available ultraviolet and optical data. We recover a stellar mass of (which is also comparable to the optical-only estimate) and a . The star formation history for ESO 601-G037 has a very similar shape to that of ESO 601-G036 (indicating constant star formation over the last 5 Gyr), with the former having a lower normalisation due to its lower mass.
4 Discussion
As described by M18, FRB 20171020A has one of the smallest DMs ever detected and as such warranted further follow-up. Figure 1 shows the localisation area and after thorough analysis, we confirm M18’s conclusion — with 98% confidence (see Table 1) — that ESO 601-G036 was the host, which makes it the third closest FRB host galaxy. With an estimated upper limit on the repetition rate of bursts per day above erg, ESO 601-G036 is also the closest host of an apparently non-repeating FRB. There is still a possibility that FRB 20171020A originated from ESO 601-G037, but as we discuss in this section the two objects are connected and ESO 601-G036 is more dominant in the system.
4.1 Signs of recent interaction
The ATCA H i observations have revealed a 3 arcmin long gaseous tail extending towards the south-west of ESO 601-G036. This tail is fairly diffuse, contains 10% of the Hi mass of the system, and spans a velocity width of km s-1 corresponding to the receding side of ESO 601-G036 (Figure 6). As seen with other nearby FRB host galaxies (Michałowski, 2021; Hsu et al., 2023), the spectral profile of ESO 601-G036 is fairly asymmetric, indicating turbulent motion in and around the galaxy (Glowacki et al., 2022). It is likely that a disturbance has caused some gas from the eastern side of the galaxy to move towards the west, ultimately forming the H i tail. Such disturbance could be an interloping galaxy — with a central velocity closer to vc 2600 km s-1 — which may have also been stripped of at least some of its H i , to contribute to the gaseous tail (see Bournaud et al. 2004; Lee-Waddell et al. 2012; Lelli et al. 2015 for other examples). Considering other H i -rich galaxies in the region are located over 1.4 deg (900 kpc in projection) from ESO 601-G036 (see Figure 3), the most obvious and possibly only interaction companion would be ESO 601-G037.
ESO 601-G037 has a pronounced arc-like stellar structure (see Figure 8) that resembles a tidal tail (Barnes & Hernquist 1992, Paudel et al. 2018). This stellar shred, located to the south of ESO 601-G036, is about an order of magnitude less massive but has a comparable specific SFR. The optical redshift obtained for ESO 601-G037 (Table 7, H ii complex C) confirms it to be part of the ESO 601-G036 system, since it is within the velocity range observed for ESO 601-G036 and there does appear to be some H i tracing the arc-like structure (see Figure 4). ESO 601-G037’s higher optical velocity (2587 km s-1) is broadly consistent with the H i tail ( km s-1 and km s-1). Furthermore, the oxygen line ratios of complex C are indicative of a less-enriched ISM, and hence a younger stellar population than complexes A and B in the main body of ESO 601-G036, suggesting that star formation in ESO 601-G037 has been delayed relative to ESO 601-G036.
Overall, there are both kinematic and chemical arguments for ESO 601-G037 being a satellite companion that is undergoing a minor merger event with ESO 601-G036, similar to the host system of FRB 20180916B (Kaur et al., 2022). The current spatial offset of ESO 601-G037 from the H i tail (as much as 40 kpc) suggests that there has been at least one close passage affecting the H i in the system and possibly another encounter transforming the stellar morphology of ESO 601-G037 (Karera et al., 2022).
Figure 7 shows the radio continuum contours. Due to the elongation of the beam, the extension of the radio emission to the south of the galaxy may not be truly from the interaction between ESO 601-G036 and ESO 601-G037. Nevertheless, even accounting for the beam size, there does appear to be a general offset of the continuum emission from the optical disk of ESO 601-G036, which is also consistent with the assumed interaction scenario.
4.2 Other properties of ESO 601-G036
ESO 601-G036 is one of only a few FRB host galaxies that is detected in the radio continuum. The extended nature of the emission combined with the steep spectral index indicates that the emission is likely driven by star formation in the host galaxy, similar to what is seen is a small number of other FRB host galaxies (FRB 20191001A, Bhandari et al. 2020; FRB 20190608B, Bhandari et al. 2020) and the host galaxy of the repeating FRB 20201124A (Fong et al., 2021; Piro et al., 2021; Ravi et al., 2022). We find no evidence for any compact, persistent radio source such as that detected in repeating FRBs FRB 20121102A (Marcote et al., 2017) and FRB 20190520B (Niu et al., 2022).
Using the measured spectral index, we calculate a 1.4 GHz radio luminosity for ESO 601-G036 of 1.891020 W/Hz. Following the 1.4 GHz luminosity-to-SFR relation given in Davies et al. (2017), we compute a SFR of 0.18 . The relatively large uncertainities in the 1.4 GHz-derived SFR are due to the scatter in the 1.4 GHz-SFR relation from Davies et al. (2017) and demonstrates that this method should only be used to provide an order-of-magnitude estimate of the SFR. Nonetheless, it is consistent with the SFR estimated from SED fitting, despite the methods probing different timescales; the 1.4 GHz radio luminosity traces synchrotron emission from core-collapse SNe, whereas the SED fitting captures emission from hot young stars in the UV, right through to dust heating in the infrared by older, low-mass stars.
4.3 Constraining an FRB progenitor model
Minor mergers can cause increased star formation activity (Hernquist & Mihos, 1995; Lambas et al., 2012; Kaviraj, 2014). ESO 601-G036 is clearly undergoing some form of interaction event, likely caused by the merging of ESO 601-G037, which aligns with the conclusions of other radio studies of FRB host galaxies that show evidence for recent interactions and/or significant spectral asymmetries (Michałowski, 2021; Kaur et al., 2022; Hsu et al., 2023). This finding is also consistent with FRB progenitor models predicting a tight temporal correlation with star formation; that is, emission from young magnetars formed from the collapse of massive stars.
Our limits on repetition from FRB 20171020A suggest that it was formed either from a cataclysmic merger, or is a significantly older object with correspondingly rarer and/or weaker emission. We have found that star-forming activity in ESO 601-G036 and ESO 601-G037 has been ongoing over the past 5 Gyr (lower left panel of Figure 9), which is consistent with both of these scenarios.
Nevertheless, recent H i observations of the host galaxy of the non-repeating FRB 20211127I do not show evidence for any significant asymmetry (Glowacki et al., 2023). This particular host galaxy is similar in size and morphology to ESO 601-G036, possibly suggesting that the two bursts could have a common origin mechanism despite their host galaxies having quite different interaction histories. A larger sample size of H i -rich FRB host galaxies is required to draw any firm conclusions on the origin of FRBs in such systems.
5 Conclusions
We have used an updated localisation method and expectations for the DM–z distribution of FRBs, to search for the host galaxy of FRB 20171020A . We have confirmed, with 98% confidence, that ESO 601-G036 is the host galaxy, as initially suggested by M18. This result makes it, at (37 Mpc), the third closest confirmed FRB host galaxy and the closest host of an apparently non-repeating FRB. Our work strengthens previous limits on possible repetition of FRB 20171020A to be less than 0.011 bursts/day above erg.
The proximity of ESO 601-G036 and confirmation of it as an FRB host, motivated a series of follow-up observations. We have carried out new H i and radio continuum observations with ATCA, optical imaging with Gemini, optical spectroscopy with X-shooter on the VLT, and an X-ray search with Swift. We have also used archival data to measure stellar properties.
We find ESO 601-G036 to be a typical star-forming galaxy, with , , and . Our H i observations reveal the presence of a 3 arcmin long diffuse gaseous tail extending to the south-west of ESO 601-G036 that contains 10% of the H i mass of the system. Nearby stellar shred ESO 601-G037 is located to the south, has an arc-like morphology, SED-derived stellar mass of , , and 0.2 dex lower gas metallicity than ESO 601-G036.
We interpret the properties of this system as evidence of an ongoing interaction, likely the merging of ESO 601-G037 with the host galaxy, ESO 601-G036. This finding is consistent with an FRB associated with recent star-forming activity, e.g. young magnetars. However, star formation has been ongoing for at least the last 5 Gyr and together with the strong limit on repetition, these properties are also consistent with the progenitor being a compact object merger. Our lack of an X-ray detection rules out the presence of the brightest ULXs, but is otherwise consistent with either FRB progenitor model.
Since the population of known FRB host galaxies is still small and the majority are much too distant for similar detailed follow-up observations that we have presented in this work, we encourage further analysis attempting to identify the host galaxies of nearby FRBs.
Acknowledgements
We thank the reviewer for their comments and suggestions to improve the clarity of this paper. We also thank J. Xavier Prochaska and Marcin Glowacki for insightful discussions and suggestions that helped to improve this work.
The Australia Telescope Compact Array is part of the Australia Telescope National Facility (https://ror.org/05qajvd42) which is funded by the Australian Government for operation as a National Facility managed by CSIRO. We acknowledge the Gomeroi people as the traditional owners of the Observatory site.
This scientific work uses data obtained from Inyarrimanha Ilgari Bundara / the CSIRO Murchison Radio-astronomy Observatory. We acknowledge the Wajarri Yamaji as the Traditional Owners and native title holders of the Observatory site. The Australian SKA Pathfinder is part of the Australia Telescope National Facility (https://ror.org/05qajvd42) which is managed by CSIRO. Operation of ASKAP is funded by the Australian Government with support from the National Collaborative Research Infrastructure Strategy. ASKAP uses the resources of the Pawsey Supercomputing Centre. Establishment of ASKAP, the Murchison Radio-astronomy Observatory and the Pawsey Supercomputing Centre are initiatives of the Australian Government, with support from the Government of Western Australia and the Science and Industry Endowment Fund.
This research is based on observations collected at the European Southern Observatory under ESO programme 0101.A-0455(B) (PI: J.-P. Macquart); as well as on observations obtained as part of program GS-2018A-Q-205 (PI: N. Tejos) at the international Gemini Observatory, a program of NSF’s NOIRLab, which is managed by the Association of Universities for Research in Astronomy (AURA) under a cooperative agreement with the National Science Foundation on behalf of the Gemini Observatory partnership: the National Science Foundation (United States), National Research Council (Canada), Agencia Nacional de Investigación y Desarrollo (Chile), Ministerio de Ciencia, Tecnología e Innovación (Argentina), Ministério da Ciência, Tecnologia, Inovações e Comunicações (Brazil), and Korea Astronomy and Space Science Institute (Republic of Korea). The Gemini data were processed using the DRAGONS (Data Reduction for Astronomy from Gemini Observatory North and South) package.
This research has made use of the NASA/IPAC Extragalactic Database (NED), which is operated by the Jet Propulsion Laboratory, California Institute of Technology, under contract with the National Aeronautics and Space Administration.
CWJ acknowledges support from the Australian Government through the Australian Research Council’s Discovery Projects funding scheme (project DP210102103).
FONH was partially supported through a CSIRO postgraduate scholarship.
RMS acknowledges support through Australian Research Council Discovery (ARC) Project DP220102305.
References
- Aggarwal et al. (2021) Aggarwal, K., Budavári, T., Deller, A. T., et al. 2021, ApJ, 911, 95
- Andreoni et al. (2020) Andreoni, I., Lu, W., Smith, R. M., et al. 2020, ApJ, 896, L2
- Barnes & Hernquist (1992) Barnes, J. E., & Hernquist, L. 1992, ARA&A, 30, 705
- Bhandari et al. (2020) Bhandari, S., Sadler, E. M., Prochaska, J. X., et al. 2020, The Astrophysical Journal Letters, 895, L37
- Bhandari et al. (2020) Bhandari, S., Bannister, K. W., Lenc, E., et al. 2020, ApJ, 901, L20
- Bhandari et al. (2022) Bhandari, S., Heintz, K. E., Aggarwal, K., et al. 2022, AJ, 163, 69
- Bhardwaj et al. (2021a) Bhardwaj, M., Kirichenko, A. Y., Michilli, D., et al. 2021a, ApJ, 919, L24
- Bhardwaj et al. (2021b) Bhardwaj, M., Gaensler, B. M., Kaspi, V. M., et al. 2021b, ApJ, 910, L18
- Bilicki et al. (2016) Bilicki, M., Peacock, J. A., Jarrett, T. H., et al. 2016, ApJS, 225, 5
- Blackburn et al. (1999) Blackburn, J. K., Shaw, R. A., Payne, H. E., Hayes, J. J. E., & Heasarc. 1999, FTOOLS: A general package of software to manipulate FITS files, Astrophysics Source Code Library, record ascl:9912.002, ascl:9912.002
- Bochenek et al. (2020) Bochenek, C. D., Ravi, V., Belov, K. V., et al. 2020, Nature, 587, 59
- Bournaud et al. (2004) Bournaud, F., Duc, P. A., Amram, P., Combes, F., & Gach, J. L. 2004, A&A, 425, 813
- Bruzual & Charlot (2003) Bruzual, G., & Charlot, S. 2003, Monthly Notices of the Royal Astronomical Society, 344, 1000
- Burrows et al. (2005) Burrows, D. N., Hill, J. E., Nousek, J. A., et al. 2005, Space Sci. Rev., 120, 165
- Cardelli et al. (1989) Cardelli, J. A., Clayton, G. C., & Mathis, J. S. 1989, ApJ, 345, 245
- Chabrier (2003) Chabrier, G. 2003, Publications of the Astronomical Society of the Pacific, 115, 763
- Chambers et al. (2016) Chambers, K. C., Magnier, E. A., Metcalfe, N., et al. 2016, arXiv e-prints, arXiv:1612.05560
- Charlot & Fall (2000) Charlot, S., & Fall, S. M. 2000, The Astrophysical Journal, 539, 718
- Chatterjee et al. (2017) Chatterjee, S., Law, C. J., Wharton, R. S., et al. 2017, Nature, 541, 58, arXiv: 1701.01098
- CHIME/FRB Collaboration et al. (2020) CHIME/FRB Collaboration, Andersen, B. C., Bandura, K. M., et al. 2020, Nature, 587, 54
- CHIME/FRB Collaboration et al. (2021) CHIME/FRB Collaboration, Amiri, M., Andersen, B. C., et al. 2021, ApJS, 257, 59
- Cruces et al. (2021) Cruces, M., Spitler, L. G., Scholz, P., et al. 2021, MNRAS, 500, 448
- da Costa et al. (1998) da Costa, L. N., Willmer, C. N. A., Pellegrini, P. S., et al. 1998, AJ, 116, 1
- Dale et al. (2014) Dale, D. A., Helou, G., Magdis, G. E., et al. 2014, The Astrophysical Journal, 784, 83
- Davies et al. (2017) Davies, L. J. M., Huynh, M. T., Hopkins, A. M., et al. 2017, MNRAS, 466, 2312
- Driver et al. (2016) Driver, S. P., Wright, A. H., Andrews, S. K., et al. 2016, MNRAS, 455, 3911
- Duncan & Thompson (1992) Duncan, R. C., & Thompson, C. 1992, ApJ, 392, L9
- Fong et al. (2021) Fong, W.-f., Dong, Y., Leja, J., et al. 2021, The Astrophysical Journal, 919, L23, aDS Bibcode: 2021ApJ…919L..23F
- Freudling et al. (2013) Freudling, W., Romaniello, M., Bramich, D. M., et al. 2013, A&A, 559, A96
- Gehrels (1986) Gehrels, N. 1986, ApJ, 303, 336
- Gehrels et al. (2004) Gehrels, N., Chincarini, G., Giommi, P., et al. 2004, ApJ, 611, 1005
- Glowacki et al. (2022) Glowacki, M., Deg, N., Blyth, S. L., et al. 2022, MNRAS, 517, 1282
- Glowacki et al. (2023) Glowacki, M., Lee-Waddell, K., Deller, A. T., et al. 2023, The Astrophysical Journal, 949, 25
- Hamuy et al. (1992) Hamuy, M., Walker, A. R., Suntzeff, N. B., et al. 1992, PASP, 104, 533
- Heintz et al. (2020) Heintz, K. E., Prochaska, J. X., Simha, S., et al. 2020, ApJ, 903, 152
- Hernquist & Mihos (1995) Hernquist, L., & Mihos, J. C. 1995, ApJ, 448, 41
- HI4PI Collaboration et al. (2016) HI4PI Collaboration, Ben Bekhti, N., Flöer, L., et al. 2016, A&A, 594, A116
- Hsu et al. (2023) Hsu, T.-Y., Hashimoto, T., Hatsukade, B., et al. 2023, MNRAS, 519, 2030
- James et al. (2019) James, C. W., Ekers, R. D., Macquart, J.-P., Bannister, K. W., & Shannon, R. M. 2019, Monthly Notices of the Royal Astronomical Society, 483, 1342
- James et al. (2022a) James, C. W., Prochaska, J. X., Macquart, J. P., et al. 2022a, MNRAS, 510, L18
- James et al. (2022b) —. 2022b, MNRAS, 509, 4775
- James et al. (2020) James, C. W., Osłowski, S., Flynn, C., et al. 2020, MNRAS, 495, 2416
- Karera et al. (2022) Karera, P., Drissen, L., Martel, H., et al. 2022, MNRAS, 514, 2769
- Kaur et al. (2022) Kaur, B., Kanekar, N., & Prochaska, J. X. 2022, ApJ, 925, L20
- Kaviraj (2014) Kaviraj, S. 2014, MNRAS, 440, 2944
- Kewley & Ellison (2008) Kewley, L. J., & Ellison, S. L. 2008, ApJ, 681, 1183
- Kirsten et al. (2022) Kirsten, F., Marcote, B., Nimmo, K., et al. 2022, Nature, 602, 585
- Kobulnicky & Kewley (2004) Kobulnicky, H. A., & Kewley, L. J. 2004, ApJ, 617, 240
- Kovlakas et al. (2020) Kovlakas, K., Zezas, A., Andrews, J. J., et al. 2020, MNRAS, 498, 4790
- Kraft et al. (1991) Kraft, R. P., Burrows, D. N., & Nousek, J. A. 1991, ApJ, 374, 344
- Lambas et al. (2012) Lambas, D. G., Alonso, S., Mesa, V., & O’Mill, A. L. 2012, A&A, 539, A45
- Lee-Waddell et al. (2012) Lee-Waddell, K., Spekkens, K., Haynes, M. P., et al. 2012, MNRAS, 427, 2314
- Lelli et al. (2015) Lelli, F., Duc, P.-A., Brinks, E., et al. 2015, A&A, 584, A113
- Li et al. (2021) Li, D., Wang, P., Zhu, W. W., et al. 2021, Nature, 598, 267
- Lorimer et al. (2007) Lorimer, D. R., Bailes, M., McLaughlin, M. A., & others. 2007, Science, 318, 777
- Macquart et al. (2010) Macquart, J.-P., Bailes, M., Bhat, N. D. R., et al. 2010, PASA, 27, 272
- Macquart et al. (2020) Macquart, J.-P., Prochaska, J. X., McQuinn, M., et al. 2020, Nature, 581, 391
- Mahony et al. (2018) Mahony, E. K., Ekers, R. D., Macquart, J.-P., et al. 2018, ApJ, 867, L10
- Mannings et al. (2021) Mannings, A. G., Fong, W.-f., Simha, S., et al. 2021, ApJ, 917, 75
- Marcote et al. (2017) Marcote, B., Paragi, Z., Hessels, J. W. T., et al. 2017, The Astrophysical Journal, 834, L8, publisher: American Astronomical Society
- Marcote et al. (2020) Marcote, B., Nimmo, K., Hessels, J. W. T., et al. 2020, Nature, 577, 190, number: 7789 Publisher: Nature Publishing Group
- Martin et al. (2005) Martin, D. C., Fanson, J., Schiminovich, D., et al. 2005, ApJ, 619, L1
- Mereghetti et al. (2021) Mereghetti, S., Topinka, M., Rigoselli, M., & Götz, D. 2021, ApJ, 921, L3
- Meyer et al. (2004) Meyer, M. J., Zwaan, M. A., Webster, R. L., et al. 2004, MNRAS, 350, 1195
- Michałowski (2021) Michałowski, M. J. 2021, ApJ, 920, L21
- Mould et al. (2000) Mould, J. R., Huchra, J. P., Freedman, W. L., et al. 2000, ApJ, 545, 547
- NASA High Energy Astrophysics Science Archive Research Center (2014) (Heasarc) NASA High Energy Astrophysics Science Archive Research Center (Heasarc). 2014, HEAsoft: Unified Release of FTOOLS and XANADU, Astrophysics Source Code Library, record ascl:1408.004, ascl:1408.004
- Niu et al. (2022) Niu, C. H., Aggarwal, K., Li, D., et al. 2022, Nature, 606, 873
- Paudel et al. (2018) Paudel, S., Smith, R., Yoon, S. J., Calderón-Castillo, P., & Duc, P.-A. 2018, ApJS, 237, 36
- Petroff et al. (2022) Petroff, E., Hessels, J. W. T., & Lorimer, D. R. 2022, A&A Rev., 30, 2
- Piro et al. (2021) Piro, L., Bruni, G., Troja, E., et al. 2021, A&A, 656, L15
- Platts et al. (2019) Platts, E., Weltman, A., Walters, A., et al. 2019, Phys. Rep., 821, 1
- Poetrodjojo et al. (2018) Poetrodjojo, H., Groves, B., Kewley, L. J., et al. 2018, MNRAS, 479, 5235
- Qiu et al. (2020) Qiu, H., Shannon, R. M., Farah, W., et al. 2020, MNRAS, 497, 1382
- Rajwade et al. (2022) Rajwade, K. M., Bezuidenhout, M. C., Caleb, M., et al. 2022, MNRAS, 514, 1961
- Ravi et al. (2022) Ravi, V., Law, C. J., Li, D., et al. 2022, MNRAS, 513, 982
- Ravi et al. (2023) Ravi, V., Catha, M., Chen, G., et al. 2023, arXiv e-prints, arXiv:2301.01000
- Robotham et al. (2020) Robotham, A. S. G., Bellstedt, S., Lagos, C. d. P., et al. 2020, MNRAS, 495, 905
- Roming et al. (2005) Roming, P. W. A., Kennedy, T. E., Mason, K. O., et al. 2005, Space Sci. Rev., 120, 95
- Rosswog et al. (2003) Rosswog, S., Ramirez-Ruiz, E., & Davies, M. B. 2003, MNRAS, 345, 1077
- Sault et al. (1995) Sault, R. J., Teuben, P. J., & Wright, M. C. H. 1995, in Astronomical Society of the Pacific Conference Series, Vol. 77, Astronomical Data Analysis Software and Systems IV, ed. R. A. Shaw, H. E. Payne, & J. J. E. Hayes, 433
- Schlafly & Finkbeiner (2011) Schlafly, E. F., & Finkbeiner, D. P. 2011, ApJ, 737, 103
- Shannon et al. (2018) Shannon, R. M., Macquart, J.-P., Bannister, K. W., et al. 2018, Nature, 562, 386
- Sridhar & Metzger (2022) Sridhar, N., & Metzger, B. D. 2022, ApJ, 937, 5
- Sridhar et al. (2021) Sridhar, N., Metzger, B. D., Beniamini, P., et al. 2021, arXiv:2102.06138 [astro-ph, physics:physics], arXiv: 2102.06138
- Tauris et al. (2013) Tauris, T. M., Sanyal, D., Yoon, S. C., & Langer, N. 2013, A&A, 558, A39
- Tendulkar et al. (2017) Tendulkar, S. P., Bassa, C. G., Cordes, J. M., et al. 2017, ApJ, 834, L7
- Thorne et al. (2021) Thorne, J. E., Robotham, A. S. G., Davies, L. J. M., et al. 2021, MNRAS, 505, 540
- Thornton et al. (2013) Thornton, D., Stappers, B., Bailes, M., & others. 2013, Science, 341, 53
- Vernet et al. (2011) Vernet, J., Dekker, H., D’Odorico, S., et al. 2011, A&A, 536, A105
- Virtanen et al. (2020) Virtanen, P., Gommers, R., Oliphant, T. E., et al. 2020, Nature Methods, 17, 261
- Wang et al. (2021) Wang, J., Staveley-Smith, L., Westmeier, T., et al. 2021, ApJ, 915, 70
- Wilson et al. (2011) Wilson, W. E., Ferris, R. H., Axtens, P., et al. 2011, MNRAS, 416, 832
- Zibetti et al. (2009) Zibetti, S., Charlot, S., & Rix, H.-W. 2009, MNRAS, 400, 1181