Closing the Gap in High-Risk Pregnancy Care Using Machine Learning and Human-AI Collaboration
Abstract
High-risk pregnancy (HRP) is a pregnancy complicated by factors that can adversely affect outcomes of the mother or the infant. Health insurers use algorithms to identify members who would benefit from additional clinical support. We aimed to build machine learning algorithms to identify pregnant patients and triage them by risk of complication to assist care management. In this retrospective study, we trained a hybrid Lasso regularized classifier to predict whether a patient is currently pregnant using claims data from 36735 insured members of Independence Blue Cross (IBC), a health insurer in Philadelphia. We then train a linear classifier on a subset of 12,243 members to predict whether a patient will develop gestational diabetes or gestational hypertension. These algorithms were developed in cooperation with the care management team at IBC and integrated into the dashboard. In small user studies with the nurses, we evaluated the impact of integrating our algorithms into their workflow. We find that the proposed model predicts an earlier pregnancy start date for 3.54% (95% CI 3.05-4.00) for patients with complications compared to only using a set of pre-defined codes that indicate the start of pregnancy and never later at the expense of a 5.58% (95% CI 4.05-6.40) false positive rate. The classifier for predicting complications has an AUC of 0.754 (95% CI 0.764-0.788) using data up to the patient’s first trimester. Nurses from the care management program expressed a preference for the proposed models over existing approaches. The proposed model outperformed commonly used claim codes for the identification of pregnant patients at the expense of a manageable false positive rate. Our risk complication classifier shows that we can accurately triage patients by risk of complication.
Introduction
High-risk pregnancy is a pregnancy complicated by factors that can adversely affect health outcomes of the mother, fetus, or infant. Pregnancy complications like gestational diabetes, hypertension, and pre-eclampsia can lead to childbirth complications such as eclampsia and cardiomyopathy and result in adverse pregnancy outcomes including preterm birth and HELLP syndrome. In 2018, pregnancy and childbirth complications affected 19.6% and 1.7% of pregnancies, respectively, in the U.S. [1]. Pregnant people who have complications during pregnancy are twice as likely to have childbirth complications than those who did not have complications [1]. Risk factors for complications include advanced or young maternal age, maternal health problems, multiple pregnancy, and pre-existing health conditions (e.g., diabetes, high blood pressure) [16]. Moreover, systemic disparities in pregnancy and childbirth complications are well-documented. Black women are significantly more likely to develop preeclampsia and more than three times more likely to die from pregnancy-related complications than White women [28]. Fortunately, timely and appropriate clinical intervention can effectively manage complications during pregnancy and reduce maternal, fetal, and neonatal morbidity and mortality [18, 34, 10, 30, 31]. For example, use of antiplatelet agents and calcium supplements has been shown to reduce pre-eclampsia onset by 40%-60% [18]. Increased physical activity from pre-gestation, up to 20 weeks gestation reduces the risk for gestational diabetes [34] and hypertension [10], and early treatment for gestational diabetes reduces adverse outcomes [30] and decreases rates for pre-eclampsia [31].
Health plan operated care management programs for high-risk pregnancies aim to coordinate care for at-risk members across their clinical care team, educate members about their conditions and medications and provide education and support managing their conditions [14, 25, 3, 23, 29]. The impact of care management interventions depends in part on the health plan’s ability to identify members at risk for high-risk pregnancies and adverse pregnancy outcomes in a timely, accurate, and efficient manner. This prerequisite is challenged by the latency between the patient’s obtaining a positive pregnancy diagnosis from a care provider and when that information reaches the health plan in the form of a medical claim. Further complicating matters is the fact that most health plans pay providers by Diagnosis Related Groupings (DRGs) for perinatal, delivery, and some post-natal care rather than on a per-claim basis.
In this work, we collaborate with the High-Risk Pregnancy (HRP) care management team at Independence Blue Cross (IBC) based in Philadelphia, Pennsylvania. We aim to improve the member identification process in which nurse case managers review relevant clinical information and make decisions about which members are most appropriate for the HPR program. The process begins with ML algorithms and clinical decision rules to identify pregnant and at-risk members from medical claims which are served to nurse case managers for review and final determination of program eligibility and appropriateness. Once identified, program staff make outreach phone calls to enroll eligible members in the program. Once enrolled in the program, nurses work with members to educate them about their condition and risks, understand how to manage symptoms and medications, and coordinate care with providers. Automated mechanisms for member risk identification and stratification are critical to efficiently identify pregnant and at-risk members from a large member population. We conducted structured interviews with the care managers to understand the identification and stratification process and discover opportunities to improve it. These conversations highlighted that members being surfaced for evaluation are often no longer pregnant, and have a low risk of pregnancy complications. The nurses also lacked insight into why the algorithms and processes surfaced a member for evaluation.
Our first task was to improve the latency with which pregnant members are identified. Our second task was to accurately identify members at high risk for pregnancy complications. However, not all complications of pregnancy can be effectively remediated through telephonicly delivered care management. Following the care manager’s recommendations, the outreach and education delivered in HRP program would be most impactful for members with gestational diabetes and gestational hypertension. We developed a machine learning predictor that can adapt to the underlying population for both identification of pregnant members and the prediction of complication risk. Much of the existing literature on pregnancy identification focuses on retrospective identification of pregnancy episodes [22, 5, 20, 2, 33]. Our goal was to identify pregnancy in a near real-time fashion as information about the member becomes available through medical and pharmacy claims, lab results, authorizations, and admit, discharge, and transfer data. Although there is extensive literature on predicting pregnancy complications using machine learning [4, 9, 15, 21, 19], we focus specifically on gestational hypertension and diabetes and making risk predictions as early as possible. To train our predictive models, we construct two datasets from the IBC insurance claims data: a cohort of 36755 members for pregnancy identification and a separate 12243 cohort for pregnancy complications.
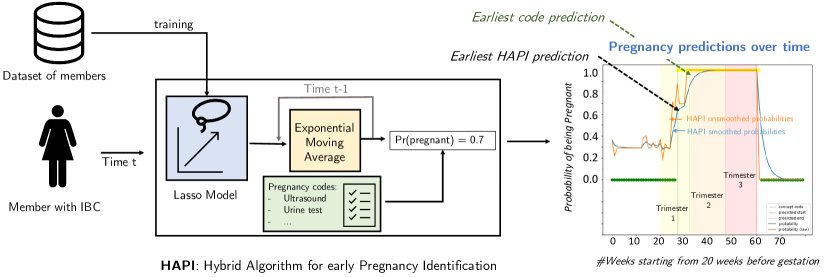
Prior literature on identifying pregnancy episodes focused on a list of selected claims codes [20], we developed a novel Hybrid Algorithm for Pregnancy Identification (HAPI) that combines manual code lists with machine learning models. In a retrospective evaluation, our method can identify pregnant members earlier on average than predefined code lists. We then train a classifier that predicts for the patient at each point in their pregnancy their risk for developing gestational diabetes or gestational hypertension. In our setting, the model’s output is used directly by the care manager to make decisions about the fit between the member and the program. For each prediction, we provide a set of diagnosis codes that support the prediction derived from the linear model weights. This evidence is integrated into a user interface enabling the nurse case managers to verify the algorithmic prediction. Finally, we conduct a set of user studies with the care managers that simulate how models will be deployed in practice with a prototype interface.
Methods
Dataset Creation For Pregnancy Identification
| Characteristics | Identification Dataset | Complications Dataset |
|---|---|---|
| No. of patients | 36,735 | 12,243 |
| Race / Ethnicity (%) | 39.1% White, 5.7% Black, 3.4% Other (rest is unreported) | 43.8% White, 5.70% Black and 3.6% Other (rest is unreported) |
| Average Age in years | 32.3 (=6.1) | 32.0 (=6.1) |
| Pregnancy Complication % | 22.6% without complication, 62.4% with complications, 15.0% not pregnant | 73.6% without complication, 26.4% with complications divided into 16.9% with gestational hypertension and 9.4% gestational diabetes |
| Dataset split | 50% training, 25% validation and 25% testing | 60% training, 20% validation and 20% testing |
| Features generated | day windowed features and 12 non-temporal features | day windowed features and 12 non-temporal features |
| Total number of features per patient data point | 112,322 | 62,734 |
To build our pregnancy identification algorithm, we construct a cohort of female members with ages between 18 and 48 who had pregnancies with and without complications and members who were never pregnant between 2004 to 2021. We use the algorithm in [22] to identify pregnant members and only select members who had a healthy live birth, which allows us reliably identify pregnancy start and end dates. The data set consisted of 36735 members (22.6% pregnancies without complications, 62.4% pregnancies with complications, 15.0% never pregnant) with an average age of 32.3 years. For evaluation purposes, we divide the members into 3 sub-cohorts. The first cohort is pregnancies without complications compromising of members whose most recent pregnancy had a live birth outcome, but no adverse outcome or complications in the same gestational episode. The second cohort is pregnancies with complications consisting of members whose most recent pregnancy had an adverse outcome or complication, e.g. hypertension/pre-eclampsia, ectopic pregnancy, neonatal ICU. Finally, the third cohort consists of never-pregnant members who are Female members of child-bearing age who never entered gestation.
We built the pregnant sub-cohort using the algorithm in [22]. We modify the algorithm to consider other (adverse) pregnancy outcomes, such as onset of pre-eclampsia and newborn admission to the neonatal ICU. The algorithm infers the start and end of the most recent pregnancy episode, and the corresponding pregnancy outcome or complication. This algorithm identifies the gestation episode retrospectively, in comparison with HAPI which identifies gestational episodes in real-time. We describe the high-level algorithm in Figure 2 and define the full algorithm in the supplemental information Dataset Creation Algorithm for Pregnancy Identification. Note that members in the no complications sub-cohort are those returned by the algorithm with a "live birth" outcome; all remaining members belong to the sub-cohort with complications. We built the never-pregnant sub-cohort by sampling female members who never have codes indicating gestation start or pregnancy outcome, according to the age distribution of the pregnant sub-cohort.
We use members’ medical histories to construct features for the pregnancy identification model. We derive pregnancy labels using the dates of pregnancy start () and outcome codes (). The process for each sub-cohort is described in Figure 3. For pregnant members, we sample data from 20 weeks before pregnancy start to 20 weeks after the pregnancy outcome is observed (approximately 80 weeks, assuming 40 week gestation period), to allow for early pregnancy and non-pregnancy indicators to be learned, while avoiding signal from previous pregnancies. Data is sampled once a week. For never-pregnant members, we sample 80 weeks of data, around the midpoint of their medical history.
For each data point, we generate non-temporal and temporal features from medical data. For temporal data, we construct windowed features, which aggregate the data within a specified backward time window and map them to a binary indicator feature indicating whether the billing codes occurred or not during that time window. Windowed features for 5-day and 10-day windows are generated using omop-learn [17], a Python machine learning package for OMOP CDM, for the following categories: medical conditions, prescriptions, procedures, specialty visits, and labs. We remove pregnancy start codes and outcome codes, which are used as anchors [12]. We also include 12 non-temporal features, which include age, race, and gender. This gives us a feature set of 62,734 features. The outcome is a binary label indicating whether the member is pregnant at that time. A summary of the dataset is provided in Table 1.
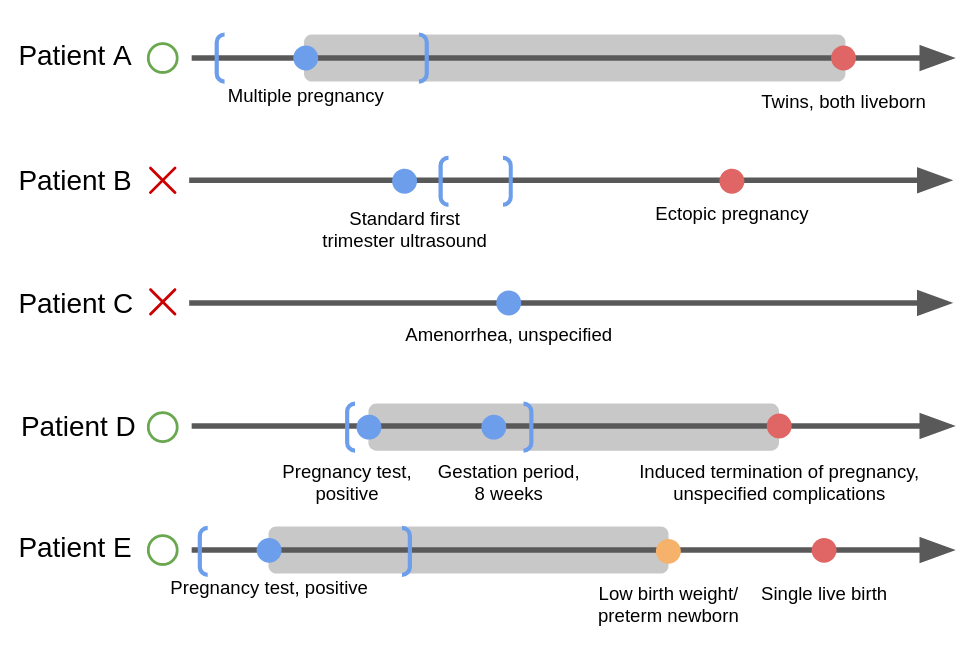
Member B is excluded from the cohort since no pregnancy start code was detected within the lookback window. Member C is excluded since there was no associated pregnancy outcome code; amenorrhea alone cannot indicate pregnancy has started since it can be caused by non-pregnancy-related factors (e.g. stress, menopause).
| (a) | 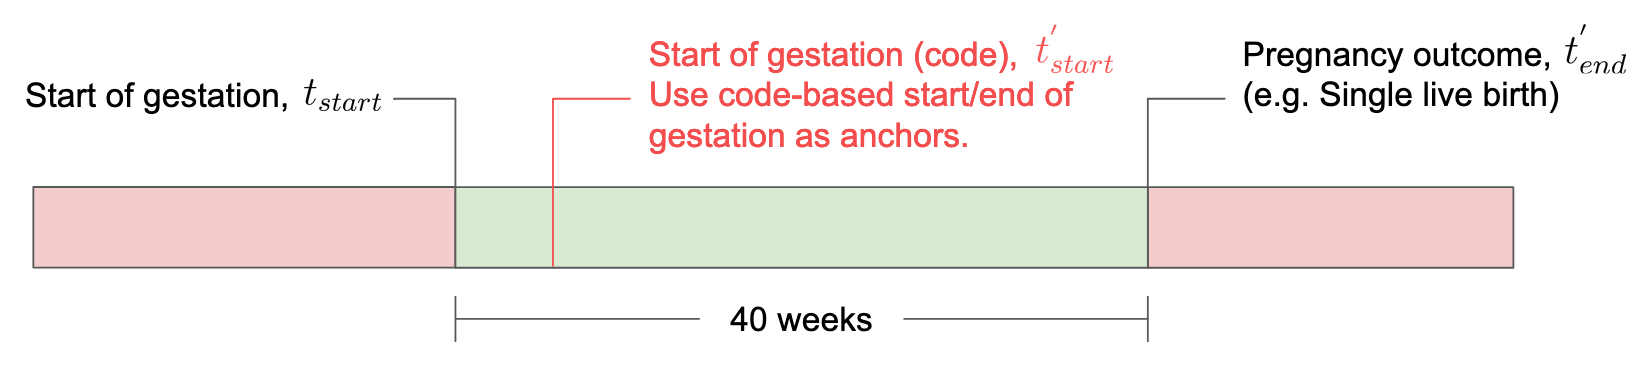 |
|---|---|
| (b) | 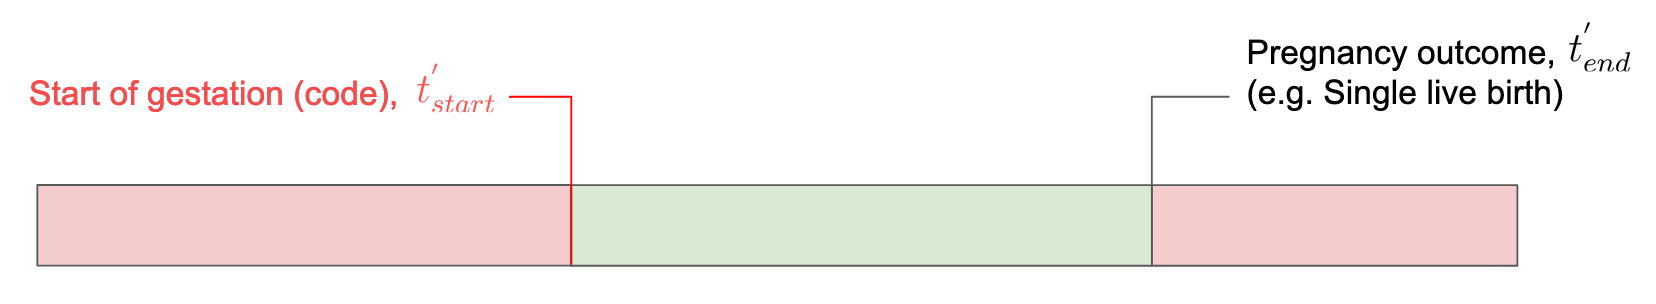 |
Algorithm For Pregnancy Identification
We propose a Hybrid Algorithm for Pregnancy Identification (HAPI) that predicts each week the probability that a member is pregnant. HAPI first relies on a set of carefully chosen clinical codes that indicate either the start or end of pregnancy denoted as ’anchors’. If an anchor code indicating start of pregnancy is available, we set the start of pregnancy at the first week when the code is available, similarly for codes indicating end of pregnancy. We then use a Lasso regularized logistic regression model [35] to train a model predicting whether the patient is pregnant from the features in the dataset. For each sub-cohort, we split the data into train (50%), validation (25%), and test (25%) by members, so no patient data is shared across the different splits. We aggregate all three sub-cohorts to construct the train and validation sets and learn the model on the training set and select hyperparameters with the highest validation accuracy, see supplemental information Hyperparameter Selection for Machine Learning Models for more detail. The model predicts a score in of the likelihood of the member being pregnant at each point in time using their features until time . Importantly, we use the Anchor&Learn approach [12], where we remove the anchors from the feature set of the Lasso algorithm.
We combine the anchors and the Lasso model into a hybrid model that does the following: if there exists a pregnancy start code only then , if there is a pregnancy end code then , otherwise follows the prediction of the Lasso model. After we get the predictions at time as we pass those predictions to an exponential moving average filter. This serves to smooth the predictions over the last 5 time points with a decay factor of to get a result . We then binarize with a learned threshold chosen to maximize the geometric mean of the F1-score of the pregnancy predictions to obtain a binary prediction . This process is performed at each time stamp for the member’s data. We predict the pregnancy start date as the first instance of time where is and we have two consecutive increase scores , similarly, we predict the pregnancy end date as the instance of time is and we have two consecutive decreasing scores (given we already predicted the start). This is explained further in the supplemental information Algorithm For Pregnancy Identification.
Dataset Creation for Pregnancy Complications
After pregnant members are identified, we have to distinguish between those with a high and low likelihood of developing complications. The case management team identified gestational diabetes (GDB) or gestational hypertension (GHT) as specific complications that could be effectively managed within the HRP program. Though differentiating between gestational hypertension and chronic hypertension does not help with establishing pregnancy risk [36], we model gestational hypertension (hypertension onset during pregnancy) since chronic hypertension can be inferred simply by querying codes in the member’s history. Our approach is to build a calibrated machine learning classifier that given a patient’s data can predict the risk of them developing either gestational diabetes or hypertension. Moreover, the classifier can provide a list of the patient features that led to the prediction as a form of explanation.
To train and evaluate our classifier, we collaborated with the nurse case managers to compile a list of codes that indicate pregnancy episodes with gestational diabetes and gestational hypertension. We queried for pregnancy episodes with a gestational diabetes ICD 10 code (O24.11-O24.93) using ATLAS [27]. We then filtered for unique diagnosis codes within those episodes and selected the most frequently occurring diagnosis codes as the initial set of target codes for gestational diabetes outcomes. The same procedure was repeated for gestational hypertension/pre-eclampsia (ICD 10 code O10.011-O16.9). We validated the code set with the care management nurses, who hand-labeled outcome codes for a subset of 20 members, given data up to the end of the pregnancy episode. This allowed us to (1) validate that the existing codes are indicative of the corresponding outcome, and (2) find new codes indicative of an outcome. For example, Methyldopa 250 MG Oral Tablet, an anti-hypertensive drug, was added as a code for gestational HT/PE.
To build a cohort of pregnant members, including ones with gestational diabetes and hypertension complications, we again referred to our pregnancy cohort selection algorithm. We select the subset of members with outcomes: live birth (no complication), gestational hypertension, and gestational diabetes. We then select a set of 12,243 members where 73.6% are live births, 16.9 % have gestational hypertension and 9.4% have gestational diabetes. We divide the members into 20% for testing and 80% for training and validation. We use the medical data to construct features for the risk model. To ensure our data is properly distributed across different stages of pregnancy, we sample 10 data points for each member, uniformly distributed across the following time slices: 3 months before pregnancy start, trimester 1, trimester 2, and trimester 3.
Similar to pregnancy identification, we generate non-temporal and temporal features for each sampled point. For temporal data, we generate windowed features for 30 day, 180 day, 365 day, 730 day, and 10k day windows using omop-learn for the following categories: medical conditions, prescriptions, procedures, specialty visits, and labs. We also include 12 non-temporal features, which include age, race, and gender. This gives us a feature set of 112,322 features. We fit several standard classification algorithms – Lasso (L1-regularized), ELASTIC-NET (L1 and L2-regularized), and XGBOOST (gradient-boosted tree) by using the training set and the validation set to pick hyperparameters. We also fit Lasso models for different subcohorts of the population depending on prior history of diabetes or hypertension, four models in total.
Extracting Evidence for Predictions
The predictions of both the pregnancy identification algorithm and the pregnancy complications classifier are reviewed by the care management team to make final decisions about who is pregnant and who is most likely to have a complication. Therefore, it is essential that we provide information to the nurses as to why a certain patient had the given predictions. The information we aim to provide is a list of claim codes that had the most effect on the model making its prediction and the polarity of the effect, e.g. did a particular code influence the model to predict that the patient is pregnant or not pregnant.
For pregnancy identification with HAPI, for each patient, we surface all anchor codes if they are available and we then surface the highest weighted features (by absolute value) according to the Lasso model that are present for the patient (each patient has different claim codes that are present).
For predicting pregnancy complications of gestational diabetes or gestational hypertension, the Lasso classifier top features by model weight of Lasso include many variants of diabetes and hypertension codes since the prior history of these conditions is highly predictive of GDB and GHT. However, there are a nontrivial number of members who have no prior history of these conditions, and they may be affected by a different set of risk factors. To better model this discrepancy, we partition our dataset, conditional on prior history of diabetes and hypertension, and train a separate Lasso model on each of the four subsets: no prior history, history of both conditions, and history of either condition. We call these models GROUP-Lasso models. For a given patient, the prediction follows the global Lasso model but to extract evidence for the prediction, we extract the highest weighted features from the GROUP-Lasso model that the patient belongs to depending on their prior history of DB or HT.
User Study Design
Our main evaluation of HAPI and our pregnancy complications classifier is a retrospective evaluation of performance, however, this evaluation does not mirror how the algorithms will be deployed exactly. The algorithms never make the final decision on who is deemed to be pregnant or at risk, rather, it is a collaboration between the algorithm and the care managers forming a human-AI team that makes decisions. We design two user studies that simulate how HAPI and the complications classifier will be deployed where a care manager assesses in a simulation environment member patients. All studies in this work were ruled exempt (#E-4242) by the Massachusetts Institute of Technology Committee on the Use of Humans as Experimental Subjects under the criteria defined by Federal regulation 45 CFR 46
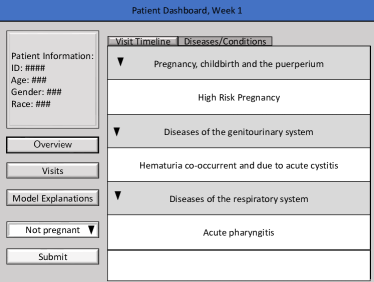
With input from the nurse care managers, we built a dashboard mimicking the actual dashboard used by the nurses in the HRP program to surface medical history available in insurance claims and other data sources (e.g. visits, diagnosis codes, demographics). The dashboard is shown in Figure 4(a). For testing HAPI, we perform a study with a single nurse under two conditions A) with the predictions and evidence of HAPI and B) without any algorithmic predictions (control). The nurse makes predictions in each condition for 12 patients where they observe each patient at 5 different time points week-by-week starting from 3 weeks before the pregnancy start date and have to predict if the patient is pregnant at each time point. Each trial took up to an hour.
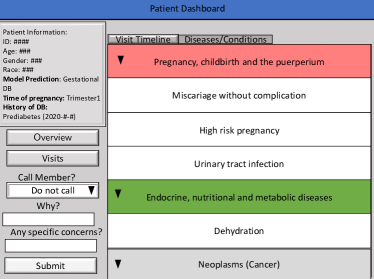
For testing the pregnancy complications classifier, our goal is to evaluate (1) if the model predictions can aid enrollment decisions, and (2) if model evidence can help nurses develop more insight into the member before outreach. To this end, we run three trials where the nurses make decisions on patients – A) one without predictions or evidence, B) one with predictions, and C) one with both predictions and evidence, with each of two nurses (referred to as Nurse 1 and Nurse 2) from the pregnancy care management program (six trials total). In each trial, the nurse makes predictions on 18 members retrospectively, the 18 members are chosen to represent the entire population. Based on feedback from the study with HAPI, we modified the simulated member dashboard to first display more patient data including indications of abnormal lab values, we also highlighted under patient information whether they have a history of GDB, GHT, diabetes, hypertension, and pre-ecmplasia. We also integrated the model evidence more naturally in the dashboard by highlighting codes that are positively (green) or negatively (red) associated with the prediction in each window, instead of a separate model evidence (explanation) window. A sketch of the interface is shown in Figure 4(b). For each member, we asked the nurse if they would call the member, and if they thought the patient would develop GDB, GHT, both GDB and GHT, or another complication.
 |
 |
| (a) Pregnancy Identification Interface | (b) Pregnancy Complications Interface |
Statistical analysis
For obtaining confidence intervals for AUC we use a method computed using a distribution-independent method based on error rate and the number of positive and negative samples introduced in [8]. For obtaining confidence intervals for accuracy and FNR/FPR metrics, we use the Wilscon score interval. We use McNemar’s test to compare ordinal data proportions and paired t-tests to compare numerical data.
Results
Identifying Pregnancies From Claims Data
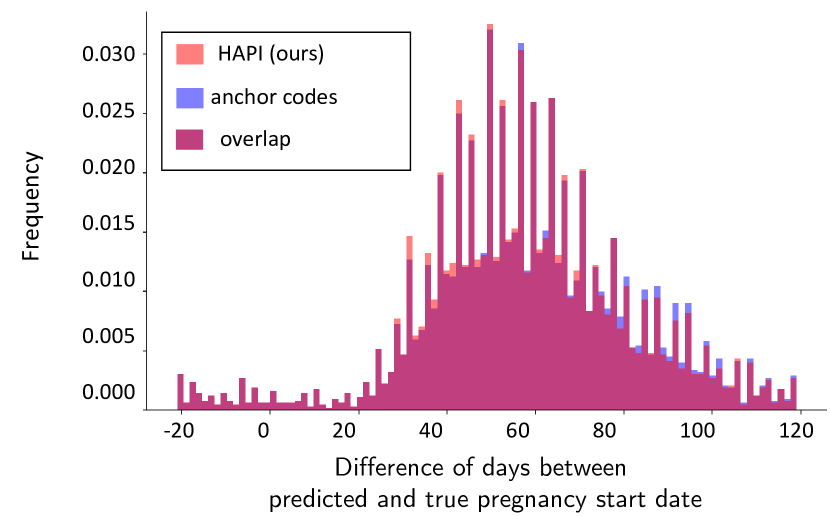
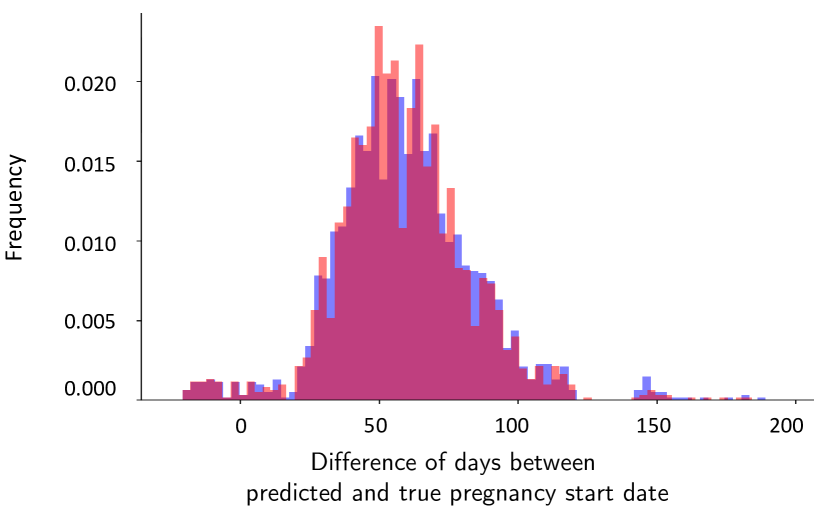
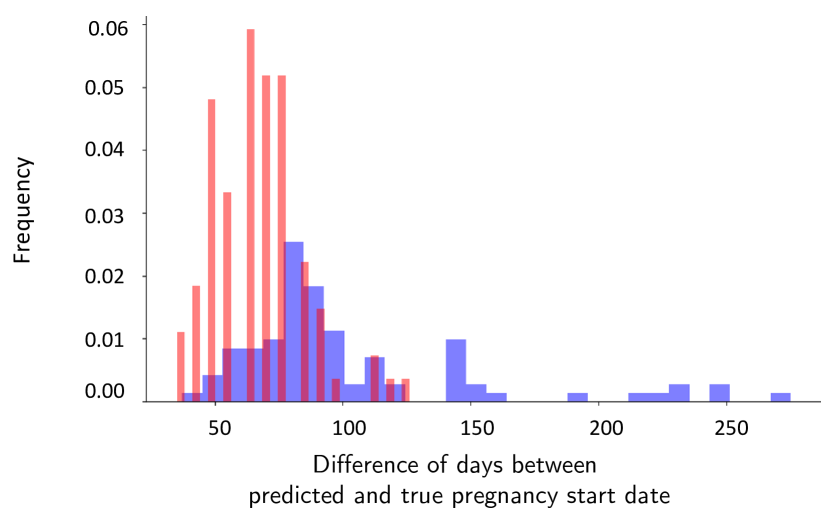
We evaluate HAPI on a test set of 9183 members randomly selected from the dataset. We compare the performance of HAPI against the baseline of only using anchor pregnancy codes for the detection of pregnancy start [20]. We measure for HAPI and the anchor codes the difference between the predicted start date and the actual pregnancy start date. The actual pregnancy start date is obtained by subtracting 40 weeks from the exact date of birth.
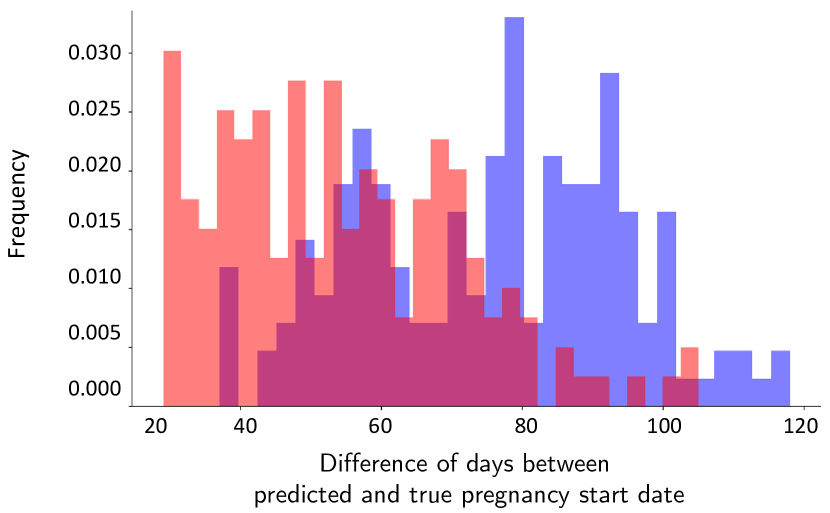
We show the histogram of the difference between the predicted start date and the actual date for members with complications in Figure 5 for both the anchor codes and our proposed algorithm. To not overestimate the performance of our algorithm, we shift the predictions of HAPI that occur more than a month before the actual pregnancy start date to occur at the same time as the baseline. For example, if the predicted pregnancy start date was June and the actual start date was July we shift the predicted start date to July. Compared to using anchor codes alone, HAPI predicts an earlier start date for 3.54% (95% CI 3.05-4.00, z=14.5, p=1.2e-47) of members with pregnancy complications and 4.29% (95% CI 3.42-5.16, z=9.6 p=5.2e-22) earlier for pregnancies without complications. For the members with complications who are predicted earlier by HAPI, the average difference between the predictions and the actual start date is 54.3 days compared to 75.6 days for the anchor codes (). For members without complications the average difference is 66.9 days compared to 102.5 days (), respectively. However, when we look at all the test set the average difference is 1 day earlier for HAPI compared to the anchor codes on members with and without complications which is not statistically significant.
The model predicts that 5.58% (95% CI 4.05-6.40) of non-pregnant members are in fact pregnant (false positive rate). HAPI can be adjusted using the Lasso model threshold to reduce the false positive rate at the expense of detecting pregnancies later in time. In this cohort of false positives, the top features surfaced include labs for urinalysis, immature granulocytes, and specialty visits to an obstetrician or gynecologist which can be made outside of pregnancy, e.g. for fertility or menstruation issues. A table of these features is available in the supplementary material.
Predicting Pregnancy Complications
| Accuracy | AUC | |||
|---|---|---|---|---|
| Mean | 95% CI | Mean | 95% CI | |
| Lasso (L1) | 0.768 | 0.762-0.773 | 0.761 | 0.754-0.767 |
| ELASTIC-NET (L1+L2) | 0.713 | 0.707-0.719 | 0.736 | 0.729-0.742 |
| XGBOOST | 0.687 | 0.681-0.692 | 0.770 | 0.764-0.775 |
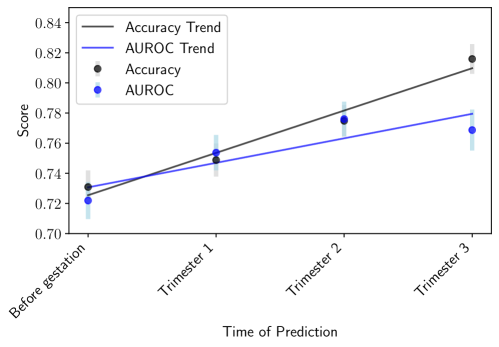
After pregnant members are identified, we have to distinguish between those with a high and low likelihood of developing complications. In Table 2, we compare the performance of different machine learning classifiers at predicting whether a patient will develop gestational diabetes or gestational hypertension or neither. We find that the best-performing model in terms of accuracy is a Lasso regularized logistic regression model which achieves an average accuracy of 76.8% (95% CI 76.2-77.3) at predicting complications across each test patient pregnancy and AUC of 0.761 (95% CI 0.754-767). The Lasso model is able to achieve an accuracy of 73.1% (95% CI 72.9-74.2) and AUC of 0.722 (95% CI 0.710-734) when predicting three months before the start of the patient’s pregnancy. This indicates that there is signal at the start of the pregnancy to triage patients by risk of complications. To assess model performance at different stages of pregnancy, we evaluate the Lasso model when predicting on patient’s data in each trimester and before gestation. To do this, we trim each member’s data until the desired date of prediction and then predict using the Lasso model, the results are in Figure 6. While confidence intervals do not overlap consistently across time periods, the metrics generally increase as we progress to later pregnancy terms, indicating that the model performs better as we see more data on the member.
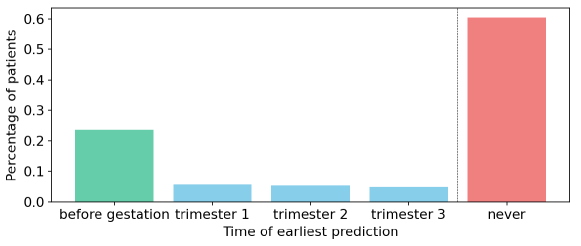
Additionally, we evaluate how early the model is catching pregnancy complications and plot the distribution of the earliest risk predictions for members at risk of gestational diabetes or hypertension in Figure 7. This figure is obtained by setting a threshold of 0.5 on the outputs of the Lasso model. While the Lasso model has a high false negative rate of 57.4% (95% CI 53.5-61.2), of the members with true positive predictions (37.6%), a majority are caught before gestation (59.6% with 95% CI 53.1-65.5 ). This is important since early intervention and treatment are important in reducing gestational diabetes and hypertension risk [34, 30, 31, 13, 37].
In Table 11 we show the performance of our proposed predictor GROUP-Lasso that conditions on the patient’s prior history of disease and predicts using separate Lasso models for each sub-group compared to the global Lasso model. Modeling outcomes for separate groups increases accuracy as the predictions become better calibrated but sacrifices ranking ability in terms of AUC. The advantage of GROUP-Lasso is that the features surfaced as explanations by the sub-group models show information beyond prior history may be useful for the care managers. Therefore, we use the global Lasso model to make predictions but use GROUP-Lasso to surface features as an explanation.
 |
Prior work has shown that care management risk algorithms may contain racial bias due to nuances in how outcomes are defined [26]. Moreover, there exist systemic health disparities in maternal and infant mortality rates, e.g. Black people have mortality rates over three times higher than White people during pregnancy (40.8 v. 12.7 per 100,000 live births) [28]. To this end, we audit our algorithm for potential racial bias. We report evaluation metrics in Table 3 for the three most common race groups (White - 43.8%, Black - 5.7%, Other - 3.6%). Other race category includes race outside of the following: American Indian or Alaska Native, Black or African American, White, Asian, Hispanic or Latino, Native Hawaiian or Other Pacific Islander. We note that accuracy for the White group is 77.4% (95% CI 76.7-78.2) compared to a lower accuracy for the Black group at 68.1 (95% CI 65.6-70.5). However, the AUC for the White group is 0.740 (95% CI 0.730-75.0) which is lower than that of the Black group 0.787 (95% CI 0.765-0.808). This may be due to differences in class distribution, since the Black subgroup has much higher rates of complication (44.0%), compared to White (24.6%) and Other (25.9%) races. True positive rates of catching complications are 36.6%, 27.1%, and 30.0%, for Black, White, and Other subgroups, respectively. Race data for this analysis comes from electronic medical records with low coverage for race attribution (only of members have some member-level race attributed to examine bias), so true error rates may differ from those reported here.
| Accuracy (95% CI) | AUC (95% CI) | |
|---|---|---|
| White | 0.774 (0.767, 0.782) | 0.740 (0.730, 0.750) |
| Black | 0.681 (0.656, 0.705) | 0.787 (0.765, 0.808) |
| Other | 0.792 (0.765, 0.819) | 0.826 (0.798, 0.854) |
User Studies
In the user study for pregnancy identification, in both conditions, the nurse correctly identified 5 of the 8 pregnant members. Among those, 4 were predicted by HAPI without any of the anchor codes present. The nurse correctly identified one additional pregnant member when given the algorithm predictions and explanations. The nurse correctly identified all four non-pregnant members in both conditions. Notably, in each trial, we introduced a patient who was falsely detected by the model to be pregnant, but the care manager was successfully able to recognize this incorrect prediction.
In the user study for pregnancy complications, we note that the inclusion of the model prediction and prior history seemed to improve the nurse’s accuracy at predicting whether a patient will develop GDP or GHT. Nurse 1 had an accuracy of 56% without the model, 72% with the model prediction only, and 67% with model prediction and evidence. Similarly, nurse 2 had an accuracy of 33% without the model, 56% with the model prediction only, and 67% with model prediction and evidence. Note that due to the small sample size of the studies, all increases in accuracy are not statistically significant. We observed that prior history was heavily relied upon in trials B and C where the algorithm and prior history were provided. When we include model evidence (trial B versus C), nurses were less reluctant to parse through the history of members’ clinical codes and thus included more information beyond prior knowledge. Nurse 1 explained that prior history of diabetes/hypertension or complications in a previous pregnancy is usually sufficient to make a call, but additional information such as distinct risk factors for complications (e.g. polycystic ovary syndrome, cervical incompetence) or elevated labs from recent visits can help them build a better profile of the member and identify those at immediate risk. Both nurses indicated that prior history and highlighted evidence helped with obtaining this information more quickly. The evidence helped them focus on important visits and codes, especially when the visit history was lengthy. Nurse 2 said that although not all evidence was useful or made sense, it is easy to filter out the irrelevant ones, i.e. surfacing useful codes should be prioritized over surfacing a few codes.
In follow-up interviews and discussions, the nurses expressed a preference for the dashboard used in the user study compared to their previous systems. Moreover, by having the information readily available with the pregnancy indicator algorithm, the nurses noted that they could easily identify whether the member had any history of pregnancy complications or current issues in the pregnancy. The nurses were able to determine right away if the member had a potential risk and would be able to remake an outreach call to the member. This saves an enormous amount of time for the nurses as they no longer need to access the claims system to review several years of claims data to decipher whether the member is even pregnant let alone if they have any potential risk factors.
Discussion
In this study, we developed a machine learning system for the early detection of pregnancy and the identification of high-risk members. We introduced a novel algorithm that identifies whether a member is pregnant from insurance claims data by combining indicators for pregnancy start and end with machine learning predictors. We found that it identifies for 3.54% members an earlier pregnancy start data compared to concept codes and has only a 5.58% false positive rate. The model identifies members who may have started pregnancy visits later in their term since for example, they tested for pregnancy using at-home tests. This could be a reason to offer cost-free pregnancy tests at local clinics so members are incentivized to get tested formally, and in turn, the insurance company obtains data to identify pregnant members earlier. A large proportion of these members also tend to be high risk, which is exactly who we want to identify early for early intervention and treatment. Leveraging this information, we then identified members at the greatest risk for pregnancy complications so that care managers can provide timely and effective support. Using predictors of gestational diabetes and gestational hypertension, our model achieved an AUC performance of 0.768.
We followed a human-centered design methodology and showed that it can improve the care management program for high-risk pregnancies at IBC. Because care managers are often faced with limited and fragmented interactions with patients, we conducted extensive discussions and interviews with care managers of the HRP program to identify their current needs and greatest challenges. These insights—combined with insurance claims—can help early detection of pregnancy, accurate identification of impactable high-risk members, and provision of explainable indicators to supplement predictions. We show that when actively engaging critical stakeholders like the care managers, machine learning systems can guide care management to prevent pregnancy complications.
We then set up a mock enrollment dashboard and evaluated these methods across two user studies and found two key findings. First, the pregnancy identification algorithm helps nurses identify pregnancies earlier while correctly filtering out false-positive members. Second, showing the pregnancy complication model’s prediction and prior history of chronic conditions improves nurses’ performance metrics when deciding who to call. We hope that our results can serve as a call to action for similar predictive models used to allocate care. In a recent report in the Journal of Biomedical Informatics, researchers advocated for more overlap in human-computer interaction and clinical decision-making tasks to improve precision medicine [32]. Our work expands on those topics to empower the domain experts and primary users of our system. We found that comprehensive needs-finding interviews with the care managers greatly enhanced our targeted ML system. Not only were we able to focus on the most salient problems facing care managers, but the resulting ML system also has better resource allocation for pregnancy patients.
Our study opens several areas for future work. As with any machine learning system, continual validation of our models across time is key to ensuring robust and generalizable performance. Predictors of early pregnancy detection and predictors of high-risk pregnancy may change over time due to improvements in health technology and patterns of healthcare utilization. Computational work in transfer learning and robustness can help adapt our models over time with minimal adjustment. Additionally, topics of pregnancy may raise questions about patient privacy. Our model keeps patient data completely private except for the minimal set of relevant care managers; however, advances in patient privacy protection may also be relevant.
Limitations
There are limitations to our study that need to be addressed. In Figure 7, we stratify the population by when our ML system provided a relevant alert. Unfortunately, 60% of the alerts are never sounded for patients who have complications. This gap in our model performance is likely due to the sparsity of insurance claims and the delay of visits by the patients, both challenges often faced by models working with healthcare data [6]. We are also concerned with the disparate impact of the ML system on different patient subpopulations, particularly historically vulnerable groups. Health insurers are actively creating best practices for auditing and improving algorithmic bias with the first step being the measurement of existing bias [11]. In Table 3, we show the performance of the detection algorithm on White, Black, and Other race patients. The lower accuracy of Black patients compared to White or Other race patients can potentially be explained by different base rates. When different subgroups have different base rates, competing definitions of algorithm fairness may conflict [7]. It is important to better understand sources of health disparities, potentially through gathering additional information such as social determinants of health [24]. Finally,
Conclusion
In conclusion, we have developed novel algorithms for the identification of pregnancy and triage of pregnant members by risk of complication. The development of these algorithms and their subsequent evaluations followed a human-centered design methodology with extensive collaboration with the high-risk pregnancy care managers at IBC. Thus we demonstrated that the active engagement of key stakeholders like care managers can substantially improve the clinical workflow and quality of care given by care managers for pregnancy patients.
Author Contributions
Conception and design: H.M., Y.U., D.S., S.G., A.S.
Model Development: H.M., Y.U.
User Study Development: Y.U
Data Collection: H.M., Y.U., M.E.
Data analysis: H.M., Y.U.
Data Interpretation: H.M., Y.U., I.C., D.S., S.G., A.S.
Supervision: D.S.
Manuscript writing: H.M., Y.U., I.C., D.S., S.G., A.S., M.E.
Acknowledgments
H.M., Y.U., I.C. and D.S. were supported by a grant from Independence Blue Cross.
Competing Interests
The research was financially supported by a grant from Independence Blue Cross, which also contributed the data for the study. The sponsor collected the data, reviewed the manuscript, and approved the decision to submit the manuscript for publication. H.M., Y.U., I.C. and D.S. were supported by the grant. M.E., S.G., A.S. are employees of Independence Blue Cross.
Data Availability
The datasets generated and analyzed during the current study are not publicly available as they contain insurance claims data and demographic data (including age and ethnicity) of members insured by Independence Blue Cross and the data is de-identified but not anonymous.
References
- [1] Trends in Pregnancy and Childbirth Complications in the U.S. https://www.bcbs.com/the-health-of-america/reports/trends-in-pregnancy-and-childbirth-complications-in-the-uspre-ex, june 2020. Accessed:2022-5-10.
- [2] E. C. Ailes, R. M. Simeone, A. L. Dawson, E. E. Petersen, and S. M. Gilboa. Using insurance claims data to identify and estimate critical periods in pregnancy: An application to antidepressants. Birth Defects Research. Part A, Clinical and Molecular Teratology, 106(11):927–934, Nov. 2016.
- [3] J. W. Alexander and M. C. Mackey. Cost Effectiveness of a High-Risk Pregnancy Program. Care Management Journals, 1(3):170–174, Jan. 1999.
- [4] A. Bertini, R. Salas, S. Chabert, L. Sobrevia, and F. Pardo. Using machine learning to predict complications in pregnancy: A systematic review. Frontiers in bioengineering and biotechnology, 9:1385, 2022.
- [5] P.-O. Blotière, A. Weill, M. Dalichampt, C. Billionnet, M. Mezzarobba, F. Raguideau, R. Dray-Spira, M. Zureik, J. Coste, and F. Alla. Development of an algorithm to identify pregnancy episodes and related outcomes in health care claims databases: An application to antiepileptic drug use in 4.9 million pregnant women in France. Pharmacoepidemiology and Drug Safety, 27(7):763–770, 2018. _eprint: https://onlinelibrary.wiley.com/doi/pdf/10.1002/pds.4556.
- [6] I. Y. Chen, E. Pierson, S. Rose, S. Joshi, K. Ferryman, and M. Ghassemi. Ethical machine learning in healthcare. Annual review of biomedical data science, 4:123–144, 2021.
- [7] A. Chouldechova and A. Roth. The frontiers of fairness in machine learning. arXiv preprint arXiv:1810.08810, 2018.
- [8] C. Cortes and M. Mohri. Confidence intervals for the area under the roc curve. Advances in neural information processing systems, 17, 2004.
- [9] C. Espinosa, M. Becker, I. Marić, R. J. Wong, G. M. Shaw, B. Gaudilliere, N. Aghaeepour, D. K. Stevenson, I. A. Stelzer, L. S. Peterson, et al. Data-driven modeling of pregnancy-related complications. Trends in molecular medicine, 27(8):762–776, 2021.
- [10] Y. Gao, S. Ren, H. Zhou, and R. Xuan. Impact of Physical Activity During Pregnancy on Gestational Hypertension. Physical Activity and Health, 4(1):32–39, Apr. 2020. Number: 1 Publisher: Ubiquity Press.
- [11] S. S. Gervasi, I. Y. Chen, A. Smith-McLallen, D. Sontag, Z. Obermeyer, M. Vennera, and R. Chawla. The potential for bias in machine learning and opportunities for health insurers to address it: Article examines the potential for bias in machine learning and opportunities for health insurers to address it. Health Affairs, 41(2):212–218, 2022.
- [12] Y. Halpern, S. Horng, Y. Choi, and D. Sontag. Electronic medical record phenotyping using the anchor and learn framework. Journal of the American Medical Informatics Association, 23(4):731–740, 2016.
- [13] V. A. Holmes, I. S. Young, C. C. Patterson, D. W. Pearson, J. D. Walker, M. J. Maresh, D. R. McCance, and for the Diabetes and Pre-eclampsia Intervention Trial Study Group. Optimal Glycemic Control, Pre-eclampsia, and Gestational Hypertension in Women With Type 1 Diabetes in the Diabetes and Pre-eclampsia Intervention Trial. Diabetes Care, 34(8):1683–1688, July 2011.
- [14] C. S. H. Hong. Caring for High-Need, High-Cost Patients: What Makes for a Successful Care Management Program? Technical report, Commonwealth Fund, New York, NY United States, Aug. 2014.
- [15] M. N. Islam, S. N. Mustafina, T. Mahmud, and N. I. Khan. Machine learning to predict pregnancy outcomes: a systematic review, synthesizing framework and future research agenda. BMC Pregnancy and Childbirth, 22(1):1–19, 2022.
- [16] M. Janice L. Henderson. High-risk pregnancy: What you need to know, 2022.
- [17] R. Kodialam, R. Boiarsky, J. Lim, A. Sai, N. Dixit, and D. Sontag. Deep contextual clinical prediction with reverse distillation. In Proceedings of the AAAI Conference on Artificial Intelligence, volume 35, pages 249–258, 2021.
- [18] Z. S. Lassi, T. Mansoor, R. A. Salam, J. K. Das, and Z. A. Bhutta. Essential pre-pregnancy and pregnancy interventions for improved maternal, newborn and child health. Reproductive Health, 11(1):S2, Aug. 2014.
- [19] S. Li, Z. Wang, L. A. Vieira, A. B. Zheutlin, B. Ru, E. Schadt, P. Wang, A. B. Copperman, J. L. Stone, S. J. Gross, et al. Improving preeclampsia risk prediction by modeling pregnancy trajectories from routinely collected electronic medical record data. NPJ Digital Medicine, 5(1):68, 2022.
- [20] S. C. MacDonald, J. M. Cohen, A. Panchaud, T. F. McElrath, K. F. Huybrechts, and S. Hernández-Díaz. Identifying pregnancies in insurance claims data: Methods and application to retinoid teratogenic surveillance. Pharmacoepidemiology and Drug Safety, 28(9):1211–1221, Sept. 2019.
- [21] J. M. Machado, A. Abelha, M. Santos, F. Portela, E. Pereira, and A. Brandão. Predicting the risk associated to pregnancy using data mining. SCITEPRESS, 2015.
- [22] A. Matcho, P. Ryan, D. Fife, D. Gifkins, C. Knoll, and A. Friedman. Inferring pregnancy episodes and outcomes within a network of observational databases. PLoS ONE, 13(2):e0192033, Feb. 2018.
- [23] A. Mate, L. Madaan, A. Taneja, N. Madhiwalla, S. Verma, G. Singh, A. Hegde, P. Varakantham, and M. Tambe. Field study in deploying restless multi-armed bandits: Assisting non-profits in improving maternal and child health. In Proceedings of the AAAI Conference on Artificial Intelligence, volume 36, pages 12017–12025, 2022.
- [24] M. D. McCradden, S. Joshi, M. Mazwi, and J. A. Anderson. Ethical limitations of algorithmic fairness solutions in health care machine learning. The Lancet Digital Health, 2(5):e221–e223, 2020.
- [25] J. A. Meek. Predictive Modeling and Proactive Care Management: Part 1. Professional Case Management, 8(4):170–174, Aug. 2003.
- [26] Z. Obermeyer, B. Powers, C. Vogeli, and S. Mullainathan. Dissecting racial bias in an algorithm used to manage the health of populations. Science, 366(6464):447–453, 2019.
- [27] OHDSI Community. Atlas, 2023.
- [28] E. E. Petersen. Racial/Ethnic Disparities in Pregnancy-Related Deaths — United States, 2007–2016. MMWR. Morbidity and Mortality Weekly Report, 68, 2019.
- [29] J. M. Radin, S. R. Steinhubl, A. I. Su, H. Bhargava, B. Greenberg, B. M. Bot, M. Doerr, and E. J. Topol. The healthy pregnancy research program: transforming pregnancy research through a researchkit app. NPJ digital medicine, 1(1):45, 2018.
- [30] L. Raets, K. Beunen, and K. Benhalima. Screening for Gestational Diabetes Mellitus in Early Pregnancy: What Is the Evidence? Journal of Clinical Medicine, 10(6):1257, Jan. 2021. Number: 6 Publisher: Multidisciplinary Digital Publishing Institute.
- [31] J. A. Rowan, A. Budden, V. Ivanova, R. C. Hughes, and L. C. Sadler. Women with an HbA1c of 41–49 mmol/mol (5.9–6.6%): a higher risk subgroup that may benefit from early pregnancy intervention. Diabetic Medicine, 33(1):25–31, 2016. _eprint: https://onlinelibrary.wiley.com/doi/pdf/10.1111/dme.12812.
- [32] L. Rundo, R. Pirrone, S. Vitabile, E. Sala, and O. Gambino. Recent advances of hci in decision-making tasks for optimized clinical workflows and precision medicine. Journal of biomedical informatics, 108:103479, 2020.
- [33] T. Schink, N. Wentzell, K. Dathe, M. Onken, and U. Haug. Estimating the Beginning of Pregnancy in German Claims Data: Development of an Algorithm With a Focus on the Expected Delivery Date. Frontiers in Public Health, 8, 2020.
- [34] H. J. Teede, C. L. Harrison, W. T. Teh, E. Paul, and C. A. Allan. Gestational diabetes: Development of an early risk prediction tool to facilitate opportunities for prevention. Australian and New Zealand Journal of Obstetrics and Gynaecology, 51(6):499–504, 2011. _eprint: https://onlinelibrary.wiley.com/doi/pdf/10.1111/j.1479-828X.2011.01356.x.
- [35] R. Tibshirani. Regression shrinkage and selection via the lasso. Journal of the Royal Statistical Society: Series B (Methodological), 58(1):267–288, 1996.
- [36] J. A. T. Van Scheltinga, I. Krabbendam, and M. E. Spaanderman. Differentiating between gestational and chronic hypertension; an explorative study. Acta Obstetricia et Gynecologica Scandinavica, 3(92):312–317, 2013.
- [37] B. Vasapollo, G. P. Novelli, G. Gagliardi, G. M. Tiralongo, I. Pisani, D. Manfellotto, L. Giannini, and H. Valensise. Medical treatment of early-onset mild gestational hypertension reduces total peripheral vascular resistance and influences maternal and fetal complications. Ultrasound in Obstetrics & Gynecology, 40(3):325–331, 2012. _eprint: https://onlinelibrary.wiley.com/doi/pdf/10.1002/uog.11103.
Supplemental Information
Dataset Creation Algorithm for Pregnancy Identification
We build on [22], which presents an algorithm for inferring pregnancy episodes across a set of pregnancy outcomes in OMOP Common Data Model. Our modified algorithm can handle a larger set of pregnancy outcomes, e.g. neonatal ICU admission, by doing a forward search to update the outcome once the pregnancy episode is identified. We describe our modified version in Algorithm 1. We illustrate the algorithm in Figure 2 and present a subset of target codes for reference in 4.
| Outcome | Target Codes | Pregnancy ID? | Risk Factors? |
|---|---|---|---|
| Neonatal Intensive Care Unit (NICU) |
Newborn light for gestational age
Low birth weight infant Birth injury to central nervous system Respiratory distress syndrome in the newborn Pulmonary hypertension of newborn |
X | X |
| Hypertension/Pre-eclampsia (HPPE) |
Pre-existing hypertension in obstetric context
Transient hypertension of pregnancy Renal hypertension complicating pregnancy Severe pre-eclampsia Gestational proteinuria |
X | X |
| Pre-term birth |
Preterm premature rupture of membranes
Fetal or neonatal effect of maternal premature rupture of membrane Baby premature, 24-26 weeks Extreme immaturity, 750-999 grams Metabolic bone disease of prematurity |
X | X |
| Gestational Hypertension |
Unspecified maternal hypertension
Gestational [pregnancy-induced] hypertension Hypertension, Pregnancy-Induced gestational proteinuria Mild to moderate pre-eclampsia |
X | |
| Gestational Diabetes |
Gestational diabetes mellitus in childbirth
Diabetes mellitus arising in pregnancy Gestational diabetes mellitus in the puerperium Gestational diabetes mellitus complicating pregnancy Maternal gestational diabetes mellitus |
X |
We build a cohort of patients who were never pregnant throughout their claims history. We sample these patients according to the age distribution of pregnant members (mean: 31.8 years, standard deviation: 4.8 years) and define “never pregnant” to be any member who does not have any of the pregnancy start or outcome concept codes present in their claims history.
Dataset Creation Algorithm for Pregnancy Complication Prediction
In Algorithm 1, the first pass phase that searches for the most recent pregnancy outcome references the original pregnancy outcomes and corresponding target codes defined in [22]. In the second pass phase performs a second search to update the previous outcome, we reference target codes for additional outcomes. We present a subset of target codes for these outcomes and an indicator for when they are used in Table 4
Hyperparameter Selection for Machine Learning Models
For the pregnancy identification LASSO model, we report the hyperparameter search space in Table 5. We select the model with the highest validation accuracy. The decision threshold is chosen to be the geometric mean of sensitivity and specificity on the validation set.
| Hyperparameters | Search Range |
|---|---|
| Regularization strength (C) | 1e-3, 7.5e-4, 5e-4, 2.5e-4*, 1e-4 |
| Tolerance | 1*, 1e-1, 1e-2, 1e-3, 1e-4 |
For the pregnancy complications models, we report the hyperparameter search space in Table 6. Note that we also correct for class imbalance by weighting each class by , where is the proportion of outcomes under class in the training set. We select the model with the highest product of AUROC and accuracy on the validation set.
| Hyperparameters | Search Range | |
| LASSO | Regularization strength (C) | 1, 1e-1, 1e-2, 1e-3*, 1e-4 |
| Tolerance | 1e-1, 1e-2, 1e-3*, 1e-4 | |
| ELASTIC-NET | L1-ratio | 0.25*, 0.5, 0.75 |
| Tolerance | 1e-1*, 5e-2 | |
| XGBOOST | Learning rate | 1e-1*, 1e-2, 1e-3, 1e-4 |
Algorithm For Pregnancy Identification
We formally describe our pregnancy identification algorithm continuing on from the Methods section.
EMA smooth with exponential moving average filter
InferEpisode infer pregnancy start and end (see Alg. 3)
Additional Results for Pregnancy Identification Retrospective Evaluation
We include additional results for our retrospective evaluation of the pregnancy identification algorithm.
| Feature name |
|---|
| 2213418 - procedure - Immunization administration (includes percutaneous, intradermal, subcutaneous, or intramuscular injections); 1 vaccine (single or combination vaccine/toxoid) |
| 2212167 - labs - Urinalysis, by dip stick or tablet reagent for bilirubin, glucose, hemoglobin, ketones, leukocytes, nitrite, pH, protein, specific gravity, urobilinogen, any number of these constituents; non-automated, without microscopy |
| 2108115 - procedure - Collection of venous blood by venipuncture |
| 3050479 - labs - Immature granulocytes/100 leukocytes in Blood |
| 2212996 - labs - Culture, bacterial; quantitative colony count, urine |
| 3033575 - labs - Monocytes [#/volume] in Blood by Automated count |
| 3023314 - labs - Hematocrit [Volume Fraction] of Blood by Automated count |
| 3014576 - labs - Chloride [Moles/volume] in Serum or Plasma |
| 38004461 - specialty - Obstetrics/Gynecology |
| 3015746 - labs - Specimen source identified |
Additional Details for User Studies
We include additional details of our user studies.
| (a) |
|
||||||||||||
|---|---|---|---|---|---|---|---|---|---|---|---|---|---|
| (b) |
|
| Category | Sub-category | # of members | Simulation start date range |
|---|---|---|---|
| Pregnant members detected by model | Detected early within reasonable time (at least 1 month after ) | 2 | |
| Detected too early (before 1 month after ) | 2 | ||
| Pregnant members detected by code | – | 4 | |
| Non-pregnant members | Detected not pregnant | 3 | |
| Detected pregnant | 1 |
| Outcome | Correct Prediction? | Prior History? | Number of Members |
|---|---|---|---|
| Gestational DB | Yes | No DB history | 3 |
| Gestational HT | Yes | No HT history | 3 |
| No complication | Yes | No DB or HT history | 3 |
| Gestational DB | No | No DB history | 1 |
| Gestational HT | No | No HT history | 1 |
| No complication | No | No DB or HT history | 1 |
| Gestational DB | Yes | DB history | 1 |
| Gestational HT | Yes | HT history | 1 |
| No complication | Yes | DB+HT history | 1 |
| Gestational DB | No | DB history | 1 |
| Gestational HT | No | HT history | 1 |
| No complication | No | DB+HT history | 1 |
Additional Results for Pregnancy Complication Prediction Retrospective Evaluation
We include additional results for our retrospective evaluation of the pregnancy complications algorithm.
| (a) | 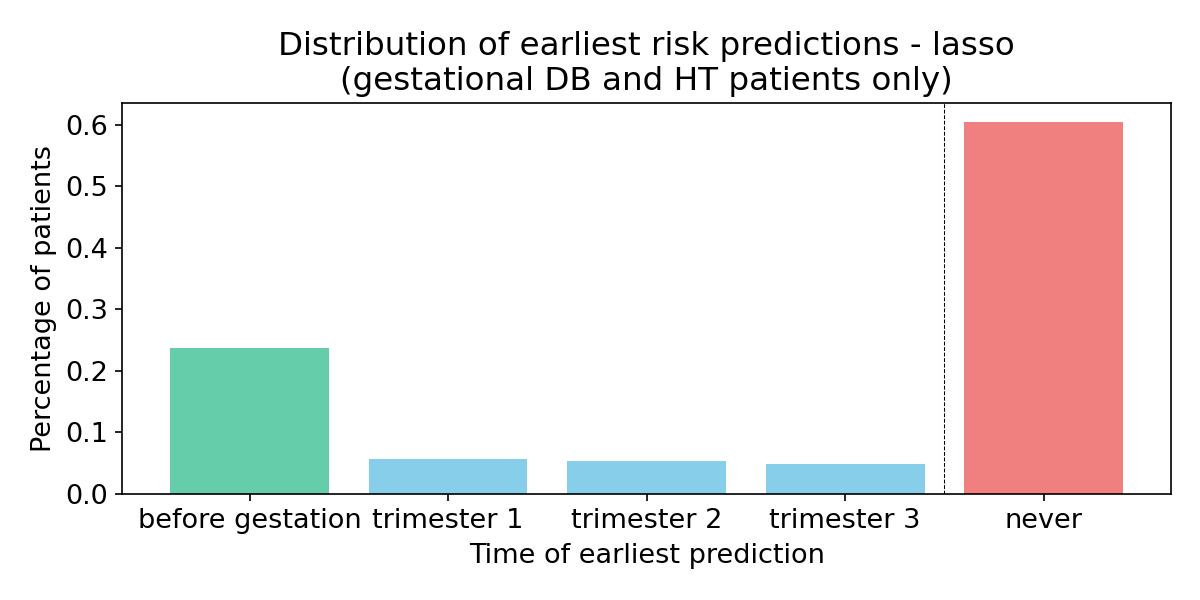 |
|---|---|
| (b) | 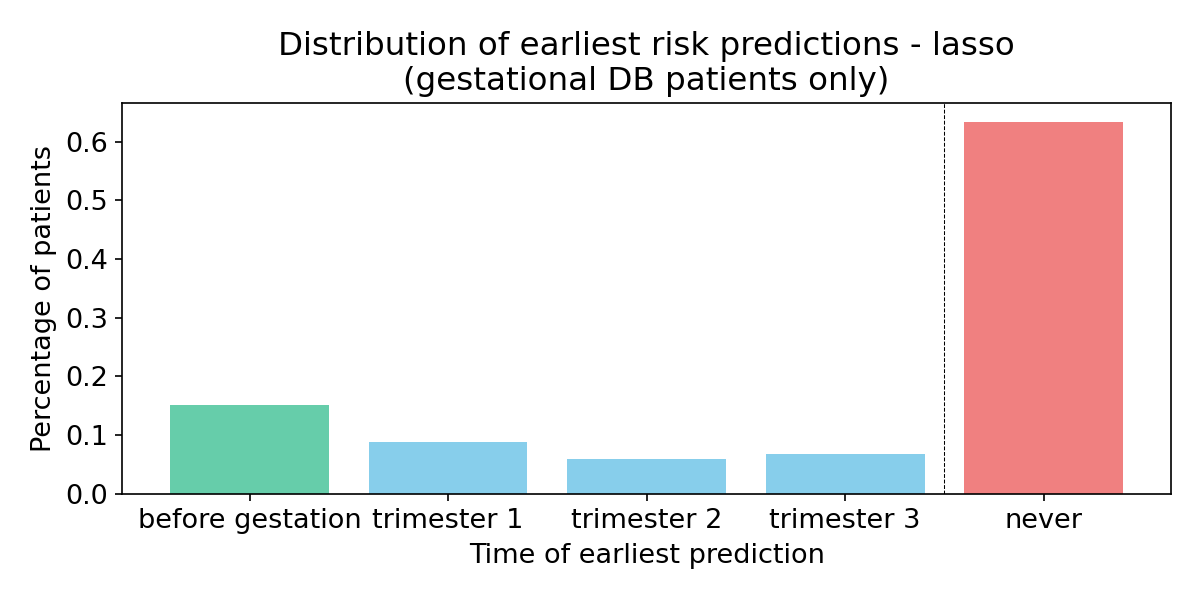 |
| (c) | 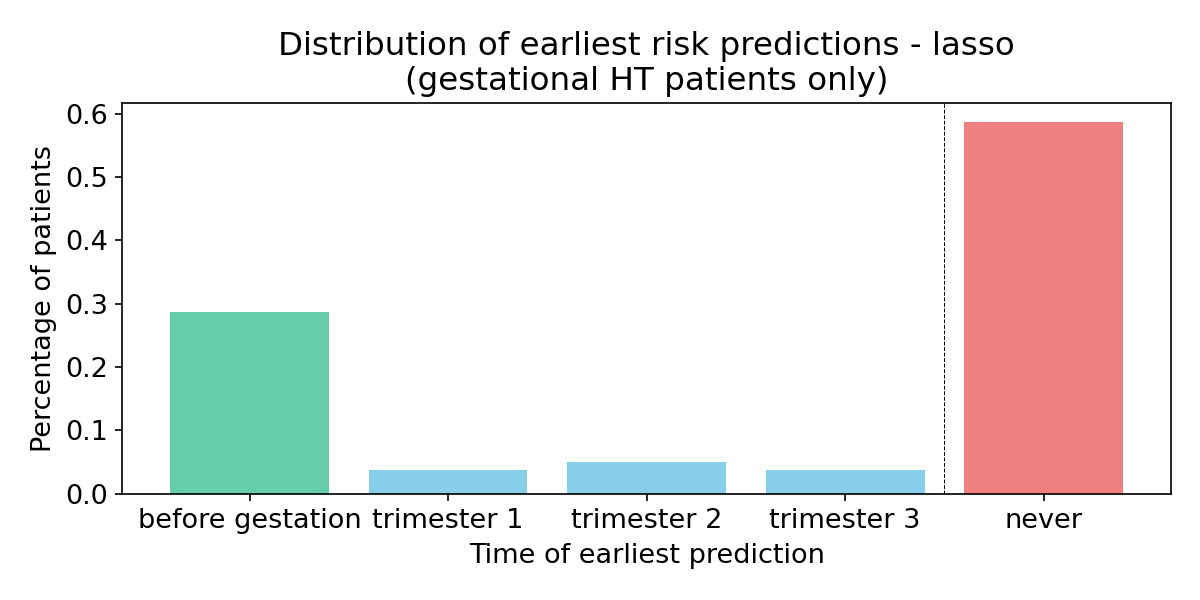 |
| GROUP-Lasso | Lasso | ||
| History of DB | AUROC | 0.675 | 0.706 |
| Accuracy | 0.622 | 0.570 | |
| History of HT | AUROC | 0.6573 | 0.708 |
| Accuracy | 0.708 | 0.647 | |
| History of DB+HT | AUROC | 0.635 | 0.757 |
| Accuracy | 0.624 | 0.568 | |
| No history of DB/HT | AUROC | 0.596 | 0.667 |
| Accuracy | 0.793 | 0.780 |