GMRT Hi mapping of mid-infrared bright Blue Compact Dwarf Galaxies W1016+3754 & W2326+0608
Abstract
We present the results from deep 21 cm Hi mapping of two nearby blue compact dwarf galaxies (BCDGs), W1016+3754 and W2326+0608, using the Giant Metrewave Radio Telescope (GMRT). These BCDGs are bright in mid-infrared (MIR) data and undergoing active star formation. With the GMRT observations, we investigate the role of cold neutral gas as the fuel resource of the current intensive star formation activity. Star formation in these galaxies is likely to be due to the infall of Hi gas triggered by gravitational perturbation from nearby galaxies. The BCDG W2326+0608 and nearby galaxy SDSS J232603.86+060835.8 share a common Hi envelope. We find star formation takes place in the high Hi column density gas ( cm-2) regions for both BCDGs. The recent starburst and infall of metal-free gas have kept the metallicity low for the BCDG W1016+3754. The metallicity for W2326+0608 is higher, possibly due to tidal interaction with the nearby galaxy SDSS J232603.86+060835.8.
keywords:
galaxies:dwarf galaxies:starburst galaxies:star formation radio lines:galaxies1 Introduction
Blue Compact Dwarf Galaxies (BCDGs) are compact galaxies with an appearance of extragalactic Hii regions (Sargent & Searle, 1970), and have different physical properties compared to other dwarf galaxies (Zwicky, 1966; Cairós et al., 2001a, b; Gil de Paz et al., 2003). BCDGs are characterized by intense narrow emission lines superposed on a faint blue continuum ( 18) powered by starburst no older than a few Myr (Kunth, 1999). The metallicities of these sources lie in the range 1/50 Z⊙ 1/2 Z⊙ (Izotov & Thuan, 1999; Hunter & Hoffman, 1999; López-Sánchez & Esteban, 2009). Due to the dust ejected and heated by Type II supernovae (SNe II) in compact ( 50 pc), dense star-forming regions, known as super star clusters (SSC), “active star-forming " BCDGs such as SBS 0335052 are brighter in infrared emission than “passive star-forming" BCDGs like I Zw 18, where star formation is very diffuse in much extended regions ( 100 pc) (Hirashita & Hunt, 2004). In mid-infrared (MIR) surveys such as Wide-field Infrared Survey Explorer (WISE; Wright et al., 2010), due to hot (200-1500 K) and small grain size dust, active BCDGs have redder infrared emission across the WISE band (W1-W3: 3.4, 4.6, 12 m).
Among the optically selected star-forming dwarf galaxies, those with the reddest MIR colours are found to be the most compact, with blue optical colour (0.3 mag) and very high specific star formation rate (sSFR 10-8 yr-1) (Hainline et al., 2016; Yang et al., 2017; Rong et al., 2018). From their optical selection, Yang et al. (2017) termed such compact ( 1 kpc in size) galaxies with blue colour, low stellar mass and extreme starburst as ‘blueberry’ galaxies. These objects represent the fainter and lower mass end of higher redshift () green pea (Amorín et al., 2010) and Lyman- Emitters (LAE; Gawiser et al., 2007), and are very rare (Izotov et al., 2011, 2014; Yang et al., 2017). From early WISE data, Griffith et al. (2011) discovered two such BCDGs, W0801+2640 and W1702+1803, with very red colour (W1[3.4 m]W2[4.6 m] 2 mag) and very low metallicities ( 1/8 Z⊙). This indicates WISE colour may help in searching low metallicity active star-forming BCDGs. However, MIR bright BCDGs are found to have a wide range in their metallicities (Izotov et al., 2011, 2014). The metal-poor nature of some active star-forming BCDGs is still not clearly understood. It is believed either the starburst has taken place very recently and/or there is an infall of metal-poor gas which has diluted the metal abundances in these sources (Lagos et al., 2018).
Hi content, morphology, distribution and kinematics of metal-poor BCDGs have been studied in literature to understand the reasons for triggering star-burst and low metallicities (Pustilnik & Martin, 2007; Ekta et al., 2009; Ekta & Chengalur, 2010; López-Sánchez, 2010; López-Sánchez et al., 2012; Filho et al., 2013; Lelli et al., 2014b; Thuan et al., 2016). However, there are only a few Hi studies towards MIR bright actively star-forming (sSFR yr-1) BCDGs due to their rarity (e.g. SBS0355-052, Ekta et al., 2009). We have investigated the Hi contents and conditions in the extreme starburst and low-intermediate metallicity environment using a sample of 11 nearby BCDGs with WISE red colour and bright MIR emission (Chandola et al. submitted). With Arecibo Observatory (AO), we performed deep Hi observations towards these sources, including W1017+3754 and W2326+0608 with bright Hi emission, Fpeak (Hi) 5 mJy, which were observed further with the Giant Metrewave Radio Telescope (GMRT) to understand the Hi kinematics and the environment of these BCDGs.
In this paper, we present results from the deep 21 cm Hi observations of W1016+3754 and W2326+0608, two nearby, mid-infrared bright, starburst BCDGs using the GMRT. Despite the facts of being MIR bright objects with active star formation, sharing similar stellar mass and having larger nearby galaxies, these two BCDGs differ in their metallicities by nearly an order of magnitude. In Sec. 2, we describe the properties of these two sources and associated multiwavelength data used in this paper (also see Table 1). The details of GMRT observations and data reduction procedure are provided in Sec. 3. Hi maps and results are shown in Sec. 4. We discuss the results from the study on the Hi contents and environments of these two galaxies in Sec. 5 and summarize in Sec. 6. Throughout this paper, we assume a concordance cosmology with , and . We adopt a solar metallicity (Z☉) of (O/H) (Asplund et al., 2009). Magnitudes are reported in the Vega system.
| Name | W1016+3754 | W2326+0608 |
|---|---|---|
| Right Ascensiona | 10:16:24.5 | 23:26:03.6 |
| (J2000) | ||
| Declinationa | +37:54:45.8 | +06:08:15 |
| (J2000) | ||
| Redshift | 0.003880.00001a | 0.016780.00006b |
| [Mpc]c | 16.7 | 72.8 |
| scale [pc/arcsec]c | 80 | 341 |
| 12 + log (O/H) | 7.570.01d | 8.390.03b |
| log (M∗/M⊙)e | 7.2 | 7.0 |
| SFR [M⊙/yr]e | 0.04 | 0.3 |
| log (sSFR) [yr-1]e | 8.6 | 7.5 |
| W1[3.4 m]W2[4.6 m]f | 0.550.06 | 1.310.18 |
| W2[4.6 m]W3[12 m]f | 3.940.10 | 5.650.15 |
| W4[22 m]f | 6.700.07 | 6.570.08 |
Notes: stands for luminosity distance and SFR for Star Formation Rate.
2 Properties of the two BCDGs
2.1 W1016+3754
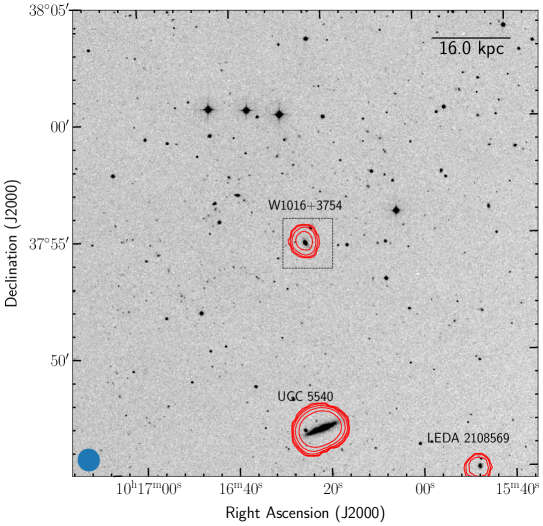
W1016+3754 is a blue compact dwarf galaxy with cometary tadpole-like morphology in optical images (Fig. 1) at redshift 0.0039 which corresponds to a luminosity distance 17 Mpc. An edge-on disk galaxy, UGC 5540, is at same redshift, , and angular distance of towards the south. Red WISE MIR colours ( W1[3.4 m]W2[4.6 m] 0.55 mag, W2[4.6 m]W3[12 m]3.94 mag) and bright 22 m emission (W4[22 m] 6.7 mag) (Cutri & et al., 2013), in W1016+3754 indicate the presence of hot dust heated by intense star formation. Stellar mass of is estimated using the correlation between optical ugriz colours and mass-to-light ratio from Bell et al. (2003). The -corrections were done using the best fit model from Assef et al. (2010) to UV-near infrared spectral energy distribution (SED)(Chandola et al. submitted). Using the method of Hao et al. (2011) and Kennicutt & Evans (2012), star formation rate (SFR) of 0.04 is estimated from Galaxy Evolution Explorer (GALEX; Bianchi et al., 2017) Far UV luminosity corrected for dust extinction with 22m values from WISE (Chandola et al. submitted). This gives a specific star formation rate for this galaxy. The H image shows presence of two star formation regions (Jaiswal & Omar, 2016). The equivalent width (EQW) of H line for this system is 96.7Å (Izotov et al., 2012), implying starburst age of 2 Myr (Copetti et al., 1986; Stasińska & Leitherer, 1996). The oxygen abundance is estimated as, 12+log(O/H) 7.57 0.01, 10 of solar metallicity (Izotov et al., 2012). Some high-ionization lines, such as [Ne v]3426 and [He ii]4686 lines are also detected (Izotov et al., 2012). These lines can arise from active galactic nuclei (AGN) (Izotov & Thuan, 2008), X-ray binaries (Pakull & Angebault, 1986), and fast radiative shocks from Supernovae (SNe) or young starburst (Dopita & Sutherland, 1996), but the lack of X-ray detection in this galaxy (Prestwich et al., 2013) suggests a starburst nature. [He ii]4686 line could be also attributed to the presence of Wolf-Rayet stars (Schaerer et al., 1999; Crowther & Hadfield, 2006; López-Sánchez & Esteban, 2010).
| Source | Date | Central | Total | Flux density/ | Gain/ |
|---|---|---|---|---|---|
| Frequency | time† | bandpass | phase | ||
| [MHz] | [hrs] | calibrator(s) | calibrator(s) | ||
| W1016+3754 | 2014 May 24, 25 | 1414.89 | 12 | 3C48, 3C286 | J1035+5628 |
| 2015 May 9,10 | 1414.89 | 17 | 3C48, 3C147, 3C286 | J1035+5628 | |
| W2326+0608 | 2014 May 24,27 | 1397.07 | 14 | 3C48, 3C286 | J0022+0014, J2212+0152 |
| 2015 May 9,10 | 1397.07 | 19 | 3C48, 3C286 | J0022+0014, J2212+0152 |
†: Including calibration and other overheads.
| Source | uv taper | R | Synthesized | Vel. res.∗ | Pixel | (1 ) | Sensitivity† | Detectable |
|---|---|---|---|---|---|---|---|---|
| beam size | size | [mJy beam-1] | [mJy beam-1] | N(Hi)† | ||||
| [k] | [′′ ′′, P.A.] | [ km s-1] | [′′] | [channel-1] | [km s-1] | [1018 cm-2] | ||
| W1016+3754 | 50 | 0 | 3.5′′ 3.2′′, 72.4∘ | 6.9 | 1.0 | 0.3 | 6.2 | 607 |
| 15 | 0 | 10.3′′9.2′′, 52.7∘ | 6.9 | 2.5 | 0.5 | 10.4 | 120.6 | |
| 8 | 0 | 22.9′′19.6′′, 24.3∘ | 6.9 | 4 | 0.7 | 14.5 | 35.7 | |
| 2 | 5 | 58.7′′57.0′′, 20.4∘ | 6.9 | 10 | 1.0 | 20.7 | 6.8 | |
| W2326+0608 | 40 | 0 | 4.8′′ 4.4 ′′,81.5∘ | 7.1 | 1.25 | 0.4 | 8.52 | 445.7 |
| 8 | 0 | 20.8′′ 19.9′′, 39.0∘ | 7.1 | 5 | 0.6 | 12.8 | 34.1 |
R:Robustness parameter, ∗: Velocity resolution, †: At 3 level for single channel.
| Sl. no. | Field | Source | Hi velocity | FWHM | Integrated flux | |||
|---|---|---|---|---|---|---|---|---|
| [km s-1] | [km s-1] | [mJy] | [mJy channel-1] | [Jy km s-1] | ||||
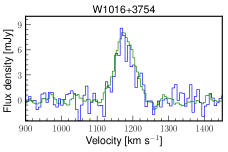
| 1 | W1016+3754 | W1016+3754 | 11735 | 449 | 8.61.0 | 0.9 | 0.390.06 | 7.4 |
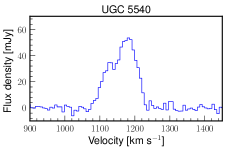
| 2 | W1016+3754 | UGC 5540 | 11631 | 1012 | 53.53.3 | 2.0 | 4.700.20 | 8.5 |
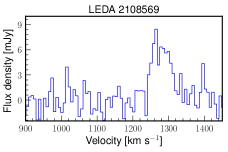
| 3 | W1016+3754 | LEDA 2108569 | 12796 | 5711 | 8.51.5 | 1.4 | 0.450.10 | 7.6 |
| 4 | W2326+0608 | all | 49912 | 974 | 20.3 2.0 | 1.8 | 1.630.17 | 9.3 |
| 5 | W2326+0608 | W2326+0608 | 50237 | 5715 | 1.50.4 | 0.4 | 0.050.03 | 7.8 |
| Component | Peak flux | Velocity | FWHM |
|---|---|---|---|
| [mJy] | [km s-1] | [km s-1] | |
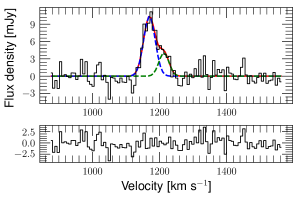
| 1 | 10.30.9 | 11704 | 417 |
| 2 | 4.01.1 | 12139 | 3520 |
2.2 W2326+0608
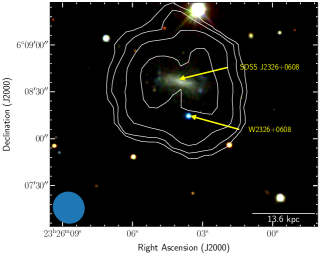
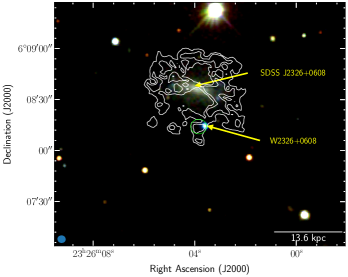
W2326+0608 is a BCDG at (). A nearby galaxy, SDSS J232603.86+060835.8, is also seen towards the north at an angular distance of 22.7 ′′(see Fig. 2). This angular distance corresponds to a projected distance of 8 kpc if this system is at same redshift as the BCDG. The stellar mass is estimated as (Chandola et al. submitted). The red MIR colour, W2[4.6 m]W3[12 m] 5.65 mag and rather strong 22 m emission, W4[22 m] 6.6 mag, compared to the optical emission suggest strong dust emission. The SFR is estimated to be 0.3 M⊙ yr-1 using FUV luminosity from Assef et al. (2010) model SED and corrected for dust extinction with 22 m emission values from WISE (Chandola et al. submitted). The oxygen abundance estimate is 8.390.03 ( 1/2 Z⊙) using the method of Izotov et al. (2006) (Zhang Ludan et al. in preparation).
3 GMRT Observations and data reduction
W1016+3754 and W2326+0608 were observed with the GMRT full array and total intensity mode in May 2014 and May 2015. A base band bandwidth of 16 MHz with 512 channels used during observations provided a velocity resolution () of 7 km s-1. The observational details are provided in Table 2. Flux and bandpass calibrators were observed for 15 minutes after every 3-4 hours of intervals while phase calibrators were observed for 5 minutes after every 46 minutes of observation on the target source. Total GMRT observing time for W1016+3754 and W2326+0608, including calibration and other overheads, was 29 and 33 hours respectively.
The GMRT data were reduced using the NRAO Astronomical Image Processing System (AIPS) software111http://www.aips.nrao.edu/index.shtml. Initially, before any calibration the bad data due to dead antennas, radio frequency interference (RFI) and other problematic issues were flagged. Then the antenna gain solutions were calculated using task CALIB and bandpass solutions were determined using BPASS. The data were split by applying the bandpass and gain solutions, and then data from different runs were combined using DBCON. Continuum images were made from line-free channels. Further after a few rounds of self-calibration, the continuum was subtracted from the split uv data using tasks UVSUB and UVLIN. The frequency axis was converted to the Hi line velocity in the Heliocentric frame of rest with the task CVEL. The Hi data cubes of different resolutions were produced by the task IMAGR using different uv taper and robustness parameters. The root-mean-square (rms) noise () for line-free channels varies from 0.3 mJy beam-1 channel-1 in the highest resolution cube to 1 mJy beam-1 channel-1 in the lowest resolution cube. The details of Hi cubes such as synthesized beam sizes corresponding to different uv constraints, velocity resolutions, pixel sizes, rms noises in line free channels including the Hi detection limit of these cubes are provided in Table 3.
We used the smooth and clip algorithm in the Source Finding Application (SoFiA; Serra et al., 2015) to create Hi detection masks. This algorithm first smoothed Hi cubes using Gaussian kernels of radius 1, 3 and 6 pixels in spatial coordinates, and boxcars of width 1, 3, 7 and 15 channels (see Table 3 for pixel sizes and velocity resolution per channel). A threshold of above 5 was used at each step of smoothing to find detection voxels. After that, detections were merged using a radius of 1 pixel and 1 channel. Only sources with sizes greater than 6 pixels and 3 channels were considered as genuine Hi detections. Hi masks generated by this process were used to create moment maps from original Hi cubes. After applying the primary beam correction, we extracted Hi profiles from cubes using the Common Astronomy Software Applications (CASA; McMullin et al., 2007) task IMVIEW.
4 Results
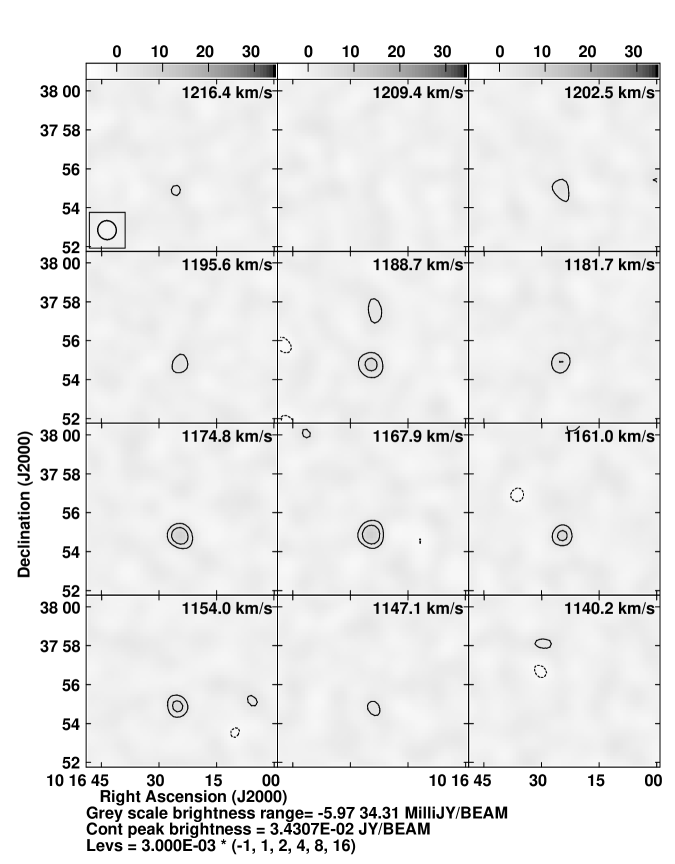
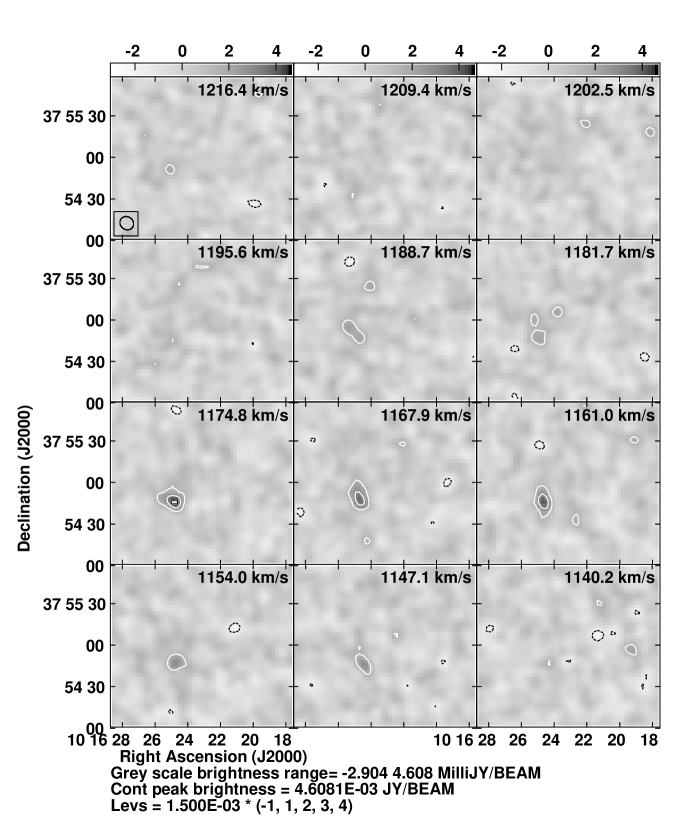
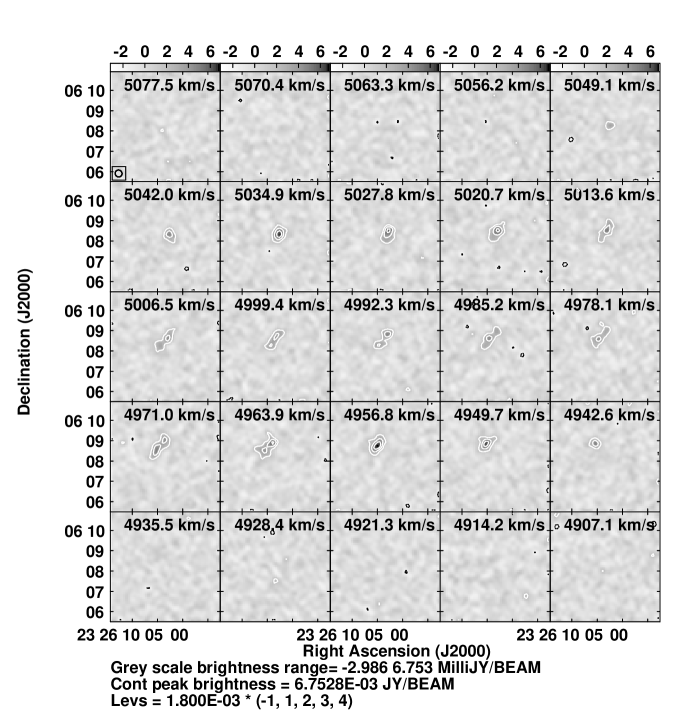
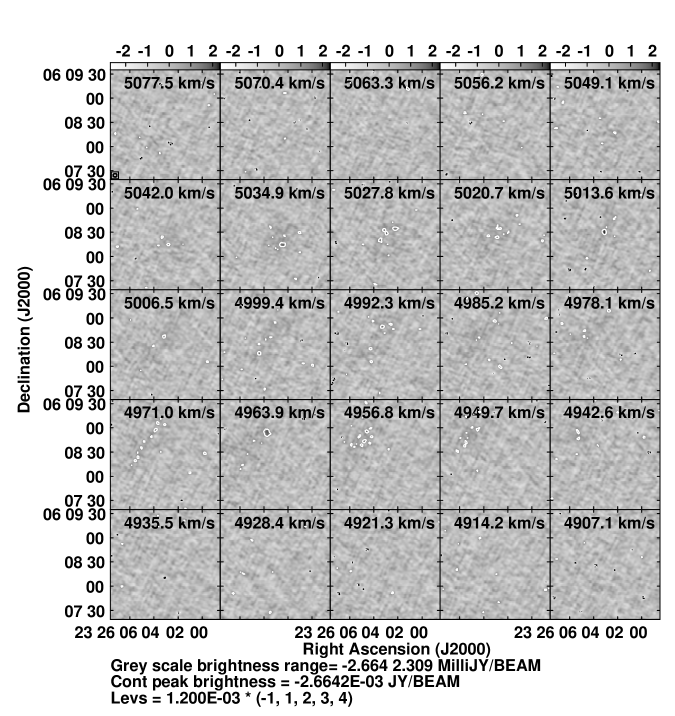
The Hi gas distribution and kinematics of the BCDGs, W1016+37 and W2326+0608 are shown in Figs. 1-9 using moment maps and Hi profiles. The contours in different moment maps are integrated flux densities where the first contours represent 3- detection limits for a boxcar profile with a line width 21 km s-1. The Hi channel maps are compiled in the Appendix (Figs. 11-14 ). The Hi column densities for the optically thin gas can be estimated from the integrated flux densities (Spitzer, 1978)
| (1) |
Table 4 lists values for Hi gas properties derived from different profiles. We used the Arecibo IDL procedure mbmeasure222http://www.naic.edu/~rminchin/idl/mbmeasure.pro to derive the line parameters such as Hi velocity, Full Width Half Maximum (FWHM), peak flux, rms noise from line-free channels, integrated flux and Hi mass listed in this table. Hi velocity is the mean of velocities at FWHM. Errors on the Hi velocity, FWHM, peak flux and integrated flux are calculated using the method of Koribalski et al. (2004). The Hi masses from Hi profiles are calculated using the equation (Roberts, 1975)
| (2) |
where is luminosity distance and is the Hi profile. Luminosity distance has been estimated as ( is optical rest velocity). Apart from the error on flux measurement from calibration which is about 5% to 7%, the uncertainty of the Hi mass estimate has a contribution from other factors, mainly the luminosity distance uncertainty which depends on different cosmological parameters. Therefore it is difficult to produce an accurate number for the uncertainty. In the following subsections, we describe Hi images and profiles for the two sources separately.
4.1 W1016+3754
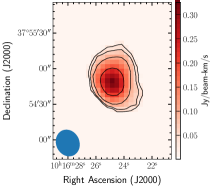
Low resolution Hi images ( 20′′, 57′′), as well as high resolution ( 3′′, 10′′) images, are used to understand the Hi distribution and kinematics towards the BCDG and its neighbourhood. While lower resolution images are sensitive to diffuse low column density gas (1019 cm-2), higher resolution images provide details of high column density Hi gas (1020 cm-2). The Hi total intensity map with synthesized beam 58.7′′ 57.0′′, P.A. 18.2∘ overlaid on r-band Digitized Sky Survey (DSS) optical image (Fig. 1) shows a gas-rich galaxy UGC 5540 towards the south at 38.4 kpc in projection from BCDG W1016+37. In addition to this, we detected another blue compact starburst galaxy, LEDA 2108569 (Ann et al., 2015), at an angular distance of towards the south-west from UGC 5540 and redshifted by 100 km s-1. Jaiswal & Omar (2020) reported the presence of a Hi cloud towards the east of W1016+3754 in the low resolution ( 1′) image. However, we didn’t find evidence of such a cloud from deeper GMRT observations in Hi map of similar resolution (see the Hi moment map in Fig. 1 and channel map in Fig. 11).
Global Hi profiles of the BCDG W1016+37, UGC 5540 and LEDA 2108569, extracted from the Hi cube of the same resolution as these images, are shown in Fig. 3. Table 4 lists Hi profile parameters and log Hi masses for these sources. The rms noise from line-free channels in these profiles is 0.9-2.0 mJy per 6.9 km s-1. In order to make a comparison, Hi profile for W1016+3754 from the Arecibo observations (Chandola et al. submitted) is also shown. It shows that Hi profiles from GMRT and Arecibo observations are similar. Integrated flux for W1016+3754 from the GMRT profile is 0.390.06 Jy km s-1 which is similar to integrated flux, 0.490.06 Jy km s-1, estimated from the Arecibo profile. The derived from the global Hi profile of the BCDG W1016+3754 is 107.4 M⊙ which is similar to the estimated 107.5 M⊙ from our Arecibo observations (Chandola et al. submitted) and similar to an earlier expectation =107.9 M⊙ using Nancay Radio Telescope by Pustilnik & Martin (2007). UGC 5540 and LEDA 2108569 have values 108.5 M⊙ and 107.6 M⊙ respectively.
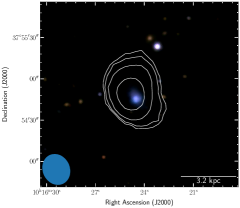
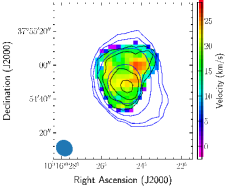
In Fig. 1 bottom left panel, a close-up Hi map of W1016+3754 at spatial resolution 22.9′′ 19.6′′, P.A. 24.3∘ overlaid on Sloan Digital Sky Survey (SDSS) r, g, i-band 3 colour image shows that the outer Hi morphology has somewhat C-shape. The size of Hi cloud in this image is 1.1′which corresponds to a linear projected size 5.3 kpc. However, this C-shape is not seen in the unresolved 20 ′′resolution map by Jaiswal & Omar (2020).
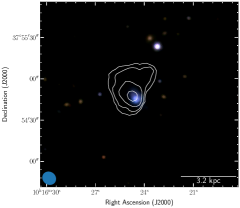
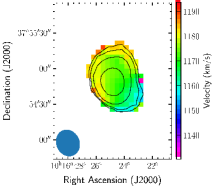
In Fig. 1 bottom right panel, we also show higher resolution (10.3′′ 9.2′′, P.A. 52.7∘) total intensity contours of W1016+37 overlaid on optical SDSS image. The first contour in this image is 18.0 mJy beam-1 km s-1 which corresponds to Hi column density of 2.1 1020 cm-2. The total size of Hi region in this image is 42′′(projected linear size 3.4 kpc) which is 4 times as compared to its SDSS optical size r-band size 10 ′′. In Fig. 4, the moment-zero map shows that there is also Hi gas with a density 1020 cm-2 towards the north-west at 20.6′′(projected linear distance ) distance from the peak column density region which doesn’t coincide with any optical feature. This feature is not visible in the high resolution 8′′map by Jaiswal & Omar (2020). Moment-1 map shows that the gas in this region is redshifted by 30 km s-1 relative to the peak Hi density region.
We further investigated kinematics using the Gaussian fits to the integrated Hi profile (Fig. 5) extracted from the cube of the same resolution. The profile fits with two Gaussian components with parameters listed in Table 5. Two components are separated by 43 km s-1 in velocities. The lower flux component (peak flux 4 mJy) is at a redshifted velocity 1213 km s-1 as compared to the higher flux 10 mJy component at 1170 km s-1. This implies the presence of two components, the compact dense gas and the diffuse gas. The latter slightly extends to north-west region and redshifted velocities. This is also visible in the Hi channel map (see Fig. 12) where diffuse components are at velocities higher than up to .
In Fig. 6, we show Hi image with higher resolution 3.5′′ 3.2 ′′, P.A. 72.4∘ overlaid on Hubble Space Telescope (HST) WFC3 F606W image333Based on observations made with the NASA/ESA Hubble Space Telescope, and obtained from the Hubble Legacy Archive, which is a collaboration between the Space Telescope Science Institute (STScI/NASA), the Space Telescope European Coordinating Facility (ST-ECF/ESAC/ESA) and the Canadian Astronomy Data Centre (CADC/NRC/CSA).. The high column density Hi gas (1021 cm-2) seems to have a tadpole-like structure similar to seen in SDSS/HST optical images. The gas with peak column density, N(Hi) 7.6 1021 cm-2, is near the region of higher stellar density. It appears that the Hi peak position might be shifted toward the east by 2.5 ′′or a projected distance of 200 parsecs. However, we refrain from making any claim on this shift as it is smaller than the resolution of the Hi image.
4.2 W2326+0608
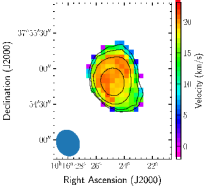
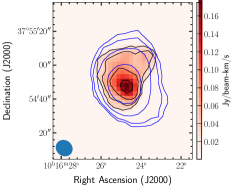
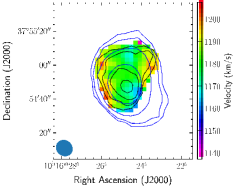
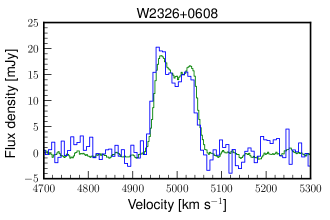
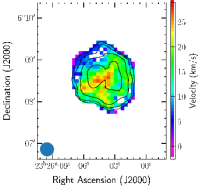
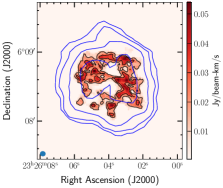
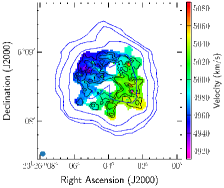
Low resolution (20.8′′ 19.6′′, P.A. 28.8∘) image (Fig. 2, which is sensitive enough to detect Hi gas with column density 5.9 1019 cm-2, shows both W2326+0608 and nearby galaxy SDSS J232603.86+060835.8 share same Hi environment. Hi region in this image extends up to 1.7′which corresponds to projected linear size 35 kpc. Integrated Hi profile for Hi region in this image is extracted from the same low resolution Hi cube (Fig. 7 ). The noise in this profile is 1.4 mJy per 7.1 km s-1. This Hi profile is similar to the profile from Arecibo observations (Chandola et al. submitted) towards this source. Integrated flux from this GMRT Hi profile is Jy km s-1 compared to the integrated flux Jy km s-1 from the Arecibo Hi profile. Hi mass derived from this profile is . The double horn that is seen in both Arecibo and GMRT integrated Hi line profile (Fig. 7) indicate the rotating motion of the gas.
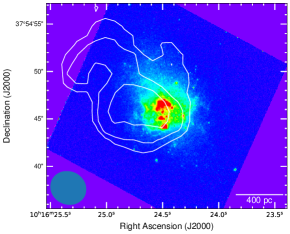
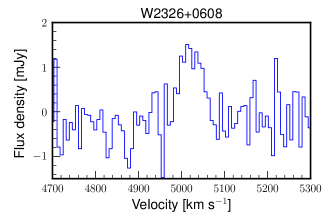
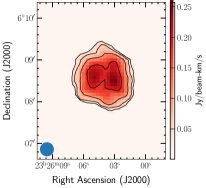
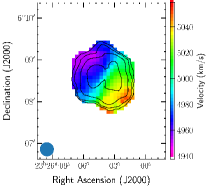
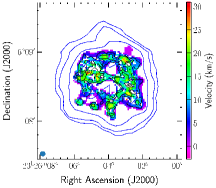
We also mapped Hi towards W2326+0608 with a resolution of 4.8′′ 4.4′′, P.A. 81.46∘ which was sufficient to detect high column density Hi gas of N(Hi) 7.71020 cm-1 and resolve the Hi towards the BCDG and neighbouring galaxy (Fig. 8). With this high-resolution image, we are able to detect regions of very high Hi column densities ( 1021 cm-2 ), including one near the BCDG W2326+0608. The size of this Hi region is around 10′′(projected linear size 3.4 kpc), and is shifted by 4.6 ′′(projected distance 1.6 kpc) towards east from W2326+0608. We also show the Hi line profile (Fig. 8 right panel) towards this high Hi density region extracted from a circle marked in green in the left panel. The noise in this profile is 0.4 mJy per 7.1 km s-1. The total integrated flux from this profile is 0.050.03 Jy km s-1 which corresponds to the Hi mass of 107.8 M⊙ (Table 4). Most of the high column density Hi gas regions are not aligned along the major axis of edge-on galaxy J232603.86+060835.8 and are found to be at outskirts. Except for the gas which is associated with the BCDG W2326+0608, most of the gas at the outskirts is with no optical/UV counterpart. The moment one maps in Fig. 9 show a velocity gradient for the gas along the major axis of J232603.86+060835.8 indicating the rotating motion, though slightly tilted.
5 Discussion
5.1 What triggered the starburst in W1016+37 and W2326+0608 ?
Starburst in low mass galaxies like BCDGs could be triggered due to different external (Silk et al., 1987; Noguchi, 1988; Noeske et al., 2001; Bekki, 2008; López-Sánchez, 2010; Lelli et al., 2014a; Filho et al., 2015) or internal mechanisms (Hunter & Elmegreen, 2004; Elmegreen et al., 2012). Among the external mechanisms, there could be merger/interaction with the neighbouring galaxies (Méndez & Esteban, 2000) or accretion of intergalactic pristine gas (Sánchez Almeida et al., 2015; Filho et al., 2015). Filho et al. (2015) found most of the extremely low metallicity systems in their sample are located in low-density environments. They suggested that star formation is fuelled by the accretion of metal-poor gas similar to cold-gas inflows at high redshift. The evidences for merger or interaction are very faint in optical images and could be seen in radio Hi images (López-Sánchez & Esteban, 2008; López-Sánchez, 2010; Lelli et al., 2014a). According to Lelli et al. (2014a), young starburst dwarf galaxies have more outer asymmetries in Hi images and external mechanisms like interactions or infall of gas are responsible for that. The asymmetry in W1016+3754 GMRT 10.3 ′′ 9.2′′, P.A. 52.7∘ Hi map and profile is consistent with this. The presence of red-shifted diffuse gas near this BCDG hints at the scenario that the infalling cold gas fuels the starburst activity in BCDGs. Since the projected distance (38.4 kpc) of W1016+3754 from UGC 5540 is close enough (so as the star-burst dwarf irregular LEDA 2108569) to cause gravitational perturbation (Binney & Tremaine, 2008; Filho et al., 2015), this infall of gas in W1016+3754 might be triggered by UGC 5540. Although no direct evidence of tidal interaction like tidal filaments is visible in Hi image possibly due to the sensitivity limit of our observation. W2326+0608 is located in the Hi gas-rich environment of nearby galaxy SDSS J232603.86+060835.8 and they are tidally interacting. Due to this tidal interaction, there might be a collapse or infall of gas which has triggered the starburst in W2326+0608. Though we do not have enough spatial resolution to look into the details of W2326+0608 itself, the asymmetric Hi profile hints at this scenario.
5.2 Hi gas properties and star formation
Several previous studies have studied the link between Hi gas properties and star formation in dwarf galaxies. Galaxies with higher star formation rate surface densities were found to have higher Hi surface densities (Lelli et al., 2014b). Skillman (1987) in their studies of irregular dwarf galaxies estimated critical Hi column density for massive star formation to be 1021 cm-2. However, in some studies, star-formation at sub-critical Hi column densities have been also reported (Cannon et al., 2016; Teich et al., 2016). Our study towards W1016+37 and W2326+0608 is consistent with star formation taking place in the region of high Hi column densities of 1021 cm-2. The peak Hi column densities for W1016+3754 and W2326+0608 are and respectively. There appears to be some difference between the position of the peak of the two parameters in both sources. The physical reasons behind these differences can be related to the star formation history or tidal interactions (Teich et al., 2016). In W1016+3754 high-resolution image (Fig. 6) the shift of 200 pc may be from shock waves due to Supernovae explosion or star-burst, evidence for which comes from the presence of high ionization lines (Izotov et al., 2012). Similarly, in the case of W2326+0608, it is possible strong stellar winds from recent starburst (SFR 0.3 M⊙ yr-1) or tidal interactions with SDSS J232603.86+060835.8 have caused the shift of 1.6 kpc as it could have strong gravitational effect from a projected distance of 8 kpc.
We further analyse the gas and star-formation conditions in these two galaxies using the model of Hirashita & Hunt (2004). Initial gas densities, ambient pressure due to shock waves and dust enrichment from Supernovae Type ii are crucial factors for the formation of dense and compact super star clusters (SSC) seen in MIR bright BCDGs as these can trigger the runaway star formation (Billett et al., 2002; Hirashita & Hunt, 2004). For a pressure-bound and self-gravity driven isothermal spherical star-forming region, the critical radius is 50 pc below which it would become unstable, collapse and turn into SSC (Ebert, 1955; Bonnor, 1956; Hirashita & Hunt, 2004). We could only determine the radius of the star-forming region () for W1016+3754 from its high resolution HST WFCS F606W image (Fig. 6). The image shows mainly three super star cluster regions of average 0.5′′ 40 pc. Since we don’t have a high resolution image for W2326+0608, we assume an upper limit on its . If we assume all of the total Hi gas mass of these galaxies is associated with the star-formation regions, then according to eq. (7) in Hirashita & Hunt (2004), the gas number densities for W1016+3754 and W2326+0608 are and 5 respectively. These gas number densities correspond to a free-fall timescale () and according to eq. (4) in Hirashita & Hunt (2004). These time scales are similar to the starburst age of 2 Myr estimated from EQW(H) for W1016+3754. At the current rate of star formation, in W1016+3754 and in W2326+0608, the gas consumption time scale is 108 yrs for W1016+3754 and 108 yrs for W2326+0608. According to Hirashita & Hunt (2004) model, SNe II starts dust enrichment in active star-forming regions on the time scales of 3 Myr after the onset of star-formation. Initially, the dust temperature () is a few 100 K and cools down rapidly. Dust temperature also has a dependence on the dust grain size() as . Hence the presence of small grain size dust from SNe ii in W1016+3754 and W2326+0608, and their age of starburst and freefall time scale explains the bright red MIR colours.
5.3 The position of two galaxies in mass-metallicity diagram
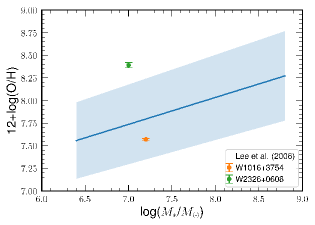
In Fig. 10, we show the position of two galaxies in the mass-metallicity diagram. The metallicity of W1016+3754 for its stellar mass is below the mass-metallicity relation given by Lee et al. (2006) for dwarf galaxies. Since the starburst is fresh, and metal-free gas is still accumulating, the metallicity at this stage is low for W1016+3754. This is consistent with the analysis of Lagos et al. (2018) where they found the lowest oxygen abundance in the regions of disturbed neutral and ionized gas kinematics in the starburst galaxy UGC 461. Sánchez Almeida et al. (2015) find inhomogeneous metallicity distribution in their sample of dwarf galaxies with starburst regions having lowest metallicity suggesting infall of metal-poor gas triggering the starburst. This is also consistent with the scenario in NGC 5253 where López-Sánchez et al. (2012) found direct evidence of infalling metal-poor Hi gas.
However, in the case of W2326+0608, we find that despite having similar stellar mass and higher sSFR compared to W1016+3754, the metallicity is higher by nearly an order of magnitude. In the fundamental metallicity relation (Mannucci et al., 2010), those having higher sSFR have lower metallicities which W2326+0608 doesn’t appear to follow. The common Hi environment with the galaxy SDSS J232603.86+060835.8 suggests higher metallicity of W2326+0608 is due to its proximity and metal transport from neighbouring galaxy (Croxall et al., 2009; Recchi et al., 2015). In future, many such systems with young starburst will be discovered with Commensal Radio Astronomy FasT Survey (CRAFTS; Li et al., 2018; Zhang et al., 2021) using the Five-hundred-meter Aperture Spherical radio Telescope (FAST).
6 Conclusion
In this section, we summarize our findings from the GMRT Hi study of the bright-MIR BCDGs W1016+3754 and W2326+0608.
-
•
Our data suggest that the infall of diffuse cold gas has triggered the star formation in both BCDGs. The origin of the cold gas could be the consequence of gas expelled by interactions between neighbouring galaxies, or just gas accretion from the intergalactic medium.
-
•
Star formation in both the galaxies takes place in the regions of Hi gas column densities greater than 10.
-
•
In the case of W1016+3754, we find evidences of infall of gas as the triggering mechanism of the recent starburst. The metallicity of the gas is lower than given by the mass-metallicity relation for its stellar mass, suggesting that the infalling gas is metal-poor.
-
•
Although W2326+0608 has a higher specific star-formation rate and similar stellar mass as W1016+3754, the gas has a much higher metallicity by nearly an order of magnitude above mass-metallicity relation, suggesting that the infalling gas is metal-rich, perhaps as a consequence of tidal interaction with the neighbouring galaxy SDSS J232603.86+060835.8.
-
•
In future, many low metallicity blue compact dwarf galaxies with recently triggered star formation will be discovered with the CRAFTS extragalactic Hi survey.
Data availability
GMRT data can be downloaded from the GMRT data archive https://naps.ncra.tifr.res.in/goa/data/search using the project codes 26_060 and 28_091.
Acknowledgements
We thank the anonymous reviewer for the useful comments which helped to significantly improve the paper. We thank the staff of the GMRT that made these observations possible. GMRT is run by the National Centre for Radio Astrophysics of the Tata Institute of Fundamental Research. We used AIPS for data reduction which is produced and maintained by the National Radio Astronomy Observatory, a facility of the National Science Foundation operated under cooperative agreement by Associated Universities, Inc. CWT thanks D. Stern for attempting to get the supporting optical spectra for this paper. YC thanks Narendranath Patra for the useful discussion on data reduction.
In this work, YC is sponsored by the Chinese Academy of Sciences Visiting Fellowship for Researchers from Developing Countries, Grant No. 2013FFJB0009. YC also thanks Center for Astronomical Mega-Science, CAS, for FAST distinguished young researcher fellowship (19-FAST-02) and China ministry of science and technology (MOST) for the grant no. QNJ2021061003L. YC also acknowledges support from National Natural Science Foundation of China (NSFC) Grant No. 11550110181 and 12050410259. CWT was supported by a grant from the NSFC (No. 12041302). YZM is supported by the National Research Foundation of South Africa under grant No. 120385 and No. 120378, NITheCS program “New Insights into Astrophysics and Cosmology with Theoretical Models confronting Observational Data”, and National Natural Science Foundation of China with project 12047503.
This publication makes use of data products from the Wide-Field Infrared Survey Explorer, which is a joint project of the University of California, Los Angeles, and the Jet Propulsion Laboratory, California Institute of Technology, funded by the National Aeronautics and Space Administration. The Arecibo Observatory is operated by SRI International under a cooperative agreement with the National Science Foundation (AST-1100968), and in alliance with Ana G. Méndez-Universidad Metropolitana, and the Universities Space Research Association.
This research has made use of the NASA/ IPAC Infrared Science Archive, which is operated by the Jet Propulsion Laboratory, California Institute of Technology, under contract with the National Aeronautics and Space Administration. This research has made use of the VizieR catalogue access tool, CDS, Strasbourg, France. The original description of the VizieR service was published in A&AS 143, 23.
This research has made use of Digitized Sky Survey products. The Digitized Sky Survey was produced at the Space Telescope Science Institute under U.S. Government grant NAG W-2166. The images of these surveys are based on photographic data obtained using the Oschin Schmidt Telescope on Palomar Mountain and the UK Schmidt Telescope. The plates were processed into the present compressed digital form with the permission of these institutions.
This work also makes use of Sloan Digital Sky Survey (SDSS)-III. Funding for SDSS-III has been provided by the Alfred P. Sloan Foundation, the Participating Institutions, the National Science Foundation and the US Department of Energy Office of Science. The SDSS-III web site is http://www.sdss3.org/. SDSS-III is managed by the Astrophysical Research Consortium for the Participating Institutions of the SDSS-III Collaboration including the University of Arizona, the Brazilian Participation Group, Brookhaven National Laboratory, Carnegie Mellon University, University of Florida, the French Participation Group, the German Participation Group, Harvard University, the Instituto de Astrofisica de Canarias, the Michi- gan State/Notre Dame/JINA Participation Group, Johns Hopkins University, Lawrence Berkeley National Laboratory, Max Planck Institute for Astrophysics, Max Planck Institute for Extraterrestrial Physics, New Mexico State University, New York University, Ohio State University, Pennsylvania State University, University of Portsmouth, Princeton University, the Spanish Participation Group, University of Tokyo, University of Utah, Vanderbilt University, University of Virginia, University of Washington and Yale University. Some of the data presented in this paper were obtained from the Mikulski Archive for Space Telescopes (MAST). STScI is operated by the Association of Universities for Research in Astronomy, Inc., under NASA contract NAS5-26555. Support for MAST for non-HST data is provided by the NASA Office of Space Science via grant NNX09AF08G and by other grants and contracts. This work has also used different Python packages e.g. NUMPY, ASTROPY, APLPY, SCIPY and MATPLOTLIB. We thank numerous contributors to these packages.
References
- Alam et al. (2015) Alam S., et al., 2015, ApJS, 219, 12
- Amorín et al. (2010) Amorín R. O., Pérez-Montero E., Vílchez J. M., 2010, ApJ, 715, L128
- Ann et al. (2015) Ann H. B., Seo M., Ha D. K., 2015, ApJS, 217, 27
- Asplund et al. (2009) Asplund M., Grevesse N., Sauval A. J., Scott P., 2009, ARA&A, 47, 481
- Assef et al. (2010) Assef R. J., et al., 2010, ApJ, 713, 970
- Bekki (2008) Bekki K., 2008, MNRAS, 388, L10
- Bell et al. (2003) Bell E. F., McIntosh D. H., Katz N., Weinberg M. D., 2003, ApJS, 149, 289
- Bianchi et al. (2017) Bianchi L., Shiao B., Thilker D., 2017, ApJS, 230, 24
- Billett et al. (2002) Billett O. H., Hunter D. A., Elmegreen B. G., 2002, AJ, 123, 1454
- Binney & Tremaine (2008) Binney J., Tremaine S., 2008, Galactic Dynamics: Second Edition. Princeton University Press
- Bonnor (1956) Bonnor W. B., 1956, MNRAS, 116, 351
- Cairós et al. (2001a) Cairós L. M., Vílchez J. M., González Pérez J. N., Iglesias-Páramo J., Caon N., 2001a, ApJS, 133, 321
- Cairós et al. (2001b) Cairós L. M., Caon N., Vílchez J. M., González-Pérez J. N., Munoz-Tunón C., 2001b, ApJS, 136, 393
- Cannon et al. (2016) Cannon J. M., et al., 2016, AJ, 152, 202
- Copetti et al. (1986) Copetti M. V. F., Pastoriza M. G., Dottori H. A., 1986, A&A, 156, 111
- Crowther & Hadfield (2006) Crowther P. A., Hadfield L. J., 2006, A&A, 449, 711
- Croxall et al. (2009) Croxall K. V., van Zee L., Lee H., Skillman E. D., Lee J. C., Côté S., Kennicutt Robert C. J., Miller B. W., 2009, ApJ, 705, 723
- Cutri & et al. (2013) Cutri R. M., et al. 2013, VizieR Online Data Catalog, 2328
- Dopita & Sutherland (1996) Dopita M. A., Sutherland R. S., 1996, ApJS, 102, 161
- Ebert (1955) Ebert R., 1955, Z. Astrophys., 36, 222
- Ekta & Chengalur (2010) Ekta B., Chengalur J. N., 2010, MNRAS, 403, 295
- Ekta et al. (2009) Ekta B., Pustilnik S. A., Chengalur J. N., 2009, MNRAS, 397, 963
- Elmegreen et al. (2012) Elmegreen B. G., Zhang H.-X., Hunter D. A., 2012, ApJ, 747, 105
- Filho et al. (2013) Filho M. E., et al., 2013, A&A, 558, A18
- Filho et al. (2015) Filho M. E., Sánchez Almeida J., Munoz-Tunón C., Nuza S. E., Kitaura F., Heß S., 2015, ApJ, 802, 82
- Gawiser et al. (2007) Gawiser E., et al., 2007, ApJ, 671, 278
- Gil de Paz et al. (2003) Gil de Paz A., Madore B. F., Pevunova O., 2003, ApJS, 147, 29
- Griffith et al. (2011) Griffith R. L., et al., 2011, ApJ, 736, L22
- Hainline et al. (2016) Hainline K. N., Reines A. E., Greene J. E., Stern D., 2016, ApJ, 832, 119
- Hao et al. (2011) Hao C.-N., Kennicutt R. C., Johnson B. D., Calzetti D., Dale D. A., Moustakas J., 2011, ApJ, 741, 124
- Hirashita & Hunt (2004) Hirashita H., Hunt L. K., 2004, A&A, 421, 555
- Hunter & Elmegreen (2004) Hunter D. A., Elmegreen B. G., 2004, AJ, 128, 2170
- Hunter & Hoffman (1999) Hunter D. A., Hoffman L., 1999, AJ, 117, 2789
- Izotov & Thuan (1999) Izotov Y. I., Thuan T. X., 1999, ApJ, 511, 639
- Izotov & Thuan (2008) Izotov Y. I., Thuan T. X., 2008, ApJ, 687, 133
- Izotov et al. (2006) Izotov Y. I., Stasińska G., Meynet G., Guseva N. G., Thuan T. X., 2006, A&A, 448, 955
- Izotov et al. (2011) Izotov Y. I., Guseva N. G., Fricke K. J., Henkel C., 2011, A&A, 536, L7
- Izotov et al. (2012) Izotov Y. I., Thuan T. X., Privon G., 2012, MNRAS, 427, 1229
- Izotov et al. (2014) Izotov Y. I., Guseva N. G., Fricke K. J., Henkel C., 2014, A&A, 561, A33
- Jaiswal & Omar (2016) Jaiswal S., Omar A., 2016, MNRAS, 462, 92
- Jaiswal & Omar (2020) Jaiswal S., Omar A., 2020, MNRAS, 498, 4745
- Kennicutt & Evans (2012) Kennicutt R. C., Evans N. J., 2012, ARA&A, 50, 531
- Koribalski et al. (2004) Koribalski B. S., et al., 2004, AJ, 128, 16
- Kunth (1999) Kunth D., 1999, Ap&SS, 265, 489
- Lagos et al. (2018) Lagos P., Scott T. C., Nigoche-Netro A., Demarco R., Humphrey A., Papaderos P., 2018, MNRAS, 477, 392
- Lee et al. (2006) Lee H., Skillman E. D., Cannon J. M., Jackson D. C., Gehrz R. D., Polomski E. F., Woodward C. E., 2006, ApJ, 647, 970
- Lelli et al. (2014a) Lelli F., Verheijen M., Fraternali F., 2014a, MNRAS, 445, 1694
- Lelli et al. (2014b) Lelli F., Verheijen M., Fraternali F., 2014b, A&A, 566, A71
- Li et al. (2018) Li D., et al., 2018, IEEE Microwave Magazine, 19, 112
- López-Sánchez (2010) López-Sánchez Á. R., 2010, A&A, 521, A63
- López-Sánchez & Esteban (2008) López-Sánchez Á. R., Esteban C., 2008, A&A, 491, 131
- López-Sánchez & Esteban (2009) López-Sánchez A. R., Esteban C., 2009, A&A, 508, 615
- López-Sánchez & Esteban (2010) López-Sánchez Á. R., Esteban C., 2010, A&A, 516, A104
- López-Sánchez et al. (2012) López-Sánchez Á. R., Koribalski B. S., van Eymeren J., Esteban C., Kirby E., Jerjen H., Lonsdale N., 2012, MNRAS, 419, 1051
- Mannucci et al. (2010) Mannucci F., Cresci G., Maiolino R., Marconi A., Gnerucci A., 2010, MNRAS, 408, 2115
- McMullin et al. (2007) McMullin J. P., Waters B., Schiebel D., Young W., Golap K., 2007, in Shaw R. A., Hill F., Bell D. J., eds, Astronomical Society of the Pacific Conference Series Vol. 376, Astronomical Data Analysis Software and Systems XVI. p. 127
- Méndez & Esteban (2000) Méndez D. I., Esteban C., 2000, A&A, 359, 493
- Noeske et al. (2001) Noeske K. G., Iglesias-Páramo J., Vílchez J. M., Papaderos P., Fricke K. J., 2001, A&A, 371, 806
- Noguchi (1988) Noguchi M., 1988, A&A, 201, 37
- Pakull & Angebault (1986) Pakull M. W., Angebault L. P., 1986, Nature, 322, 511
- Prestwich et al. (2013) Prestwich A. H., Tsantaki M., Zezas A., Jackson F., Roberts T. P., Foltz R., Linden T., Kalogera V., 2013, ApJ, 769, 92
- Pustilnik & Martin (2007) Pustilnik S. A., Martin J. M., 2007, A&A, 464, 859
- Recchi et al. (2015) Recchi S., Kroupa P., Ploeckinger S., 2015, MNRAS, 450, 2367
- Roberts (1975) Roberts M. S., 1975, Radio Observations of Neutral Hydrogen in Galaxies. the University of Chicago Press, p. 309
- Rong et al. (2018) Rong Y., et al., 2018, preprint, (arXiv:1806.10149)
- Sánchez Almeida et al. (2015) Sánchez Almeida J., et al., 2015, ApJ, 810, L15
- Sargent & Searle (1970) Sargent W. L. W., Searle L., 1970, ApJ, 162, L155
- Schaerer et al. (1999) Schaerer D., Contini T., Pindao M., 1999, A&AS, 136, 35
- Serra et al. (2015) Serra P., et al., 2015, MNRAS, 448, 1922
- Silk et al. (1987) Silk J., Wyse R. F. G., Shields G. A., 1987, ApJ, 322, L59
- Skillman (1987) Skillman E. D., 1987, in Lonsdale Persson C. J., ed., NASA Conference Publication Vol. 2466, NASA Conference Publication.
- Spitzer (1978) Spitzer L., 1978, Physical processes in the interstellar medium, doi:10.1002/9783527617722.
- Stasińska & Leitherer (1996) Stasińska G., Leitherer C., 1996, ApJS, 107, 661
- Teich et al. (2016) Teich Y. G., et al., 2016, ApJ, 832, 85
- Thuan et al. (2016) Thuan T. X., Goehring K. M., Hibbard J. E., Izotov Y. I., Hunt L. K., 2016, MNRAS, 463, 4268
- Wright et al. (2010) Wright E. L., et al., 2010, AJ, 140, 1868
- Yang et al. (2017) Yang H., Malhotra S., Rhoads J. E., Wang J., 2017, ApJ, 847, 38
- Zhang et al. (2021) Zhang K., et al., 2021, MNRAS, 500, 1741
- Zwicky (1966) Zwicky F., 1966, ApJ, 143, 192
Appendix A