AlignScore: Evaluating Factual Consistency
with A Unified Alignment Function
Abstract
Many text generation applications require the generated text to be factually consistent with input information. Automatic evaluation of factual consistency is challenging. Previous work has developed various metrics that often depend on specific functions, such as natural language inference (NLI) or question answering (QA), trained on limited data. Those metrics thus can hardly assess diverse factual inconsistencies (e.g., contradictions, hallucinations) that occur in varying inputs/outputs (e.g., sentences, documents) from different tasks. In this paper, we propose AlignScore, a new holistic metric that applies to a variety of factual inconsistency scenarios as above. AlignScore is based on a general function of information alignment between two arbitrary text pieces. Crucially, we develop a unified training framework of the alignment function by integrating a large diversity of data sources, resulting in 4.7M training examples from 7 well-established tasks (NLI, QA, paraphrasing, fact verification, information retrieval, semantic similarity, and summarization). We conduct extensive experiments on large-scale benchmarks including 22 evaluation datasets, where 19 of the datasets were never seen in the alignment training. AlignScore achieves substantial improvement over a wide range of previous metrics. Moreover, AlignScore (355M parameters) matches or even outperforms metrics based on ChatGPT and GPT-4 that are orders of magnitude larger.111Our code is available at https://github.com/yuh-zha/AlignScore.
1 Introduction
Recent systems for natural language generation, such as summarization and dialogue systems, can produce fluent and coherent text. However, studies show the generated text can often contain factual consistency errors, such as contradictions with input information or hallucinations irrelevant to the context (Cao et al., 2018; Kryscinski et al., 2019; Nie et al., 2019a; Tan et al., 2020; Maynez et al., 2020; Deng et al., 2021).
It is thus crucial to develop automatic metrics that evaluate factual consistency of a claim (e.g., generated text) with regard to a context (e.g., model input). The evaluation, however, has long been a challenge. Recent work has devised various metrics based on specific pretrained functions, such as natural language inference (NLI) (Honovich et al., 2022a; Mishra et al., 2021; Kryscinski et al., 2020; Utama et al., 2022; Laban et al., 2022) and question answering (QA) (Durmus et al., 2020; Fabbri et al., 2022; Honovich et al., 2021; Fabbri et al., 2022). Specifically, an NLI-based metric measures if the claim is entailed by the context; while a QA-based metric first creates (question, answer) pairs from the claim and then checks if answering the questions with a QA model conditioning on the context will lead to the same answers.
However, by relying on specific functions trained with only narrow data (i.e., NLI or QA datasets), previous metrics have limited generalizability and fail to apply to diverse evaluation scenarios, including different types of factual consistency errors and varying lengths and characteristics of contexts/claims from different tasks and domains. For instance, a metric trained exclusively with NLI data of sentences in a certain domain tends to have difficulty in evaluating summaries of long documents in a different domain (Mishra et al., 2021; Laban et al., 2022). The limitations motivate a more holistic metric that develops a general understanding of factual consistency and generalizes to diverse evaluation scenarios.
In this paper, we propose AlignScore, a new general factual consistency metric based on a unified text-to-text information alignment function. In particular, we unify a wide range of data sources, and use the massive diverse data to train a general information alignment model that estimates an alignment score given two arbitrary text pieces. More specifically, we reformat and aggregate 15 datasets from 7 popular language tasks, including NLI, QA, paraphrasing, fact verification, information retrieval, semantic similarity, and summarization. This results in a total of 4.7M training examples with diverse characteristics, and yields an alignment function with great generalizability. We then build AlignScore using the alignment function as a building block. In particular, to handle long text and accommodate the different roles of context and claim, we develop a splitting strategy that breaks a context into coarse-grained chunks and a claim into fine-grained sentences. Aggregating the alignment scores between context-chunks and claim-sentences leads to the final factual consistency score.
In our experiments, we build AlignScore by finetuning the lightweight RoBERTa models (125M and 355M) for alignment. We evaluate AlignScore on the latest large-scale evaluation benchmarks, including SummaC (Laban et al., 2022), TRUE (Honovich et al., 2022b), and other testbeds, which contain a total of 22 challenging evaluation datasets. Our approach substantially outperforms previous state-of-the-art metrics in terms of different quality measures. Notably, our metric (355M) is on par with, and sometimes even much better than latest metrics based on orders-of-magnitude larger language models (e.g., ChatGPT and GPT-4). In particular, AlignScore shows strong generalizability on the 19 zero-shot datasets that were never seen during the alignment function training. We also conduct extensive ablation studies to demonstrate the effectiveness of the context splitting strategy and other modeling choices.
2 Related Work
Factual Consistency Metrics
Traditionally, generative systems are evaluated using n-gram based metrics (Papineni et al., 2002; Lin, 2004; Banerjee and Lavie, 2005; Popović, 2015). Recently, factual consistency metrics are often use task-specific language understanding capabilities, such as NLI and QA. To improve performance when evaluating generative tasks with long texts, NLI-based metrics adopt training sets with long premises (Honovich et al., 2022a; Mishra et al., 2021), use large synthetic datasets (Kryscinski et al., 2020; Utama et al., 2022), or use sentence level evaluation (Laban et al., 2022). A separate line of research formulates factual consistency evaluation as QA (Durmus et al., 2020; Fabbri et al., 2022; Honovich et al., 2021; Fabbri et al., 2022). Other consistency evaluation methods that use pretrained language models (LMs) include embedding matching (Zhang et al., 2020; Deng et al., 2021), finetuning LMs to directly regress human evaluation scores (Sellam et al., 2020), and using LMs to score candidates based on weighted log probability (Yuan et al., 2021; Liu et al., 2022). CTC (Deng et al., 2021) develops a suite of text generation evaluation metrics based on the similar concept of alignment. Yet we define alignment in a more general way to enable integration of diverse training data, and deliver AlignScore as a more effective metric focusing on factual consistency. Concurrent work proposes to combine large language models (LLMs) with prompting to evaluate different aspects of generated text, including factual consistency (Fu et al., 2023; Liu et al., 2023; Gao et al., 2023). Our proposed AlignScore shows stronger performance with a much smaller model size.
Unified Training
Recent work converts related but different tasks into the same input-output format to train unified models. Raffel et al. (2020) propose to unify text generation tasks into a text-to-text conditional generation problem. Sanh et al. (2022) further show that the text-to-text generation framework, combined with natural language prompting, improves zero-shot task generalization to unseen tasks. Zhong et al. (2022) develop a unified automatic evaluation metric by framing different aspects of NLG evaluation as a Boolean Question Answering problem. Recent studies also present task unification as an effective approach to improve model performance and generalizability in multi-modal tasks (Xie et al., 2022; Zhang et al., 2021; Wang et al., 2022).
| NLP Task | Dataset | Training Task | Avg. Word Count | Sample Count | |
| Context | Claim | ||||
| NLI | SNLI (Bowman et al., 2015) | 3-way classification | 13 | 7 | 550k |
| MultiNLI (Williams et al., 2018a) | 3-way classification | 20 | 10 | 393k | |
| Adversarial NLI (Nie et al., 2020) | 3-way classification | 54 | 10 | 163k | |
| DocNLI (Yin et al., 2021) | binary classification | 285 | 43 | 942k | |
| Fact Verification | NLI-style FEVER (Nie et al., 2019b) | 3-way classification | 50 | 8 | 208k |
| Vitamin C (Schuster et al., 2021) | 3-way classification | 25 | 11 | 371k | |
| Paraphrase | QQP (Csernai, ) | binary classification | 11 | 11 | 364k |
| PAWS (Zhang et al., 2019) | binary classification | 18 | 18 | 707k | |
| WikiText-103* (Merity et al., 2017) | binary classification | 22 | 21 | 8M | |
| STS | SICK (Marelli et al., 2014) | regression | 10 | 10 | 4k |
| STS Benchmark (Cer et al., 2017) | regression | 10 | 10 | 6k | |
| QA | SQuAD v2 (Rajpurkar et al., 2018) | binary classification | 119 | 11 | 130k |
| RACE (Lai et al., 2017) | binary classification | 273 | 14 | 351k | |
| Information Retrieval | MS MARCO (Nguyen et al., 2016) | binary classification | 56 | 15 | 5M |
| Summarization | WikiHow* (Koupaee and Wang, 2018) | binary classification | 508 | 46 | 157k |
3 Methods
We introduce the AlignScore metric built on top of a unified alignment function. We first train the alignment function by unifying a large diversity of data sources (Section 3.1). We then define AlignScore by combining the alignment function with a new context/claim splitting and aggregation strategy (Section 3.2).
3.1 Unified Alignment Function
Given two pieces of text and , we consider to be aligned with if all information in is present in and does not contradict . Conceptually, we model information alignment as a function that maps the text pair to a label that characterizes the level of alignment:
| (1) |
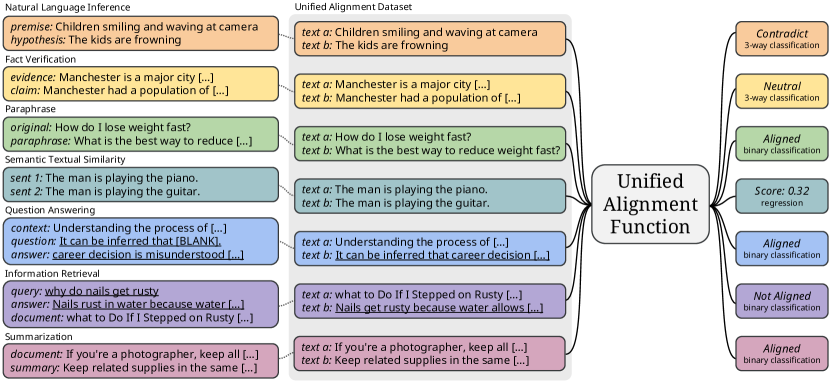
A holistic and generalizable alignment function must account for all types of consistency errors, domains, and data distributions. Therefore, in order to learn the alignment function, we want to adapt and aggregate diverse language tasks to form a unified alignment training corpus (Figure 1). In this work, we collect 15 datasets spanning 7 well-established tasks, including NLI, fact verification, paraphrase, semantic textual similarity, QA, information retrieval, and summarization. We present an overview of these datasets in Table 1 and include more details in Section A.1 and A.2 in the appendix.
The vast diversity of input/output formats across the above tasks poses significant challenge for unifying them into a uniform alignment training corpus. To unify input formats, we convert each sample into a text pair . For tasks that do not cleanly fit into the text pair format, such as QA (where each sample contains a question, an answer, and a context) and information retrieval (where each sample contains a query, an answer, and a supporting document), we use a sequence-to-sequence model (Song, 2022) to convert the question answer pair into a single declarative sentence (underlined items in Figure 1; See Section C.1 for examples).
To unify output formats, while it is possible to transform all tasks into binary classification, instead we convert them into a set of related alignment problems to preserve as much information as possible from the original datasets (Figure 1). Specifically, we devise 3 options for the alignment label :
More concretely, for tasks that come with discrete labels, depending on their setup, the alignment function predicts either the binary classification label (paraphrase, QA, information retrieval, and summarization) or the 3-way classification label (NLI, and fact verification); for tasks with continuous labels (semantic textual similarity), the alignment function predicts the regression label . Here a higher indicates that more information in is supported by .
We build the alignment model consisting of a language model (e.g., RoBERTa; Liu et al., 2019) and 3 individual linear layers as the 3-way classification (), binary classification (), and regression () heads. First, we feed into the language model the concatenation of the text pair and use the contextual embedding of the special begin-of-sentence token as the encoded representation, . Then, the classification and regression heads map into an estimation of , , and through logistic regression and linear regression, respectively. We use cross entropy loss for both 3-way and binary classification, and mean squared error loss for regression. The joint loss function is:
| (2) |
where are scalar weights. In our experiments, we set .

3.2 The AlignScore Metric
As the definition of factual consistency is closely related to the information alignment problem, one naive way of building a factual consistency metric is simply using the alignment model to estimate the alignment score of the text pair (context, claim). However, this approach (also referred to as "document level evaluation"; Laban et al., 2022) has several drawbacks.
First, generative tasks often contain long inputs, especially long contexts, that go beyond the input length limit of a language model (e.g., source documents in summarization tasks can easily exceed the 512-token limit of a RoBERTa model). Consequently, if long inputs are not explicitly handled (Kryscinski et al., 2020; Mishra et al., 2021), language-model-based metrics could silently drop important information because of truncation.
Second, information contained in a claim often spreads across multiple sentences in the context. To verify the factual consistency of a claim, a metric needs access to long context spans. Therefore, evaluating the claim against individual context sentences (as in previous sentence level evaluation; Laban et al., 2022; Amplayo et al., 2022) can degrade metric performance as paragraph- and document-level semantic information is lost.
Third, humans typically assign consistency scores in a continuous spectrum that reflect the amount of consistency errors in the samples. Similarly, good metrics should produce fine-grained scores. Unfortunately, as classification tasks make up most of the training data (only semantic textual similarity datasets provide continuous labels), our alignment model tends to assign scores close to the two extremes, limiting its effectiveness if used directly as a factual consistency metric.
Conceptually, to resolve the first challenge, we need to split the context into chunks such that when concatenated with a claim, the resulting sequence does not exceed the input length limit. By picking a large enough chunk size, we allow the model to reason over longer context spans, mitigating the second issue. Since sentences in a claim tend to be self-contained statements, an effective way to make the metric produce more fine-grained scores is to evaluate claim sentences independently of each other Laban et al. (2022). Specifically, for each sentence in the claim (green rectangles in Figure 2), we evaluate it against all context chunks (yellow rectangles in Figure 2) using the alignment function. Then, we select the highest alignment score (lines labeled with numbers in Figure 2) for each claim sentence. Intuitively, this step identifies the context chunk that most strongly supports each claim sentence, and the highest score reflects how well the claim sentence is supported. Finally, we use the average value of all highest scores as the factual consistency score. This addresses the third challenge, as taking the average prevents a single inconsistent claim sentence from dominating the final score. Alternatively, the average value of highest scores can be roughly interpreted as "the proportion of the claim that are factually consistent with respect to the context", which naturally leads to a more fine-grained metric. As we show in experiments, our novel chunk level evaluation method consistently outperforms document level (which risks truncation) and sentence level evaluation.
We formally define AlignScore as:
| (3) |
where is the context, is the claim, is the set of context chunks, is the set of claim sentences, and is the probability of the model predicting the aligned label in the 3-way classification setting. In practice, for RoBERTa models (that have an input length limit of 512 tokens) we split the context into chunks at sentence boundaries such that each chunk contains roughly 350 tokens. We use the output of the 3-way classification head, our ablation studies reveal that it performs better than the binary classification head and the regression head (Section 4.5).
| Type | Metric | CGS | XSF | PolyTope | FactCC | SummEval | FRANK | AVG |
| FEQA | 53.7 | 47.6 | 54.3 | 47.9 | 48.8 | 37.2 | 48.3 | |
| QuestEval | 60.4 | 63.6 | 77.0 | 74.2 | 74.3 | 85.8 | 72.5 | |
| QA | QAFactEval | 83.4 | 66.1 | 86.4 | 89.2 | 88.1 | 89.4 | 83.8 |
| ROUGE-1 | 69.7 | 64.5 | 82.5 | 75.8 | 87.2 | 85.0 | 77.4 | |
| ROUGE-2 | 70.5 | 65.9 | 83.7 | 76.0 | 87.2 | 85.3 | 78.1 | |
| ROUGE-L | 70.2 | 62.9 | 81.9 | 76.3 | 87.3 | 85.3 | 77.3 | |
| BLEU | 71.8 | 55.8 | 86.9 | 75.0 | 83.8 | 84.5 | 76.3 | |
| BERTScore | 63.1 | 49.0 | 85.3 | 70.9 | 79.6 | 84.9 | 72.1 | |
| NER-Overlap | 51.1 | 64.9 | 72.1 | 49.8 | 56.6 | 68.1 | 60.4 | |
| Similarity Matching | SimCSE | 56.2 | 62.2 | 75.2 | 59.0 | 77.2 | 74.8 | 67.4 |
| Regression | BLEURT | 60.8 | 64.7 | 76.7 | 59.7 | 71.1 | 82.5 | 69.2 |
| MNLI | 44.9 | 46.6 | 45.0 | 48.3 | 43.5 | 59.3 | 47.9 | |
| DAE | 52.4 | 76.7 | 72.8 | 54.2 | 66.1 | 78.9 | 66.8 | |
| SummaC-ZS | 73.6 | 58.0 | 87.5 | 83.7 | 85.8 | 85.3 | 79.0 | |
| NLI | SummaC-CONV | 67.2 | 70.3 | 81.8 | 92.3 | 86.1 | 88.5 | 81.0 |
| UniEval | 84.7 | 65.5 | 93.4 | 89.9 | 86.3 | 88.0 | 84.6 | |
| CTC | 76.5 | 65.9 | 89.5 | 82.6 | 85.6 | 87.3 | 81.2 | |
| BARTScore | 74.3 | 62.6 | 91.7 | 82.3 | 85.9 | 88.5 | 80.9 | |
| FactCC | 64.9 | 55.1 | 78.5 | 72.7 | 71.8 | 69.8 | 68.8 | |
| Misc | BLANC | 54.1 | 53.5 | 74.7 | 56.4 | 68.6 | 83.4 | 65.1 |
| AlignScore-base | 83.7 | 79.4 | 87.8 | 93.3 | 89.9 | 90.5 | 87.4 | |
| Ours | AlignScore-large | 86.4 | 75.8 | 92.4 | 93.7 | 91.7 | 91.4 | 88.6 |
4 Experiments
In this section, we evaluate AlignScore on a wide range of benchmarks and show it consistently outperforms existing metrics (Section 4.1-4.4). We also conduct extensive ablation study in Section 4.5.
4.1 Implementation
We use RoBERTa (Liu et al., 2019) to implement the alignment model. We denote AlignScore based on RoBERTa-base/large as AlignScore-base/large.
We follow common practice (Liu et al., 2019; Devlin et al., 2019) and train the model for 3 epochs with a batch size of 32 in all the experiments. Training samples are randomly sampled across the converted upstream NLP tasks. Due to resource constraints we only use the first 500k samples in each dataset for training, resulting in a total of 4.7 million training samples. Training details are listed in Appendix A.3.
4.2 Benchmarks
Following Deng et al. (2021), Fabbri et al. (2022), Zhong et al. (2022) and Gabriel et al. (2021), we evaluate factual consistency metrics using TRUE benchmark (Honovich et al., 2022a) (consists of 11 datasets in diverse domains), SummaC benchmark (Laban et al., 2022) (includes 6 large summarization datasets), and a set of other latest datasets including XSumFaith (Maynez et al., 2020), SummEval (Fabbri et al., 2021), QAGS-XSum (Wang et al., 2020), QAGS-CNNDM (Wang et al., 2020), FRANK (Pagnoni et al., 2021) and SamSum (Gliwa et al., 2019).
SummaC benchmark standardizes the task of summary inconsistency detection by casting it as a binary classification problem. Following Laban et al. (2022), we 1) tune the threshold of metrics on the validation sets, and then compute the balanced accuracy (Brodersen et al., 2010) on the test sets, 2) report the AUC-ROC (Bradley, 1997) of each metric. TRUE benchmark covers summarization, dialogue, paraphrase and fact verification tasks. It also assigns binary labels to samples based on whether the entire claim is factually consistent with the context. We report AUC-ROC of each metric following Honovich et al. (2022a). We also collect 6 popular factual consistency evaluation datasets, namely XSumFaith, SummEval, QAGS-XSum, QAGS-CNNDM, FRANK and SamSum. We compute instance-level Pearson, Spearman, and Kendall’s tau correlation coefficients between metric scores and human annotated consistency scores.
| Type | Metric | SE | PAWS | Q2 | VitC | FVR | FRK | DF | MNBM | Q-C | Q-X | BEGIN | AVG | AVG-ZS |
| FEQA | 49.5 | 50.0 | 53.2 | 49.9 | 51.1 | 63.0 | 50.5 | 48.8 | 50.1 | 49.4 | 53.0 | 51.7 | 52.2 | |
| QuestEval | 69.7 | 69.0 | 72.2 | 66.6 | 72.5 | 84.0 | 77.2 | 64.8 | 64.5 | 55.2 | 83.9 | 70.9 | 71.4 | |
| QA | QAFactEval | 80.9 | 86.1 | 75.8 | 73.6 | 86.0 | 88.5 | 81.8 | 67.3 | 83.9 | 76.1 | 81.0 | 80.1 | 79.4 |
| ROUGE-1 | 80.4 | 50.2 | 59.7 | 60.9 | 57.8 | 83.6 | 65.3 | 64.8 | 77.3 | 60.1 | 84.6 | 67.7 | 72.0 | |
| ROUGE-2 | 79.4 | 68.6 | 61.4 | 59.9 | 55.5 | 84.5 | 67.7 | 65.0 | 78.4 | 60.2 | 82.8 | 69.4 | 72.4 | |
| ROUGE-L | 80.4 | 75.9 | 60.6 | 59.7 | 56.4 | 83.6 | 65.4 | 62.8 | 77.6 | 59.3 | 85.0 | 69.7 | 71.8 | |
| BLEU | 74.8 | 71.3 | 55.2 | 56.1 | 51.7 | 84.1 | 61.2 | 56.7 | 77.4 | 54.7 | 74.6 | 65.2 | 67.3 | |
| BERTScore | 72.3 | 78.6 | 70.2 | 58.2 | 54.2 | 84.0 | 68.6 | 52.5 | 70.6 | 44.3 | 86.4 | 67.2 | 68.6 | |
| NER-Overlap | 56.6 | 51.7 | 59.1 | 57.8 | 62.4 | 65.5 | 62.7 | 68.4 | 48.4 | 63.6 | 50.6 | 58.8 | 59.3 | |
| Similarity Matching | SimCSE | 70.2 | 69.2 | 66.2 | 63.8 | 72.7 | 72.9 | 70.6 | 64.6 | 74.9 | 56.5 | 86.1 | 69.8 | 70.3 |
| Regression | BLEURT | 68.0 | 68.4 | 72.9 | 61.8 | 59.5 | 81.6 | 73.0 | 65.5 | 71.2 | 56.2 | 86.6 | 69.5 | 71.9 |
| MNLI | 44.6 | 81.3 | 71.8 | 80.2 | 93.1 | 57.2 | 76.5 | 59.1 | 42.6 | 50.1 | 81.5 | 67.1 | 60.4 | |
| DAE | 60.3 | 55.8 | 57.7 | 60.2 | 77.8 | 77.9 | 54.7 | 81.0 | 56.9 | 67.5 | 69.4 | 65.4 | 65.7 | |
| SummaC-ZS | 77.6 | 89.0 | 81.8 | 97.2 | 92.8 | 86.9 | 87.1 | 58.0 | 76.0 | 75.3 | 83.2 | 82.2 | 78.2 | |
| NLI | SummaC-CONV | 79.1 | 88.2 | 77.5 | 97.5 | 92.0 | 89.0 | 81.2 | 67.2 | 77.7 | 76.0 | 81.6 | 82.5 | 78.7 |
| UniEval | 81.2 | 80.1 | 70.4 | 79.1 | 92.1 | 88.1 | 80.4 | 66.8 | 86.5 | 76.7 | 73.6 | 79.5 | 78.0 | |
| CTC | 79.8 | 63.1 | 66.8 | 65.0 | 72.5 | 87.1 | 63.7 | 65.0 | 77.3 | 67.7 | 72.0 | 70.9 | 72.4 | |
| BARTScore | 78.9 | 77.1 | 65.1 | 64.2 | 66.1 | 87.8 | 60.8 | 63.5 | 83.9 | 60.2 | 86.7 | 72.2 | 73.4 | |
| FactCC | 68.6 | 53.4 | 59.3 | 54.7 | 58.7 | 70.7 | 55.0 | 56.1 | 70.1 | 64.4 | 57.6 | 60.8 | 62.7 | |
| Misc | BLANC | 63.3 | 56.0 | 62.9 | 55.7 | 53.6 | 82.1 | 63.8 | 54.2 | 60.9 | 50.9 | 73.7 | 61.6 | 64.0 |
| AlignScore-base | 80.8 | 97.3 | 76.1 | 97.8 | 94.6 | 90.0 | 83.1 | 79.9 | 87.7 | 79.6 | 82.4 | 86.3 | 82.5 | |
| Ours | AlignScore-large | 82.9 | 98.4 | 78.6 | 98.3 | 94.9 | 92.1 | 85.1 | 76.1 | 89.5 | 83.5 | 82.7 | 87.4 | 83.8 |
4.3 Baselines
We compare AlignScore with state-of-the-art metrics, which we categorize into question answering (QA), similarity matching, regression, NLI, and miscellaneous. We use open-source code and models released by authors. Additionally, we also compare with latest LLM-based metrics.
QA Based Metrics adapt question generation (QG) and question answering (QA) models to automatically evaluate factual consistency. We include the latest QAFactEval (Fabbri et al., 2022), QuestEval (Scialom et al., 2021), and FEQA (Durmus et al., 2020) as our baselines.
Similarity Matching Based Metrics vary in their granularity and matching functions. We report BLEU (Papineni et al., 2002) and ROUGE-1/2/L (Lin, 2004), which compute token-level string matching scores. We also include the named-entity level metric NER-Overlap introduced in Laban et al. (2022). BERTScore (Zhang et al., 2020) uses token-level embedding to compute scores, for which we use the best variant (microsoft/deberta-xlarge-mnli) recommended by the authors222https://github.com/Tiiiger/bert_score. We also use SimCSE (Gao et al., 2021) as sentence-level embedding matching function, with the best released model sup-simcse-roberta-large333https://github.com/princeton-nlp/SimCSE.
Regression Based Metrics learn to estimate ground truth scores directly. We use BLEURT (Sellam et al., 2020) with its recommended checkpoint (BLEURT-20)444https://github.com/google-research/bleurt as our baseline.
NLI Based Metrics methods also vary in their granularity. We use a RoBERTa-large (Liu et al., 2019) model finetuned555https://huggingface.co/roberta-large-mnli on MultiNLI (Williams et al., 2018b) as a baseline for document-level evaluation, where the model evaluates a candidate against the entire context. Our baselines also include the DAE (Goyal and Durrett, 2020) metric, which decomposes text at the level of dependency arcs. For sentence-level baseline, we use SummaC-ZeroShot and SummaC-Conv introduced in the SummaC Benchmark (Laban et al., 2022) and FactCC (Kryscinski et al., 2020) which is trained on synthetic data.
Miscellaneous Besides the above metrics, we also use competitive metrics including UniEval (Zhong et al., 2022), CTC (Deng et al., 2021), BARTScore (Yuan et al., 2021) and BLANC (Vasilyev et al., 2020) as baselines.
UniEval is a unified multi-dimensional metric, capable of evaluating different aspects of text generation. We use the Consistency variant as the baseline. Deng et al. (2021) propose CTC, which is based on token-level information alignment. We use its discriminative variant trained on synthetic CNN/DailyMail (See et al., 2017) (D-CNNDM) as our baseline. For BARTScore, we use the pretrained BART-Large-CNN666https://github.com/neulab/BARTScore checkpoint.
LLM-Based Metrics Concurrent work proposes to utilize LLMs for NLG evaluation. GPTScore uses the log probability of an LLM generating the target text conditioned on the prompt as the metric score (Fu et al., 2023). G-EVAL first augments its prompts with chain-of-thoughts and then evaluates texts by form-filling (Liu et al., 2023). Gao et al. (2023) uses ChatGPT in place of human annotators in four popular human evaluation setups (ChatGPT in Table 5). As we directly compare with correlation coefficients reported by Fu et al. (2023); Liu et al. (2023); Gao et al. (2023), results on some datasets are not available.
| Type | Metric | XSF | SE | Q-X | Q-C | FRK-X | FRK-C | SSum | AVG |
| FEQA | 1.3 | -2.9 | -7.3 | -3.9 | 3.0 | -0.4 | 2.7 | -1.0 | |
| QuestEval | 41.9 | 29.7 | 11.7 | 36.3 | 19.5 | 46.5 | 0.4 | 26.6 | |
| QA | QAFactEval | 30.3 | 61.6 | 44.2 | 68.4 | 32.1 | 64.6 | 38.9 | 48.6 |
| ROUGE-1 | 36.1 | 41.1 | 15.7 | 58.2 | 6.8 | 37.1 | 16.7 | 30.3 | |
| ROUGE-2 | 27.6 | 40.9 | 14.4 | 59.2 | 4.9 | 38.7 | 19.1 | 29.3 | |
| ROUGE-L | 30.6 | 42.3 | 12.5 | 58.2 | 8.0 | 37.7 | 17.4 | 29.5 | |
| BLEU | 18.9 | 41.5 | 10.9 | 64.9 | 8.7 | 36.6 | 16.2 | 28.2 | |
| BERTScore | 13.0 | 33.1 | -10.6 | 51.7 | 13.0 | 51.7 | 10.9 | 23.3 | |
| NER-Overlap | 21.9 | 24.9 | 31.2 | 0.3 | 11.4 | 30.1 | 16.7 | 19.5 | |
| Similarity Matching | SimCSE | 30.9 | 28.5 | 11.9 | 48.6 | 13.5 | 34.5 | 10.7 | 25.5 |
| Regression | BLEURT | 38.7 | 23.8 | 13.2 | 45.2 | 15.6 | 37.5 | 8.1 | 26.0 |
| MNLI | 15.8 | -1.8 | 6.1 | -11.0 | 19.7 | -2.2 | 28.0 | 7.8 | |
| DAE | 42.5 | 41.5 | 37.5 | 42.7 | 32.9 | 40.5 | 18.6 | 36.6 | |
| SummaC-ZS | 6.4 | 50.1 | 43.7 | 56.1 | 14.7 | 53.7 | 13.7 | 34.0 | |
| NLI | SummaC-CONV | 10.2 | 50.3 | 36.4 | 63.6 | 17.6 | 58.7 | 12.4 | 35.6 |
| UniEval | 23.9 | 57.8 | 45.5 | 66.7 | 27.2 | 58.3 | 23.2 | 43.2 | |
| CTC | 27.2 | 54.7 | 30.6 | 64.5 | 20.0 | 54.5 | 16.9 | 38.3 | |
| BARTScore | 29.3 | 35.5 | 16.3 | 71.5 | 23.7 | 51.9 | 15.0 | 34.7 | |
| FactCC | 4.9 | 34.8 | 28.8 | 38.6 | 8.3 | 34.8 | -4.4 | 20.8 | |
| Misc | BLANC | 8.3 | 21.3 | 1.8 | 25.7 | 6.4 | 34.3 | 8.3 | 15.2 |
| AlignScore-base | 38.2 | 61.1 | 49.5 | 72.3 | 33.2 | 60.0 | 23.9 | 48.3 | |
| Ours | AlignScore-large | 31.1 | 66.3 | 52.7 | 78.1 | 38.3 | 67.7 | 44.6 | 54.1 |
4.4 Results
4.4.1 Results on SummaC Benchmark
We report AUC-ROC on the test set of the SummaC Benchmark in Table 2. A higher AUC-ROC score indicates the metric is better at detecting factual consistency errors. Our AlignScore-large achieves the best average performance on the SummaC benchmark, scoring the highest in 4 out of 6 datasets. We also present the balanced accuracy in Appendix (Table 9), where AlignScore-large also establishes new state-of-the-art results.
4.4.2 Results on TRUE Benchmark
The results on the TRUE benchmark are shown in Table 3, where AlignScore-large gets the highest average AUC-ROC score. It outperforms baselines on 7 out of 11 tasks while staying competitive on the rest. For a fair comparison, we also report the average AUC-ROC (denoted as AVG-ZS) excluding datasets that the alignment function is trained on (PAWS, VitaminC and FEVER). The performance of AlignScore remains to be on top, outperforming strong baselines like QAFactEval, UniEval, and SummaC-CONV. This demonstrates AlignScore generalizes well to unseen data (e.g., DialFact dataset in the dialogue domain).
4.4.3 Results on Other Datasets
We present Pearson correlation coefficients of various metrics on other factual consistency datasets in Table 4. We also report Spearman correlation and Kendall’s tau coefficients in Appendix (Table 10 and 11). The AlignScore-large metric outperforms previous metrics in terms of overall performance, including the competitive QAFactEval and UniEval metrics, dominating 6 out of 7 datasets. We note that DAE and QuestEval perform better on XSumFaith dataset. Similar to Fabbri et al. (2022), we speculate it is because the relatedness between the token-level annotation of XSumFaith and the fine-grained metrics.
| Metric | Backbone | Datasets | ||
| SE | Q-X | Q-C | ||
| G-EVAL-3.5 | GPT3.5-d03 | 38.6 | 40.6 | 51.6 |
| G-EVAL-4 | GPT4 | 50.7 | 53.7 | 68.5 |
| GPTScore | GPT3.5-d03 | 47.5 | / | / |
| ChatGPT | GPT3.5-turbo | 43.3 | / | / |
| AlignScore-base | RoBERTa (125M) | 43.4 | 51.9 | 69.0 |
| AlignScore-large | RoBERTa (355M) | 46.6 | 57.2 | 73.9 |
We also compare our metric with LLM-based metrics in Table 5. Result shows AlignScore has comparable performance with LLM-based metrics on SummEval. And it outperforms LLM-based metrics on QAGS-XSum and QAGS-CNNDM, showing the capability and efficiency of our proposed metric.
4.5 Ablation Study
To understand 1) which classification head is more suitable for factual consistency evaluation, 2) which splitting method is more effective, and 3) which upstream NLP task contributes the most to the superior performance of AlignScore, we conduct 3 ablation studies. The experiments in this section are all based on AlignScore-base.
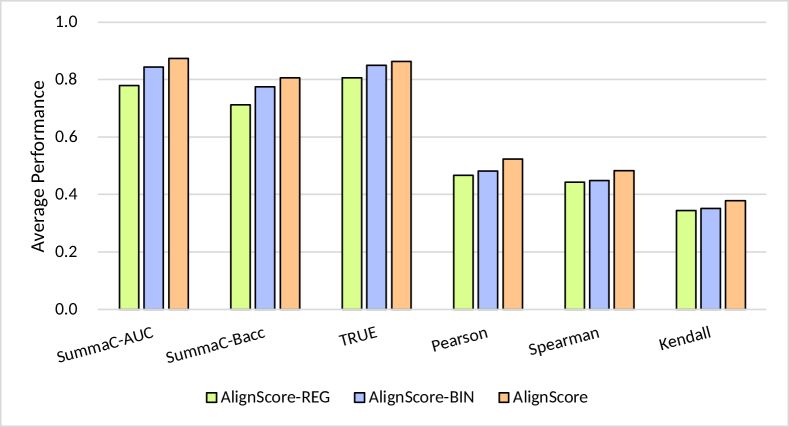
Classification Head
We keep the same splitting method as in Section 3.2 and change the heads that generate alignment scores. We first use the regression head (AlignScore-base-REG) and the binary classification head (AlignScore-base-BIN). Then, we compare these two heads with our proposed AlignScore-base, which adopts the 3-way classification head. We present the results in Figure 3, which shows the 3-way classification head consistently performs better than the regression head and the binary classification head.
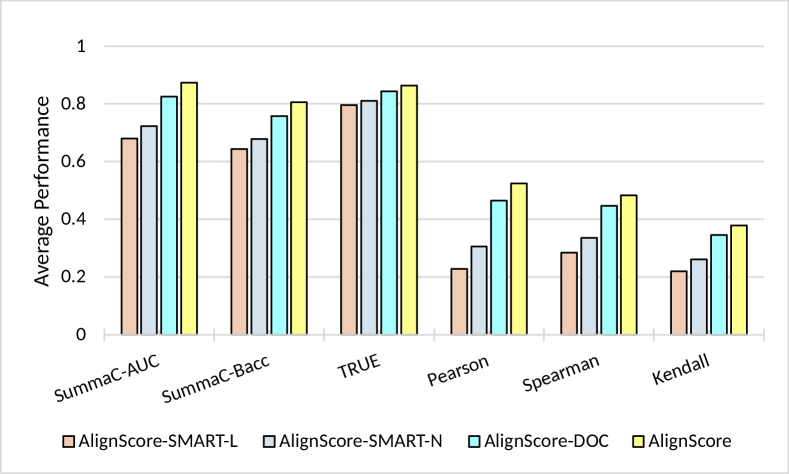
Splitting Method
Then, we keep the 3-way classification head and change the splitting method. Following Amplayo et al. (2022), we implement SMART-L and SMART-N, and use our alignment model as the sentence matching function. SMART-L uses sentence-level evaluation and aggregates the alignment scores through a soft version of Longest Common Subsequence (LCS), while SMART-N aggregates using greedy matching between N-sentences. In our experiments, we set N=1. We also implement AlignScore without any splitting (denoted as AlignScore-base-DOC) where the inputs are directly fed into the model. The result in Figure 4 shows that our chunk level splitting method performs best compared to the other 3 methods. It demonstrates that our splitting method helps AlignScore capture salient information from long contexts.
Upstream NLP Task
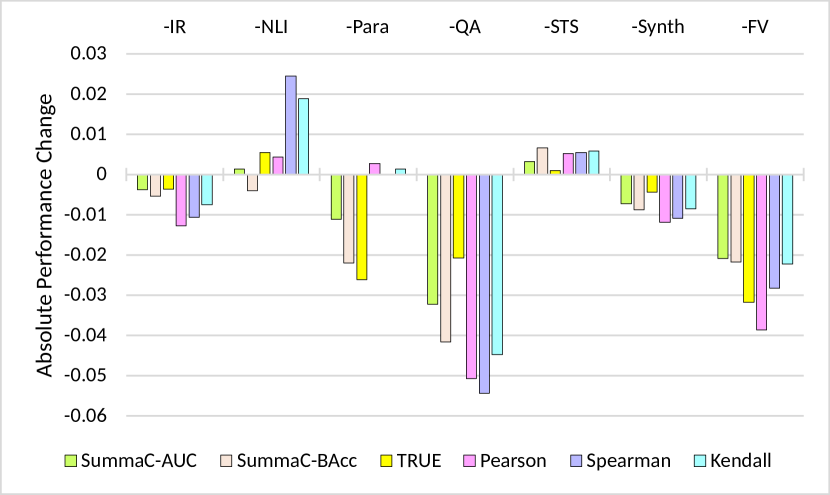
We study the contribution of each upstream NLP task by excluding one task at a time to train the alignment model. The results are shown in Figure 5. When the QA task is removed, the performance of the metric is the worst, indicating QA datasets make the biggest contribution to metric performance. Similarly, fact verification task has the second largest contribution. Surprisingly, with the removal of the NLI task, the model performs better on a majority of benchmarks, showing the NLI task plays a negative role in the training. We speculate that it is because 1) premises and hypothesises in NLI datasets are generally shorter, which differs from most factual consistency benchmarks and datasets, 2) other NLP tasks have larger-scale and higher quality datasets.
5 Conclusion
We propose AlignScore, a holistic factual consistency metric based on a unified alignment function. To learn the alignment function, we adapt 7 well established language understanding tasks into a unified alignment task , resulting in 4.7M diverse training samples. Experiments show AlignScore achieves state-of-the-art performance on SummaC and TRUE Benchmark, has higher correlation with human judgements than competing metrics, and generalizes well to unseen data.
Limitations
Interpretability. Although AlignScore shows high correlation with human judgments, it is hard to interpret the reasoning behind its predictions. Therefore, an interesting future research direction is to develop interpretable factual consistency metrics that can accurately identify words or spans in the input that contain factual consistency errors and (or) produce human readable explanations justifying its predictions.
Synthetic data. Our alignment training data contains datasets augmented with synthetic data. While ablation studies show that synthetic data helps improve metric performance, our rule-based method for generating synthetic data could generate noisy data that may not accurately model the error types and distributions produced by real world generative systems. Thus, analyzing the quality of synthetic data and developing more effective ways to generate synthetic data is an interesting research topic.
Language coverage. While we show AlignScore generalize well to unseen data, it only covers a single language, English. Undoubtedly, factual consistency evaluation is also important for more resource-constrained languages or in a multilingual setting. Consequently, future research could focus on extending the Align metric to multiple languages, including resource-constrained languages.
Ethics Statement
AlignScore is intended as an automatic metric to be used in NLP research. While it has state-of-the-art performance, it can produce false positives and false negatives, and may not be appropriate for applications other than its intended use. As it is trained on publicly available datasets, the metric might be affected by biases inherent to those datasets.
References
- Amplayo et al. (2022) Reinald Kim Amplayo, Peter J. Liu, Yao Zhao, and Shashi Narayan. 2022. SMART: sentences as basic units for text evaluation. CoRR, abs/2208.01030.
- Banerjee and Lavie (2005) Satanjeev Banerjee and Alon Lavie. 2005. METEOR: An automatic metric for MT evaluation with improved correlation with human judgments. In Proceedings of the ACL Workshop on Intrinsic and Extrinsic Evaluation Measures for Machine Translation and/or Summarization, pages 65–72, Ann Arbor, Michigan. Association for Computational Linguistics.
- Barrios et al. (2016) Federico Barrios, Federico López, Luis Argerich, and Rosa Wachenchauzer. 2016. Variations of the similarity function of textrank for automated summarization. CoRR, abs/1602.03606.
- Bowman et al. (2015) Samuel R. Bowman, Gabor Angeli, Christopher Potts, and Christopher D. Manning. 2015. A large annotated corpus for learning natural language inference. In Proceedings of the 2015 Conference on Empirical Methods in Natural Language Processing, pages 632–642, Lisbon, Portugal. Association for Computational Linguistics.
- Bradley (1997) Andrew P Bradley. 1997. The use of the area under the roc curve in the evaluation of machine learning algorithms. Pattern recognition, 30(7):1145–1159.
- Brodersen et al. (2010) Kay Henning Brodersen, Cheng Soon Ong, Klaas Enno Stephan, and Joachim M Buhmann. 2010. The balanced accuracy and its posterior distribution. In 2010 20th international conference on pattern recognition, pages 3121–3124. IEEE.
- Cao et al. (2018) Ziqiang Cao, Furu Wei, Wenjie Li, and Sujian Li. 2018. Faithful to the original: Fact aware neural abstractive summarization. In Proceedings of the Thirty-Second AAAI Conference on Artificial Intelligence, (AAAI-18), the 30th innovative Applications of Artificial Intelligence (IAAI-18), and the 8th AAAI Symposium on Educational Advances in Artificial Intelligence (EAAI-18), New Orleans, Louisiana, USA, February 2-7, 2018, pages 4784–4791. AAAI Press.
- Cer et al. (2017) Daniel M. Cer, Mona T. Diab, Eneko Agirre, Iñigo Lopez-Gazpio, and Lucia Specia. 2017. Semeval-2017 task 1: Semantic textual similarity - multilingual and cross-lingual focused evaluation. CoRR, abs/1708.00055.
- (9) Kornél Csernai. First quora dataset release: Question pairs.
- Demszky et al. (2018) Dorottya Demszky, Kelvin Guu, and Percy Liang. 2018. Transforming question answering datasets into natural language inference datasets. CoRR, abs/1809.02922.
- Deng et al. (2021) Mingkai Deng, Bowen Tan, Zhengzhong Liu, Eric Xing, and Zhiting Hu. 2021. Compression, transduction, and creation: A unified framework for evaluating natural language generation. In Proceedings of the 2021 Conference on Empirical Methods in Natural Language Processing, pages 7580–7605, Online and Punta Cana, Dominican Republic. Association for Computational Linguistics.
- Devlin et al. (2019) Jacob Devlin, Ming-Wei Chang, Kenton Lee, and Kristina Toutanova. 2019. BERT: Pre-training of deep bidirectional transformers for language understanding. In Proceedings of the 2019 Conference of the North American Chapter of the Association for Computational Linguistics: Human Language Technologies, Volume 1 (Long and Short Papers), pages 4171–4186, Minneapolis, Minnesota. Association for Computational Linguistics.
- Durmus et al. (2020) Esin Durmus, He He, and Mona Diab. 2020. FEQA: A question answering evaluation framework for faithfulness assessment in abstractive summarization. In Proceedings of the 58th Annual Meeting of the Association for Computational Linguistics, pages 5055–5070, Online. Association for Computational Linguistics.
- Dziri et al. (2022) Nouha Dziri, Hannah Rashkin, Tal Linzen, and David Reitter. 2022. Evaluating attribution in dialogue systems: The BEGIN benchmark. Transactions of the Association for Computational Linguistics, 10:1066–1083.
- Fabbri et al. (2022) Alexander Fabbri, Chien-Sheng Wu, Wenhao Liu, and Caiming Xiong. 2022. QAFactEval: Improved QA-based factual consistency evaluation for summarization. In Proceedings of the 2022 Conference of the North American Chapter of the Association for Computational Linguistics: Human Language Technologies, pages 2587–2601, Seattle, United States. Association for Computational Linguistics.
- Fabbri et al. (2021) Alexander R. Fabbri, Wojciech Kryściński, Bryan McCann, Caiming Xiong, Richard Socher, and Dragomir Radev. 2021. SummEval: Re-evaluating summarization evaluation. Transactions of the Association for Computational Linguistics, 9:391–409.
- Falke et al. (2019) Tobias Falke, Leonardo F. R. Ribeiro, Prasetya Ajie Utama, Ido Dagan, and Iryna Gurevych. 2019. Ranking generated summaries by correctness: An interesting but challenging application for natural language inference. In Proceedings of the 57th Annual Meeting of the Association for Computational Linguistics, pages 2214–2220, Florence, Italy. Association for Computational Linguistics.
- Fu et al. (2023) Jinlan Fu, See-Kiong Ng, Zhengbao Jiang, and Pengfei Liu. 2023. Gptscore: Evaluate as you desire. CoRR, abs/2302.04166.
- Gabriel et al. (2021) Saadia Gabriel, Asli Celikyilmaz, Rahul Jha, Yejin Choi, and Jianfeng Gao. 2021. GO FIGURE: A meta evaluation of factuality in summarization. In Findings of the Association for Computational Linguistics: ACL-IJCNLP 2021, pages 478–487, Online. Association for Computational Linguistics.
- Gao et al. (2023) Mingqi Gao, Jie Ruan, Renliang Sun, Xunjian Yin, Shiping Yang, and Xiaojun Wan. 2023. Human-like summarization evaluation with chatgpt. CoRR, abs/2304.02554.
- Gao et al. (2021) Tianyu Gao, Xingcheng Yao, and Danqi Chen. 2021. SimCSE: Simple contrastive learning of sentence embeddings. In Proceedings of the 2021 Conference on Empirical Methods in Natural Language Processing, pages 6894–6910, Online and Punta Cana, Dominican Republic. Association for Computational Linguistics.
- Gliwa et al. (2019) Bogdan Gliwa, Iwona Mochol, Maciej Biesek, and Aleksander Wawer. 2019. SAMSum corpus: A human-annotated dialogue dataset for abstractive summarization. In Proceedings of the 2nd Workshop on New Frontiers in Summarization, pages 70–79, Hong Kong, China. Association for Computational Linguistics.
- Goyal and Durrett (2020) Tanya Goyal and Greg Durrett. 2020. Evaluating factuality in generation with dependency-level entailment. In Findings of the Association for Computational Linguistics: EMNLP 2020, pages 3592–3603, Online. Association for Computational Linguistics.
- Gupta et al. (2022) Prakhar Gupta, Chien-Sheng Wu, Wenhao Liu, and Caiming Xiong. 2022. DialFact: A benchmark for fact-checking in dialogue. In Proceedings of the 60th Annual Meeting of the Association for Computational Linguistics (Volume 1: Long Papers), pages 3785–3801, Dublin, Ireland. Association for Computational Linguistics.
- Honovich et al. (2022a) Or Honovich, Roee Aharoni, Jonathan Herzig, Hagai Taitelbaum, Doron Kukliansy, Vered Cohen, Thomas Scialom, Idan Szpektor, Avinatan Hassidim, and Yossi Matias. 2022a. TRUE: Re-evaluating factual consistency evaluation. In Proceedings of the Second DialDoc Workshop on Document-grounded Dialogue and Conversational Question Answering, pages 161–175, Dublin, Ireland. Association for Computational Linguistics.
- Honovich et al. (2022b) Or Honovich, Roee Aharoni, Jonathan Herzig, Hagai Taitelbaum, Doron Kukliansy, Vered Cohen, Thomas Scialom, Idan Szpektor, Avinatan Hassidim, and Yossi Matias. 2022b. TRUE: Re-evaluating factual consistency evaluation. In Proceedings of the 2022 Conference of the North American Chapter of the Association for Computational Linguistics: Human Language Technologies, pages 3905–3920, Seattle, United States. Association for Computational Linguistics.
- Honovich et al. (2021) Or Honovich, Leshem Choshen, Roee Aharoni, Ella Neeman, Idan Szpektor, and Omri Abend. 2021. : Evaluating factual consistency in knowledge-grounded dialogues via question generation and question answering. In Proceedings of the 2021 Conference on Empirical Methods in Natural Language Processing, pages 7856–7870, Online and Punta Cana, Dominican Republic. Association for Computational Linguistics.
- Huang et al. (2020) Dandan Huang, Leyang Cui, Sen Yang, Guangsheng Bao, Kun Wang, Jun Xie, and Yue Zhang. 2020. What have we achieved on text summarization? In Proceedings of the 2020 Conference on Empirical Methods in Natural Language Processing (EMNLP), pages 446–469, Online. Association for Computational Linguistics.
- Junczys-Dowmunt et al. (2018) Marcin Junczys-Dowmunt, Roman Grundkiewicz, Tomasz Dwojak, Hieu Hoang, Kenneth Heafield, Tom Neckermann, Frank Seide, Ulrich Germann, Alham Fikri Aji, Nikolay Bogoychev, André F. T. Martins, and Alexandra Birch. 2018. Marian: Fast neural machine translation in C++. In Proceedings of ACL 2018, System Demonstrations, pages 116–121, Melbourne, Australia. Association for Computational Linguistics.
- Koupaee and Wang (2018) Mahnaz Koupaee and William Yang Wang. 2018. Wikihow: A large scale text summarization dataset. CoRR, abs/1810.09305.
- Kryscinski et al. (2019) Wojciech Kryscinski, Nitish Shirish Keskar, Bryan McCann, Caiming Xiong, and Richard Socher. 2019. Neural text summarization: A critical evaluation. In Proceedings of the 2019 Conference on Empirical Methods in Natural Language Processing and the 9th International Joint Conference on Natural Language Processing (EMNLP-IJCNLP), pages 540–551, Hong Kong, China. Association for Computational Linguistics.
- Kryscinski et al. (2020) Wojciech Kryscinski, Bryan McCann, Caiming Xiong, and Richard Socher. 2020. Evaluating the factual consistency of abstractive text summarization. In Proceedings of the 2020 Conference on Empirical Methods in Natural Language Processing (EMNLP), pages 9332–9346, Online. Association for Computational Linguistics.
- Laban et al. (2022) Philippe Laban, Tobias Schnabel, Paul N. Bennett, and Marti A. Hearst. 2022. SummaC: Re-visiting NLI-based models for inconsistency detection in summarization. Transactions of the Association for Computational Linguistics, 10:163–177.
- Lai et al. (2017) Guokun Lai, Qizhe Xie, Hanxiao Liu, Yiming Yang, and Eduard Hovy. 2017. RACE: Large-scale ReAding comprehension dataset from examinations. In Proceedings of the 2017 Conference on Empirical Methods in Natural Language Processing, pages 785–794, Copenhagen, Denmark. Association for Computational Linguistics.
- Lin (2004) Chin-Yew Lin. 2004. ROUGE: A package for automatic evaluation of summaries. In Text Summarization Branches Out, pages 74–81, Barcelona, Spain. Association for Computational Linguistics.
- Liu et al. (2023) Yang Liu, Dan Iter, Yichong Xu, Shuohang Wang, Ruochen Xu, and Chenguang Zhu. 2023. G-eval: NLG evaluation using GPT-4 with better human alignment. CoRR, abs/2303.16634.
- Liu et al. (2019) Yinhan Liu, Myle Ott, Naman Goyal, Jingfei Du, Mandar Joshi, Danqi Chen, Omer Levy, Mike Lewis, Luke Zettlemoyer, and Veselin Stoyanov. 2019. Roberta: A robustly optimized BERT pretraining approach. CoRR, abs/1907.11692.
- Liu et al. (2022) Yu Lu Liu, Rachel Bawden, Thomas Scialom, Benoît Sagot, and Jackie Chi Kit Cheung. 2022. Maskeval: Weighted mlm-based evaluation for text summarization and simplification.
- Loshchilov and Hutter (2019) Ilya Loshchilov and Frank Hutter. 2019. Decoupled weight decay regularization. In International Conference on Learning Representations.
- Marelli et al. (2014) Marco Marelli, Stefano Menini, Marco Baroni, Luisa Bentivogli, Raffaella Bernardi, and Roberto Zamparelli. 2014. A SICK cure for the evaluation of compositional distributional semantic models. In Proceedings of the Ninth International Conference on Language Resources and Evaluation (LREC’14), pages 216–223, Reykjavik, Iceland. European Language Resources Association (ELRA).
- Maynez et al. (2020) Joshua Maynez, Shashi Narayan, Bernd Bohnet, and Ryan McDonald. 2020. On faithfulness and factuality in abstractive summarization. In Proceedings of the 58th Annual Meeting of the Association for Computational Linguistics, pages 1906–1919, Online. Association for Computational Linguistics.
- Merity et al. (2017) Stephen Merity, Caiming Xiong, James Bradbury, and Richard Socher. 2017. Pointer sentinel mixture models. In 5th International Conference on Learning Representations, ICLR 2017, Toulon, France, April 24-26, 2017, Conference Track Proceedings. OpenReview.net.
- Mishra et al. (2021) Anshuman Mishra, Dhruvesh Patel, Aparna Vijayakumar, Xiang Lorraine Li, Pavan Kapanipathi, and Kartik Talamadupula. 2021. Looking beyond sentence-level natural language inference for question answering and text summarization. In Proceedings of the 2021 Conference of the North American Chapter of the Association for Computational Linguistics: Human Language Technologies, pages 1322–1336, Online. Association for Computational Linguistics.
- Nguyen et al. (2016) Tri Nguyen, Mir Rosenberg, Xia Song, Jianfeng Gao, Saurabh Tiwary, Rangan Majumder, and Li Deng. 2016. MS MARCO: A human generated machine reading comprehension dataset. CoRR, abs/1611.09268.
- Nie et al. (2019a) Feng Nie, Jin-Ge Yao, Jinpeng Wang, Rong Pan, and Chin-Yew Lin. 2019a. A simple recipe towards reducing hallucination in neural surface realisation. In Proceedings of the 57th Annual Meeting of the Association for Computational Linguistics, pages 2673–2679, Florence, Italy. Association for Computational Linguistics.
- Nie et al. (2019b) Yixin Nie, Haonan Chen, and Mohit Bansal. 2019b. Combining fact extraction and verification with neural semantic matching networks. In The Thirty-Third AAAI Conference on Artificial Intelligence, AAAI 2019, The Thirty-First Innovative Applications of Artificial Intelligence Conference, IAAI 2019, The Ninth AAAI Symposium on Educational Advances in Artificial Intelligence, EAAI 2019, Honolulu, Hawaii, USA, January 27 - February 1, 2019, pages 6859–6866. AAAI Press.
- Nie et al. (2020) Yixin Nie, Adina Williams, Emily Dinan, Mohit Bansal, Jason Weston, and Douwe Kiela. 2020. Adversarial NLI: A new benchmark for natural language understanding. In Proceedings of the 58th Annual Meeting of the Association for Computational Linguistics, pages 4885–4901, Online. Association for Computational Linguistics.
- Pagnoni et al. (2021) Artidoro Pagnoni, Vidhisha Balachandran, and Yulia Tsvetkov. 2021. Understanding factuality in abstractive summarization with FRANK: A benchmark for factuality metrics. In Proceedings of the 2021 Conference of the North American Chapter of the Association for Computational Linguistics: Human Language Technologies, pages 4812–4829, Online. Association for Computational Linguistics.
- Papineni et al. (2002) Kishore Papineni, Salim Roukos, Todd Ward, and Wei-Jing Zhu. 2002. Bleu: a method for automatic evaluation of machine translation. In Proceedings of the 40th Annual Meeting of the Association for Computational Linguistics, pages 311–318, Philadelphia, Pennsylvania, USA. Association for Computational Linguistics.
- Popović (2015) Maja Popović. 2015. chrF: character n-gram F-score for automatic MT evaluation. In Proceedings of the Tenth Workshop on Statistical Machine Translation, pages 392–395, Lisbon, Portugal. Association for Computational Linguistics.
- Raffel et al. (2020) Colin Raffel, Noam Shazeer, Adam Roberts, Katherine Lee, Sharan Narang, Michael Matena, Yanqi Zhou, Wei Li, and Peter J. Liu. 2020. Exploring the limits of transfer learning with a unified text-to-text transformer. J. Mach. Learn. Res., 21:140:1–140:67.
- Rajpurkar et al. (2018) Pranav Rajpurkar, Robin Jia, and Percy Liang. 2018. Know what you don’t know: Unanswerable questions for SQuAD. In Proceedings of the 56th Annual Meeting of the Association for Computational Linguistics (Volume 2: Short Papers), pages 784–789, Melbourne, Australia. Association for Computational Linguistics.
- Sanh et al. (2019) Victor Sanh, Lysandre Debut, Julien Chaumond, and Thomas Wolf. 2019. Distilbert, a distilled version of BERT: smaller, faster, cheaper and lighter. CoRR, abs/1910.01108.
- Sanh et al. (2022) Victor Sanh, Albert Webson, Colin Raffel, Stephen Bach, Lintang Sutawika, Zaid Alyafeai, Antoine Chaffin, Arnaud Stiegler, Arun Raja, Manan Dey, M Saiful Bari, Canwen Xu, Urmish Thakker, Shanya Sharma Sharma, Eliza Szczechla, Taewoon Kim, Gunjan Chhablani, Nihal V. Nayak, Debajyoti Datta, Jonathan Chang, Mike Tian-Jian Jiang, Han Wang, Matteo Manica, Sheng Shen, Zheng Xin Yong, Harshit Pandey, Rachel Bawden, Thomas Wang, Trishala Neeraj, Jos Rozen, Abheesht Sharma, Andrea Santilli, Thibault Févry, Jason Alan Fries, Ryan Teehan, Teven Le Scao, Stella Biderman, Leo Gao, Thomas Wolf, and Alexander M. Rush. 2022. Multitask prompted training enables zero-shot task generalization. In The Tenth International Conference on Learning Representations, ICLR 2022, Virtual Event, April 25-29, 2022. OpenReview.net.
- Schuster et al. (2021) Tal Schuster, Adam Fisch, and Regina Barzilay. 2021. Get your vitamin C! robust fact verification with contrastive evidence. In Proceedings of the 2021 Conference of the North American Chapter of the Association for Computational Linguistics: Human Language Technologies, pages 624–643, Online. Association for Computational Linguistics.
- Scialom et al. (2021) Thomas Scialom, Paul-Alexis Dray, Sylvain Lamprier, Benjamin Piwowarski, Jacopo Staiano, Alex Wang, and Patrick Gallinari. 2021. QuestEval: Summarization asks for fact-based evaluation. In Proceedings of the 2021 Conference on Empirical Methods in Natural Language Processing, pages 6594–6604, Online and Punta Cana, Dominican Republic. Association for Computational Linguistics.
- See et al. (2017) Abigail See, Peter J. Liu, and Christopher D. Manning. 2017. Get to the point: Summarization with pointer-generator networks. In Proceedings of the 55th Annual Meeting of the Association for Computational Linguistics (Volume 1: Long Papers), pages 1073–1083, Vancouver, Canada. Association for Computational Linguistics.
- Sellam et al. (2020) Thibault Sellam, Dipanjan Das, and Ankur Parikh. 2020. BLEURT: Learning robust metrics for text generation. In Proceedings of the 58th Annual Meeting of the Association for Computational Linguistics, pages 7881–7892, Online. Association for Computational Linguistics.
- Song (2022) Mark Song. 2022. Marks/bart-base-qa2d · hugging face.
- Tan et al. (2020) Bowen Tan, Lianhui Qin, Eric Xing, and Zhiting Hu. 2020. Summarizing text on any aspects: A knowledge-informed weakly-supervised approach. In Proceedings of the 2020 Conference on Empirical Methods in Natural Language Processing (EMNLP), pages 6301–6309.
- Thorne et al. (2018) James Thorne, Andreas Vlachos, Christos Christodoulopoulos, and Arpit Mittal. 2018. FEVER: a large-scale dataset for fact extraction and VERification. In Proceedings of the 2018 Conference of the North American Chapter of the Association for Computational Linguistics: Human Language Technologies, Volume 1 (Long Papers), pages 809–819, New Orleans, Louisiana. Association for Computational Linguistics.
- Utama et al. (2022) Prasetya Utama, Joshua Bambrick, Nafise Moosavi, and Iryna Gurevych. 2022. Falsesum: Generating document-level NLI examples for recognizing factual inconsistency in summarization. In Proceedings of the 2022 Conference of the North American Chapter of the Association for Computational Linguistics: Human Language Technologies, pages 2763–2776, Seattle, United States. Association for Computational Linguistics.
- Vasilyev et al. (2020) Oleg Vasilyev, Vedant Dharnidharka, and John Bohannon. 2020. Fill in the BLANC: Human-free quality estimation of document summaries. In Proceedings of the First Workshop on Evaluation and Comparison of NLP Systems, pages 11–20, Online. Association for Computational Linguistics.
- Wang et al. (2020) Alex Wang, Kyunghyun Cho, and Mike Lewis. 2020. Asking and answering questions to evaluate the factual consistency of summaries. In Proceedings of the 58th Annual Meeting of the Association for Computational Linguistics, pages 5008–5020, Online. Association for Computational Linguistics.
- Wang et al. (2022) Peng Wang, An Yang, Rui Men, Junyang Lin, Shuai Bai, Zhikang Li, Jianxin Ma, Chang Zhou, Jingren Zhou, and Hongxia Yang. 2022. OFA: unifying architectures, tasks, and modalities through a simple sequence-to-sequence learning framework. In International Conference on Machine Learning, ICML 2022, 17-23 July 2022, Baltimore, Maryland, USA, volume 162 of Proceedings of Machine Learning Research, pages 23318–23340. PMLR.
- Williams et al. (2018a) Adina Williams, Nikita Nangia, and Samuel Bowman. 2018a. A broad-coverage challenge corpus for sentence understanding through inference. In Proceedings of the 2018 Conference of the North American Chapter of the Association for Computational Linguistics: Human Language Technologies, Volume 1 (Long Papers), pages 1112–1122. Association for Computational Linguistics.
- Williams et al. (2018b) Adina Williams, Nikita Nangia, and Samuel Bowman. 2018b. A broad-coverage challenge corpus for sentence understanding through inference. In Proceedings of the 2018 Conference of the North American Chapter of the Association for Computational Linguistics: Human Language Technologies, Volume 1 (Long Papers), pages 1112–1122, New Orleans, Louisiana. Association for Computational Linguistics.
- Xie et al. (2022) Tianbao Xie, Chen Henry Wu, Peng Shi, Ruiqi Zhong, Torsten Scholak, Michihiro Yasunaga, Chien-Sheng Wu, Ming Zhong, Pengcheng Yin, Sida I. Wang, Victor Zhong, Bailin Wang, Chengzu Li, Connor Boyle, Ansong Ni, Ziyu Yao, Dragomir Radev, Caiming Xiong, Lingpeng Kong, Rui Zhang, Noah A. Smith, Luke Zettlemoyer, and Tao Yu. 2022. UnifiedSKG: Unifying and multi-tasking structured knowledge grounding with text-to-text language models. In Proceedings of the 2022 Conference on Empirical Methods in Natural Language Processing, pages 602–631, Abu Dhabi, United Arab Emirates. Association for Computational Linguistics.
- Yin et al. (2021) Wenpeng Yin, Dragomir Radev, and Caiming Xiong. 2021. DocNLI: A large-scale dataset for document-level natural language inference. In Findings of the Association for Computational Linguistics: ACL-IJCNLP 2021, pages 4913–4922, Online. Association for Computational Linguistics.
- Yuan et al. (2021) Weizhe Yuan, Graham Neubig, and Pengfei Liu. 2021. Bartscore: Evaluating generated text as text generation. In Advances in Neural Information Processing Systems, volume 34, pages 27263–27277. Curran Associates, Inc.
- Zhang et al. (2021) Pengchuan Zhang, Xiujun Li, Xiaowei Hu, Jianwei Yang, Lei Zhang, Lijuan Wang, Yejin Choi, and Jianfeng Gao. 2021. Vinvl: Revisiting visual representations in vision-language models. In IEEE Conference on Computer Vision and Pattern Recognition, CVPR 2021, virtual, June 19-25, 2021, pages 5579–5588. Computer Vision Foundation / IEEE.
- Zhang et al. (2020) Tianyi Zhang, Varsha Kishore, Felix Wu, Kilian Q. Weinberger, and Yoav Artzi. 2020. Bertscore: Evaluating text generation with BERT. In 8th International Conference on Learning Representations, ICLR 2020, Addis Ababa, Ethiopia, April 26-30, 2020. OpenReview.net.
- Zhang et al. (2019) Yuan Zhang, Jason Baldridge, and Luheng He. 2019. PAWS: Paraphrase adversaries from word scrambling. In Proceedings of the 2019 Conference of the North American Chapter of the Association for Computational Linguistics: Human Language Technologies, Volume 1 (Long and Short Papers), pages 1298–1308, Minneapolis, Minnesota. Association for Computational Linguistics.
- Zhong et al. (2022) Ming Zhong, Yang Liu, Da Yin, Yuning Mao, Yizhu Jiao, Peng Liu, Chenguang Zhu, Heng Ji, and Jiawei Han. 2022. Towards a unified multi-dimensional evaluator for text generation. In Proceedings of the 2022 Conference on Empirical Methods in Natural Language Processing, page 2023–2038, Abu Dhabi, United Arab Emirates. Association for Computational Linguistics.
Appendix A Implementation Details
A.1 Unifying Language Understanding Tasks
We adapt datasets from 7 NLP tasks into the information alignment format. An overview of our unified training sets is shown in Table 1.
Tasks that cleanly fit into the form of the alignment problem, including NLI, fact verification, and paraphrase datasets are adapted by mapping the original labels into either binary or 3-way classification alignment labels. Next, we discuss how we adapt semantic textual similarity (STS), QA, and information retrieval (IR) tasks.
STS
STS datasets contain pairs of sentences labeled with semantic similarity scores. We use STS datasets in the regression task by normalizing the score to between 0 and 1.
QA
A QA sample consists of a context paragraph, a question, and a ground truth answer. One can derive the ground truth answer given the context and the question. To convert QA samples into a format suitable for binary classification, we use a pretrained sequence-to-sequence model to convert question-answer pairs into declarative sentences (Song, 2022; Demszky et al., 2018). Sentences generated from ground truth answers form aligned pairs with corresponding contexts, while sentences generated from wrong options form not-aligned samples. For samples with unanswerable questions, we first use a QA model777https://huggingface.co/valhalla/t5-base-qa-qg-hl to generate wrong answers, and then turn them into not-aligned samples using the above method.
See Section C.1 for converted samples.
IR
A sample in an information retrieval dataset consists of a query-answer pair and a list of passages, some of which can be used to answer the query. Similar to QA datasets, we adapt information retrieval datasets for binary classification by converting query-answer pairs into declarative sentences and then pairing them with passages. If a passage can be used to answer the corresponding query, we consider the sample to have aligned label. Otherwise it is assigned not-aligned.
A.2 Synthetic Data
We further augment our training set with synthetic data based on the WikiText-103 corpus (Merity et al., 2017) and the WikiHow summarization dataset (Koupaee and Wang, 2018).
To generate aligned samples, we create a paraphrase of each sentence in WikiText-103 through back translation using a neural machine translation model (Junczys-Dowmunt et al., 2018). For the WikiHow dataset, we use source documents as text , and the ground truth summaries together with extractive summaries generated by an extractive summarizer (Barrios et al., 2016) as text to form aligned samples.
Inspired by recent work in creating factually inconsistent samples (Deng et al., 2021; Kryscinski et al., 2020), we randomly mask 25% of the tokens in text from the aligned samples and infill with a masked language modeling model Sanh et al. (2019). The resulting sentences are semantically different from the originals and are used in not-aligned samples.
A.3 Training the Alignment Model
We use the Transformers888https://huggingface.co/docs/transformers/index library to implement the proposed model, and the PyTorch Lightning framework to train our model.
The alignment model is optimized with AdamW (Loshchilov and Hutter, 2019). The learning rate is first warmed up to a peak of 1e-5, and then linearly decayed. The hyperparameters used to train AlignScore-base and AlignScore-large are shown in Table 6.
We don’t split the context and claims into chunks in the training for simplicity.
| Hyperparameter | AlignScore-base | AlignScore-large |
| Base Model | RoBERTa-base | RoBERTa-large |
| Parameters | 125M | 355M |
| Batch Size | 32 | 32 |
| Epochs | 3 | 3 |
| Optimizer | AdamW | AdamW |
| Learning Rate | 1e-5 | 1e-5 |
| Weight Decay | 0.1 | 0.1 |
| Adam | 1e-6 | 1e-6 |
| Warmup Ratio | 0.06 | 0.06 |
| Random Seed | 2022 | 2022 |
| GPU | 23090 | 4A5000 |
| GPU Hour | 100h | 532h |
A.4 Cleaning Evaluation Datasets
Certain datasets we use for evaluation contain artifacts that could hurt model performance. Notable issues include claims having escape sequences (-LRB- and -RRB- instead of parentheses) and being uncased (all lower case) while contexts do not have escape sequences and are cased.
We use rule-based methods to remove these artifacts. Specifically, we replace escape sequences in claims with the original characters, capitalize the first letter of the first word in a sentence, and for words that appear in contexts, we fix their capitalization in the corresponding claims according to their occurrences in the contexts.
A.5 Computing Correlations
We first split the inputs to sentences with NLTK sentenizer. Then AlignScore computes the instance-level factual consistency score as stated in Section 3.2. We use scipy to compute Pearson correlation, Spearman correlation and Kendall’s tau correlation.
| Dataset | Abbreviation |
| SummEval | SE |
| PAWS | PAWS |
| Q2 | Q2 |
| VitaminC | VitC |
| FEVER | FVR |
| FRANK | FRK |
| DialFact | DF |
| MNBM | MNBM |
| QAGS-CNNDM | Q-C |
| QAGS-XSum | Q-X |
| BEGIN | BEGIN |
Appendix B Additional Experiment Details/Results
B.1 SummaC Benchmark
SummaC benchmark consists of 6 summarization datasets: CogenSum (Falke et al., 2019), XSumFaith (Maynez et al., 2020), Polytope (Huang et al., 2020), FactCC (Kryscinski et al., 2020), SummEval (Fabbri et al., 2021) and FRANK (Pagnoni et al., 2021). The datasets are standardized by binarizing each labels. Metrics are evaluated as classifiers on SummaC benchmark.
The SummaC Benchmark considers samples in PolyTope with Addition999Defined as: Unnecessary and irrelevant snippets from the source are included in the summary, Omission101010Defined as: Key point is missing from the output, Inaccuracy Intrinsic111111Defined as: Terms or concepts from the source are misrepresented and thus unfaithful., Inaccuracy Extrinsic121212Defined as: The summary has content not presented in the source and factually incorrect and Positive-Negative Aspect131313Defined as: The output summary represents positive statements whereas the source segment is negative, and vice versa. errors to be negative samples. However, Addition and Omission do not imply factual consistency errors. Thus, we only consider samples with Inaccuracy Intrinsic, Inaccuracy Extrinsic and Positive-Negative Aspect errors to be factually incorrect. The reported PolyTope result uses this definition of errors.
We also report balanced accuracy, which deals with imbalanced datasets, in Table 9.
| Type | Metric | CGS | XSF | PolyTope | FactCC | SummEval | FRANK | AVG |
| FEQA | 51.9 | 49.5 | 53.7 | 46.6 | 51.4 | 41.4 | 49.1 | |
| QuestEval | 53.1 | 57.6 | 69.3 | 66.8 | 69.8 | 77.7 | 65.7 | |
| QA | QAFactEval | 50.6 | 61.2 | 60.2 | 73.8 | 54.9 | 74.9 | 62.6 |
| ROUGE-1 | 61.1 | 62.4 | 74.4 | 68.0 | 80.0 | 79.1 | 70.8 | |
| ROUGE-2 | 61.2 | 62.2 | 75.1 | 67.8 | 78.8 | 78.8 | 70.7 | |
| ROUGE-L | 61.5 | 57.4 | 74.0 | 67.7 | 79.7 | 78.8 | 69.8 | |
| BLEU | 64.2 | 55.2 | 78.3 | 67.0 | 77.6 | 79.3 | 70.3 | |
| BERTScore | 52.7 | 49.0 | 76.9 | 65.3 | 72.7 | 78.5 | 65.8 | |
| NER-Overlap | 51.1 | 64.9 | 72.1 | 49.8 | 56.6 | 68.1 | 60.4 | |
| Similarity Matching | SimCSE | 54.4 | 57.3 | 68.9 | 57.3 | 71.3 | 68.5 | 62.9 |
| Regression | BLEURT | 57.7 | 58.7 | 69.0 | 56.2 | 63.7 | 74.9 | 63.4 |
| MNLI | 46.0 | 48.7 | 46.3 | 52.2 | 50.7 | 55.2 | 49.8 | |
| DAE | 52.4 | 76.7 | 72.8 | 54.2 | 66.1 | 78.9 | 66.8 | |
| SummaC-ZS | 62.6 | 57.8 | 81.0 | 82.8 | 77.8 | 78.1 | 73.4 | |
| NLI | SummaC-CONV | 59.8 | 66.4 | 73.7 | 89.2 | 79.8 | 81.0 | 75.0 |
| UniEval | 77.1 | 61.2 | 85.3 | 84.7 | 79.4 | 80.9 | 78.1 | |
| CTC | 69.1 | 61.7 | 82.1 | 77.6 | 78.4 | 80.5 | 74.9 | |
| BARTScore | 56.9 | 58.7 | 84.6 | 73.3 | 79.6 | 78.3 | 71.9 | |
| FactCC | 64.9 | 55.1 | 78.5 | 72.7 | 71.8 | 69.8 | 68.8 | |
| Misc | BLANC | 49.8 | 52.0 | 66.3 | 55.7 | 58.3 | 78.4 | 60.1 |
| AlignScore-base | 77.8 | 72.2 | 78.9 | 87.4 | 83.7 | 83.6 | 80.6 | |
| Ours | AlignScore-large | 75.0 | 70.0 | 88.0 | 89.2 | 83.4 | 86.3 | 82.0 |
B.2 TRUE Benchmark
TRUE benchmark is for evaluating factual consistency metrics in summarization, dialogue, fact-verification and paraphrasing tasks. There are totally 11 datasets in this benchmark: FRANK (Pagnoni et al., 2021), SummEval (Fabbri et al., 2021), MNBM (Maynez et al., 2020), QAGS-CNNDM (Wang et al., 2020), QAGS-XSum (Wang et al., 2020), BEGIN (Dziri et al., 2022), Q (Honovich et al., 2021), DialFact (Gupta et al., 2022), PAWS (Zhang et al., 2019), FEVER (Nie et al., 2019b; Thorne et al., 2018) and VitaminC (Schuster et al., 2021). TRUE also treats factual consistency evaluation as a binary classification task and reports AUC-ROC.
B.3 Other Datasets
| Type | Metric | XSF | SE | Q-X | Q-C | FRK-X | FRK-C | SSum | AVG |
| FEQA | 1.7 | 0.2 | -6.5 | -7.2 | 1.5 | -2.9 | 0.0 | -1.9 | |
| QuestEval | 42.1 | 26.3 | 11.9 | 30.8 | 19.1 | 40.5 | 3.9 | 25.0 | |
| QA | QAFactEval | 31.9 | 42.8 | 44.1 | 63.1 | 25.5 | 53.7 | 35.9 | 42.4 |
| ROUGE-1 | 34.2 | 38.1 | 18.1 | 53.6 | 5.6 | 35.2 | 15.1 | 28.6 | |
| ROUGE-2 | 26.8 | 37.8 | 17.7 | 55.2 | 2.8 | 37.2 | 17.5 | 27.9 | |
| ROUGE-L | 28.9 | 38.5 | 16.5 | 53.7 | 8.2 | 35.8 | 16.3 | 28.3 | |
| BLEU | 18.2 | 34.7 | 10.1 | 55.4 | 6.3 | 34.0 | 13.7 | 24.6 | |
| BERTScore | 13.4 | 31.5 | -8.9 | 46.2 | 12.7 | 45.1 | 13.1 | 21.9 | |
| NER-Overlap | 23.9 | 21.4 | 31.2 | 0.2 | 11.3 | 27.8 | 16.7 | 18.9 | |
| Similarity Matching | SimCSE | 29.2 | 26.4 | 11.2 | 47.2 | 13.3 | 31.3 | 7.9 | 23.8 |
| Regression | BLEURT | 37.0 | 23.6 | 12.4 | 43.4 | 13.9 | 37.6 | 6.7 | 24.9 |
| MNLI | 7.0 | -6.6 | 0.7 | -16.4 | 11.7 | -5.5 | 31.1 | 3.1 | |
| DAE | 47.0 | 36.2 | 37.5 | 37.1 | 32.1 | 36.9 | 18.6 | 35.1 | |
| SummaC-ZS | 5.7 | 38.3 | 43.7 | 51.1 | 12.8 | 46.2 | 15.1 | 30.4 | |
| NLI | SummaC-CONV | 21.7 | 41.4 | 45.0 | 58.4 | 11.0 | 52.4 | 9.8 | 34.2 |
| UniEval | 25.3 | 44.3 | 50.0 | 67.6 | 26.7 | 54.0 | 22.8 | 41.5 | |
| CTC | 29.8 | 41.7 | 30.6 | 57.3 | 20.4 | 49.4 | 17.7 | 35.3 | |
| BARTScore | 29.8 | 39.1 | 17.0 | 68.1 | 20.0 | 53.3 | 16.3 | 34.8 | |
| FactCC | 6.8 | 33.5 | 28.8 | 40.3 | 7.9 | 35.3 | -4.4 | 21.2 | |
| Misc | BLANC | 8.4 | 19.0 | 1.6 | 22.2 | 6.5 | 34.2 | 9.1 | 14.4 |
| AlignScore-base | 43.8 | 43.4 | 51.9 | 69.0 | 28.0 | 54.7 | 23.4 | 44.9 | |
| Ours | AlignScore-large | 33.3 | 46.6 | 57.2 | 73.9 | 29.0 | 60.9 | 43.8 | 49.3 |
| Type | Metric | XSF | SE | Q-X | Q-C | FRK-X | FRK-C | SSum | AVG |
| FEQA | 1.1 | 0.2 | -5.3 | -5.7 | 1.3 | -2.2 | 0.0 | -1.5 | |
| QuestEval | 28.7 | 20.8 | 9.7 | 23.9 | 15.6 | 31.1 | 3.2 | 19.0 | |
| QA | QAFactEval | 23.2 | 34.0 | 36.2 | 50.5 | 22.4 | 42.2 | 30.1 | 34.1 |
| ROUGE-1 | 23.4 | 30.3 | 14.8 | 42.9 | 4.6 | 26.8 | 12.4 | 22.2 | |
| ROUGE-2 | 18.4 | 30.0 | 14.5 | 44.2 | 2.3 | 28.4 | 14.5 | 21.8 | |
| ROUGE-L | 19.6 | 30.6 | 13.6 | 42.8 | 6.7 | 27.3 | 13.3 | 22.0 | |
| BLEU | 14.6 | 27.5 | 9.0 | 44.7 | 6.1 | 25.9 | 12.2 | 20.0 | |
| BERTScore | 9.2 | 24.9 | -7.3 | 36.3 | 10.4 | 34.7 | 10.7 | 17.0 | |
| NER-Overlap | 19.6 | 20.6 | 31.2 | 0.2 | 11.3 | 25.7 | 16.7 | 17.9 | |
| Similarity Matching | SimCSE | 19.9 | 20.9 | 9.1 | 36.7 | 10.8 | 23.8 | 6.4 | 18.2 |
| Regression | BLEURT | 25.3 | 18.6 | 10.1 | 33.9 | 11.4 | 28.8 | 5.5 | 19.1 |
| MNLI | 4.7 | -5.2 | 0.5 | -12.8 | 9.5 | -4.2 | 25.4 | 2.6 | |
| DAE | 38.6 | 34.8 | 37.5 | 34.7 | 32.1 | 34.1 | 18.6 | 32.9 | |
| SummaC-ZS | 3.9 | 30.4 | 35.8 | 40.5 | 10.5 | 35.8 | 12.3 | 24.2 | |
| NLI | SummaC-CONV | 15.0 | 33.1 | 36.8 | 46.5 | 9.0 | 41.3 | 8.0 | 27.1 |
| UniEval | 17.0 | 35.3 | 40.9 | 54.4 | 21.8 | 42.4 | 18.7 | 32.9 | |
| CTC | 20.2 | 33.2 | 25.1 | 45.7 | 16.6 | 38.2 | 14.4 | 27.6 | |
| BARTScore | 20.2 | 31.0 | 13.9 | 55.6 | 16.3 | 41.4 | 13.3 | 27.4 | |
| FactCC | 5.6 | 32.2 | 28.8 | 37.7 | 7.9 | 32.6 | -4.4 | 20.0 | |
| Misc | BLANC | 5.6 | 14.9 | 1.3 | 17.1 | 5.3 | 26.0 | 7.5 | 11.1 |
| AlignScore-base | 30.1 | 34.7 | 42.5 | 55.4 | 22.9 | 42.9 | 19.1 | 35.4 | |
| Ours | AlignScore-large | 22.7 | 37.4 | 46.8 | 61.3 | 23.7 | 48.5 | 35.8 | 39.5 |
In addition to the Pearson correlation reported in Table 4, we also report the Spearman correlation and Kendall’s tau correlation on 9 datasets in Table 10 and 11, respectively. The full names of the abbreviations in Table 4, Table 10 and Table 11 are listed in Table 8.
B.3.1 Why BLEU Metric Performs Relatively Well?
We notice that the BLEU metric has comparable performance with some neural model based methods, which seems to contradict some previous findings. We attribute it to the case matching in the pre-processing, since BLEU is case sensitive.
Appendix C Sample Training Data
C.1 Converted QA Samples
We show converted SQuAD v2 (Rajpurkar et al., 2018) samples below to illustrate the process of converting QA samples into the alignment format (discussed in Section A.1). Concretely, questions and answers are combined into declarative claims using a sequence-to-sequence model (Song, 2022; Demszky et al., 2018).
- Context:
-
The Times Literary Supplement (TLS) first appeared in 1902 as a supplement to The Times, becoming a separately paid-for weekly literature and society magazine in 1914. The Times and the TLS have continued to be co-owned, and as of 2012 the TLS is also published by News International and cooperates closely with The Times, with its online version hosted on The Times website, and its editorial offices based in Times House, Pennington Street, London.
- Question:
-
The editorial offices of The Times Literary Supplement is based in what location in London?
- Answer:
-
Times House, Pennington Street
- Generated claim:
-
The editorial offices of The Times Literary Supplement is based in Times House, Pennington Street in London.
- Label:
-
aligned
- Context:
-
The 25,000 cotton growers in the United States of America are heavily subsidized at the rate of $2 billion per year although China now provides the highest overall level of cotton sector support. The future of these subsidies is uncertain and has led to anticipatory expansion of cotton brokers’ operations in Africa. Dunavant expanded in Africa by buying out local operations. This is only possible in former British colonies and Mozambique; former French colonies continue to maintain tight monopolies, inherited from their former colonialist masters, on cotton purchases at low fixed prices.
- Question:
-
How many subsidized cotton growers are in the US?
- Answer:
-
25,000
- Generated claim:
-
25,000 subsidized cotton growers are in the US.
- Label:
-
aligned
- Context:
-
On October 28, 2015, IBM announced its acquisition of digital assets from The Weather Company—a holding company of Bain Capital, The Blackstone Group and NBCUniversal which owns The Weather Channel, including its weather data platforms (such as Weather Services International), websites (Weather.com and Weather Underground) and mobile apps. The acquisition seeks to use Watson for weather analytics and predictions. The acquisition does not include The Weather Channel itself, which will enter into a long-term licensing agreement with IBM for use of its data. The sale closed on January 29, 2016
- Question:
-
When did the sale of Weather Company assets close?
- Answer:
-
January 29, 2016
- Generated claim:
-
The sale of Weather Company assets closed on January 29, 2016.
- Label:
-
aligned
- Context:
-
The dipole component of the magnetic field at the magnetic equator of Neptune is about 14 microteslas (0.14 G). The dipole magnetic moment of Neptune is about 2.2 × 10¹⁷ T·m3 (14 T·RN3, where RN is the radius of Neptune). Neptune’s magnetic field has a complex geometry that includes relatively large contributions from non-dipolar components, including a strong quadrupole moment that may exceed the dipole moment in strength. By contrast, Earth, Jupiter and Saturn have only relatively small quadrupole moments, and their fields are less tilted from the polar axis. The large quadrupole moment of Neptune may be the result of offset from the planet’s centre and geometrical constraints of the field’s dynamo generator.
- Question:
-
What is the dipole component of the magnetic field at the magnetic equator of neptune?
- Answer:
-
14 microteslas (0.14 G)
- Generated claim:
-
The dipole component of the magnetic field at the magnetic equator of neptune is 14 microteslas (0.14 G).
- Label:
-
aligned
- Context:
-
Qing dynasty rule in Tibet began with their 1720 expedition to the country when they expelled the invading Dzungars. Amdo came under Qing control in 1724, and eastern Kham was incorporated into neighbouring Chinese provinces in 1728. Meanwhile, the Qing government sent resident commissioners called Ambans to Lhasa. In 1750 the Ambans and the majority of the Han Chinese and Manchus living in Lhasa were killed in a riot, and Qing troops arrived quickly and suppressed the rebels in the next year. Like the preceding Yuan dynasty, the Manchus of the Qing dynasty exerted military and administrative control of the region, while granting it a degree of political autonomy. The Qing commander publicly executed a number of supporters of the rebels and, as in 1723 and 1728, made changes in the political structure and drew up a formal organization plan. The Qing now restored the Dalai Lama as ruler, leading the governing council called Kashag, but elevated the role of Ambans to include more direct involvement in Tibetan internal affairs. At the same time the Qing took steps to counterbalance the power of the aristocracy by adding officials recruited from the clergy to key posts.
- Question:
-
What did the Qing commander do in 1732 and 1728?
- Answer:
-
Unanswerable
- Generated claim:
-
The Qing commander publicly executed a number of supporters of the rebels in 1732 and 1728.
- Label:
-
not-aligned