S4M: Generating Radiology Reports by A Single Model for Multiple Body Parts
Abstract
Generating radiology reports automatically can enhance clinical practice in diagnostic radiology by reducing the burden of report writing for radiologists. However, current radiology report generation models follow a dataset- or region-specific training and testing paradigm, e.g., a model trained on chest reports cannot be deployed on the knee. Thus, multiple trained models need to be ready for radiologists to use since a single radiologist needs to read images from different body parts. In this paper, we seek to design a report generation model that is able to generate reasonable reports even given different images of various body parts. We start by directly merging multiple datasets and training a single report generation model on this one. We, however, observe that the reports generated in such a simple way only obtain comparable performance compared with that trained separately on each specific dataset. We suspect that this is caused by the dilemma between the diversity of body parts and the limited availability of medical data. To develop robust and generalizable models, it is important to consider a diverse range of body parts and medical conditions. However, collecting a sufficiently large dataset for each specific body part can be difficult due to various factors, such as data availability and privacy concerns. Thus, rather than striving for more data, we propose a single-for-multiple (S4M) framework, which seeks to facilitate the learning of the report generation model with two auxiliary priors: an explicit prior (i.e., feeding radiology-informed knowledge) and an implicit prior (i.e., guided by cross-modal features). Specifically, based on the conventional encoder-decoder report generation framework, we incorporate two extra branches: a Radiology-informed Knowledge Aggregation (RadKA) branch and an Implicit Prior Guidance (IPG) branch. We conduct the experiments on our merged dataset which consists of a public dataset (i.e., IU-Xray) and five private datasets, covering six body parts: chest, abdomen, knee, hip, wrist and shoulder. Our S4M model outperforms all the baselines, regardless of whether they are trained on separate or merged datasets. Code is available at: https://github.com/YtongXie/S4M.
1 Introduction
The tasks of interpreting radiology images and producing diagnostic reports are both arduous and prone to errors. To reduce this burden, automatic report generation systems can provide candidate reports in natural language for the radiologist to verify. Besides, these systems can leverage data-hungry machine learning paradigms by learning directly from free-text reports, which is a significant advantage compared to other medical image analysis applications (e.g., medical image segmentation Isensee et al. (2021); Lee et al. (2023); Zhang et al. (2021)) that often rely on large amounts of quality annotations. In general, radiologists commonly write reports based on radiology images covering different body parts, including the chest, abdomen, shoulder, elbow, wrist, hip, knee, ankle, and more. However, the existing report generation models Li et al. (2023); Liu et al. (2021, 2021); Ma et al. (2021); Wang et al. (2023); Zhang et al. (2020) are designed by following the typical single-dataset training-and-testing paradigm, which inevitably suffers from severe performance drop issues, when these generation models are directly deployed to another dataset w.r.t. various body regions.
In this paper, we seek to take a promising start in designing a single model for radiology report generation across multiple body parts. Unlike the existing works focusing on developing a framework verified within a single dataset, we aim to propose a versatile way to enable the report generation model to have the ability to learn from many diversified datasets regarding different body parts. To this end, we start by directly merging multiple datasets and training a single report generation model on the merged dataset, while observing that the performance of reports produced in such a simple way is only comparable with that trained separately on each specific dataset. We suspect the challenge lies in that increasing the diversity of the merged training data makes it harder to optimize the model, particularly if the model is complex and has a relatively large number of parameters, e.g., a Transformer-based model Vaswani et al. (2017). This is because a more diverse dataset can make the optimization problem more challenging, as the model needs to learn to generalize across a wider range of inputs and outputs. Thus, in general, even though increasing the diversity of the training data can improve the robustness and generalization of the model and ultimately lead to better performance, optimizing a model on a more diverse data space would require much more training data.
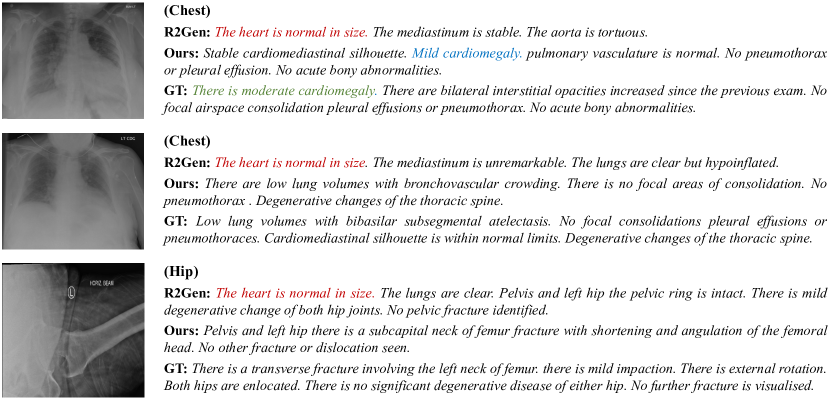
However, even with a merged dataset, the training data in radiology is still limited compared with that in natural images (e.g., million image-text pairs are used in CLIP Radford et al. (2021) while million images in BLIP Li et al. (2022) and BLIP-2 Li et al. (2023)). It makes models easily overfit and then results in poor generalization to new or unseen data. As shown in Figure 1, the existing model (e.g., R2Gen) often generates the same sentence in the report even given different radiology images. Notably, not all the generated reports are semantically-consistent with the images as the model tends to remember an “average” version that encompasses the frequently occurring words and phrases present in the training corpus Chen et al. (2022). Such a phenomenon is not limited to the images within the same body part but is also observed in the data of different body parts (i.e., chest vs. hip in Figure 1). Thus, this is particularly a concern with the models that have a high capacity to memorize the training data.
To address the above issue, we propose a single-for-multiple (S4M) framework for multi-part radiology report generation. In this framework, we use an explicit prior and an implicit prior to improve the understanding and reasoning capabilities of the model on limited but diverse data. Specifically, based on the widely used encoder-decoder backbone, our S4M introduces two additional branches, i.e., a Radiology-informed Knowledge Aggregation (RadKA) branch and an Implicit Prior Guidance (IPG) branch. The RadKA branch incorporates pre-defined radiology-informed knowledge into the generation backbone, which provides a way to include domain-specific knowledge into the model to guide its behaviour. To further strengthen the region-aware knowledge during generation, the RadKA branch filters out the region-irrelevant knowledge using an indicator before aggregating the knowledge and image features. To do so, the model can prioritize the acquisition and utilization of specific body region knowledge during the report generation process, and thus enhance the accuracy and relevance of the generated reports. Unlike RadKA, which uses explicit guidance, the IPG branch aims to enhance the recognition capability of the image encoder by employing a trainable implicit prior obtained from the ground-truth reports. This can significantly improve the image encoder’s understanding of semantic meaning by enabling it to learn from another modality (i.e., report), following the idea that one modality can provide diagnostic support but need confirmation from another modality Willemink et al. (2020). We conduct the experiments on a merged dataset that consists of a public dataset (i.e., IU-Xray) and five private datasets, covering the chest, abdomen, knee, hip, wrist and shoulder. The results show the superiority of our S4M model when generating radiology reports for multiple body parts compared with both specialized and generalist models.
2 Related Works
Radiology report generation
Radiology report generation specifically targets medical imaging data, aiming to generate comprehensive and accurate reports that capture the findings, interpretations, and diagnoses related to the medical images. Previous works Jing et al. (2018); Wang et al. (2021); Xue et al. (2018); Yuan et al. (2019) seek to employ a hierarchical LSTM for the long paragraph generation in medical reports. To enhance performance even further, several studies Chen et al. (2022, 2020); Li et al. (2022); Wang et al. (2022, 2023) adopt a transformer as the report decoder instead of LSTM, leading to notable improvements in results. Moreover, in order to capture the radiology terminologies and their semantic relationships, recent works Li et al. (2023); Liu et al. (2021, 2021); Zhang et al. (2020) have explored the incorporation of knowledge graphs as inputs or optimization constraints (e.g., classification labels) in the generation process. However, the current report generation models are designed based on a single-dataset training-and-testing paradigm, while radiologists often write reports according to radiology images w.r.t. various body parts, including chest, abdomen, shoulders, etc. When these models are applied directly to another dataset that contains different body parts, they often encounter significant performance degradation issues.
Image captioning
Natural image captioning Anderson et al. (2018); Huang et al. (2019); Vinyals et al. (2015); Xu et al. (2015) seeks to automatically generate concise and descriptive captions for a given image, which has garnered significant interest from researchers LeCun et al. (2015). Many methods Cornia et al. (2020); Lu et al. (2017); Pan et al. (2020); Rennie et al. (2017) have been proposed, leading to significant advancements in the state-of-the-art. The typical image captioning models Karpathy and Fei-Fei (2015); Vinyals et al. (2015) mainly contain two components: a CNN-based image encoder and an RNN-based decoder for generating captions. Several studies Huang et al. (2019); Zhou et al. (2020) have incorporated the attention mechanism Vaswani et al. (2017) into the diagram, encouraging the models to pay greater attention to the highlighted regions. However, radiology report generation requires specialized knowledge of medical imaging and terminology, while natural image captioning is more general in nature.
3 Preliminaries
Radiology report generation
In this part, we introduce a formal definition of radiology report generation. Let denote a training radiology image while denote the ground-truth report for . During the training, our goal is to discover the optimal model from a set of potential models , such that it minimizes the average prediction loss. This loss can be determined by a specified loss function . Mathematically, the function can be defined as
| (1) |
where is the number of training data. Typically, sequence generation models are trained using the autoregressive Teacher Forcing scheme, with the objective of maximizing the probability of the ground-truth token given all previous ground-truth tokens . Formally, the corresponding loss function would be formulated as
| (2) |
Here, refers to the -th token in the sequence , and is the total number of word tokens in . Note that in inference, instead of relying on previous ground-truth tokens, we generate predictions for the next token based on the tokens that have been previously predicted in an autoregressive manner.
Building general radiology-informed knowledge set
We seek to construct a general knowledge set that covers the most common abnormalities or findings in the radiology reports. For convenience, we call each item in this knowledge set a topic like Liu et al. (2021); Zhang et al. (2020). While they develop a knowledge graph, the relations (edges) between topics (nodes) cannot be updated during training, which limits its effectiveness for exploiting implicit relationships. Furthermore, this knowledge graph focuses on chest X-rays only, which restricts its applicability to other body parts and broader use cases. Thus, we have reorganized the topics in our knowledge set such that they cover the medical terminologies relevant to a broad range of body parts without pre-defined and fixed relations.
To better build a generic knowledge base, following Willemink et al. (2020), we adopt one of the most useful natural language processing methods, called topic modelling, on the database, that seeks to characterize the knowledge for each body part with a series of topics namely . Specifically, we first use spacy Neumann et al. (2019), currently the most popular entity detection tool, to extract the medical entities and obtain the most frequent words for each body part. Then most critical words are further filtered by radiologists to create the existing knowledge base. Mathematically, the general set can be defined as . Due to the page limit, we put the detailed knowledge base in supplementary A.
4 Method
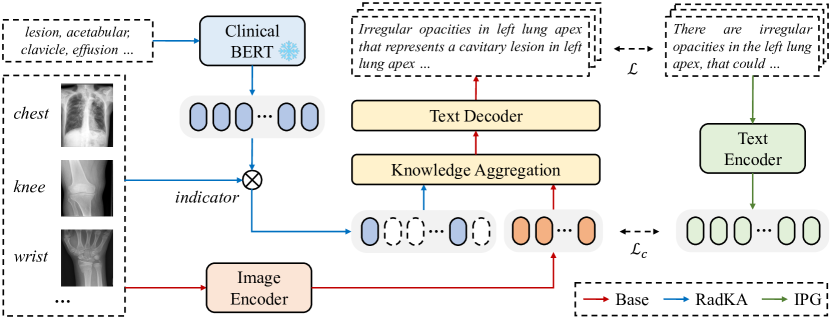
The overview of our single-for-multiple (S4M) framework is shown in Figure 2, which contains a basic encoder-decoder report generation model (Base), a Radiology-informed Knowledge Aggregation (RadKA) branch, and an Implicit Prior Guidance (IPG). The RadKA branch enhances the base model by incorporating radiology-specific knowledge. While the IPG branch improves the recognition capability of the image encoder by aligning multimodal semantics, which would be removed in inference. More details are in the following.
4.1 Radiology-informed Knowledge Aggregation
Body region-aware knowledge selection
Understanding the context and clinical nuances in radiology reports requires deep medical knowledge and expertise. Models may lack the comprehensive understanding needed to generate reports that incorporate relevant clinical information, leading to inaccuracies or missing crucial details. To address this limitation, we introduce a condition signal to selectively activate a set of topics based on the anatomical regions associated with the input image. By doing so, our model is able to filter out topics that are irrelevant to the specific region before conducting reasoning between the given image and the general knowledge set . Specifically, we devise an indication function , which enables the selection of the topics in . Formally,
| (3) |
where is the pre-trained knowledge feature extractor (i.e., Clinical BERT Alsentzer et al. (2019)) while is the subset of the general knowledge (i.e., ), denoting the resulting selected topics. Here, is a tag of the body part a given image belongs to (e.g., “chest X-ray”), which is pre-defined or manually specified in advance. In our work, we define six different tags, including chest X-ray, abdomen X-ray, knee X-ray, hip X-ray, wrist X-ray, and shoulder X-ray.
Intra-region knowledge aggregation
For knowledge aggregation, our idea is to design a learnable aggregation function with a capacity for cross-modal reasoning, allowing it to determine the most relevant topics between the knowledge set and the input image . A straightforward way is adopting scaled dot product attention, which enables the topics and images to interact with one another. Concretely, we design a knowledge-image co-attention module, consisting of a lightweight multi-head attention (MHA) layer before a layer normalization (LN) layer, which can be defined as
| (4) |
where refers to the image encoder and denotes the operation of concatenation.
4.2 Implicit Prior Guidance
To enhance the recognition ability of the image encoder, we propose to guide the generation model to focus more on the image features that are considered important/contributive. To this end, we present a feature attribution method to assess the contribution of each image token for the generation task. Then, we define an attribution prior as a function , where is the number of features of image tokens111For simplicity, we omit the feature dimension .. With an input , based on the given method , assigns penalties to the feature attributions for image encoder (). Mathematically, the objective function can be defined as
| (5) |
where is a hyper-parameter for the trade-off between these two terms.
Let us assume that the feature of each patch token in is linked to a meta-feature represented by a scalar value. To represent these scalar-valued meta-features, we can use a vector , where the -th entry of corresponds to the significance/contribution for -th tokens in image . Assuming a hypothetical scenario where we have prior knowledge for the values in , a reasonable option for would be to impose a penalty on the discrepancy between predicted results from our model and the corresponding values in . Formally, we can rewrite Eq. (5) to
| (6) |
Here, refers to the norm. However, in most scenarios, it is unrealistic to have an that is known in advance. Instead, we can take advantage of the function approximation capabilities of neural networks and replace with deep one from a set of models . We define such a model to be an Implicit Prior Guidance (IPG) branch as shown in Figure 2. Thus, we jointly learn the generation model and IPG pair by optimizing the following objective:
| (7) |
where is a pooling operation for image tokens, and we define to be the vector in resulting from feeding ground-truth report into . We are able to approximate a solution to this problem by a contrastive loss . We find empirically that, so long as and are convergent, this procedure accomplishes the following two goals: learning the semantic alignment between provided image and report ; guiding the generation model to rely more heavily on the image features deemed important by these learned implicit priors.
5 Experiments
5.1 Datasets
In experiments, we use a merged dataset that contains paired data w.r.t. different body parts, including a widely used IU-Xray Demner-Fushman et al. (2016) (chest) and five private datasets for abdomen, knee, hip, wrist and shoulder.
IU-Xray
IU-Xray Demner-Fushman et al. (2016) is a widely used publicly accessible dataset in the radiology report generation. It consists of fully de-identified radiology reports, each paired with frontal and/or lateral chest X-ray images. Following Chen et al. (2020); Li et al. (2023), we remove cases that contain only a single image and then divide the entire dataset into train, validation, and test sets with a number of 2069/296/590, respectively.
Private datasets
We collected private data on five additional body parts separately, each comprising paired radiology images and corresponding reports. Anonymous Human Research Ethics Committee provided ethics approval for private data used in this study. Unlike IU-Xray Demner-Fushman et al. (2016), where one report strictly corresponds to two view images, we introduce private data, with each report pair corresponding to 1-8 images of different views. To be consistent with IU-Xray, we filter out the data with only a single radiology image while selecting two images (frontal and partial X-ray images) by radiologists if more than two. After removing the extremely long or short reports and keeping each report from to tokens, we finally select patients for each body part and the ratio of train/val/test is 70%/15%/15%. We put more details in supplementary B.
5.2 Metrics and Implementation Details
Evaluation metrics
To assess the quality of the generated reports, we employ widely used evaluation metrics for image captioning, i.e., BLEU Papineni et al. (2002) and CIDEr Vedantam et al. (2015). We additionally employ the CLIP-based metric called CLIPScore Hessel et al. (2021), which can assess whether the generated reports are semantically aligned with given images, even when they are diverse significantly from the reference reports. To substantiate the enhanced capacity for semantic understanding offered by the image encoder, we undertake the linear classification probing evaluation using the CheXpert Irvin et al. (2019) dataset, which contains five individual binary labels: atelectasis, cardiomegaly, consolidation, edema, and pleural effusion. For this process, we fix the image encoder, which has been trained on our S4M model, and exclusively train a randomly initialized linear classification head.
Implementation details
We adopt ResNet101 He et al. (2016), pre-trained on ImageNet Deng et al. (2009), serving as image encoder. Considering the domain disparity between medical and generic texts, we use the tokenizer and text encoder from MedClip Wang et al. (2022) for the purpose of embedding the report. The knowledge aggregation network consists of a three-layer Transformer. We configure the dimensions of input patches to and incorporate online data augmentation techniques, such as random cropping and flipping, to expand the X-ray training dataset. We limit the maximum epochs to 100 and use the Adam optimizer Kingma and Ba (2014) with a weight decay parameter of 1e-4. The learning rates are set at 5e-5 and 1e-4 for the image and text encoders, and the remaining trainable parameters, respectively. Besides, based on the findings from our ablation study, we empirically set the hyper-parameter to 1.0. Our experiments are conducted using a single A100 GPU.
| Chest (IU-Xray) | Abdomen | Knee | Hip | Wrist | Shoulder | Ave | ||||||||
| B4 | CIDEr | B4 | CIDEr | B4 | CIDEr | B4 | CIDEr | B4 | CIDEr | B4 | CIDEr | B4 | CIDEr | |
| specialized models | ||||||||||||||
| Transformer Vaswani et al. (2017) | 0.162 | 0.511 | 0.108 | 0.261 | 0.079 | 0.151 | 0.077 | 0.137 | 0.086 | 0.129 | 0.088 | 0.192 | 0.100 | 0.230 |
| R2Gen Chen et al. (2020) | 0.165 | 0.430 | 0.105 | 0.248 | 0.077 | 0.193 | 0.082 | 0.210 | 0.093 | 0.288 | 0.082 | 0.174 | 0.101 | 0.257 |
| R2GenCMN Chen et al. (2022) | 0.170 | 0.641 | 0.102 | 0.161 | 0.083 | 0.164 | 0.083 | 0.220 | 0.087 | 0.212 | 0.082 | 0.134 | 0.101 | 0.255 |
| MSAT Wang et al. (2022) | 0.171 | 0.394 | 0.105 | 0.275 | 0.082 | 0.135 | 0.081 | 0.235 | 0.081 | 0.180 | 0.080 | 0.173 | 0.100 | 0.232 |
| DCL Li et al. (2023) | 0.163 | 0.586 | - | - | - | - | - | - | - | - | - | - | - | - |
| METransformer Wang et al. (2023) | 0.172 | 0.435 | - | - | - | - | - | - | - | - | - | - | - | - |
| S4M (ours) | 0.163 | 0.609 | 0.106 | 0.196 | 0.087 | 0.175 | 0.086 | 0.192 | 0.089 | 0.243 | 0.088 | 0.197 | 0.103 | 0.269 |
| generalist models | ||||||||||||||
| R2Gen† (bs=16) | 0.084 | 0.289 | 0.104 | 0.280 | 0.064 | 0.154 | 0.074 | 0.203 | 0.085 | 0.217 | 0.082 | 0.186 | 0.082 | 0.222 |
| R2Gen† (bs=96) | 0.147 | 0.470 | 0.097 | 0.271 | 0.075 | 0.181 | 0.080 | 0.226 | 0.084 | 0.258 | 0.095 | 0.274 | 0.096 | 0.280 |
| R2Gen† (bs=192) | 0.114 | 0.359 | 0.100 | 0.271 | 0.089 | 0.204 | 0.086 | 0.238 | 0.102 | 0.296 | 0.096 | 0.277 | 0.098 | 0.274 |
| S4M (ours, bs=16) | 0.152 | 0.509 | 0.108 | 0.276 | 0.071 | 0.166 | 0.073 | 0.184 | 0.079 | 0.229 | 0.084 | 0.220 | 0.095 | 0.264 |
| S4M (ours, bs=96) | 0.161 | 0.700 | 0.110 | 0.292 | 0.077 | 0.188 | 0.084 | 0.257 | 0.090 | 0.255 | 0.099 | 0.272 | 0.104 | 0.327 |
| S4M (ours, bs=192) | 0.177 | 0.602 | 0.118 | 0.327 | 0.093 | 0.242 | 0.076 | 0.215 | 0.097 | 0.305 | 0.096 | 0.287 | 0.110 | 0.330 |
5.3 Comparison with State-of-the-arts
Specialized baselines
We compare our S4M with the recent best radiology report generation methods, including R2Gen Chen et al. (2020), R2GenCMN Chen et al. (2022), MSAT Wang et al. (2022), DCL Li et al. (2023) and METransformer Wang et al. (2023). In addition, we also consider a widely used natural image captioning method (i.e., Transformer Vaswani et al. (2017)) as another baseline. To begin with, we individually optimize our model and each baseline in a separate training setting. For a fair comparison, we adopt the training batch size (bs) of 16, which is a commonly used setting in the report generation task222We also experiment with increasing the batch size of the baselines to improve their performance, but we observe that it only results in performance comparable to .. In Table 1, we can observe that compared with the specialized baselines, our S4M achieves superior results in terms of average BLEU4 (B4) and CIDEr scores, with values of 0.103 and 0.269, respectively. This indicates that the two proposed branches have a beneficial effect even in the specialized setting.
Generalist baselines
To further analyze the performance of S4M, we adapt specialized models into the joint training setting due to the lack of existing generalist baselines. Here, we use all the training data on different subsets for optimization. To mitigate the impact of different architectures, we select R2Gen Chen et al. (2020) as the baseline. The main difference between R2Gen and our base model lies in the text decoder, where R2Gen incorporates an additional Relational Memory (RM) module while our model does not include this component. For a fair comparison, we adjust the batch size (bs) to match our setting. Specifically, we increase it from 16 to 96 and 192, which aligns with our own configuration, thereby mitigating the potential performance improvement attributed solely to the larger batch size.
Table 1 shows that regardless of or , our S4M consistently outperforms R2Gen in terms of both average B4 and CIDEr scores, which demonstrates its effectiveness in generating accurate and high-quality radiology reports. Furthermore, when comparing R2Gen to our S4M in both the specialized and generalist settings, we observe that R2Gen achieves an approximate improvement in CIDEr (0.257 to 0.280) while achieving a comparable result in B4 (0.101 and 0.098). This indicates the positive impact of utilizing diverse and increased training data. In contrast, our S4M achieves even larger improvements in both CIDEr () and B4 (). These results demonstrate that the gains in performance are not solely attributed to the dataset, but also due to the benefits provided by the proposed two branches. Due to the page limit, we put more results in the supplementary C.
5.4 Ablation Study
| Chest (IU-Xray) | Abdomen | Knee | Hip | Wrist | Shoulder | Ave | ||||||||
|---|---|---|---|---|---|---|---|---|---|---|---|---|---|---|
| B4 | CIDEr | B4 | CIDEr | B4 | CIDEr | B4 | CIDEr | B4 | CIDEr | B4 | CIDEr | B4 | CIDEr | |
| Base | 0.129 | 0.426 | 0.106 | 0.268 | 0.081 | 0.171 | 0.076 | 0.255 | 0.089 | 0.258 | 0.091 | 0.278 | 0.095 | 0.276 |
| +RadKA∗ | 0.137 | 0.474 | 0.103 | 0.269 | 0.085 | 0.169 | 0.081 | 0.224 | 0.088 | 0.277 | 0.091 | 0.255 | 0.098 | 0.278 |
| +RadKA | 0.156 | 0.537 | 0.106 | 0.266 | 0.081 | 0.197 | 0.085 | 0.205 | 0.090 | 0.238 | 0.086 | 0.231 | 0.101 | 0.279 |
| +IPG | 0.161 | 0.700 | 0.110 | 0.292 | 0.077 | 0.188 | 0.084 | 0.257 | 0.090 | 0.255 | 0.099 | 0.272 | 0.104 | 0.327 |
In this part, we evaluate the performance of our base model with and without the RadKA and IPG branches. In Table 2, the results show that our base model with RadKA alone achieves better performance compared with that without any additional branches (i.e., average B4: 0.095 0.101 while average CIDEr: 0.276 0.279), which verifies the significance of the radiology-relevant knowledge in report generation task. While RadKA∗ (without the indicator ) can also achieve improved results compared to the base model (e.g., average B4: 0.095 0.098), it is surpassed by RadKA (average B4: 0.101). This highlights the importance of region-specific guidance and demonstrates the necessity of incorporating such guidance for better performance. Finally, incorporating the IPG branch further enhances the performance, resulting in the best scores for both average B4 (0.104) and CIDEr (0.327). This demonstrates the contribution of IPG in improving the model performance by leveraging guidance from different modalities, including both images and reports.
5.5 More Discussions
Semantic alignment between image and report
Besides the reference-based metrics like BLEU4, which may be influenced by semantically irrelevant factors (e.g., writing style Chen et al. (2022)), we seek to directly assess the semantic alignment between the input images and the generated reports. Thus, we calculate a reference-free score, namely CLIPScore Hessel et al. (2021), for R2Gen Chen et al. (2020) (trained on IU-Xray only), R2Gen† (trained on the merged dataset) and our S4M. Notably, as we use MedClip Wang et al. (2022) in CLIPScore, which is pre-trained on chest X-Ray datasets, we only evaluate this score on the IU-Xray (chest) dataset because it is open-sourced. Moreover, for a fair comparison, we set the batch size to 96 for both R2Gen† (achieves the best results) and our model. For the specialized R2Gen, we keep the settings of the official code unchanged. In Table 3c(a), our S4M outperforms R2Gen with a CLIPScore of 78.052, regardless of whether it is trained on IU-Xray only (77.670) or on our merged dataset (75.402).
Performance analysis of image encoder
To test the effect of our IPG, we seek to directly investigate the recognition ability of image encoders in report generation models. To this end, we directly add a classification head on top of the image encoder (i.e., linear probing) for CheXpert Irvin et al. (2019), a multi-label classification dataset. As shown in Table 3c(b), our S4M model obtains an 81.252 AUC score that outperforms both R2Gen (77.435) and R2Gen† (79.213), which indicates the ability of our model to correctly recognize and classify different medical diseases within the input radiology images. Furthermore, to delve deeper into the influence of our IPG branch, we evaluate the performance of the S4M without incorporating IPG during training. In this case, the AUC score decreases to 80.405, further demonstrating the effectiveness of IPG in enhancing the recognition ability of our model. Interestingly, in Table 3c(a), R2Gen performs better than R2Gen†, while the results are reversed in Table 3c(b). This observation suggests that R2Gen trained solely on the IU-Xray dataset is susceptible to overfitting and exhibits relatively weaker recognition capability compared to the model trained on a more diverse and merged dataset, which further underscores the importance of training a single model on a broader and merged dataset to achieve better performance.
Impact of hyper-parameter in Eq. (7)
In Table 3c(c), When the value of is small, such as , the performance of our model is suboptimal. This is because there is insufficient exploitation of the semantic alignment across different modalities (i.e., images and reports). As we increase the value of , the performance of our S4M reaches its peak at . However, beyond that point, the performance starts to degrade. To strike a balance between the contrastive loss and the captioning loss, we set the weighting parameter to a value of for all our experiments.
5.6 Qualitative Evaluation
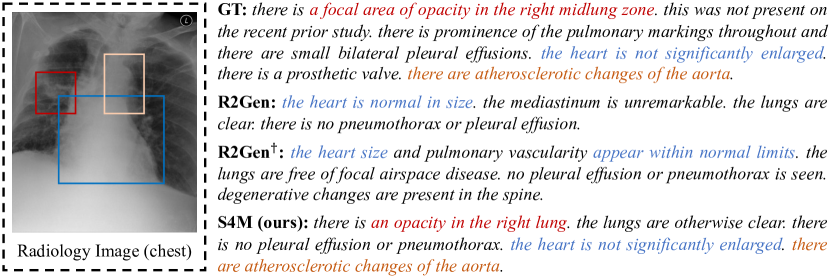
To further test the performance of the S4M, we assess the quality of reports generated by different methods, including our method and two baselines, i.e., R2Gen and R2Gen†, trained on IU-Xray (chest) and our merged dataset, respectively. In Figure 3, we highlight the descriptions in different colours (red, blue and orange), which are semantically aligned with that in the ground-truth (GT) reports. Also, we enclose the corresponding area in the image with the same colour. When considering the prominent area, such as the heart (indicated by the blue box), all three models demonstrate the ability to provide (almost) accurate descriptions. However, R2Gen still tends to generate the “average” descriptions like “the heart is normal in size” while R2Gen† shows improvement due to optimization with a more diverse dataset. Furthermore, our S4M demonstrates the ability to identify specific and subtle areas (highlighted by red and orange boxes in the image) and generate descriptions that align semantically with the ground truth. For instance, while the baselines fail to capture the details, our model accurately describes “an opacity in the right lung”, matching the GT description: “a focal area of opacity in the right midlung zone”. However, despite our method achieving better performance compared to the baselines, it still faces challenges in accurately identifying and describing all tiny areas. As shown in Figure 3, in the ground-truth report stating “there are small bilateral pleural effusions”, our generated report states “there is no pleural effusion”, indicating a slight mismatch. But it is worth noting that the same phenomenon is observed in both R2Gen and R2Gen† as well.
5.7 Limitations and Broader Impacts
Limitations and future works
While our S4M exhibits superior performance compared to the baselines, it is important to acknowledge several limitations that could be addressed in future research. One of the limitations is the relatively small size of the dataset, even when data from multiple body parts are combined. This limited dataset size poses challenges for achieving optimal performance of the model. To overcome this limitation, in addition to a well-designed model architecture or learning method, it becomes necessary to explore data expansion methods such as data augmentation or synthesis. Besides, since we take this work as a promising start on multi-part report generation in radiology, we only focus on six specific body parts, which limits the coverage of anatomical regions, such as the brain. Additionally, for simplicity, we align the report lengths within a range of 30 to 60 tokens, disregarding reports that are too short or too long. While for our future work, we plan to expand our scope by incorporating more body parts and including reports with more diverse lengths.
Broader impacts
Generating radiology reports with high accuracy and reliability is crucial for patient care. Any errors or misinterpretations in the reports generated by the models can have significant consequences. Ensuring the model’s reliability, interpretability, and transparency is of utmost importance to address ethical concerns.
6 Conclusion
Automating radiology report generation can alleviate the burden on radiologists and enhance diagnostic radiology practice. In this paper, we design a Single-for-Multiple (S4M) report generation framework capable of producing reasonable reports for diverse body parts. Based on the encoder-decoder architecture, we incorporate the general radiology knowledge and enhance the cross-modal alignment by Radiology-informed Knowledge Aggregation (RadKA) branch and Implicit Prior Guidance (IPG) branch, respectively. Experiments are conducted on a merged dataset containing a public dataset (IU-Xray) and five private datasets, covering chest, abdomen, knee, hip, wrist, and shoulder regions. The results show that our S4M outperforms both the specialized and generalist baselines.
Appendix A Details of Knowledge Base
Here, we used different colours to highlight shared topics across the six body parts. The results show that there are many topics commonly used, even across different body parts. This finding indicates that our knowledge set has a relatively general scope. Topics on our general knowledge set include:
abdomen, acetabular, acromioclavicular, acute, airspace disease, anatomical, angulation, atelectasis, bilateral, bone, bony, bowel, calcification, calcinosis, cardiomediastinal, cardiomegaly, carpal, cast, change, changes, cicatrix, clavicle, colon, compartment, complication, consolidation, contours, cuff, degenerative, dislocation, displacement, distal, dorsal, edema, effusion, emphysema, enlocated, evidence, faecal, femoral, femur, fracture, fractures, gas, glenohumeral, glenoid, head, healing, hernia, hip, humeral, humerus, hypoinflation, identified, inferior, intact, interval, joint, knee, lateral, lesion, limits, loading, loops, lucency, lumbar, lung, material, medical device, mild, moderate, nonspecific, normal, obstruction, opacity, other, patella, patellar, pelvic, pelvis, periprosthetic, plate, pleural, pneumonia, pneumothorax, projection, prosthesis, proximal, pubic, quadrant, radial, radio-carpal, radius, rectum, replacement, ring, sacroiliac, satisfactory, scaphoid, sclerosis, scoliosis, shoulder, situ, soft, space, stomach, styloid, subacromial, subdiaphragmatic, supine, suprapatellar, surgical, swelling, symphysis, thickening, tissue, tissues, transverse, tuberosity, ulnar, visualised, wrist.
Topics on each body part namely :
Chest = {airspace disease, atelectasis, calcinosis, cardiomegaly, cicatrix, edema, effusion, emphysema, fractures, hernia, hypoinflation, lesion, medical device, normal, opacity, other, pneumonia, pneumothorax, scoliosis, thickening}
Abdomen = {abdomen, bowel, cardiomediastinal, colon, consolidation, contours, degenerative, evidence, faecal, gas, limits, loading, loops, lumbar, lung, material, moderate, nonspecific, obstruction, pleural, projection, quadrant, rectum, stomach, subdiaphragmatic, supine, surgical, tissue}
Knee = {acute, alignment, anatomical, changes, compartment, complication, degenerative, dislocation, effusion, evidence, femoral, fracture, gas, joint, knee, lateral, lucency, mild, moderate, patella, patellar, prosthesis, proximal, replacement, satisfactory, situ, soft, suprapatellar, swelling, tissue, tissues}
Hip = {acetabular, acute, alignment, bilateral, bone, bony, degenerative, enlocated, femoral, femur, fracture, fractures, hip, identified, intact, joint, lucency, mild, moderate, pelvic, pelvis, periprosthetic, proximal, pubic, ring, sacroiliac, sclerosis, symphysis}
Wrist = {acute, alignment, anatomical, angulation, bony, carpal, cast, degenerative, displacement, distal, dorsal, fracture, healing, intact, interval, lateral, mild, plate, radial, radio-carpal, radius, scaphoid, styloid, swelling, tissue, transverse, ulnar, wrist}
Shoulder = {acromioclavicular, acute, alignment, bony, calcification, change, clavicle, cuff, degenerative, dislocation, fracture, fractures, glenohumeral, glenoid, head, humeral, humerus, identified, inferior, intact, joint, lateral, proximal, shoulder, space, subacromial, tissue, tuberosity, visualised}
Appendix B Details of Private Datasets
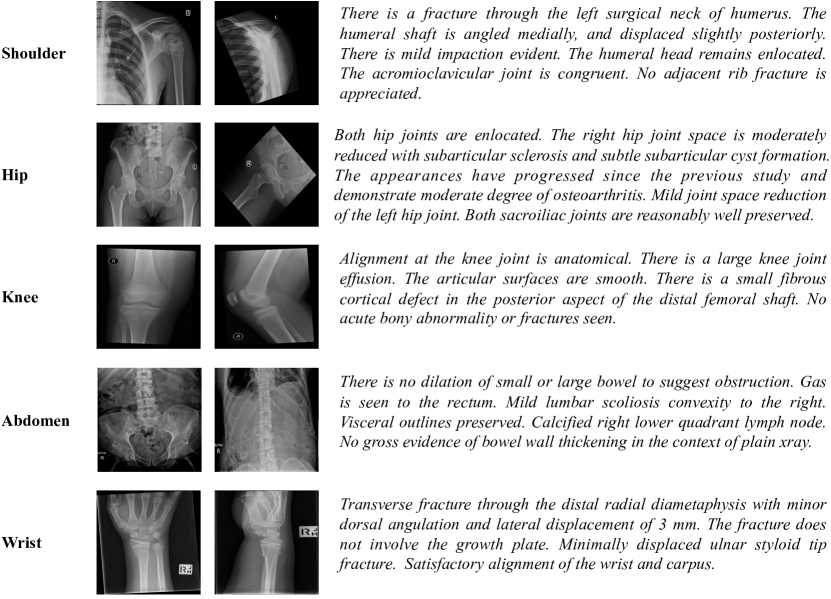
We collected private data on five additional body parts separately, each comprising paired radiology images and corresponding reports. Anonymous Human Research Ethics Committee provided ethics approval for private data used in this study. Unlike IU-Xray Demner-Fushman et al. (2016), where one report strictly corresponds to two view images, we introduce private data, with each report pair corresponding to 1-8 images of different views. To be consistent with IU-Xray, we filter out the data with only a single radiograph while selecting two images (including at least one frontal view) if there are more than two. Here, we provide some samples on our private datasets in Figure 4.
Appendix C More Quantitative Results
To assess the quality of the generated captions, we use four widely used evaluation metrics, i.e., BLEU Papineni et al. (2002), ROUGE Lin (2004), METEOR Banerjee and Lavie (2005) and CIDEr Vedantam et al. (2015). As shown in Table 4, we report the average scores of all the above evaluation metrics. The results exhibit that regardless of or , our S4M consistently outperforms R2Gen in terms of all the average scores (except for ROUGE-L), which demonstrates its effectiveness in generating accurate and high-quality radiology reports. Specifically, when comparing R2Gen to our S4M in both the specialized and generalist settings, we observe that the improvements of R2Gen are , , , , , and for BLEU-1, BLEU-2, BLEU-3, BLEU-4, METEOR, ROUGE-L and CIDEr, respectively333Note that for a fair comparison, we compare the highest results for both R2Gen and ours.. In contrast, our S4M achieves even larger improvements in these evaluation metrics about , , , , , and separately. Moreover, we also report the values of all the evaluation metrics on these six datasets from Tables 5 to 10.
| BLEU-1 (Ave) | BLEU-2 (Ave) | BLEU-3 (Ave) | BLEU-4 (Ave) | METEOR (Ave) | ROUGE-L (Ave) | CIDEr (Ave) | |
| specialized models | |||||||
| Transformer Vaswani et al. (2017) | 0.368 | 0.223 | 0.147 | 0.100 | 0.134 | 0.305 | 0.230 |
| R2Gen Chen et al. (2020) | 0.374 | 0.229 | 0.149 | 0.101 | 0.141 | 0.312 | 0.257 |
| R2GenCMN Chen et al. (2022) | 0.371 | 0.229 | 0.150 | 0.101 | 0.138 | 0.307 | 0.255 |
| MSAT Wang et al. (2022) | 0.393 | 0.237 | 0.151 | 0.100 | 0.139 | 0.302 | 0.232 |
| S4M (ours) | 0.370 | 0.227 | 0.150 | 0.103 | 0.144 | 0.312 | 0.269 |
| generalist models | |||||||
| R2Gen† (bs=16) | 0.345 | 0.200 | 0.126 | 0.082 | 0.133 | 0.289 | 0.222 |
| R2Gen† (bs=96) | 0.382 | 0.228 | 0.145 | 0.096 | 0.149 | 0.301 | 0.280 |
| R2Gen† (bs=192) | 0.369 | 0.225 | 0.145 | 0.098 | 0.146 | 0.305 | 0.274 |
| S4M (ours, bs=16) | 0.363 | 0.217 | 0.140 | 0.095 | 0.144 | 0.296 | 0.264 |
| S4M (ours, bs=96) | 0.383 | 0.231 | 0.151 | 0.104 | 0.149 | 0.306 | 0.327 |
| S4M (ours, bs=192) | 0.401 | 0.244 | 0.160 | 0.110 | 0.154 | 0.310 | 0.330 |
| BLEU-1 | BLEU-2 | BLEU-3 | BLEU-4 | METEOR | ROUGE-L | CIDEr | |
| specialized models | |||||||
| Transformer Vaswani et al. (2017) | 0.459 | 0.298 | 0.215 | 0.162 | 0.188 | 0.362 | 0.511 |
| R2Gen Chen et al. (2020) | 0.470 | 0.304 | 0.219 | 0.165 | 0.187 | 0.371 | 0.430 |
| R2GenCMN Chen et al. (2022) | 0.475 | 0.309 | 0.222 | 0.170 | 0.191 | 0.375 | 0.641 |
| MSAT Wang et al. (2022) | 0.481 | 0.316 | 0.226 | 0.171 | 0.190 | 0.372 | 0.394 |
| DCL Li et al. (2023) | - | - | - | 0.163 | 0.193 | 0.383 | 0.586 |
| METransformer Wang et al. (2023) | 0.483 | 0.322 | 0.228 | 0.172 | 0.192 | 0.380 | 0.435 |
| S4M (ours) | 0.441 | 0.285 | 0.208 | 0.163 | 0.184 | 0.361 | 0.609 |
| generalist models | |||||||
| R2Gen† (bs=16) | 0.306 | 0.175 | 0.117 | 0.084 | 0.134 | 0.316 | 0.289 |
| R2Gen† (bs=96) | 0.433 | 0.275 | 0.196 | 0.147 | 0.184 | 0.355 | 0.470 |
| R2Gen† (bs=192) | 0.349 | 0.217 | 0.153 | 0.114 | 0.154 | 0.332 | 0.359 |
| S4M (ours, bs=16) | 0.444 | 0.287 | 0.202 | 0.152 | 0.190 | 0.365 | 0.509 |
| S4M (ours, bs=96) | 0.454 | 0.290 | 0.210 | 0.161 | 0.187 | 0.361 | 0.700 |
| S4M (ours, bs=192) | 0.466 | 0.306 | 0.225 | 0.177 | 0.199 | 0.367 | 0.602 |
| BLEU-1 | BLEU-2 | BLEU-3 | BLEU-4 | METEOR | ROUGE-L | CIDEr | |
| specialized models | |||||||
| Transformer Vaswani et al. (2017) | 0.409 | 0.247 | 0.161 | 0.108 | 0.142 | 0.314 | 0.261 |
| R2Gen Chen et al. (2020) | 0.389 | 0.241 | 0.156 | 0.105 | 0.143 | 0.309 | 0.248 |
| R2GenCMN Chen et al. (2022) | 0.361 | 0.231 | 0.151 | 0.102 | 0.135 | 0.310 | 0.161 |
| MSAT Wang et al. (2022) | 0.410 | 0.246 | 0.157 | 0.105 | 0.140 | 0.286 | 0.275 |
| S4M (ours) | 0.373 | 0.228 | 0.154 | 0.106 | 0.137 | 0.314 | 0.196 |
| generalist models | |||||||
| R2Gen† (bs=16) | 0.386 | 0.238 | 0.154 | 0.104 | 0.144 | 0.297 | 0.280 |
| R2Gen† (bs=96) | 0.407 | 0.244 | 0.150 | 0.097 | 0.155 | 0.297 | 0.271 |
| R2Gen† (bs=192) | 0.397 | 0.240 | 0.151 | 0.100 | 0.153 | 0.296 | 0.271 |
| S4M (ours, bs=16) | 0.395 | 0.243 | 0.159 | 0.108 | 0.152 | 0.305 | 0.276 |
| S4M (ours, bs=96) | 0.409 | 0.252 | 0.162 | 0.110 | 0.159 | 0.313 | 0.292 |
| S4M (ours, bs=192) | 0.432 | 0.269 | 0.175 | 0.118 | 0.161 | 0.322 | 0.327 |
| BLEU-1 | BLEU-2 | BLEU-3 | BLEU-4 | METEOR | ROUGE-L | CIDEr | |
| specialized models | |||||||
| Transformer Vaswani et al. (2017) | 0.304 | 0.177 | 0.116 | 0.078 | 0.115 | 0.288 | 0.169 |
| R2Gen Chen et al. (2020) | 0.308 | 0.191 | 0.121 | 0.077 | 0.130 | 0.300 | 0.193 |
| R2GenCMN Chen et al. (2022) | 0.329 | 0.201 | 0.130 | 0.083 | 0.120 | 0.284 | 0.164 |
| MSAT Wang et al. (2022) | 0.366 | 0.203 | 0.128 | 0.082 | 0.134 | 0.282 | 0.135 |
| S4M (ours) | 0.339 | 0.207 | 0.133 | 0.087 | 0.135 | 0.295 | 0.175 |
| generalist models | |||||||
| R2Gen† (bs=16) | 0.321 | 0.170 | 0.100 | 0.064 | 0.119 | 0.255 | 0.154 |
| R2Gen† (bs=96) | 0.343 | 0.197 | 0.120 | 0.075 | 0.134 | 0.284 | 0.181 |
| R2Gen† (bs=192) | 0.333 | 0.207 | 0.134 | 0.089 | 0.139 | 0.308 | 0.204 |
| S4M (ours, bs=16) | 0.315 | 0.180 | 0.111 | 0.071 | 0.124 | 0.276 | 0.166 |
| S4M (ours, bs=96) | 0.331 | 0.193 | 0.120 | 0.077 | 0.130 | 0.277 | 0.188 |
| S4M (ours, bs=192) | 0.359 | 0.219 | 0.141 | 0.093 | 0.139 | 0.291 | 0.242 |
| BLEU-1 | BLEU-2 | BLEU-3 | BLEU-4 | METEOR | ROUGE-L | CIDEr | |
| specialized models | |||||||
| Transformer Vaswani et al. (2017) | 0.334 | 0.193 | 0.118 | 0.077 | 0.116 | 0.264 | 0.137 |
| R2Gen Chen et al. (2020) | 0.358 | 0.211 | 0.131 | 0.082 | 0.131 | 0.288 | 0.210 |
| R2GenCMN Chen et al. (2022) | 0.362 | 0.214 | 0.133 | 0.083 | 0.133 | 0.286 | 0.220 |
| MSAT Wang et al. (2022) | 0.362 | 0.218 | 0.131 | 0.081 | 0.125 | 0.282 | 0.235 |
| S4M (ours) | 0.356 | 0.216 | 0.135 | 0.086 | 0.138 | 0.294 | 0.192 |
| generalist models | |||||||
| R2Gen† (bs=16) | 0.351 | 0.199 | 0.120 | 0.074 | 0.132 | 0.275 | 0.203 |
| R2Gen† (bs=96) | 0.361 | 0.209 | 0.126 | 0.080 | 0.137 | 0.281 | 0.226 |
| R2Gen† (bs=192) | 0.367 | 0.214 | 0.133 | 0.086 | 0.139 | 0.285 | 0.238 |
| S4M (ours, bs=16) | 0.332 | 0.187 | 0.113 | 0.073 | 0.129 | 0.263 | 0.184 |
| S4M (ours, bs=96) | 0.366 | 0.211 | 0.130 | 0.084 | 0.137 | 0.281 | 0.257 |
| S4M (ours, bs=192) | 0.367 | 0.206 | 0.122 | 0.076 | 0.133 | 0.277 | 0.215 |
| BLEU-1 | BLEU-2 | BLEU-3 | BLEU-4 | METEOR | ROUGE-L | CIDEr | |
| specialized models | |||||||
| Transformer Vaswani et al. (2017) | 0.339 | 0.203 | 0.133 | 0.086 | 0.120 | 0.301 | 0.129 |
| R2Gen Chen et al. (2020) | 0.359 | 0.214 | 0.139 | 0.093 | 0.135 | 0.299 | 0.288 |
| R2GenCMN Chen et al. (2022) | 0.351 | 0.210 | 0.134 | 0.087 | 0.129 | 0.290 | 0.212 |
| MSAT Wang et al. (2022) | 0.374 | 0.216 | 0.134 | 0.081 | 0.124 | 0.295 | 0.180 |
| S4M (ours) | 0.358 | 0.214 | 0.137 | 0.089 | 0.142 | 0.302 | 0.243 |
| generalist models | |||||||
| R2Gen† (bs=16) | 0.351 | 0.207 | 0.133 | 0.085 | 0.136 | 0.293 | 0.217 |
| R2Gen† (bs=96) | 0.375 | 0.215 | 0.133 | 0.084 | 0.144 | 0.291 | 0.258 |
| R2Gen† (bs=192) | 0.389 | 0.238 | 0.154 | 0.102 | 0.148 | 0.312 | 0.296 |
| S4M (ours, bs=16) | 0.342 | 0.199 | 0.124 | 0.079 | 0.133 | 0.280 | 0.229 |
| S4M (ours, bs=96) | 0.368 | 0.217 | 0.138 | 0.090 | 0.144 | 0.298 | 0.255 |
| S4M (ours, bs=192) | 0.390 | 0.232 | 0.148 | 0.097 | 0.149 | 0.299 | 0.305 |
| BLEU-1 | BLEU-2 | BLEU-3 | BLEU-4 | METEOR | ROUGE-L | CIDEr | |
| specialized models | |||||||
| Transformer Vaswani et al. (2017) | 0.363 | 0.219 | 0.138 | 0.088 | 0.123 | 0.301 | 0.192 |
| R2Gen Chen et al. (2020) | 0.358 | 0.213 | 0.130 | 0.082 | 0.122 | 0.307 | 0.174 |
| R2GenCMN Chen et al. (2022) | 0.348 | 0.210 | 0.129 | 0.082 | 0.119 | 0.297 | 0.134 |
| MSAT Wang et al. (2022) | 0.364 | 0.221 | 0.131 | 0.080 | 0.123 | 0.297 | 0.173 |
| S4M (ours) | 0.353 | 0.211 | 0.133 | 0.088 | 0.129 | 0.304 | 0.197 |
| generalist models | |||||||
| R2Gen† (bs=16) | 0.355 | 0.212 | 0.131 | 0.082 | 0.132 | 0.299 | 0.186 |
| R2Gen† (bs=96) | 0.374 | 0.225 | 0.142 | 0.095 | 0.142 | 0.297 | 0.274 |
| R2Gen† (bs=192) | 0.380 | 0.231 | 0.145 | 0.096 | 0.144 | 0.299 | 0.277 |
| S4M (ours, bs=16) | 0.350 | 0.207 | 0.128 | 0.084 | 0.133 | 0.288 | 0.220 |
| S4M (ours, bs=96) | 0.369 | 0.225 | 0.145 | 0.099 | 0.139 | 0.304 | 0.272 |
| S4M (ours, bs=192) | 0.389 | 0.234 | 0.146 | 0.096 | 0.141 | 0.302 | 0.287 |
References
- Isensee et al. [2021] Isensee, F.; Jaeger, P. F.; Kohl, S. A.; Petersen, J.; Maier-Hein, K. H. nnU-Net: a self-configuring method for deep learning-based biomedical image segmentation. Nature methods 2021, 203–211.
- Lee et al. [2023] Lee, H. H.; Bao, S.; Huo, Y.; Landman, B. A. 3D UX-Net: A Large Kernel Volumetric ConvNet Modernizing Hierarchical Transformer for Medical Image Segmentation. Int. Conf. Learn. Represent. 2023.
- Zhang et al. [2021] Zhang, J.; Xie, Y.; Xia, Y.; Shen, C. Dodnet: Learning to segment multi-organ and tumors from multiple partially labeled datasets. IEEE Conf. Comput. Vis. Pattern Recog. 2021; pp 1195–1204.
- Li et al. [2023] Li, M.; Lin, B.; Chen, Z.; Lin, H.; Liang, X.; Chang, X. Dynamic Graph Enhanced Contrastive Learning for Chest X-ray Report Generation. IEEE Conf. Comput. Vis. Pattern Recog. 2023,
- Liu et al. [2021] Liu, F.; Wu, X.; Ge, S.; Fan, W.; Zou, Y. Exploring and distilling posterior and prior knowledge for radiology report generation. IEEE Conf. Comput. Vis. Pattern Recog. 2021; pp 13753–13762.
- Liu et al. [2021] Liu, F.; You, C.; Wu, X.; Ge, S.; Sun, X., et al. Auto-encoding knowledge graph for unsupervised medical report generation. Adv. Neural Inform. Process. Syst. 2021, 16266–16279.
- Ma et al. [2021] Ma, X.; Liu, F.; Yin, C.; Wu, X.; Ge, S.; Zou, Y.; Zhang, P.; Sun, X. Contrastive attention for automatic chest x-ray report generation. ACL-IJCNLP 2021,
- Wang et al. [2023] Wang, Z.; Liu, L.; Wang, L.; Zhou, L. METransformer: Radiology Report Generation by Transformer with Multiple Learnable Expert Tokens. IEEE Conf. Comput. Vis. Pattern Recog. 2023,
- Zhang et al. [2020] Zhang, Y.; Wang, X.; Xu, Z.; Yu, Q.; Yuille, A.; Xu, D. When radiology report generation meets knowledge graph. AAAI. 2020; pp 12910–12917.
- Chen et al. [2020] Chen, Z.; Song, Y.; Chang, T.-H.; Wan, X. Generating radiology reports via memory-driven transformer. EMNLP 2020,
- Vaswani et al. [2017] Vaswani, A.; Shazeer, N.; Parmar, N.; Uszkoreit, J.; Jones, L.; Gomez, A. N.; Kaiser, Ł.; Polosukhin, I. Attention is all you need. Adv. Neural Inform. Process. Syst. 2017,
- Radford et al. [2021] Radford, A.; Kim, J. W.; Hallacy, C.; Ramesh, A.; Goh, G.; Agarwal, S.; Sastry, G.; Askell, A.; Mishkin, P.; Clark, J., et al. Learning transferable visual models from natural language supervision. ICML. 2021; pp 8748–8763.
- Li et al. [2022] Li, J.; Li, D.; Xiong, C.; Hoi, S. Blip: Bootstrapping language-image pre-training for unified vision-language understanding and generation. ICML. 2022; pp 12888–12900.
- Li et al. [2023] Li, J.; Li, D.; Savarese, S.; Hoi, S. Blip-2: Bootstrapping language-image pre-training with frozen image encoders and large language models. arXiv preprint arXiv:2301.12597 2023,
- Chen et al. [2022] Chen, Q.; Deng, C.; Wu, Q. Learning Distinct and Representative Modes for Image Captioning. Adv. Neural Inform. Process. Syst. 2022,
- Willemink et al. [2020] Willemink, M. J.; Koszek, W. A.; Hardell, C.; Wu, J.; Fleischmann, D.; Harvey, H.; Folio, L. R.; Summers, R. M.; Rubin, D. L.; Lungren, M. P. Preparing medical imaging data for machine learning. Radiology 2020, 4–15.
- Jing et al. [2018] Jing, B.; Xie, P.; Xing, E. On the automatic generation of medical imaging reports. ACL 2018,
- Wang et al. [2021] Wang, Z.; Zhou, L.; Wang, L.; Li, X. A self-boosting framework for automated radiographic report generation. IEEE Conf. Comput. Vis. Pattern Recog. 2021; pp 2433–2442.
- Xue et al. [2018] Xue, Y.; Xu, T.; Rodney Long, L.; Xue, Z.; Antani, S.; Thoma, G. R.; Huang, X. Multimodal recurrent model with attention for automated radiology report generation. MICCAI. 2018; pp 457–466.
- Yuan et al. [2019] Yuan, J.; Liao, H.; Luo, R.; Luo, J. Automatic radiology report generation based on multi-view image fusion and medical concept enrichment. MICCAI. 2019; pp 721–729.
- Chen et al. [2022] Chen, Z.; Shen, Y.; Song, Y.; Wan, X. Cross-modal memory networks for radiology report generation. ACL-IJCNLP 2022,
- Li et al. [2022] Li, M.; Cai, W.; Verspoor, K.; Pan, S.; Liang, X.; Chang, X. Cross-modal clinical graph transformer for ophthalmic report generation. IEEE Conf. Comput. Vis. Pattern Recog. 2022; pp 20656–20665.
- Wang et al. [2022] Wang, Z.; Han, H.; Wang, L.; Li, X.; Zhou, L. Automated Radiographic Report Generation Purely on Transformer: A Multicriteria Supervised Approach. IEEE Transactions on Medical Imaging 2022, 2803–2813.
- Anderson et al. [2018] Anderson, P.; He, X.; Buehler, C.; Teney, D.; Johnson, M.; Gould, S.; Zhang, L. Bottom-up and top-down attention for image captioning and visual question answering. IEEE Conf. Comput. Vis. Pattern Recog. 2018; pp 6077–6086.
- Huang et al. [2019] Huang, L.; Wang, W.; Chen, J.; Wei, X.-Y. Attention on attention for image captioning. Int. Conf. Comput. Vis. 2019; pp 4634–4643.
- Vinyals et al. [2015] Vinyals, O.; Toshev, A.; Bengio, S.; Erhan, D. Show and tell: A neural image caption generator. IEEE Conf. Comput. Vis. Pattern Recog. 2015; pp 3156–3164.
- Xu et al. [2015] Xu, K.; Ba, J.; Kiros, R.; Cho, K.; Courville, A.; Salakhudinov, R.; Zemel, R.; Bengio, Y. Show, attend and tell: Neural image caption generation with visual attention. ICML. 2015; pp 2048–2057.
- LeCun et al. [2015] LeCun, Y.; Bengio, Y.; Hinton, G. Deep learning. nature 2015, 436–444.
- Cornia et al. [2020] Cornia, M.; Stefanini, M.; Baraldi, L.; Cucchiara, R. Meshed-memory transformer for image captioning. IEEE Conf. Comput. Vis. Pattern Recog. 2020; pp 10578–10587.
- Lu et al. [2017] Lu, J.; Xiong, C.; Parikh, D.; Socher, R. Knowing when to look: Adaptive attention via a visual sentinel for image captioning. IEEE Conf. Comput. Vis. Pattern Recog. 2017; pp 375–383.
- Pan et al. [2020] Pan, Y.; Yao, T.; Li, Y.; Mei, T. X-linear attention networks for image captioning. IEEE Conf. Comput. Vis. Pattern Recog. 2020; pp 10971–10980.
- Rennie et al. [2017] Rennie, S. J.; Marcheret, E.; Mroueh, Y.; Ross, J.; Goel, V. Self-critical sequence training for image captioning. IEEE Conf. Comput. Vis. Pattern Recog. 2017; pp 7008–7024.
- Karpathy and Fei-Fei [2015] Karpathy, A.; Fei-Fei, L. Deep visual-semantic alignments for generating image descriptions. IEEE Conf. Comput. Vis. Pattern Recog. 2015; pp 3128–3137.
- Zhou et al. [2020] Zhou, L.; Palangi, H.; Zhang, L.; Hu, H.; Corso, J.; Gao, J. Unified vision-language pre-training for image captioning and vqa. AAAI. 2020; pp 13041–13049.
- Neumann et al. [2019] Neumann, M.; King, D.; Beltagy, I.; Ammar, W. ScispaCy: Fast and Robust Models for Biomedical Natural Language Processing. Proceedings of the 18th BioNLP Workshop and Shared Task. Florence, Italy, 2019; pp 319–327.
- Alsentzer et al. [2019] Alsentzer, E.; Murphy, J. R.; Boag, W.; Weng, W.-H.; Jin, D.; Naumann, T.; McDermott, M. Publicly available clinical BERT embeddings. arXiv preprint arXiv:1904.03323 2019,
- Demner-Fushman et al. [2016] Demner-Fushman, D.; Kohli, M. D.; Rosenman, M. B.; Shooshan, S. E.; Rodriguez, L.; Antani, S.; Thoma, G. R.; McDonald, C. J. Preparing a collection of radiology examinations for distribution and retrieval. Journal of the American Medical Informatics Association 2016, 304–310.
- Papineni et al. [2002] Papineni, K.; Roukos, S.; Ward, T.; Zhu, W.-J. Bleu: a method for automatic evaluation of machine translation. ACL. 2002; pp 311–318.
- Vedantam et al. [2015] Vedantam, R.; Lawrence Zitnick, C.; Parikh, D. Cider: Consensus-based image description evaluation. IEEE Conf. Comput. Vis. Pattern Recog. 2015; pp 4566–4575.
- Hessel et al. [2021] Hessel, J.; Holtzman, A.; Forbes, M.; Bras, R. L.; Choi, Y. CLIPScore: A reference-free evaluation metric for image captioning. EMNLP 2021,
- Irvin et al. [2019] Irvin, J.; Rajpurkar, P.; Ko, M.; Yu, Y.; Ciurea-Ilcus, S.; Chute, C.; Marklund, H.; Haghgoo, B.; Ball, R.; Shpanskaya, K., et al. Chexpert: A large chest radiograph dataset with uncertainty labels and expert comparison. AAAI. 2019; pp 590–597.
- He et al. [2016] He, K.; Zhang, X.; Ren, S.; Sun, J. Deep residual learning for image recognition. IEEE Conf. Comput. Vis. Pattern Recog. 2016; pp 770–778.
- Deng et al. [2009] Deng, J.; Dong, W.; Socher, R.; Li, L.-J.; Li, K.; Fei-Fei, L. Imagenet: A large-scale hierarchical image database. IEEE Conf. Comput. Vis. Pattern Recog. 2009; pp 248–255.
- Wang et al. [2022] Wang, Z.; Wu, Z.; Agarwal, D.; Sun, J. Medclip: Contrastive learning from unpaired medical images and text. arXiv preprint arXiv:2210.10163 2022,
- Kingma and Ba [2014] Kingma, D. P.; Ba, J. Adam: A method for stochastic optimization. arXiv preprint arXiv:1412.6980 2014,
- Wang et al. [2022] Wang, Z.; Tang, M.; Wang, L.; Li, X.; Zhou, L. A Medical Semantic-Assisted Transformer for Radiographic Report Generation. MICCAI. 2022; pp 655–664.
- Lin [2004] Lin, C.-Y. Rouge: A package for automatic evaluation of summaries. Text summarization branches out. 2004; pp 74–81.
- Banerjee and Lavie [2005] Banerjee, S.; Lavie, A. METEOR: An automatic metric for MT evaluation with improved correlation with human judgments. Proceedings of the acl workshop on intrinsic and extrinsic evaluation measures for machine translation and/or summarization. 2005; pp 65–72.