Blue-detuned molecular magneto-optical trap schemes based on bayesian optimization
Abstract
Direct laser cooling and trapping of molecules to temperature below Doppler limit and density exceeding are challenging due to the sub-Doppler heating effects of molecular magneto-optical trap (MOT). In our previous paper Xu et al. (2022), we presented a general approach to engineering the sub- Doppler force by tuning the AC stark shift with the addition of a blue detuned laser. Here, by employing the Bayesian optimization method to optical Bloch equations, we have identified multiple blue-detuned MOT schemes for the CaF molecule. From the three-dimensional Monte-Carlo simulation, we obtained a MOT temperature and density of and , respectively. Our findings present a potential avenue for directly loading molecular MOTs into conservative traps, which can capitalize on the high density and low temperature of the MOT
Recent experiments using molecular magneto-optical traps (MOT) have been found to suffer from the sub-Doppler heating effects caused by the complex energy levels involved Devlin and Tarbutt (2016, 2018). These effects lead to higher temperature and lower density in the resulting molecular cloud Williams et al. (2017); Anderegg et al. (2017); Barry et al. (2014); Collopy et al. (2018). While blue-detuned molasses can effectively cool molecules to temperatures as low as a few Truppe et al. (2017); Caldwell et al. (2019); Cheuk et al. (2018); Ding et al. (2020); Langin et al. (2021); Lu et al. (2022), they are not suited to compressing or increasing the density of the MOT. The successful implementation of a blue-detuned MOT using type II transition in Rb atoms is a good indication that this technique should work in molecules as well Jarvis et al. (2018). However, the close hyperfine splittings of molecule result in the interaction of one laser component with all energy levels, which makes it impossible to directly replicate the technique used in atomic MOT. Recently, the YO molecule’s distinctive energy level structure has enabled the successful implementation of a blue-detuned MOT Burau et al. (2023), in which the phase-space density is increased by two orders of magnitude. In this paper, we describe the utilization of Bayesian optimization to aid in the discovery of blue-detuned MOT schemes for CaF molecules. We have successfully developed two separate MOT schemes for the and DC MOT configurations that are capable of providing cooling within 5 m/s and trapping within a 3 mm radius. We also discovered a scheme that utilizes only two laser components to achieve a competative MOT force, which will simplify the experiment significantly. Monte-Carlo simulation with the MOT force results in a significant reduction in temperature and a corresponding increase in density, which can facilitate the transfer of a large number of molecules to conservative trap Langin et al. (2021); Lu et al. (2022); Williams et al. (2018); Anderegg et al. (2018); Wu et al. (2021); McCarron et al. (2018) and thus enhance the effects of subsequent cooling such as evaporative or sympathetic cooling Hess (1986); Anderson et al. (1995); Davis et al. (1995); Son et al. (2020); Wallis and Hutson (2009).
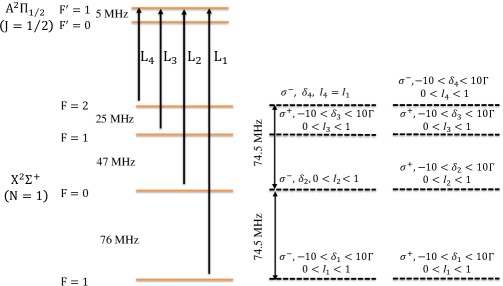
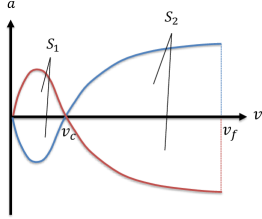
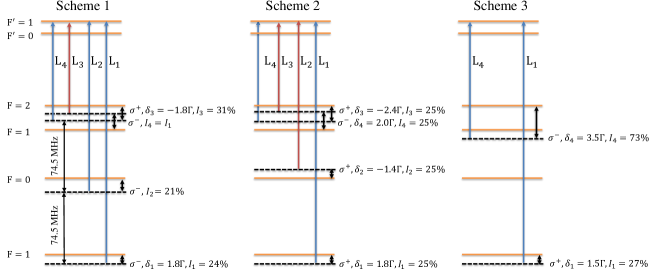
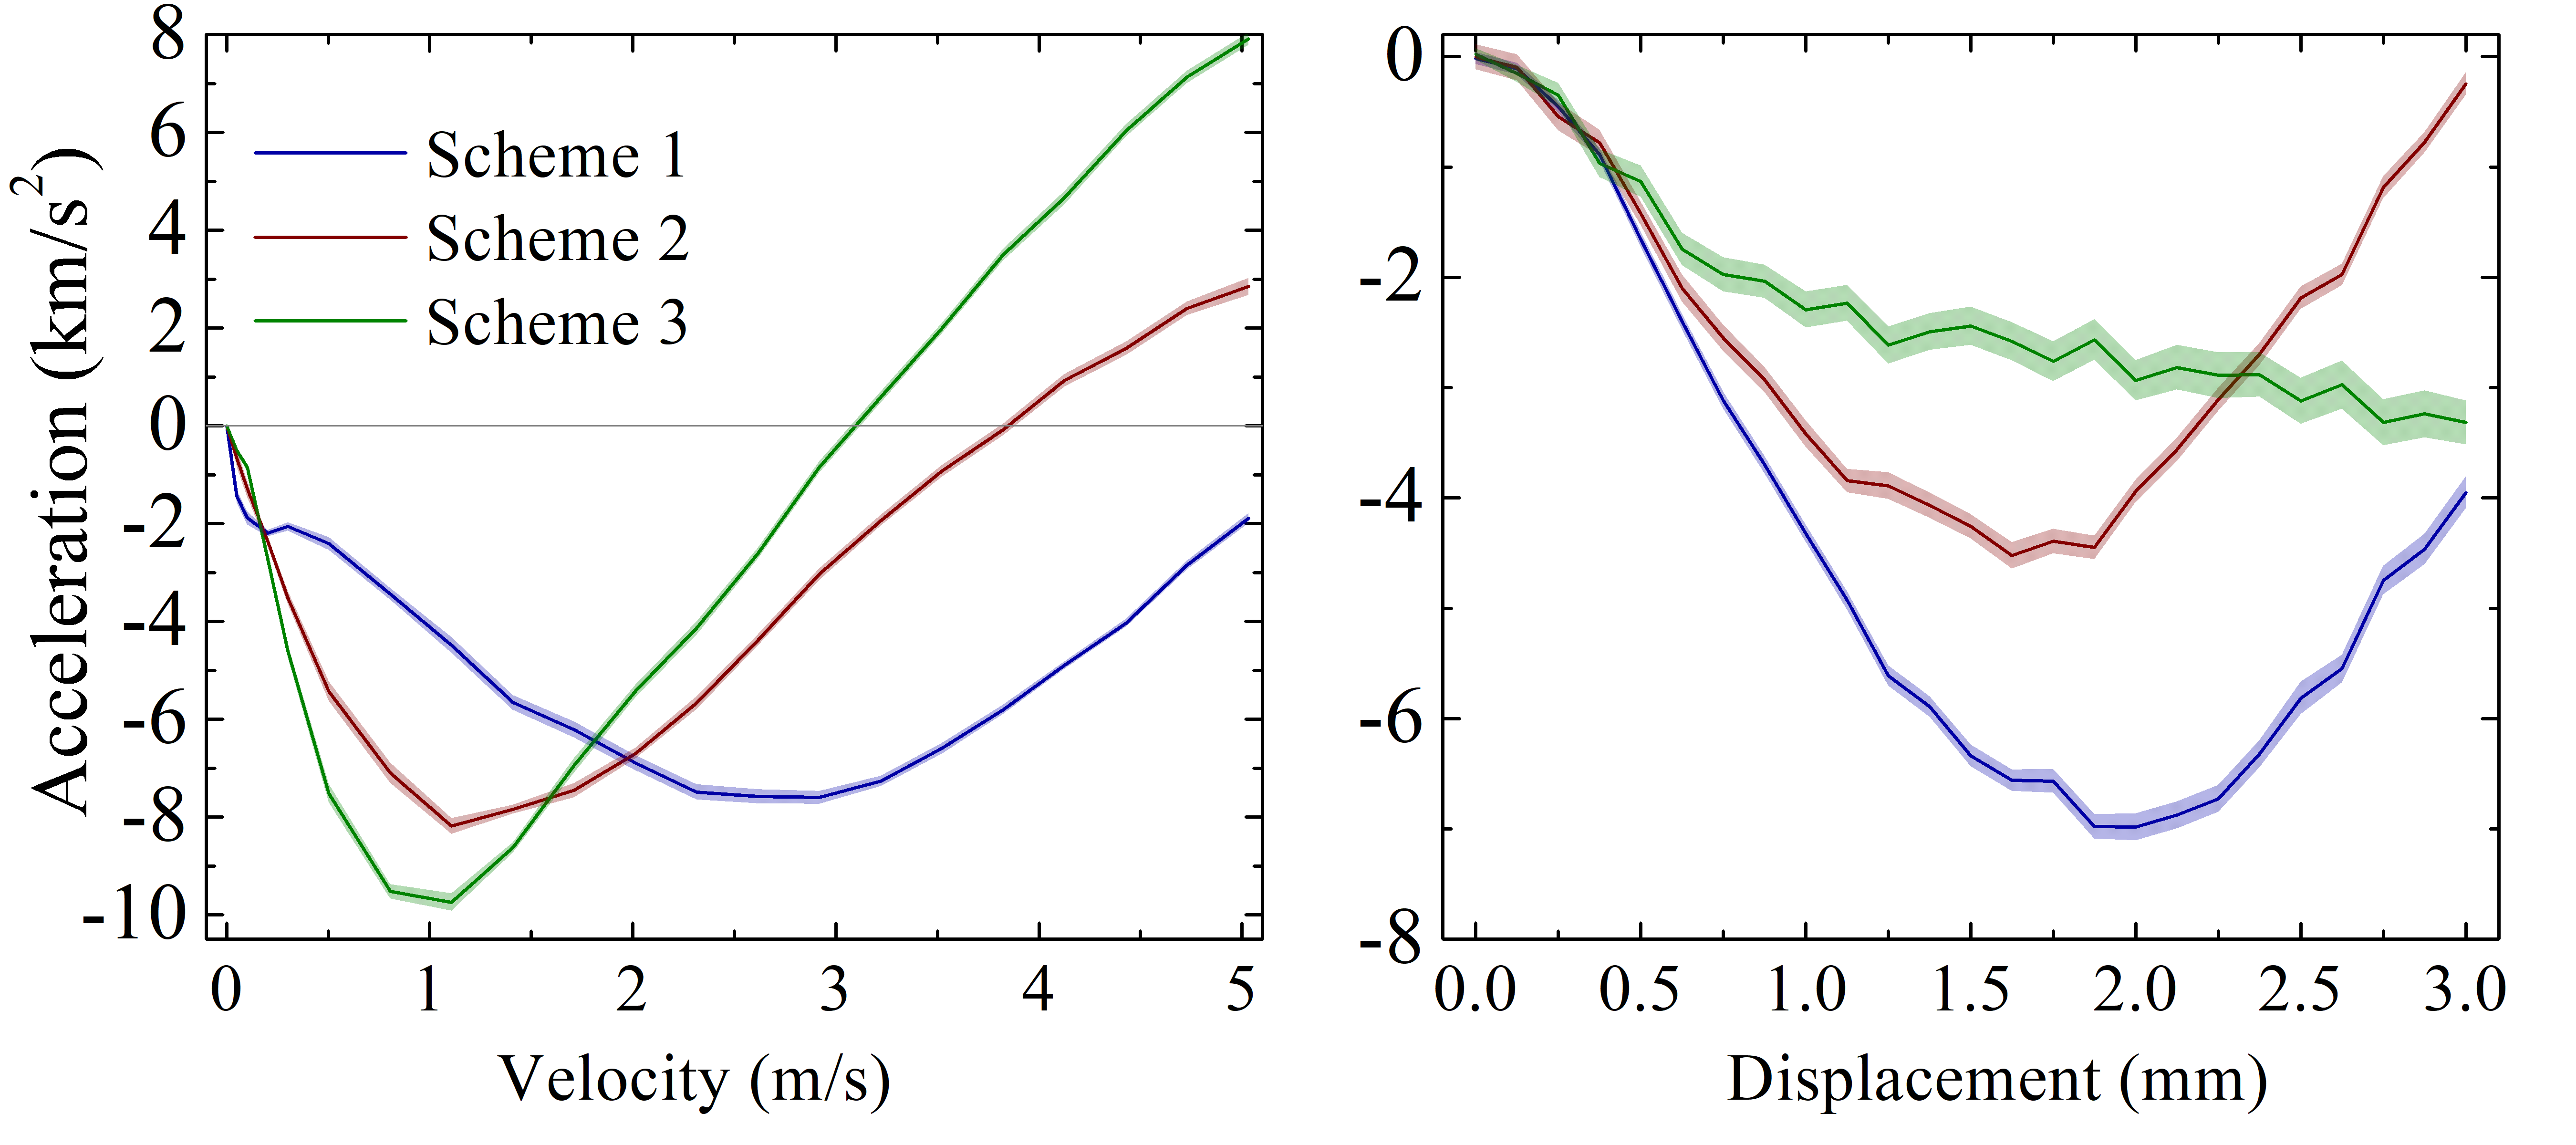
Fig. 1 shows the energy level structure of CaF molecule along with the parameters that require optimization. The ground state consists of four hyperfine states, namely F = 1, 0, 1 and 2, with corresponding energy splittings of 76 MHz, 47 MHz and 25 MHz, seperately. On the other hand, the excited state has only two hyperfine states, namely and 1, and the energy difference between them is set to 5 MHz Tarbutt and Steimle (2015). The dashed lines correspond to the four laser components that aim to target the four ground hyperfine states and the upward-pointing arrows indicate the transition to the excited state. Starting from the bottom, the four laser components are identified as and . Each of these components is associated with a specific polarization, detuning, and laser intensity ratio. To narrow down the parameter search space, we limit the polarization to and ( and denote that and have a polarization of and , respectively), since both of them are implemented in experiment Williams et al. (2017); Anderegg et al. (2017). The laser beam has a total power of 100 mW and a radius of 7.5 mm in all directions. The magnetic field gradient remains fixed at 15 G/cm. For configuration, we refer to the Williams et al. (2017) MOT scheme, in which a single laser modulated by an electric-optic modulator (EOM) generates the and laser components with a modulation frequency of 74.5 MHz. has a distinct polarization that is generated by an acousto-optic modulator (AOM). In total, we have five free parameters, as shown in the picture, with their tuning ranges. We attempted two different schemes for the configuration. The first scheme involved restricting the laser intensity ratio to be equal, resulting in four different detunings as the only free parameters. The second scheme included eight free parameters, which comprised the detunings and the laser intensity ratio.
Prior to beginning the optimization process, it is necessary to establish a clear goal for the program. This is because we must strike a balance between two types of MOT forces: the cooling force, which depends on velocity, and the trapping force, which is dependent on space. We initially anticipate a cooling acceleration curve similar to that shown in Fig. 2. This curve exhibits two distinct indications of force for red (blue) detuning: sub-Doppler heating (cooling) in the low velocity range, and Doppler cooling (heating) in the high velocity range. In order to quantify the effectiveness of cooling acceleration with a single value, we employ two integrals: and . These integrals are used to calculate a metric for the quality of cooling acceleration, represented as . We assign a weight of 10 to to highlight its significance, otherwise the program prefers to increasing the part instead of decreasing the part. The effectiveness of trapping acceleration is determined solely by the average value obtained within the range of 0 to 3 mm. We attempt to define the final goal for the program in two different ways. In the first approach, we optimize the program separately to attain the maximum cooling and trapping acceleration and . Then, we establish a final result of for the program to execute. Alternatively, in the second approach, we assign a dimensionless value of for the program to execute. After conducting multiple tests, we have determined that the second method yields better results and enables us to efficiently and consistently identify the optimal group of parameters.
In order to capture the sub-Doppler force of the MOT, we run the optical Bloch equations (OBEs) Devlin and Tarbutt (2018) for a sufficient amount of time until it reaches a quasi-steady state. We also select Julia as our simulation program to enhance the running speed. Bayesian optimization can be implemented using the Scikit-Optimize Python package, and can be called in a Julia environment using the PyCall package. Fig. 3 illustrates the blue-detuned MOT schemes we have found for CaF molecule. As we didn’t observe any significant improvement when using eight free parameters in the configuration, for experimental convenience, we only display the results obtained with equal laser intensity. It is evident that in the configuration, is detuned by with respect to the lower F = 1 to transition and has an intensity ratio of 24%. The detuning of and is dependent on the modulation frequency of 74.5 MHz and the energy splittings. has an intensity ratio of 21%, whereas the intensity of is equal to that of . is red detuned by relative to the upper F = 1 to transition and has an intensity of 31%. The corresponding acceleration curve is illustrated in Fig. 4, where we calculate the velocity-dependent force up to at the center of the MOT, and the space-dependent force along the z direction up to a distance of 3 mm, considering a velocity of 0.1 m/s. We observe that the cooling acceleration in Scheme 1 remains negative and strong up to 5 m/s, with a slight bump at 0.2 m/s. Concurrently, the trapping acceleration exhibits a persistent strength within the computed range. During our search process, we notice that the program consistently generates a strong MOT force even when the parameters fluctuate around the optimal values. This indicates the robutness of our results. Hence, for experimental convenience, it is possible to set the laser intensity equally on all four ground states, which should still yield satisfactory result. In the configuration, we observe a similar arrangement of detunings near the upper F=2 and F=1 states with minor deviations. Additionally, is switched from a blue detuning to a red one. The cooling force of Scheme 2 is more potent until 2 m/s and has a critical velocity of 3.8 m/s. However, we find that Scheme 2 has a peak trapping acceleration that is 64% of that in Scheme 1. During our search process, we noticed that even using a small laser intensity for the and laser components, a strong cooling and trapping force can still be achieved. This observation motivated us to explore a search with only two laser components, namely and , along with free detunings and laser intensity ratio. Scheme 3 represents the optimal result we discovered. It’s different from the -enhanced cooling Cheuk et al. (2018) where equal detunings and laser intensity are used for and laser. Additionally, we verified that -enhanced cooling scheme is unable to provide a trapping force. Scheme 3 exhibits the strongest cooling force within the range of 2 m/s and has a critical velocity of 3.1 m/s. Additionally, we observe that the trapping acceleration slope near the MOT center tends to be zero for all the optimal schemes we have identified.
Finally, we make a 3D Monte-Carlo simulation Xu et al. (2022) with the calculated MOT force for a total of molecules with a uniform velocity distribution within 1 m/s and a uniform distribution of molecules within a radius of 3 mm. Scheme 1 yields a MOT temperature of and a density of , while Scheme 2 produces a temperature of and a density of . Scheme 3 achieves the lowest temperature of with a density of . By reducing the laser power and increasing the field gradient, it should be possible to further improve the system and achieve a temperature as low as several Jarvis et al. (2018) while increasing the density even further. This would provide an ideal starting point for transferring a large number of molecules to a conservative trap.
In conclusion, we have presented a general approach for designing a CaF moleculer MOT using Bayesian optimization. Our study has yielded three blue-detuned MOT configurations capable of achieving sub-Doppler cooling within 5 m/s and trapping within 3 mm. Monte-Carlo simulations demonstrate that our MOT schemes can achieve a temperature as low as and a density as high as . Our methodology is not limited to CaF molecules but can be adapted to other laser-cooled molecules with varying energy level structures to improve their molecular MOT design.
Acknowledgements
This work was supported by the Innovation Program for Quantum Science and Technology (Grant Nos. 2021ZD0300500 and 2021ZD0300503). Y. Xia greatfully acknowledge the finacial support from the National Natural Science Foundation of China under Grant Nos. 11834003 and 91836103. M. Siercke and S. Ospelkaus gratefully acknowledge financial support through Germany’s Excellence Strategy – EXC-2123/1 QuantumFrontiers.
References
- Xu et al. (2022) S. Xu, P. Kaebert, M. Stepanova, T. Poll, M. Siercke, and S. Ospelkaus, “Engineering the sub-doppler force in magneto-optical traps,” Phys. Rev. Res. 4, L042036 (2022).
- Devlin and Tarbutt (2016) J A Devlin and M R Tarbutt, “Three-dimensional doppler, polarization-gradient, and magneto-optical forces for atoms and molecules with dark states,” New Journal of Physics 18, 123017 (2016).
- Devlin and Tarbutt (2018) J. A. Devlin and M. R. Tarbutt, “Laser cooling and magneto-optical trapping of molecules analyzed using optical bloch equations and the fokker-planck-kramers equation,” Phys. Rev. A 98, 063415 (2018).
- Williams et al. (2017) H J Williams, S Truppe, M Hambach, L Caldwell, N J Fitch, E A Hinds, B E Sauer, and M R Tarbutt, “Characteristics of a magneto-optical trap of molecules,” New Journal of Physics 19, 113035 (2017).
- Anderegg et al. (2017) Loïc Anderegg, Benjamin L. Augenbraun, Eunmi Chae, Boerge Hemmerling, Nicholas R. Hutzler, Aakash Ravi, Alejandra Collopy, Jun Ye, Wolfgang Ketterle, and John M. Doyle, “Radio frequency magneto-optical trapping of caf with high density,” Phys. Rev. Lett. 119, 103201 (2017).
- Barry et al. (2014) J. F. Barry, D. J. McCarron, E. B. Norrgard, M. H. Steinecker, and D. DeMille, “Magneto-optical trapping of a diatomic molecule,” Nature 512, 286–289 (2014).
- Collopy et al. (2018) Alejandra L. Collopy, Shiqian Ding, Yewei Wu, Ian A. Finneran, Loïc Anderegg, Benjamin L. Augenbraun, John M. Doyle, and Jun Ye, “3d magneto-optical trap of yttrium monoxide,” Phys. Rev. Lett. 121, 213201 (2018).
- Truppe et al. (2017) S. Truppe, H. J. Williams, M. Hambach, L. Caldwell, N. J. Fitch, E. A. Hinds, B. E. Sauer, and M. R. Tarbutt, “Molecules cooled below the doppler limit,” Nature Physics 13, 1173–1176 (2017).
- Caldwell et al. (2019) L. Caldwell, J. A. Devlin, H. J. Williams, N. J. Fitch, E. A. Hinds, B. E. Sauer, and M. R. Tarbutt, “Deep laser cooling and efficient magnetic compression of molecules,” Phys. Rev. Lett. 123, 033202 (2019).
- Cheuk et al. (2018) Lawrence W. Cheuk, Loïc Anderegg, Benjamin L. Augenbraun, Yicheng Bao, Sean Burchesky, Wolfgang Ketterle, and John M. Doyle, “-enhanced imaging of molecules in an optical trap,” Phys. Rev. Lett. 121, 083201 (2018).
- Ding et al. (2020) Shiqian Ding, Yewei Wu, Ian A. Finneran, Justin J. Burau, and Jun Ye, “Sub-doppler cooling and compressed trapping of yo molecules at temperatures,” Phys. Rev. X 10, 021049 (2020).
- Langin et al. (2021) Thomas K. Langin, Varun Jorapur, Yuqi Zhu, Qian Wang, and David DeMille, “Polarization enhanced deep optical dipole trapping of -cooled polar molecules,” Phys. Rev. Lett. 127, 163201 (2021).
- Lu et al. (2022) Yukai Lu, Connor M. Holland, and Lawrence W. Cheuk, “Molecular laser cooling in a dynamically tunable repulsive optical trap,” Phys. Rev. Lett. 128, 213201 (2022).
- Jarvis et al. (2018) K. N. Jarvis, J. A. Devlin, T. E. Wall, B. E. Sauer, and M. R. Tarbutt, “Blue-detuned magneto-optical trap,” Phys. Rev. Lett. 120, 083201 (2018).
- Burau et al. (2023) Justin J. Burau, Parul Aggarwal, Kameron Mehling, and Jun Ye, “Blue-detuned magneto-optical trap of molecules,” Phys. Rev. Lett. 130, 193401 (2023).
- Williams et al. (2018) H. J. Williams, L. Caldwell, N. J. Fitch, S. Truppe, J. Rodewald, E. A. Hinds, B. E. Sauer, and M. R. Tarbutt, “Magnetic trapping and coherent control of laser-cooled molecules,” Phys. Rev. Lett. 120, 163201 (2018).
- Anderegg et al. (2018) Loïc Anderegg, Benjamin L. Augenbraun, Yicheng Bao, Sean Burchesky, Lawrence W. Cheuk, Wolfgang Ketterle, and John M. Doyle, “Laser cooling of optically trapped molecules,” Nature Physics 14, 890–893 (2018).
- Wu et al. (2021) Yewei Wu, Justin J. Burau, Kameron Mehling, Jun Ye, and Shiqian Ding, “High phase-space density of laser-cooled molecules in an optical lattice,” Phys. Rev. Lett. 127, 263201 (2021).
- McCarron et al. (2018) D. J. McCarron, M. H. Steinecker, Y. Zhu, and D. DeMille, “Magnetic trapping of an ultracold gas of polar molecules,” Phys. Rev. Lett. 121, 013202 (2018).
- Hess (1986) Harald F. Hess, “Evaporative cooling of magnetically trapped and compressed spin-polarized hydrogen,” Phys. Rev. B 34, 3476–3479 (1986).
- Anderson et al. (1995) M. H. Anderson, J. R. Ensher, M. R. Matthews, C. E. Wieman, and E. A. Cornell, “Observation of bose-einstein condensation in a dilute atomic vapor,” Science 269, 198–201 (1995).
- Davis et al. (1995) K. B. Davis, M. O. Mewes, M. R. Andrews, N. J. van Druten, D. S. Durfee, D. M. Kurn, and W. Ketterle, “Bose-einstein condensation in a gas of sodium atoms,” Phys. Rev. Lett. 75, 3969–3973 (1995).
- Son et al. (2020) Hyungmok Son, Juliana J. Park, Wolfgang Ketterle, and Alan O. Jamison, “Collisional cooling of ultracold molecules,” Nature 580, 197–200 (2020).
- Wallis and Hutson (2009) Alisdair O. G. Wallis and Jeremy M. Hutson, “Production of ultracold nh molecules by sympathetic cooling with mg,” Phys. Rev. Lett. 103, 183201 (2009).
- Tarbutt and Steimle (2015) M. R. Tarbutt and T. C. Steimle, “Modeling magneto-optical trapping of caf molecules,” Phys. Rev. A 92, 053401 (2015).