Leveraging LLMs for KPIs Retrieval from Hybrid Long-Document: A Comprehensive Framework and Dataset
Abstract
Large Language Models (LLMs) demonstrate exceptional performance in textual understanding and tabular reasoning tasks. However, their ability to comprehend and analyze hybrid text, containing textual and tabular data, remains underexplored. In this research, we specialize in harnessing the potential of LLMs to comprehend critical information from financial reports, which are hybrid long-documents. We propose an Automated Financial Information Extraction (AFIE) framework that enhances LLMs’ ability to comprehend and extract information from financial reports. To evaluate AFIE, we develope a Financial Reports Numerical Extraction (FINE) dataset and conducte an extensive experimental analysis. Our framework is effectively validated on GPT-3.5 and GPT-4, yielding average accuracy increases of 53.94% and 33.77%, respectively, compared to a naive method. These results suggest that the AFIE framework offers accuracy for automated numerical extraction from complex, hybrid documents.
1 Introduction
Large Language Models (LLMs) have exhibited remarkable capabilities in various natural language tasks, demonstrating their potential to comprehend and process intricate textual data Wei et al. (2023a); Wang et al. (2023b); Zhou et al. (2022); Kojima et al. (2023). In addition to their success in textual data, the study by Chen (2023) highlights the effectiveness of LLMs in handling tabular data. However, despite their proven proficiency in understanding and analyzing both textual and tabular data individually, research exploring the capacity of LLMs to tackle hybrid documents, which combine these two types of data, remains relatively scarce.
Hybrid documents, adeptly blending textual and tabular content, convey information in a highly sophisticated and effective manner. They are widely used across diverse fields such as scientific research papers, medical reports, and financial reports. Among these, financial reports are a quintessential example of hybrid documents, distinguished by their intricate structure and the sheer volume of numerical data interspersed within text and tables. They play a crucial role in providing comprehensive insights for businesses and investors Brito et al. (2019); Krause and Arora (2008), making them particularly noteworthy among various types of hybrid documents.
In order to investigate the potential of LLMs in extracting and understanding information from hybrid documents, we design a task focused on Key Performance Indicator (KPI)-related information extraction from financial reports. Existing methods attempting to address this challenge face several limitations, such as inflexible rule-based named entity recognition methods, a focus on structured data, and input token constraints that hinder comprehensive examination of financial reports Farmakiotou et al. (2000a); Brito et al. (2019); Chen et al. (2022); Zhu et al. (2021); Zhao et al. (2022).
To address the challenges in extracting KPIs from financial reports, we propose the Automatic Financial Information Extraction (AFIE) framework, a comprehensive approach that leverages LLMs. The AFIE framework comprises four main modules—Segmentation, Retrieval, Summarization, and Extraction—working in synergy to efficiently extract keyword-corresponding values from financial reports. With its carefully designed modules, AFIE exhibits three key features: 1) efficiently handling long documents, 2) resolving ambiguity in keyword representation, and 3) demonstrating sensitivity to numerical values, effectively tackling the challenges of KPI-related information extraction from financial reports. Our contributions can be summarized as follows:
-
1.
We propose a comprehensive framework for Automatic Financial Information Extraction (AFIE) designed to extract KPIs from financial reports. The AFIE framework comprises four main modules—Segmentation, Retrieval, Summarization, and Extraction—aimed at efficiently extracting keyword-corresponding values from financial reports using LLMs.
-
2.
To evaluate the extraction accuracy of LLMs, we introduce the Financial Reports Numerical Extraction (FINE) dataset. Rigorous quality control measures have been implemented to ensure the accuracy and relevance of each individual example. The FINE dataset can be utilized to assess the performance of LLMs in extracting information from financial documents.
-
3.
Experimental results derived from GPT series models reveal that AFIE significantly enhances LLMs’ ability to understand and extract information from hybrid documents. Additionally, we perform ablation studies to assess the impact of different AFIE components, including table serialization formats, summarization methods, and prompt engineering approaches. These studies offer insights into the effectiveness of each component, guiding further improvements to the AFIE framework.
2 Background
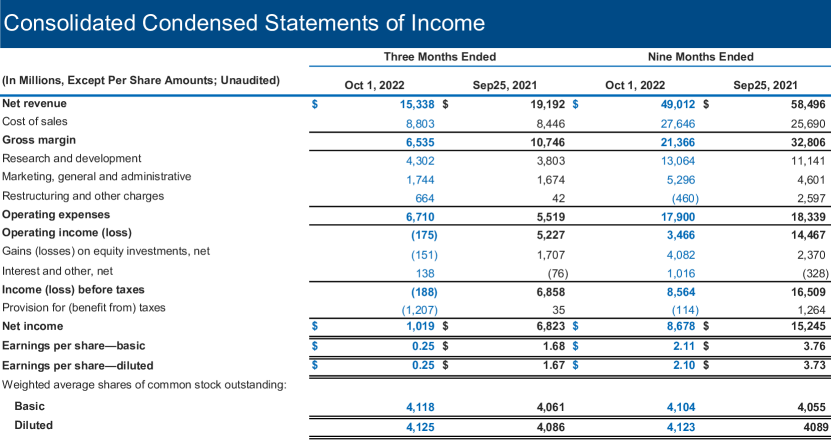
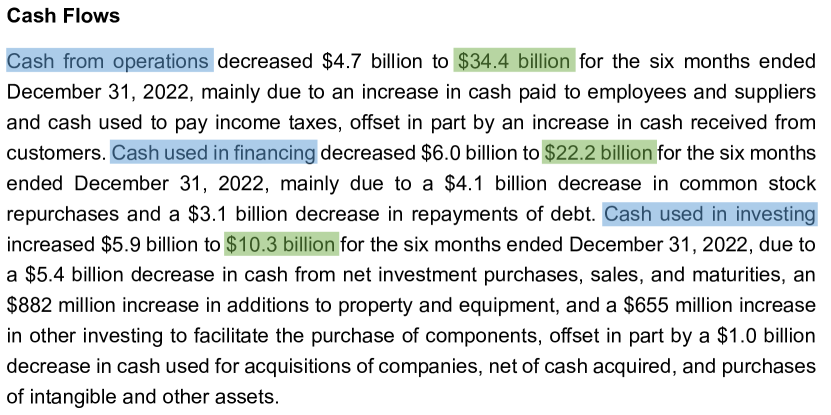
This section outlines the tabular and textual structure of financial reports, the selection strategy of keywords and the definition of keyword ambiguity. Companies listed with the US Securities and Exchange Commission (SEC) are required to regularly submit financial reports to the EDGAR database111https://www.sec.gov/edgar/, including annual reports (referred to as 10-K) and quarterly reports (referred to as 10-Q), among others. Within a fiscal year (FY), a company’s financial reports consist of three quarterly financial reports and one annual financial report. Figure 5 displays a table from Intel’s Q3 FY2022 financial report, where data in parentheses generally indicates negative values. Furthermore, general financial report tables usually encompass values from the preceding one or two years. Additionally, Figure 6 illustrates the textual description of cash flows in Microsoft’s Q2 FY2022 financial report.
In selecting benchmark keywords, we primarily consider their importance within the financial context. To this end, we consult the websites of two reputable organizations, namely MSN Money222https://www.msn.com/en-us/money and Google Finance333https://www.google.com/finance/, each of which showcases a subset of KPI data from annual and quarterly financial reports. We performed an intersection analysis on the essential keywords presented on these websites, employing a set of filtering criteria such as keyword ambiguity, keyword distribution (their presence in hybrid text), and the complexity of directly extracting keyword values from financial reports. We identified a final set of 9 keywords (as presented in Table 8) for further evaluation.
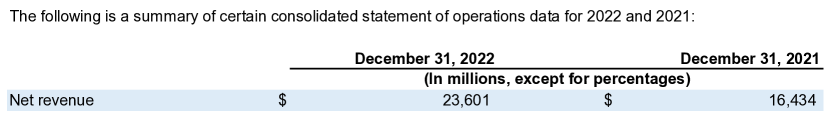
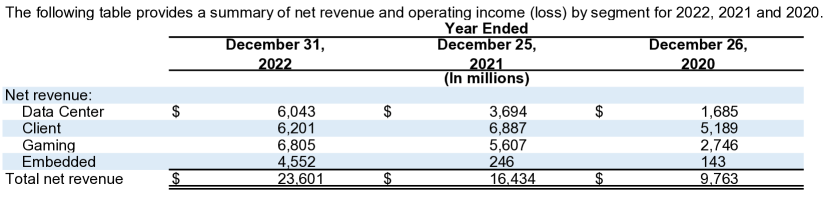
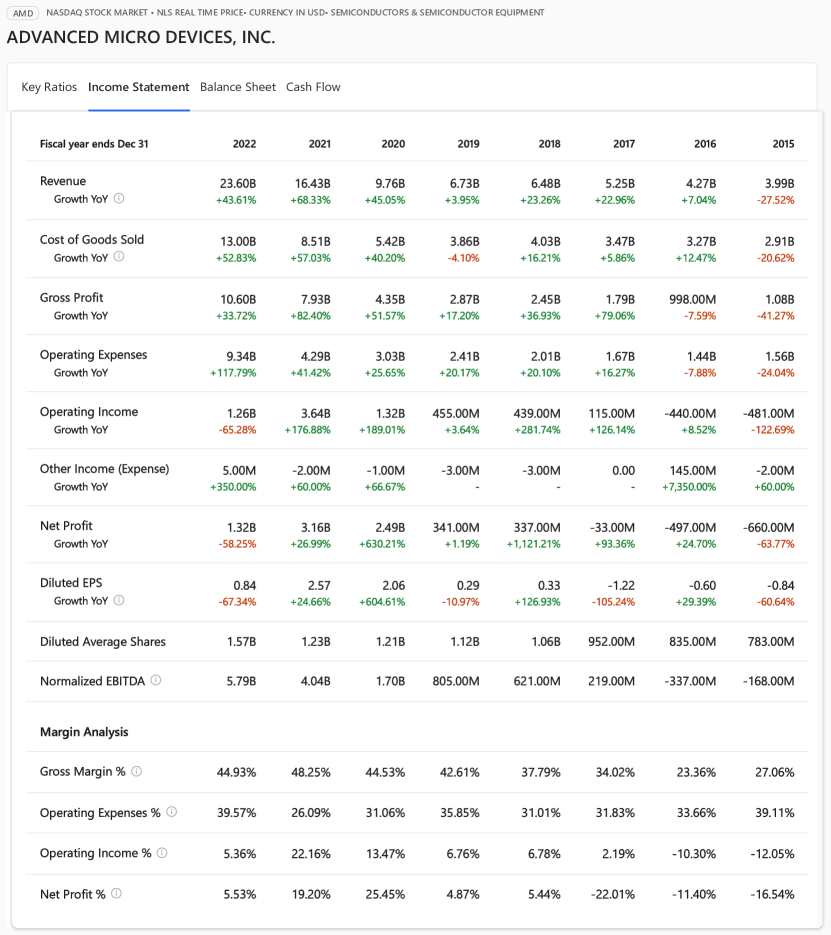
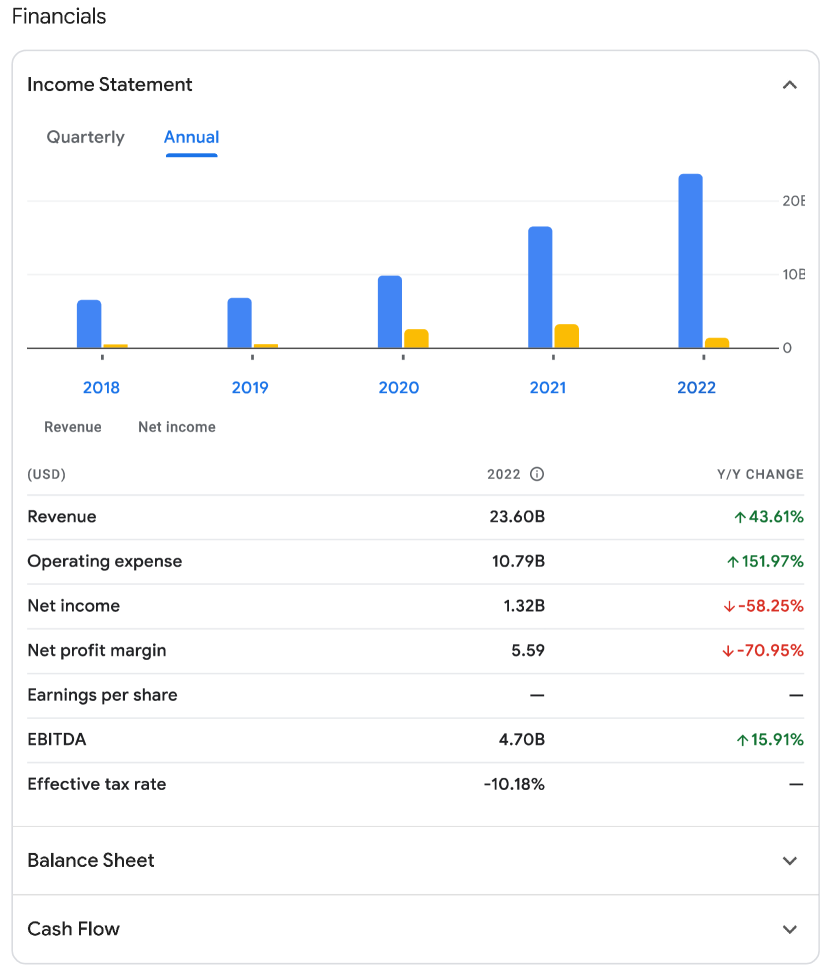
Figure 7 and 8 respectively illustrate the keywords Net Revenue and Total Net Revenue as they appear in AMD’s financial reports. Notably, these terms correspond to the Revenue depicted in Figures 9 and 10 on the two aforementioned websites, since they are numerically equivalent. Financial reports from different companies may employ varying expressions to convey the same keywords. Table 9 demonstrates the Revenue representation for distinct companies, exemplifying this phenomenon. We refer to this situation as keyword ambiguity in financial reports. We record the ambiguous expressions of all keywords across various companies in FINE.
3 Method
3.1 Framework: AFIE
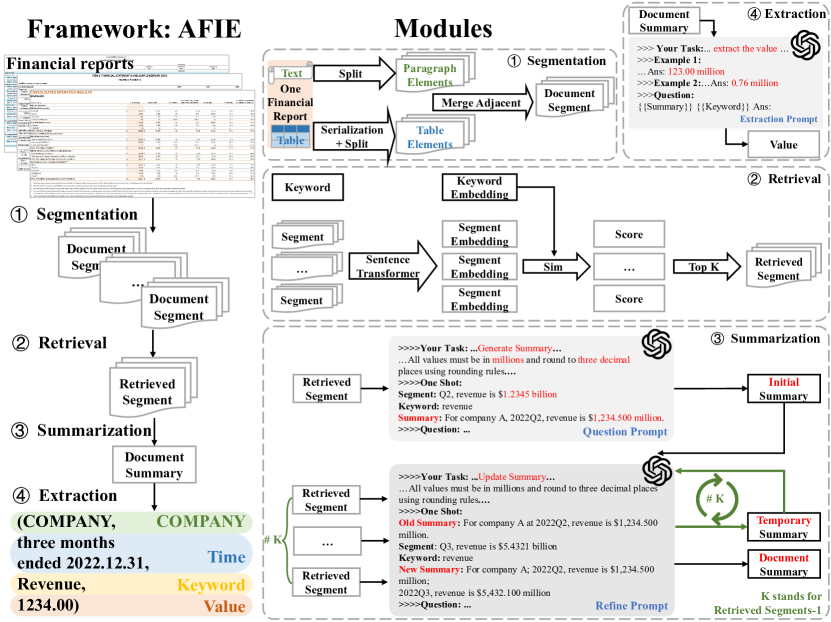
To reveal the LLMs’ capability in understanding hybrid information within financial reports, we introduce a framework aimed at extracting KPI-related information from these reports, referred to as the Automated Financial Information Extraction (AFIE) framework. The KPI-related information extraction involves automatically extracting user-specified performance metrics from financial reports. As depicted in Figure 1, AFIE consists of four main modules: Segmentation, Retrieval, Summarization, and Extraction.
-
•
Segmentation: The Segmentation module addresses the challenge of processing lengthy financial documents, which often contain a large number of tokens, exceeding the capacity that LLMs can handle. By dividing long documents into shorter segments, we enable the efficient processing of such documents with LLMs in subsequent steps.
-
•
Retrieval: In the Retrieval module, we focus on selecting the most relevant document segments related to a specific keyword from the entire set of available segments. This step is crucial for improving the accuracy and efficiency of information extraction.
-
•
Summarization: The Summarization module leverages LLMs to extract relevant information from the retrieved document segments and generates a concise summary containing the essential details associated with the given keyword. This step aids in compressing and consolidating critical information from the document segments.
-
•
Extraction: The Extraction module utilizes the power of LLMs to accurately extract the keyword-corresponding value from the generated summary, streamlining downstream tasks such as data analysis and statistics by providing the extracted value directly.
3.2 Segmentation
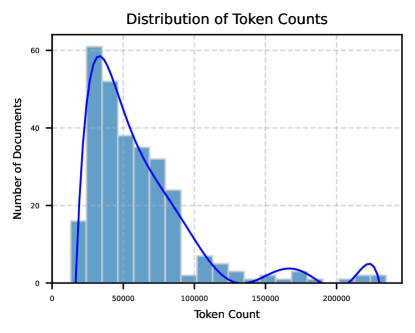
Although LLMs have significantly increased the sequence length they can handle compared to traditional models, such as text-davinci-003 with a capacity of 4096 tokens, financial reports and other long documents often contain a much larger number of tokens. Table 1 and Figure 11 illustrate the distribution of token counts in our dataset, with an average token count of 59,464 per document. To address this challenge, we employ a segmentation module to divide the document into smaller segments that LLMs can handle, with each segment being smaller than the LLMs’ maximum sequence length (not equal to this length, as prompt engineering and LLMs’ output also require a certain sequence length).
The segmentation module in Figure 1 depicts our segmentation process, which consists of three steps: Serialization, Split and Merge. These steps are explained in detail below:
-
•
Serialization: Serialize tables into text. In financial report data, the majority of the information is concentrated within tables. However, LLMs are primarily text-based models, so we need a method to serialize tables into text. We compared various serialization methods, such as PLAIN, CSV, XML, and HTML, and found that PLAIN serialization is the most effective for our task. This method uses spaces to separate different cells and newline characters to separate different rows, providing a simple yet efficient representation of table data. After serialization, tables are treated like regular paragraphs in the document, allowing LLMs to seamlessly process both paragraph and table elements.
-
•
Split: Split too long elements. In financial reports and other lengthy documents, there may be exceptionally long elements, such as large tables and extensive paragraphs, which exceed the processing capacity of LLMs. To enable LLMs to handle such elements and avoid information loss, we need to split them. We first determine the element length limit based on the LLM’s maximum sequence length. For example, text-davinci-003 is constrained to 4k tokens, so we set the element length to 2k. We then split the overlength paragraphs and tables into smaller sub-elements: for paragraphs with tokens exceeding the limit, we split them into several sub-paragraphs with lengths smaller than the limit, without overlapping. For tables with lengths exceeding the limit, we fix the table header as the first row and divide the remaining rows into several sub-tables, each of which is concatenated with the header. The divided paragraphs and tables replace the original overlength elements.
-
•
Merge: Merge adjacent elements. Although some elements are very long, most elements have a small token count (tens of tokens). Moreover, adjacent elements may have semantic relationships. To ensure the integrity of semantic information, we concatenate the elements in the order they appear in the document. We first determine the segment size. We then employ a greedy approach to concatenate elements into segments: as long as the segment’s length does not exceed the limit, we add the next element to the segment.
3.3 Retrieval
As discussed earlier, long texts contain many tokens, leading to a large number of document segments. Processing all document segments would significantly increase the number of LLMs invocations. Therefore, we need a method to filter the most relevant document segments before processing. The embedding-based retrieval strategy Li et al. (2021) has been proven to be a popular and effective method for this purpose. As shown in the Retrieval module of Figure 1, we calculate the similarity between each document segment and the keyword based on their embeddings and retrieve the top-ranked segments with the highest similarity scores.
Similarity Calculation. To obtain the embeddings of document segments and keywords, we use an embedding model called SentenceTransformer Reimers and Gurevych (2019). However, the sequence length that SentenceTransformer can handle is smaller than the length of the document segments (determined by LLMs’ sequence length). Therefore, we divide the document segments into multiple slices and calculate the similarity between each slice and the keyword. Then, we take the maximum similarity value as the similarity between the document segment and the keyword.
After obtaining the similarity scores between each segment and the keyword, we select the top-ranked segments with the highest scores for further processing.
3.4 Summarization
In the context of long texts, the content related to the keyword is often distributed across various recalled segments. To effectively extract and concentrate this information, it is necessary to apply a summarization technique. Summarization aims to utilize LLMs to generate a coherent summary containing relevant information extracted from the selected segments associated with the key word.
Since LLMs can only process one segment per invocation, it is essential to develop a strategy to connect different segments effectively. To address this challenge, we propose the Refine Strategy. The Refine Strategy is designed to maintain an evolving summary where each segment contributes to its update using LLMs.
The process of the Refine Strategy consists of two main steps, as illustrated in the Summarization module of Figure 1. The first step in the Refine Strategy involves using the Question prompt when invoking the LLM. This generates an initial summary by guiding the LLM to extract information related to the key word from the first segment. In the subsequent step, the Refine prompt is employed to update the summary. This is done by directing the LLM to incorporate information from the remaining segments into the existing summary. The specific prompt templates used in this process can be found in Appendix C.1.
3.5 Extraction
After the summarization process, we obtain a summary that contains the required information. However, the summary also includes a considerable amount of additional information besides the desired value. In order to reduce the computational burden, eliminate irrelevant information, and improve the accuracy and efficiency of downstream tasks, it becomes essential to filter the keyword’s corresponding numerical value from the final summary.
To achieve this, we use LLMs once again to extract the value from the summary, as illustrated in the Extraction module of Figure 1. The prompt used in this extraction process can be found in Appendix C.3. Leveraging the power of few-shot learning, LLMs can accurately filter the necessary numerical value. Recent advances in few-shot learning have demonstrated the effectiveness of this approach in various NLP tasks, which reinforces the feasibility of our method Wei et al. (2023a).
3.6 Prompt Engineering
As existing research Polak et al. (2023); Polak and Morgan (2023) has demonstrated, Prompt Engineering is crucial for LLMs in order to improve the accuracy of extracting numerical values from financial reports. Different prompts can significantly influence the performance of LLMs. To effectively utilize LLMs for information extraction, we have designed and improved prompts in the following aspects:
-
•
Numerical Precision Enhancement: In handling numerical values, LLMs tend to struggle with accurately preserving the precision of the values. For instance, the original text may present values in millions, but LLMs might return values in billions. Inspired by studies on Prompt Engineering, we attempt to include precision control instructions in the prompt to guide the model in generating more accurate responses while maintaining the desired level of numerical precision. Specifically, we designed and used two precision-enhancing prompts simultaneously: Direct and Shot-Precision. The Direct method directly informs LLMs of the required precision, while the Shot-Precision method demonstrates how to manage precision omission through examples. More details on these numerical precision enhancement methods can be found in Section 5.4 and Appendix C.4.
-
•
Keyword Completion: When dealing with financial reports and other long documents, the keywords provided by users might not be complete. For example, users might inquire about Revenue or Net Income, but in financial reports, the same keyword might correspond to multiple entities (such as different subsidiaries or time periods). To address this issue, we introduce a keyword completion method. Keyword completion can help us better understand the user’s query intent, thus extracting more accurate information. It also aids in handling relationships between entities and contexts to ensure that the required information is extracted from the correct entity. To implement keyword completion, we use the document’s metadata to complete the user’s incomplete keywords. In our method, we take the company name, time, and attribute as complete keywords, such as "COMPANY NAME", "2022 Q2", and "Revenue". In this way, keyword completion in financial reports can more accurately find the information users need, thereby improving LLMs performance. In the experiment, we will compare different forms of keywords to evaluate the impact of keyword completion on LLMs performance.
4 Experiment
4.1 Dataset
To enhance reproducibility and support future research endeavors, we introduce FINE, a dataset comprising manually extracted financial data from publicly accessible sources, SEC’s EDGAR. We amassed reports from 18 companies, 10-K and 10-Q reports for the four-year fiscal period spanning 2019 to 2022. These companies were categorized into four groups based on their operational domains and product offerings: technology, retail, financial services, and food and beverage. We manually identified pertinent keywords and extracted values that depict company performance and projections. We trained several individuals to assemble this dataset, with each data point being labeled by four people to minimize labeling errors. In our dataset, all ground truth values are represented as a tuple of four elements: (company, time, key word, value). This tuple denotes the value corresponding to a specific keyword for a given company at a specified time. For example, (COMPANY, three months ended 2022.12.31, Revenue, 12345.00) indicates that COMPANY’s Revenue for the three months ending on December 31, 2022, is $ 12,345.00 million. All ground truth values, expressed in millions and rounded to two decimal places using conventional rounding techniques, provide the most prevalent and precise representation in financial reports.
| # Companies | 18 |
| # Financial reports | 288 |
| # 10-K financial reports | 72 |
| # 10-Q financial reports | 216 |
| # Examples | 3,625 |
| Max # tokens in all inputs | 234,900 |
| Avg. # tokens in all inputs | 59,464.3 |
| Min # tokens in all inputs | 13,022 |
The basic statistics of FINE are presented in Table 1, which encompasses 3,625 examples. In the FINE dataset, we systematically document the following information concerning selected companies and keywords: 1) data presented in tuple form, 2) ambiguity in keywords, and 3) the occurrence of the information exclusively in tables or in both text and tables.
4.2 Evaluation Metrics - Relative Error Tolerance Accuracy (RETA)
As mentioned earlier, in our dataset, all ground truth values are presented in millions, rounded to two decimal places using the conventional rounding method. However, in financial reports, the data may not be entirely precise, as the values can be expressed in millions or billions, and the level of granularity may vary across different sources or presentation formats. For instance, most data in the tables are in millions, while many data points in the text are in billions.
To address this issue, we introduce the Relative Error Tolerance Accuracy (RETA) method, which allows for a more forgiving evaluation by considering predictions as correct if their relative error falls within a specified tolerance threshold (e.g., RETA 5% means predictions with a relative error of no more than 5% are considered correct). This approach enables us to better capture the model’s performance in real-world scenarios where the data might not always be represented with perfect consistency and precision. By setting different RETA levels, we can assess the model’s performance according to various practical requirements and gain a more comprehensive understanding of its capabilities in extracting information from financial documents.
Unless otherwise specified, all experimental results presented in this paper represent the average accuracy across all companies under a specific RETA setting.
4.3 LLMs and Parameter Settings
Model: In our experiments, we choose the latest GPT-3.5 model, text-davinci-003, and GPT-4 as our primary subjects for analysis. However, due to the high computational cost of GPT-4, we focus mainly on text-davinci-003 and only use GPT-4 for critical experiments to validate the effectiveness and applicability of our proposed method. Unless otherwise specified, text-davinci-003 and GPT-4 use the same parameter configurations in our experiments. Based on these models, the detailed parameter configurations in our method are as follows:
-
•
Token Allocation: We allocate tokens to accommodate the model’s maximum sequence length and the requirements of each AFIE module. The token allocations for text-davinci-003 and GPT-4 are presented in the table below:
Alloc. GPT-3.5 GPT-4 Max Seq. Length 4,096 32,768 Doc. Elem. 2,000 25,000 Doc. Seg. 2,500 25,000 Keyword 50 50 Summary 500 5,000 Table 2: Token allocation for text-davinci-003 and GPT-4 -
•
Prompts: As prompts play a crucial role in LLMs performance, we use three different prompts in our method: question prompt, refine prompt, and extraction prompt. To save on the experimental cost of GPT-4, we ask for multiple keywords in a single query for GPT-4. Therefore, we have designed a separate extraction prompt specifically for GPT-4. All other prompts remain the same for both models. For details on the prompts, please refer to Appendix C.
-
•
Table Serialization: We use the PLAIN serialization for tables, which presents data in a simple and readable manner without any special formatting. The choice of PLAIN serialization is supported by our ablation study presented later in Subsection 5.1.
-
•
Retrieval Settings: During the retrieval step, we select the top three document segments with the highest similarity scores for text-davinci-003. The choice of retrieving three segments is supported by our ablation study presented later in 5.3. However, for GPT-4, due to its significantly larger token handling capacity compared to text-davinci-003, the majority of documents have no more than three document segments. As a result, we do not use the retrieval strategy for GPT-4.
-
•
Embedding Model: We use the sentence-transformers/all-mpnet-base-v2444https://www.sbert.net/docs/pretrained_models.html model for computing embeddings. This model can handle a sequence length of 384 tokens. Therefore, we set the maximum length of segment slices to 384 tokens as well.
4.4 Experiment Results
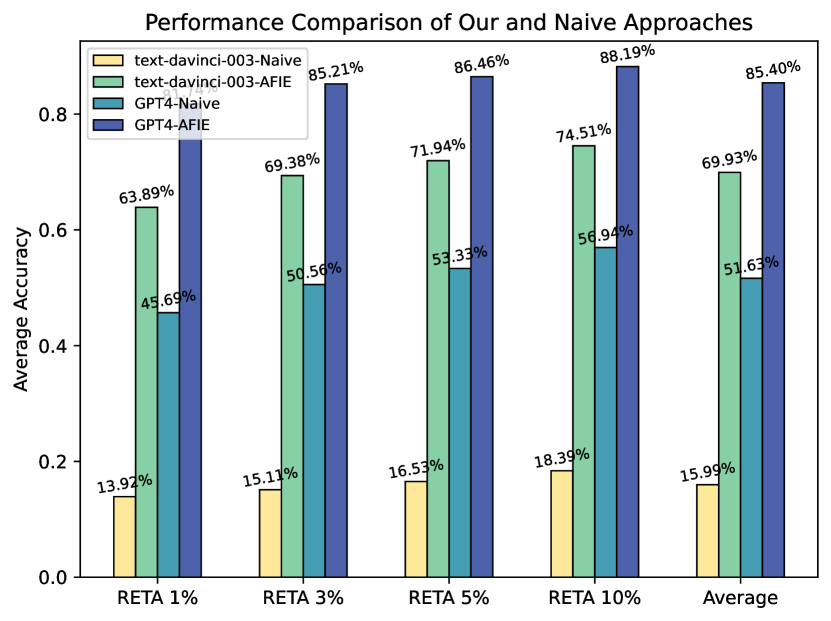
The Figure 2 displays the experimental results of our proposed method, AFIE, on both text-davinci-003 and GPT-4, in comparison with the naive approaches. It shows the accuracy results of both the naive methods and our proposed method (AFIE) at different RETA levels, ranging from 1% to 10%, as well as the average accuracy across all RETA settings. In the figure, ‘text-davinci-003-Naive’ and ‘GPT4-Naive’ represent the naive approach applied to text-davinci-003 and GPT-4, respectively. Meanwhile, ‘text-davinci-003-AFIE’ and ‘GPT4-AFIE’ represent our proposed method (AFIE) on text-davinci-003 and GPT-4, respectively.
From the results, we can observe the following:
-
•
Our proposed method, AFIE, significantly outperforms the naive approaches for both text-davinci-003 and GPT-4. This demonstrates the effectiveness of our framework in harnessing the power of LLMs for extracting keyword-corresponding values from financial reports.
-
•
As the RETA setting becomes more stringent, the performance difference between the naive approaches and our method increases. This indicates that our method is capable of delivering more accurate results under stricter evaluation metrics.
-
•
GPT-4 shows better overall performance compared to text-davinci-003, which can be attributed to its larger token handling capacity and more advanced architecture. However, the improvement brought by our method is still significant for both models, highlighting the importance of our proposed framework in effectively utilizing LLMs for financial information extraction tasks.
4.5 Capability to Handle Keyword Ambiguity
Financial reports often contain multiple representations for the same concept in the form of different keywords. To investigate our method’s capability in handling keyword ambiguity, we designed an experiment. In this experiment, we selected two sets of keywords: (Revenue vs. Total Net Sales) and (Total Equity vs. Total Stockholders’ Equity). We conducted the experiment on our dataset, comparing the Relative Percentage Difference (RPD) in average accuracy between the naive method and our approach under various RETA levels.
The RPD is calculated using the following formula:
where and represent the average accuracy of two different keywords, such as Revenue (Acc_R) and Total Net Sales (Acc_N). In this case, the RPD for the naive method at a certain RETA level would be:
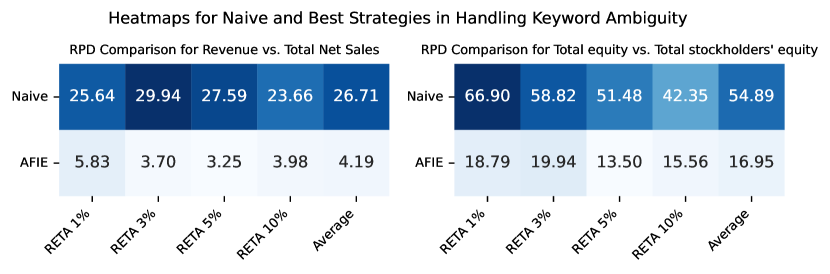
The experimental results are presented in Figure 3. For more detailed results, please refer to the Appendix D. From the experimental results, we observe that our approach outperforms the naive method across all RETA levels when handling keyword ambiguity to a certain degree. Specifically, in the comparison between Revenue vs. Total Net Sales, our method exhibits an approximately 22.52% lower average RPD compared to the naive method. Similarly, in the comparison between Total Equity vs. Total Stockholders’ Equity, our method achieves an average RPD approximately 37.94% lower than the naive method. These results suggest that our approach demonstrates a certain level of capability in handling keywords with multiple representations.
It is important to note that keyword ambiguity is a difficult problem, and while our method does not completely resolve the issue, it shows promise in effectively addressing this challenge to a certain extent in practical applications involving financial reports and other long texts, resulting in improved accuracy and efficiency in information extraction.
5 Ablation Study
5.1 Impact of Retrieved Segment Quantity on Accuracy
In this subsection, we investigate the effect of the number of retrieved segments on the performance of our method. We present the results in Table 3, which shows the accuracy for different retrieval quantities, where R@n represents the number of top-ranked segments retrieved.
| RETA 1% | RETA 3% | RETA 5% | RETA 10% | Average | |
| R@1 | 0.4757 | 0.5278 | 0.5444 | 0.5694 | 0.5293 |
| R@2 | 0.6188 | 0.6736 | 0.6931 | 0.7118 | 0.6743 |
| R@3 | 0.6389 | 0.6938 | 0.7194 | 0.7451 | 0.6993 |
| R@5 | 0.6160 | 0.6799 | 0.7062 | 0.7306 | 0.6832 |
| R@7 | 0.5917 | 0.6521 | 0.6722 | 0.7090 | 0.6563 |
| R@All | 0.3757 | 0.4986 | 0.5201 | 0.5514 | 0.4865 |
The results reveal that the highest accuracy across all RETA levels is achieved when the retrieval quantity is set to 3 (R@3). Analyzing the trend, we can observe that the accuracy increases as the retrieval quantity goes from 1 to 3, demonstrating the benefits of retrieving more relevant segments to capture the necessary information. However, as the retrieval quantity increases beyond 3 and includes all retrieved segments, the accuracy declines. This suggests that including too many segments may introduce noise or irrelevant information, which adversely affects the method’s performance.
These findings highlight the importance of designing an appropriate retrieval quantity based on the length and complexity of the text. Striking the right balance is crucial, as including excessive segments may decrease accuracy due to irrelevant or redundant information.
5.2 Comparison of Summarization Strategies: Map-Reduce vs. Refine
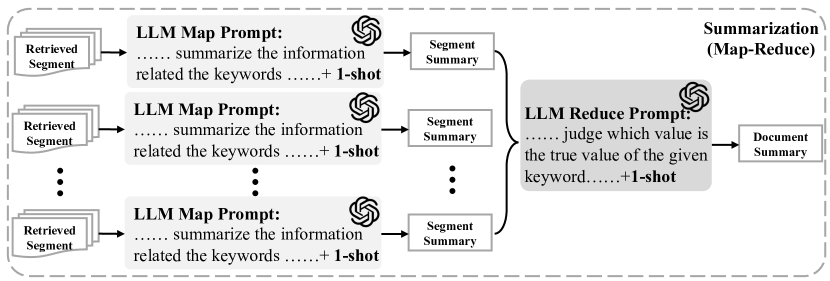
In order to extract information about the keywords from multiple selected segments, several popular strategies are available. Besides the Refine Strategy employed in our method, another commonly used approach is the Map-Reduce Strategy. As illustrated in Figure 4, the Map-Reduce Strategy aims to generate a summary from multiple document segments, consisting of two stages: Map and Reduce. In the Map stage, the LLM generates a segment summary for each document segment individually. While in the Reduce stage, the LLM combines all the segment summaries to form a single document summary. The optimized prompts used in these two stages, specifically tailored for the Map-Reduce Strategy, can be found in Appendix C.2.
| RETA 1% | RETA 3% | RETA 5% | RETA 10% | Average | |
|---|---|---|---|---|---|
| Map-Reduce | 0.5375 | 0.5729 | 0.5958 | 0.6299 | 0.5840 |
| Refine | 0.6389 | 0.6938 | 0.7194 | 0.7451 | 0.6993 |
The experimental results comparing the Map-Reduce and Refine strategies are presented in Table 4. As shown, the Refine Strategy consistently outperforms the Map-Reduce Strategy in terms of accuracy across all RETA levels. This comparison highlights the superiority of the Refine Strategy in effectively extracting relevant information from the selected segments and generating a summary that accurately represents the keywords. One possible reason for the higher accuracy of the Refine Strategy could be its ability to better consolidate information from multiple segments, thus reducing redundancy and maintaining focus on the keywords.
5.3 Analysis of Table Serialization Formats
In this subsection, we delve into a comprehensive analysis of the performance of various table serialization formats, specifically PLAIN, CSV, XML, and HTML. Each of these formats has distinct characteristics that influence their effectiveness in representing table structures and extracting relevant information.
PLAIN serialization extracts text from the table cells, separating adjacent cell content with spaces, and using newline characters to separate rows.
CSV serialization separates adjacent cells with comma delimiters.
XML and HTML serialization formats, on the other hand, utilize tags to preserve the hierarchical relationships between table elements. XML employs tags such as <table>, <row>, and <cell>, while HTML utilizes tags like <table>, <tr> (for table rows), and <td> (for table cells).
Despite the advantages of retaining hierarchical information in XML and HTML formats, the incorporation of tags results in a higher token count for representing tables. Consequently, tables in XML or HTML formats may exceed the LLM’s maximum sequence length, necessitating the splitting of tables into multiple sub-tables more frequently than in PLAIN and CSV formats.
The experimental results, as presented in Table 5, provide valuable insights into the performance of these table serialization formats. Evidently, the PLAIN and CSV formats outshine their XML and HTML counterparts in terms of accuracy. This superior performance can be attributed to the concise representation of tables in PLAIN and CSV formats, which reduces the likelihood of table fragmentation and enables LLMs to process the information more effectively.
| RETA 1% | RETA 3% | RETA 5% | RETA 10% | Average | |
| PLAIN | 0.6389 | 0.6938 | 0.7194 | 0.7451 | 0.6993 |
| CSV | 0.6264 | 0.6889 | 0.7132 | 0.7361 | 0.6911 |
| XML | 0.3951 | 0.4507 | 0.4729 | 0.5069 | 0.4564 |
| HTML | 0.4542 | 0.5000 | 0.5208 | 0.5590 | 0.5085 |
5.4 Prompt Engineering - Numerical Precision Enhancement
In scenarios like financial analysis, risk assessment, and investment decision-making, higher precision results are needed. We designed two strategies, Direct and Shot-Precision, to enhance numerical precision. To evaluate their effectiveness, we conducted ablation experiments with finer RETA levels, from 0% to 0.1%. The ablation strategies include:
-
•
Naive: A minimal prompt with task description only.
-
•
Naive & Direct: Naive prompt with added precision requirement in task description.
-
•
Naive & Shot: Naive prompt plus input-output example.
-
•
Direct & Shot: Naive prompt with precision requirements and input-output example.
-
•
Naive & Shot-Precision: Naive prompt with input-output example containing precision information.
-
•
Direct & Shot-Precision: Naive prompt with precision requirements and input-output example containing precision information.
Detailed information on these prompts can be found in Appendix C.4.
| RETA 0% | RETA 0.001% | RETA 0.01% | RETA 0.1% | Average | |
| Naive | 0.4917 | 0.4937 | 0.5187 | 0.5750 | 0.5198 |
| Naive & Direct | 0.3479 | 0.3479 | 0.3597 | 0.4083 | 0.3660 |
| Naive & Shot | 0.4111 | 0.4153 | 0.4493 | 0.5438 | 0.4549 |
| Direct & Shot | 0.4403 | 0.4438 | 0.4722 | 0.5396 | 0.4740 |
| Naive & Shot-precision | 0.5278 | 0.5299 | 0.5479 | 0.5882 | 0.5484 |
| Direct & Shot-precision | 0.5646 | 0.5660 | 0.5750 | 0.5938 | 0.5748 |
The experimental results, presented in Table 6, showcase the accuracy of different prompt engineering strategies across various fine-grained RETA levels. From the results, we can observe the following:
-
•
The Direct & Shot-Precision strategy achieves the highest accuracy across all fine-grained RETA levels, indicating its effectiveness in enhancing the numerical precision of extracted values.
-
•
The Naive & Shot-Precision strategy also shows a noticeable improvement in accuracy compared to the Naive & Shot strategy, demonstrating the benefits of incorporating precision information in the input-output examples.
-
•
The performance of Naive & Direct, Naive & Shot, and Direct & Shot strategies is inferior to that of Naive alone. This may suggest that improperly designed or insufficient precision prompts could act as a distractor for the model, hindering its ability to focus on improving numerical accuracy.
5.5 Prompt Engineering - Keyword Completion
To further explore the effectiveness of keyword completion in improving the performance of our proposed method, we conducted an experiment with various settings. The main goal of this experiment is to analyze how providing additional contextual information, such as company names and time periods, can influence LLMs’ performance. Our experimental settings are as follows:
-
•
A: Only provide attribute names, such as “Net Income”, “Revenue”, etc.
-
•
A_C: Provide attribute names and company names, such as “Net Income of Nike”.
-
•
A_T: Provide attribute names and time, such as “Net Income of 2022Q4”.
-
•
A_T_C: Provide attribute names, time, and company names, such as “Net Income of Nvidia 2022Q4”.
| RETA 1% | RETA 3% | RETA 5% | RETA 10% | Average | |
| A | 0.3403 | 0.3917 | 0.4076 | 0.4292 | 0.3922 |
| A_C | 0.4681 | 0.5167 | 0.5361 | 0.5604 | 0.5203 |
| A_T | 0.4785 | 0.5396 | 0.5500 | 0.5736 | 0.5354 |
| A_T_C | 0.6389 | 0.6938 | 0.7194 | 0.7451 | 0.6993 |
The experimental results presented in Table 7 demonstrate the effectiveness of providing additional context for enhancing the performance of our proposed method. In all settings, the strategy A_T_C, which incorporates attribute names, time periods, and company names, outperforms the other strategies. This result indicates that providing more specific information about the desired attribute, time period, and company can help guide LLMs to generate more accurate responses.
Upon analyzing the results, one potential reason for the superior performance of A_T_C is that the additional context helps the model disambiguate the information, reducing the uncertainty in generating responses. Financial reports often provide data comparisons for previous years or quarters, and may also contain data from different branches or subsidiaries of a company. By providing company names and time periods, the model can better focus on the requested information and generate more precise values, leading to an improvement in overall performance.
6 Related Work
This research builds on two main types of established research directions:
6.1 Financial report extraction
Financial NLP has experienced rapid advancements in recent years. Information extraction has numerous beneficial applications in finance, such as sentiment analysis Araci (2019); Yang et al. (2020); Feng et al. (2021); Mustafaoglu and Bogumill (2022), financial question answering Lai et al. (2018); Maia et al. (2018), and financial event extraction Ein-Dor et al. (2019); Zhai and Zhang (2019).
Early information extraction methods in the financial domain predominantly relied on rule-based approaches. Farmakiotou et al. proposed a rule-based NER model utilizing hand-crafted lexical resources to automate information extraction from a Greek financial news corpus Farmakiotou et al. (2000b). Sheikh and Conlon developed rules incorporating exact word matching, part-of-speech tagging, orthographic features, and domain-specific features, and experimented with greedy search algorithms and Tabu search algorithms to generalize rules for extracting financial data information (company quarterly reports and financial news) to support investment decisions Sheikh and Conlon (2012). Alvarado et al. introduced a domain adaptation method for the NER task using annotated publicly available financial documents for risk assessment Alvarado et al. (2015). In recent years, models for extracting information from financial reports through ML have also emerged.
Brito et al. presented a method for detecting KPIs extracted from hybrid text of German financial reports using a convolutional neural network (CNN) and a supervised decision tree-based classifier Brito et al. (2019). The concept of extracting information from financial reports through pre-trained language models (PLMs) has been gradually refined. Ma et al. trained a bidirectional RNN classifier to extract KPIs from earnings reports in real-time Ma et al. (2020). Hillebrand et al. utilized a pre-trained language model to jointly extract and correlate KPIs and their values from real German financial reports using a novel approach that combines NER and RE Hillebrand et al. (2022). Chava et al. employed the deep learning language model RoBERTa, which can analyze text at the sentence level and construct a company-level inflation risk measure based on earnings conference call records Chava et al. (2022). The most relevant works to our research are FinQA Chen et al. (2022), TAT-QA Zhu et al. (2021), and MULTIHIERTT Zhao et al. (2022), all of which extract relevant KPIs in financial reports from text and table information.
6.2 LLMs
In recent years, LLMs have exhibited exceptional performance across diverse tasks Wei et al. (2023a); Zhou et al. (2022); Wang et al. (2022); Kojima et al. (2023); Zelikman et al. (2022). Notably, LLMs possess the capacity to comprehend natural language task descriptions and align generated text with human preferences, achieved through large-scale pre-training on extensive text corpora Brown et al. (2020), prompt engineering Wei et al. (2023a, 2022, 2021); Chung et al. (2022), and reinforcement learning with human feedback (RLHF) Schulman et al. (2017); Stiennon et al. (2020); Bai et al. (2022). The proficiency of LLMs in multitask, multilingual, and multimodal contexts paves the way for innumerable possibilities in both application and research domains.
In our research, we primarily focus on leveraging the extensive capabilities of LLMs across three distinct tasks. A review of the literature pertaining to these tasks is provided as follows: 1) Long document processing: The utility of LLMs is often constrained by their maximum input length. While certain models can accommodate lengthy inputs, they may still encounter difficulties in capturing essential contextual information within exceptionally long texts Press et al. (2021). In order to tackle this challenge, the capacity of LLMs to process ultra-long document summarization and engage in extended conversations has been improved through a memory processing mechanism Liang et al. (2023). 2) Information extraction, particularly in the context of value extraction: The proficiency of LLMs in information extraction has been rigorously investigated and corroborated by a substantial corpus of research, covering domains such as Information Extraction (IE) Li et al. (2023); Wei et al. (2023b)—which includes Named Entity Recognition (NER) Gupta et al. (2021); Wang et al. (2023a) and Relation Extraction (RE) Wan et al. (2023); Xu et al. (2023)—as well as Knowledge Graph Extraction Shi et al. (2023). Polak et al. (2023); Polak and Morgan (2023) have successfully demonstrated the extraction of key-value pairs from academic papers, thereby substantiating the dependability of LLMs for structured data extraction. Utilizing LLMs, Arora et al. (2023) have generated keyword candidate sets, applied filtering techniques, and produced extraction codes. Furthermore, they have executed function synthesis procedures to transform original documents into visually comprehensible tabular representations. These systematic approach underscores the potential of LLMs in facilitating efficient data extraction and conversion processes. 3) Tabular reasoning: Chen (2023); Ye et al. (2023) provided experimental evidence illustrating the considerable proficiency of LLMs in executing intricate tabular reasoning tasks. These finding underscores the potential of LLMs as a valuable tool for extracting, processing, and analyzing structured data in a variety of research contexts.
7 Conclusion and Future Work.
This study proposes an Automated Financial Information Extraction (AFIE) framework that leverages LLMs to extract KPIs from financial reports. The AFIE framework consists of four modules: Segmentation, Retrieval, Summarization, and Extraction, which aid in the extraction of keyword-corresponding values from financial reports. A new dataset called Financial Reports Numerical Extraction (FINE) is introduced, which further facilitates the evaluation of LLMs’ performance in the financial domain. Experimental results demonstrate the effectiveness, robustness and transferability of the AFIE framework in improving data extraction accuracy when applied to both GPT-3.5 and GPT-4. The ablation study investigates the influence of different components of the AFIE framework, such as table serialization formats, summarization strategies, and prompt engineering techniques. This analysis emphasizes the effectiveness of the AFIE framework and underscores the potential of large language models (LLMs) in processing hybrid data, including text and tables, in the context of financial reporting. This research lays the groundwork for further advancements in financial NLP and the practical application of LLMs in automating complex information extraction tasks in the financial domain.
This research constitutes a component of a broader, long-term project aimed at leveraging LLMs to enhance information extraction in the financial text domain and other hybrid data environments, such as medical reports, legal documents, and scientific papers. In future work, we intend to broaden the dataset’s accessibility, quality, and quantity to encompass a wider array of domains and task types. Furthermore, we will investigate additional strategies to optimize LLMs performance in hybrid-text data tasks and bolster their generalization and adaptability across various domains. This study establishes a foundation for advancing financial NLP and implementing LLMs in practical applications for automating complex information extraction tasks within hybrid text.
References
- Alvarado et al. (2015) Julio Cesar Salinas Alvarado, Karin Verspoor, and Timothy Baldwin. 2015. Domain adaption of named entity recognition to support credit risk assessment. In Proceedings of the Australasian Language Technology Association Workshop 2015, pages 84–90.
- Araci (2019) Dogu Araci. 2019. Finbert: Financial sentiment analysis with pre-trained language models.
- Arora et al. (2023) Simran Arora, Brandon Yang, Sabri Eyuboglu, Avanika Narayan, Andrew Hojel, Immanuel Trummer, and Christopher Ré. 2023. Language models enable simple systems for generating structured views of heterogeneous data lakes. arXiv preprint arXiv:2304.09433.
- Bai et al. (2022) Yuntao Bai, Andy Jones, Kamal Ndousse, Amanda Askell, Anna Chen, Nova DasSarma, Dawn Drain, Stanislav Fort, Deep Ganguli, Tom Henighan, et al. 2022. Training a helpful and harmless assistant with reinforcement learning from human feedback. arXiv preprint arXiv:2204.05862.
- Brito et al. (2019) Eduardo Brito, Rafet Sifa, Christian Bauckhage, Rüdiger Loitz, Uwe Lohmeier, and Christin Pünt. 2019. A hybrid ai tool to extract key performance indicators from financial reports for benchmarking. In Proceedings of the ACM Symposium on Document Engineering 2019, pages 1–4.
- Brown et al. (2020) Tom Brown, Benjamin Mann, Nick Ryder, Melanie Subbiah, Jared D Kaplan, Prafulla Dhariwal, Arvind Neelakantan, Pranav Shyam, Girish Sastry, Amanda Askell, et al. 2020. Language models are few-shot learners. Advances in neural information processing systems, 33:1877–1901.
- Chava et al. (2022) Sudheer Chava, Wendi Du, Agam Shah, and Linghang Zeng. 2022. Measuring firm-level inflation exposure: A deep learning approach. Available at SSRN 4228332.
- Chen (2023) Wenhu Chen. 2023. Large language models are few(1)-shot table reasoners.
- Chen et al. (2022) Zhiyu Chen, Wenhu Chen, Charese Smiley, Sameena Shah, Iana Borova, Dylan Langdon, Reema Moussa, Matt Beane, Ting-Hao Huang, Bryan Routledge, and William Yang Wang. 2022. Finqa: A dataset of numerical reasoning over financial data.
- Chung et al. (2022) Hyung Won Chung, Le Hou, Shayne Longpre, Barret Zoph, Yi Tay, William Fedus, Yunxuan Li, Xuezhi Wang, Mostafa Dehghani, Siddhartha Brahma, Albert Webson, Shixiang Shane Gu, Zhuyun Dai, Mirac Suzgun, Xinyun Chen, Aakanksha Chowdhery, Alex Castro-Ros, Marie Pellat, Kevin Robinson, Dasha Valter, Sharan Narang, Gaurav Mishra, Adams Yu, Vincent Zhao, Yanping Huang, Andrew Dai, Hongkun Yu, Slav Petrov, Ed H. Chi, Jeff Dean, Jacob Devlin, Adam Roberts, Denny Zhou, Quoc V. Le, and Jason Wei. 2022. Scaling instruction-finetuned language models.
- Ein-Dor et al. (2019) Liat Ein-Dor, Ariel Gera, Orith Toledo-Ronen, Alon Halfon, Benjamin Sznajder, Lena Dankin, Yonatan Bilu, Yoav Katz, and Noam Slonim. 2019. Financial event extraction using Wikipedia-based weak supervision. In Proceedings of the Second Workshop on Economics and Natural Language Processing, pages 10–15, Hong Kong. Association for Computational Linguistics.
- Farmakiotou et al. (2000a) Dimitra Farmakiotou, Vangelis Karkaletsis, John Koutsias, George Sigletos, Constantine D Spyropoulos, and Panagiotis Stamatopoulos. 2000a. Rule-based named entity recognition for greek financial texts. In Proceedings of the Workshop on Computational lexicography and Multimedia Dictionaries (COMLEX 2000), pages 75–78.
- Farmakiotou et al. (2000b) Dimitra Farmakiotou, Vangelis Karkaletsis, John Koutsias, George Sigletos, Constantine D Spyropoulos, and Panagiotis Stamatopoulos. 2000b. Rule-based named entity recognition for greek financial texts. In Proceedings of the Workshop on Computational lexicography and Multimedia Dictionaries (COMLEX 2000), pages 75–78.
- Feng et al. (2021) Fuli Feng, Moxin Li, Cheng Luo, Ritchie Ng, and Tat-Seng Chua. 2021. Hybrid learning to rank for financial event ranking. In Proceedings of the 44th International ACM SIGIR Conference on Research and Development in Information Retrieval, pages 233–243.
- Gupta et al. (2021) Himanshu Gupta, Shreyas Verma, Tarun Kumar, Swaroop Mishra, Tamanna Agrawal, Amogh Badugu, and Himanshu Sharad Bhatt. 2021. Context-ner: Contextual phrase generation at scale. arXiv preprint arXiv:2109.08079.
- Hillebrand et al. (2022) Lars Hillebrand, Tobias Deußer, Tim Dilmaghani, Bernd Kliem, Rüdiger Loitz, Christian Bauckhage, and Rafet Sifa. 2022. Kpi-bert: A joint named entity recognition and relation extraction model for financial reports. In 2022 26th International Conference on Pattern Recognition (ICPR), pages 606–612. IEEE.
- Kojima et al. (2023) Takeshi Kojima, Shixiang Shane Gu, Machel Reid, Yutaka Matsuo, and Yusuke Iwasawa. 2023. Large language models are zero-shot reasoners.
- Krause and Arora (2008) Hans-Ulrich Krause and Dayanand Arora. 2008. Controlling-Kennzahlen–key performance indicators. Oldenbourg Wissenschaftsverlag GmbH.
- Lai et al. (2018) Tuan Lai, Trung Bui, Sheng Li, and Nedim Lipka. 2018. A simple end-to-end question answering model for product information. In Proceedings of the First Workshop on Economics and Natural Language Processing, pages 38–43, Melbourne, Australia. Association for Computational Linguistics.
- Li et al. (2023) Bo Li, Gexiang Fang, Yang Yang, Quansen Wang, Wei Ye, Wen Zhao, and Shikun Zhang. 2023. Evaluating chatgpt’s information extraction capabilities: An assessment of performance, explainability, calibration, and faithfulness. arXiv preprint arXiv:2304.11633.
- Li et al. (2021) Sen Li, Fuyu Lv, Taiwei Jin, Guli Lin, Keping Yang, Xiaoyi Zeng, Xiao-Ming Wu, and Qianli Ma. 2021. Embedding-based product retrieval in taobao search. In Proceedings of the 27th ACM SIGKDD Conference on Knowledge Discovery & Data Mining, pages 3181–3189.
- Liang et al. (2023) Xinnian Liang, Bing Wang, Hui Huang, Shuangzhi Wu, Peihao Wu, Lu Lu, Zejun Ma, and Zhoujun Li. 2023. Unleashing infinite-length input capacity for large-scale language models with self-controlled memory system. arXiv preprint arXiv:2304.13343.
- Ma et al. (2020) Zhiqiang Ma, Steven Pomerville, Mingyang Di, and Armineh Nourbakhsh. 2020. Spot: A tool for identifying operating segments in financial tables. In Proceedings of the 43rd International ACM SIGIR Conference on Research and Development in Information Retrieval, pages 2157–2160.
- Maia et al. (2018) Macedo Maia, Siegfried Handschuh, André Freitas, Brian Davis, Ross McDermott, Manel Zarrouk, and Alexandra Balahur. 2018. Www’18 open challenge: Financial opinion mining and question answering. In Companion Proceedings of the The Web Conference 2018, WWW ’18, page 1941–1942, Republic and Canton of Geneva, CHE. International World Wide Web Conferences Steering Committee.
- Mustafaoglu and Bogumill (2022) Zelal Su Mustafaoglu and Nolan Bogumill. 2022. Lstm-based analysis of company sentiments regarding cryptocurrencies. Metamorphosis.
- Polak et al. (2023) Maciej P Polak, Shrey Modi, Anna Latosinska, Jinming Zhang, Ching-Wen Wang, Shanonan Wang, Ayan Deep Hazra, and Dane Morgan. 2023. Flexible, model-agnostic method for materials data extraction from text using general purpose language models. arXiv preprint arXiv:2302.04914.
- Polak and Morgan (2023) Maciej P Polak and Dane Morgan. 2023. Extracting accurate materials data from research papers with conversational language models and prompt engineering–example of chatgpt. arXiv preprint arXiv:2303.05352.
- Press et al. (2021) Ofir Press, Noah A Smith, and Mike Lewis. 2021. Train short, test long: Attention with linear biases enables input length extrapolation. arXiv preprint arXiv:2108.12409.
- Reimers and Gurevych (2019) Nils Reimers and Iryna Gurevych. 2019. Sentence-bert: Sentence embeddings using siamese bert-networks. arXiv preprint arXiv:1908.10084.
- Schulman et al. (2017) John Schulman, Filip Wolski, Prafulla Dhariwal, Alec Radford, and Oleg Klimov. 2017. Proximal policy optimization algorithms. arXiv preprint arXiv:1707.06347.
- Sheikh and Conlon (2012) Mahmudul Sheikh and Sumali Conlon. 2012. A rule-based system to extract financial information. Journal of Computer Information Systems, 52(4):10–19.
- Shi et al. (2023) Yucheng Shi, Hehuan Ma, Wenliang Zhong, Gengchen Mai, Xiang Li, Tianming Liu, and Junzhou Huang. 2023. Chatgraph: Interpretable text classification by converting chatgpt knowledge to graphs. arXiv preprint arXiv:2305.03513.
- Stiennon et al. (2020) Nisan Stiennon, Long Ouyang, Jeffrey Wu, Daniel Ziegler, Ryan Lowe, Chelsea Voss, Alec Radford, Dario Amodei, and Paul F Christiano. 2020. Learning to summarize with human feedback. Advances in Neural Information Processing Systems, 33:3008–3021.
- Wan et al. (2023) Zhen Wan, Fei Cheng, Zhuoyuan Mao, Qianying Liu, Haiyue Song, Jiwei Li, and Sadao Kurohashi. 2023. Gpt-re: In-context learning for relation extraction using large language models. arXiv preprint arXiv:2305.02105.
- Wang et al. (2023a) Shuhe Wang, Xiaofei Sun, Xiaoya Li, Rongbin Ouyang, Fei Wu, Tianwei Zhang, Jiwei Li, and Guoyin Wang. 2023a. Gpt-ner: Named entity recognition via large language models. arXiv preprint arXiv:2304.10428.
- Wang et al. (2023b) Xuezhi Wang, Jason Wei, Dale Schuurmans, Quoc Le, Ed Chi, Sharan Narang, Aakanksha Chowdhery, and Denny Zhou. 2023b. Self-consistency improves chain of thought reasoning in language models.
- Wang et al. (2022) Xuezhi Wang, Jason Wei, Dale Schuurmans, Quoc Le, Ed Chi, and Denny Zhou. 2022. Self-consistency improves chain of thought reasoning in language models. arXiv preprint arXiv:2203.11171.
- Wei et al. (2021) Jason Wei, Maarten Bosma, Vincent Y Zhao, Kelvin Guu, Adams Wei Yu, Brian Lester, Nan Du, Andrew M Dai, and Quoc V Le. 2021. Finetuned language models are zero-shot learners. arXiv preprint arXiv:2109.01652.
- Wei et al. (2022) Jason Wei, Yi Tay, Rishi Bommasani, Colin Raffel, Barret Zoph, Sebastian Borgeaud, Dani Yogatama, Maarten Bosma, Denny Zhou, Donald Metzler, et al. 2022. Emergent abilities of large language models. arXiv preprint arXiv:2206.07682.
- Wei et al. (2023a) Jason Wei, Xuezhi Wang, Dale Schuurmans, Maarten Bosma, Brian Ichter, Fei Xia, Ed Chi, Quoc Le, and Denny Zhou. 2023a. Chain-of-thought prompting elicits reasoning in large language models.
- Wei et al. (2023b) Xiang Wei, Xingyu Cui, Ning Cheng, Xiaobin Wang, Xin Zhang, Shen Huang, Pengjun Xie, Jinan Xu, Yufeng Chen, Meishan Zhang, et al. 2023b. Zero-shot information extraction via chatting with chatgpt. arXiv preprint arXiv:2302.10205.
- Xu et al. (2023) Xin Xu, Yuqi Zhu, Xiaohan Wang, and Ningyu Zhang. 2023. How to unleash the power of large language models for few-shot relation extraction? arXiv preprint arXiv:2305.01555.
- Yang et al. (2020) Yi Yang, Mark Christopher Siy UY, and Allen Huang. 2020. Finbert: A pretrained language model for financial communications.
- Ye et al. (2023) Yunhu Ye, Binyuan Hui, Min Yang, Binhua Li, Fei Huang, and Yongbin Li. 2023. Large language models are versatile decomposers: Decompose evidence and questions for table-based reasoning. arXiv preprint arXiv:2301.13808.
- Zelikman et al. (2022) Eric Zelikman, Yuhuai Wu, Jesse Mu, and Noah Goodman. 2022. Star: Bootstrapping reasoning with reasoning. Advances in Neural Information Processing Systems, 35:15476–15488.
- Zhai and Zhang (2019) Shuang (Sophie) Zhai and Zhu (Drew) Zhang. 2019. Forecasting firm material events from 8-k reports. In Proceedings of the Second Workshop on Economics and Natural Language Processing, pages 22–30, Hong Kong. Association for Computational Linguistics.
- Zhao et al. (2022) Yilun Zhao, Yunxiang Li, Chenying Li, and Rui Zhang. 2022. MultiHiertt: Numerical reasoning over multi hierarchical tabular and textual data. In Proceedings of the 60th Annual Meeting of the Association for Computational Linguistics (Volume 1: Long Papers), pages 6588–6600, Dublin, Ireland. Association for Computational Linguistics.
- Zhou et al. (2022) Denny Zhou, Nathanael Schärli, Le Hou, Jason Wei, Nathan Scales, Xuezhi Wang, Dale Schuurmans, Olivier Bousquet, Quoc Le, and Ed Chi. 2022. Least-to-most prompting enables complex reasoning in large language models. arXiv preprint arXiv:2205.10625.
- Zhu et al. (2021) Fengbin Zhu, Wenqiang Lei, Youcheng Huang, Chao Wang, Shuo Zhang, Jiancheng Lv, Fuli Feng, and Tat-Seng Chua. 2021. Tat-qa: A question answering benchmark on a hybrid of tabular and textual content in finance.
Appendix A Financial Reports and Related Websites
To assist readers without prior knowledge of financial reports in better understanding our articles, we present relevant images of financial reports and our reference websites in this section. Figure 5 and Figure 6 primarily illustrates the table and text formats in financial reports. Figures 9 and 10 showcase the visualizations of AMD’s annual financial report income statement on two selected websites. Figure 7, 8, 9, and 10 collectively demonstrate the ambiguous representation of Revenue in AMD’s financial report.
Appendix B Details of FINE
Figure 11 displays the token count distribution in FINE, with the largest document containing 234,900 tokens, the smallest document comprising 13,022 tokens, and an average of 59,464 tokens per document. Table 8 presents the nine keywords utilized in FINE, while Table 9 illustrates the specific representation of Revenue in various companies’ financial reports.
| Category | Keywords |
|---|---|
| Income Statement | Revenue |
| Operating Expense | |
| Net Income | |
| Earnings Per Share | |
| Balance Sheet | Total Assets |
| Total Equity | |
| Cash Flow | Operating Activities |
| Investing Activities | |
| Financing Activities |
| Corporation | Revenue |
|---|---|
| Amazon | Total Net Sales; Net Sales [span] Consolidated; Consolidated [span] Net Sales; |
| AMD | Total net revenue; Net revenue; Total sales to external customers; |
| Apple | Total Net Sales |
| Autoliv | Consolidated net sales; Net Sales; Total Net Sales |
| BOEING | Revenues; Total revenues |
| Cisco | Total revenue; Product revenue: [span] total; Revenue: [span] total Revenue |
| Coca Cola | Net operating revenues |
| Dell | Total net revenue; Total consolidated net revenue; Net revenue |
| Ebay | Net revenues; Total net revenues |
| Intel | Net revenue; Total net revenue |
| Meta Platforms | Revenue; Total revenue |
| Microsoft | Revenue; Total revenue |
| Nike | Revenues; TOTAL NIKE, INC. REVENUES; Total revenue; Revenue |
| Nvida | Total revenues |
| Oracle | Total net revenues |
| Starbucks | Total revenue |
| State Street | Total revenues |
| Walmart | Total net revenues; Total revenue |
Appendix C Prompts
C.1 Summarization Prompts - Refine
The Refine strategy consists of two prompts: the Question Prompt and the Refine Prompt. These prompts are designed to guide LLMs in extracting and summarizing key information related to the given keywords from many segments.
Question Prompt: This prompt is designed to instruct the LLMs to generate an initial summary containing information related to the given “keywords” from the provided “document_segment”. The content of the question prompt is as follows:
Refine Prompt: The refine prompt is designed to instruct LLMs to update the “old_summary” by incorporating information related to the “key_words” from the provided “document_segment”. The content of the refine prompt is as follows:
C.2 Summarization Prompts - Map-Reduce
The Map-Reduce strategy also consists of two prompts: the Map Prompt and the Reduce Prompt.
Map Prompt: This prompt is designed to instruct LLMs to generate a summary containing information related to the given “keywords” from the provided “document_segment”. The content of the Map prompt is as follows: {codeframe} ⬇ >>>>>Your Task: Given a segment of a financial report and keywords. You need to summarize the information related the keywords. All values must be in millions and round to three decimal places using rounding rules. >>>>>Example: Financial report’s segment: For the company A in 2022Q3, the revenue is $1.2345 billion; the net income is $50.1245 million. ----- Keywords: Net income and revenue of company A at 2022Q3. ----- Summary: For company A at 2022Q3, net income is $50.125 million, revenue is $1,234.500 million. >>>>>Question: Financial report’s segment: {document_segment} ----- Keywords: {keywords} ----- Summary:
Reduce Prompt: The Reduce prompt is designed to instruct LLMs to consolidate the summaries obtained from the Map process. The “text” in the prompt represents all the summaries generated by the Map process. {codeframe} ⬇ >>>>>Your Task: Find the values of keywords in the given content. If you can’t find the value, please output "None". If you find the corresponding value, please express it in millions and round to two decimal places using rounding rules. >>>>>Example 1: Contnet: For the company ABC, total net sales for the three months ended June 25, 2022 were $65.135 billion. ----- Keywords: Total net sales of ABC for the three months ended June 25, 2022. ----- Result: 65,135.00 >>>>>Example 2: Contnet: For the company XYZ, total assets for the three months ended 2022.10.15 were $2.126 million. ----- Keywords: Total assets of XYZ for the three months ended October 15, 2022. ----- Result: 2.13 >>>>> Question Content: {text} ----- Keywords: {keywords} ----- Result:
C.3 Extraction Prompt
Extraction Prompt for Text-davinci-003: This prompt is designed to extract the numerical values corresponding to the specified keywords from the given content. If the value is not found, the prompt directs LLMs to output "None". If the value is found, it should be expressed in millions and rounded to two decimal places using rounding rules. {codeframe} ⬇ >>>>> Your task: Find the values of key words in the given content. If you can’t find the value, please output "None". If you find the corresponding value, please express it in millions and round to two decimal places using rounding rules. >>>>> Example 1: Contnet: For the company ABC, Total Net Sales for the three months ended June 25, 2022 were $65.135 billion. Key words: Total Net Sales of ABC for the three months ended June 25, 2022. Result: 65,135.00 >>>>> Example 2: Contnet: For the company XYZ, Total Assets for the three months ended 2022.10.15 were $2.126 million. Key words: Total Assets of XYZ for the three months ended October 15, 2022. Result: 2.13 >>>>> Question: Content: {text} Key words: {key_words} Result:
Extraction Prompt for GPT-4: This prompt is specifically designed for GPT-4 to extract numerical values corresponding to multiple specified keywords from the given content in a single query, which helps save on the experimental cost. If a value is not found, the prompt directs the LLM to output "None". If the value is found, it should be expressed in millions and rounded to two decimal places using rounding rules. The output is presented in JSON format, allowing for easy parsing and interpretation of the results {codeframe} ⬇ >>>>>Your Task: Find the values of key words in the given content. If you can’t find the value, please output "None". If you find the corresponding value, please express it in millions and round to two decimal places using rounding rules. Output results in JSON format. >>>>>Example 1: Contnet: For the company ABC, total net sales for the three months ended June 25, 2022 were $65.135 billion. Total assets for the three months ended June 25, 2022 were $2.126 million. ----- Keywords: "Total net sales", "Income" and "Total assets" of ABC for the three months ended June 25, 2022. ----- Result: {{"Total net sales": "65,135.00", "Income": "None", "Total assets": "2.13"}} >>>>>Example 2: Contnet: For the company XYZ, total assets for the three months ended 2022.10.15 were $2.126 billion, revenue for the three months ended 2022.10.15 were $65.135 million. ----- Keywords: "Total assets" of XYZ for the three months ended October 15, 2022. ----- Result: {{"Total assets": "2,126.00", "Revenue": "65.14"}} >>>>> Question Content: {text} ----- Keywords: {key_words} ----- Result:
C.4 Numerical Precision Enhancement Prompts
The Numerical Precision Enhancement Prompts aim to improve the precision of extracted numerical values by guiding the LLMs to preserve the required level of precision. These prompts come in different variations, each adding or modifying specific aspects to achieve the desired precision:
Naive: This version of the prompt only contains the task description and task information. It does not provide explicit guidance on numerical precision. {codeframe} ⬇ >>>>Your Task: Given a segment of a financial report and keywords. You need to summarize the information related the keywords. >>>>Question: Financial report’s segment: {document_segment} ----- Keywords: {keywords} ----- Summary:
Naive & Direct: This version adds a precision requirement to the task description in the Naive prompt. It explicitly states that all values must be in millions and rounded to three decimal places using rounding rules. {codeframe} ⬇ >>>>Your Task: ... All values must be in millions and round to three decimal places using rounding rules ... >>>>Question: ...
Naive & Shot: Building on the Naive version, this prompt includes an example in which variables replace specific numerical values. This demonstrates the task without giving precise guidance on numeric accuracy. {codeframe} ⬇ >>>>Your Task: ... >>>>Example: Financial report’s segment: For the company A in 2022Q3, the revenue is $x billion; the net income is $y million. ----- Keywords: Net income and revenue of company A at 2022Q3. ----- Summary: For company A at 2022Q3, net income is $x million, revenue is $y million. >>>>Question: ...
Direct & Shot: Combining the precision requirement from the Naive & Direct version and the example from the Naive & Shot version, this prompt provides both explicit precision guidance and an example of the task without specific numerical values. {codeframe} ⬇ >>>>Your Task: ... All values must be in millions and round to three decimal places using rounding rules ... >>>>Example: Financial report’s segment: For the company A in 2022Q3, the revenue is $x billion; the net income is $y million. ----- Keywords: Net income and revenue of company A at 2022Q3. ----- Summary: For company A at 2022Q3, net income is $x million, revenue is $y million. >>>>Question: ...
Naive & Shot-Precision: Building on the Naive & Shot version, this prompt demonstrates how to preserve the required precision and truncate excess precision using specific numerical examples. {codeframe} ⬇ >>>>Your Task: ... >>>>Example: Financial report’s segment: For the company A in 2022Q3, the revenue is $1.2345 billion; the net income is $50.1245 million. ----- Keywords: Net income and revenue of company A at 2022Q3. ----- Summary: For company A at 2022Q3, net income is $50.125 million, revenue is $1,234.500 million. >>>>Question: ...
Direct & Shot-Precision: This is the optimal prompt. It includes a precision requirement in the task description and an example demonstrating how to preserve the precision. The example illustrates a specific value rounded according to the given rules. {codeframe} ⬇ >>>>Your Task: ...All values must be in millions and round to three decimal places using rounding rules. >>>>Example: Financial report’s segment: For the company A in 2022Q3, the revenue is $1.2345 billion; the net income is $50.1245 million. ----- Keywords: Net income and revenue of company A at 2022Q3. ----- Summary: For company A at 2022Q3, net income is $50.125 million, revenue is $1,234.500 million. >>>>Question: ...
Appendix D Detailed Results of Keyword Ambiguity Experiment
In this section, we present the detailed experimental results for both the naive method and our approach in handling keyword ambiguity. The results are shown for different RETA levels, as well as the average RPD for each comparison.
Table 10 shows the experimental results for the naive method at different RETA levels. The results include comparisons between Revenue and Total Net Sales, as well as Total equity and Total stockholders’ equity. Table 11 displays the experimental results for our method at different RETA levels. Similar to the naive method results, it includes comparisons between Revenue and Total Net Sales, as well as Total equity and Total stockholders’ equity.
| Naive | RETA 1% | RETA 3% | RETA 5% | RETA 10% | average |
|---|---|---|---|---|---|
| Revenue | 0.3056 | 0.3333 | 0.3438 | 0.3611 | |
| Total Net Sales | 0.2361 | 0.2465 | 0.2604 | 0.2847 | |
| RPD | 25.64% | 29.94% | 27.59% | 23.66% | 26.71% |
| Total Equity | 0.0260 | 0.0303 | 0.0390 | 0.0519 | |
| Total Stockholders’ Equity | 0.0521 | 0.0556 | 0.0660 | 0.0799 | |
| RPD | 66.90% | 58.82% | 51.48% | 42.35% | 54.89% |
| Our | RETA 1% | RETA 3% | RETA 5% | RETA 10% | average |
|---|---|---|---|---|---|
| Revenue | 0.8576 | 0.8611 | 0.8681 | 0.8889 | |
| Total Net Sales | 0.8090 | 0.8299 | 0.8403 | 0.8542 | |
| RPD | 5.83% | 3.70% | 3.25% | 3.98% | 4.19% |
| Total Equity | 0.4688 | 0.4861 | 0.5278 | 0.5556 | |
| Total Stockholders’ Equity | 0.5660 | 0.5938 | 0.6042 | 0.6493 | |
| RPD | 18.79% | 19.94% | 13.50% | 15.56% | 16.95% |