On the Spectral Changes of OJ 287: The Lowest X-ray state spectrum– extended at Optical-UV and Hard at X-rays
Abstract
Optical-UV synchrotron spectrum has been argued to be the primary driver of the majority of X-ray spectral changes in the BL Lacetrae object OJ 287 during its low and intermediate X-ray flux state. Here, we focus on the lowest recorded X-ray flux state of OJ 287 by the Swift facility and report the finding of a power-law optical-UV spectrum with a photon spectrum of continuing into X-rays. Considering this at X-rays, we found a power-law X-ray spectrum of photon spectral index that improves to when considering other observations with similar X-ray spectra. This is the hardest reported X-ray spectrum (0.3-10 keV) and is consistent with the reported Swift-BAT hard X-ray spectrum. We further show that this X-ray spectrum can reproduce most of the flat X-ray spectra when combined with the corresponding optical-UV continuum during the low and intermediate flux states strengthening synchrotron as the primary driver of most of the X-ray spectral changes in the LBL state of the source. Combined with sharp-steepening/cutoff of the optical-UV spectrum during bright phases, the extended-spectrum indicates a comparatively larger emission region and could be the large-scale jet emission. The optical-UV spectrum implies a high-energy power-law particle spectrum of while X-ray implies a hard low-energy particle spectrum of which could be the real or can result from a higher low-energy cut-off in the particle spectrum.
1 Introduction
OJ 287 is an optically bright BL Lacertae (BLL) type object at a cosmological redshift of z=0.306, characterized by a non-thermal continuum-dominated optical spectrum with very weak emission line features reported only during its very faint optical brightness states (Sitko & Junkkarinen, 1985; Nilsson et al., 2010; Huang et al., 2021). Together with flat spectrum radio quasars (FSRQs), they are referred to as blazars – active galactic nuclei hosting large-scale powerful relativistic jets directed roughly towards the Earth. Blazars are characterized by a highly variable continuum extending across the entire electromagnetic (EM) spectrum from radio to GeV-TeV gamma-rays that exhibits a broad, bi-model spectral energy distribution (e.g. Abdo et al., 2010; Hayashida et al., 2015; Kushwaha, 2022). The temporal continuum variation is primarily erratic and variable at all times from decades and more to all the way to minutes scales accessible within the sensitivities of currently existing facilities (e.g. Goyal et al., 2018).
The low-energy emission component of the bi-model broadband SED that starts at radio and peaks in between near-infrared (NIR) to X-ray energies is widely accepted to be the synchrotron emission from relativistic electrons within the jet due to the non-thermal nature of radio and optical spectrum together with their strong and variable polarization. The high-energy part is debated to be either via inverse Comptonization (IC) – a natural and logical scenario given relativistic electrons and strong photon fields, or hadronic processes or a combination of both (e.g. Gao et al., 2018; Murase & Bartos, 2019, and references therein). Claims of detection of neutrinos from the direction of these sources support hadronic component and modeling indicates the hadronic component to be sub-dominant at MeV-GeV energies (Gao et al., 2018; Murase & Bartos, 2019).
A remarkable property of the bi-modal broadband SED is that the frequency at which the low-energy emission component peaks rarely changes despite the observed strong flux variations, most of which are often accompanied by a change in the continuum spectrum in different observational bands. This stability combined with the physical understanding of the low-energy part of the SED has led to a physical process-based classification of blazars into low- (LSP: LBL+FSRQs), intermediate- (ISP/IBL), and high-synchrotron-peaked blazars (HSP/HBL; Abdo et al., 2010; Fossati et al., 1998).
The inferred dominance of the leptonic component from SED modeling of neutrinos associated blazars e.g. Gao et al. (2018) implies a highly correlated flux variability as well as spectral properties between the EM bands constituting the two humps in the SED. Thus, for simultaneous continuum variation indicating emission from the same region, the spectrum of the low-energy hump is related to that of the high-energy hump. For LBLs/LSPs, to which OJ 287 belongs (e.g. Abdo et al., 2010), this implies a direct connection between the optical-UV (synchrotron) to the MeV-GeV gamma-ray spectrum. The former being purely of synchrotron origin provides a direct tracer of the underlying particle spectrum. Combining this with the simultaneous X-ray spectrum, additionally, allows us to explore the extent of the underlying particle spectrum. This makes the simultaneous optical to X-ray spectrum an excellent observable to probe the high-energy particle spectrum, free from any artifact/complications that could affect the high-energy component e.g. multiple IC fields contributing to the high-energy hump, steepening introduced by the onset of the Klein-Nishina regime as well as extra-galactic background light etc. The particle spectrum being the fundamental entity of non-thermal processes has important implications beyond blazar’s high emission, emission region e.g. cosmic rays, astro-particle physics, etc.
Amongst blazars, OJ 287 is one of the best-monitored sources by the transient observing facility: The Neil Gherels Swift Observatory because of its frequent activity and peculiar properties (Dey et al., 2018, and references therein), the latter driving most of the coordinated multi-wavelength monitoring (e.g. Seta et al., 2009; Gupta et al., 2017, 2019; Singh et al., 2022; Komossa et al., 2017, 2021). Studies of simultaneous111not strictly, exposure/data-extraction vary significantly in different bands– order of a few minutes at optical while sub-hour to hour at X-rays. optical-to-X-ray spectra have reported a strong anti-correlation between optical-UV and X-ray spectral index (Siejkowski & Wierzcholska, 2017). More recently, the source exhibited a very different flux and spectral evolution with drastic spectral changes in all the EM bands (Brien & VERITAS Collaboration, 2017; Kushwaha et al., 2018a, b, 2021; Singh et al., 2022; Komossa et al., 2021). The reported spectral phases are unique and OJ 287 is the very first blazar to exhibit spectra that are representative of the entire blazar class (e.g. Kushwaha, 2022; Singh et al., 2022). Theoretical scenarios based modeling of the simultaneous optical to X-ray SED reports both – a continuation of the optical-UV spectrum (synchrotron) into X-ray bands, making the X-ray spectrum relatively flatter/softer (Singh et al., 2022; Pal et al., 2020; Isobe et al., 2001) as well as a sharp steepening of the optical-UV spectrum at (far) UV energies (Singh et al., 2022; Seta et al., 2009).
In the current work, we focus on a detailed spectral investigation of the simultaneous optical to X-ray spectrum of the observed lowest X-ray flux state of OJ 287 by the Swift observatory. The work is organized as follows. In the next section (§2), we present the details of the data and reduction procedure. Section §3 presents the analysis and results reporting an optical-UV synchrotron spectrum extending to X-ray energies and the hardest X-ray spectrum of the source during the lowest X-ray flux state. Section §4 presents the implications of this on particle acceleration scenarios emission mechanisms with a summary in §5.
2 Data Reduction
The Neil Gherels Swift Observatory (Gehrels et al., 2004) is a space-based facility with three primary payloads – X-Ray Telescope (XRT; 0.3 – 10 keV), Ultraviolet Optical Telescope (UVOT), and the Burst Alert Telescope (BAT; 15–150 keV) capable of simultaneously observing optical to hard X-ray band over a wide range of source brightness state. In this work, we used all the pointed XRT and UVOT data of OJ 287222source too faint for spectral/flux studies at BAT energies on ID-wise timescale e.g. Langejahn et al. (2020). till December 2022 (MJD: 53510 – 59940) to perform the spectral study. The dense Swift follow-up since mid-2015 has been carried out by Komossa et al. (2017, 2021)333the project is now called “MOMO” by the PIs.
UVOT: The UVOT data of the source was reduced following the methodology adopted in Kushwaha et al. (2021). We used a circular region for the source and an annular source-free region of inner and outer radii of and respectively for the background, both centred on the source location. We then executed the HEASOFT (v6.30.1) tasks uvotsum and uvotsource to extract the flux density in each filter. The extracted flux densities were subsequently corrected for reddening using an E(B-V) = 0.0241 with the extinction law of Cardelli et al. (1989).
XRT: For the X-ray spectral study, we directly used the scientific grade spectra and respective ancillary files provided by the UKSSDC444https://www.swift.ac.uk/user_objects/. The underlying pipeline corrects for pile-up in both photon counting (PC) and window timing (WT) mode data following the procedure detailed in Evans et al. (2009) and subsequent ongoing updates. For OJ 287, none of the WT mode data requires pile-up treatment (rate c/s) while PC mode data having count rate 0.5 c/s were marked for pile-up correction.
To find the best description of the X-ray spectrum, we followed the approach adopted in Kushwaha et al. (2018b, 2021) using F-test statistics to choose the best-fit description between the absorption (tbabs) modified power-law (PL; ) and log-parabola (LP; ) models. We used a F-test value of 0.01 below which LP is preferred and vice-versa. We binned each source spectral file with a minimum of one count per bin and performed the model fitting (0.3–10 keV) using the with background (W Statistic in ). During the model fitting, we kept all the parameters free initially but froze the nH value to the Galactic column density of (HI4PI Collaboration et al., 2016) in the direction of the source, whenever the fit value was equal or below it. Finally, for spectral study, we corrected all the extracted X-ray SEDs for nH absorption.
3 SED Analysis and results
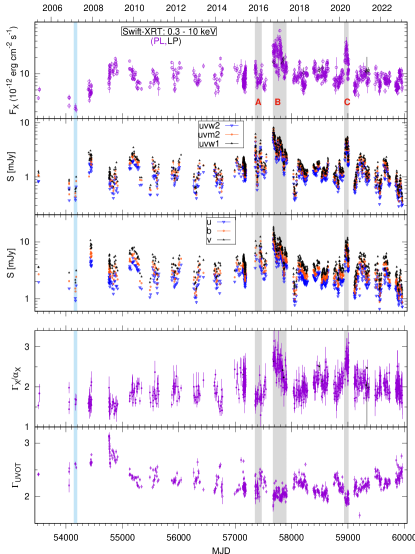
The optical to X-ray light curve and spectral behavior extracted from the Swift facility are shown in Figure 1. The UVOT spectral index is extracted assuming a PL model. The source has undergone a strong flux variation of in X-ray and in UVOT bands between the minimum and maximum during this period. An interesting behavior is the concurrent low-flux state in both optical-UV and X-ray, marked in the cyan-colored band in Fig. 1 (MJD 54160 – 54180) with the lowest X-ray flux within the cadence, statistics, and instrument sensitivity. Later, though optical-UV has even gone below this level, the X-ray has not. Another point to be noted is fewer X-ray points with LP model in Figure 1 compared to our previous work Kushwaha (2022). The difference is due to the F-test probability value used: 0.01 here compared to 0.05 in Kushwaha (2022). We chose a tighter value because the low-flux states –the focus of our study, favor the PL555relaxing F-test value will have no effect on the outcome. It primarily affects the gray shaded part (A, B, C) of Figure 1 model.
Since our focus is the lowest X-ray flux state and synchrotron is known to affect the X-ray spectrum (Singh et al., 2022; Pal et al., 2020; Isobe et al., 2001), we ordered the IDs first by X-ray flux (increasing) and then filtered all the IDs with best-fit X-ray flux within of the lowest X-ray flux (resulting in 4 IDs). Among these, we then looked for the ID with the lowest flux in UVOT bands (ID: 00030901002). The corresponding optical to X-ray SEDs for this is shown in Figure 2.
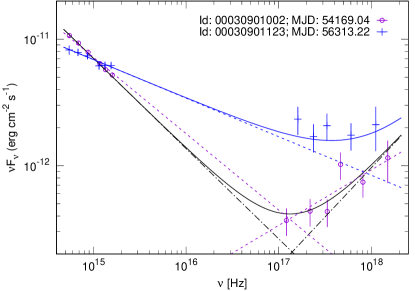
As optical-UV is synchrotron emission, to get the spectral index, we first fitted a PL model to the UVOT SED using statistic in XSPEC. We then extrapolated the best-fit optical-UV spectrum and examined it vis-a-vis the corresponding X-ray spectrum. We found that the UVOT PL fit () extends well into X-ray. Thus, to get the uncontaminated X-ray spectral parameter, we jointly modeled the optical to X-ray spectrum with a two-PL model (redden*powerlaw + tbabs*powerlaw), for the reddening modified optical-UV PL model contribution to X-ray energies. We found a harder X-ray photon spectral index of compared to when fitting X-ray alone.
To further improve the constraint, we jointly modeled all the observation IDs (total 7 IDs) having similar X-ray spectral indices (hard; ). This resulted in an improved constraint of using -statistic for UVOT and at X-rays. We re-checked the result using only -statistic at both optical-UV and X-ray with X-ray binned to a minimum of 20 counts per bin. We got a consistent result (within ; ; 666degree of freedom) but this lacks the lowest X-ray flux state due to insufficient counts. The best-fit model from the lowest X-ray flux state along with data is shown in Figure 2. This is the hardest-ever reported X-ray spectrum (0.3 - 10 keV) for OJ 287 to the best of our knowledge.
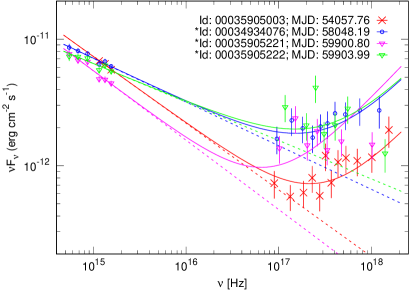
We then explored other low and intermediate X-ray flux states, most of which have a relatively flatter X-ray spectrum () and found that this inferred hard X-ray spectrum without or with variation of normalization along with the respective optical-UV spectrum can naturally explain a majority of the observed flat X-ray spectrum of the LBL phase of the source. A subset of such IDs, representative of the different X-ray spectra exhibited by the source are shown in Figures 2 and 3. We also found that a few are indeed different spectrally. These and the observation-IDs requiring change of normalization of the inferred hard X-ray spectrum are marked with ’’ in Figure 3.
4 Discussion
We found an extended optical-UV synchrotron spectrum (), continuing into X-rays during a period with concurrent dip in optical-UV and X-ray flux (MJD: 54160 – 54180; cyan band in Fig. 1), corresponding to the lowest reported X-ray flux within the Swift cadence. Accounting for this contribution at X-rays, we found a hard X-ray spectrum with photon spectral index (0.3-10 keV; ref Fig. 2), the hardest ever reported from the study of simultaneous optical to X-ray spectrum of OJ 287. This is in contrast to the bright/active state optical X-ray SEDs of the source where the X-ray spectrum generally implies a cutoff or sharp steepening of the optical-UV synchrotron spectra in the (far) UV region (e.g. Singh et al., 2022; Seta et al., 2009). This X-ray spectrum is consistent with the spectrum reported in the hard X-ray band from Swift-BAT measurement (50-300 keV; Langejahn et al., 2020). We further found that a majority of the flat X-ray spectra during the low and intermediate X-ray flux states can be naturally explained by simply adding the inferred hard X-ray spectrum with the respective optical-UV spectrum either originally or with a variation of the normalization (ref Figs. 2 and 3). A few cases, however, indeed have different spectrum (refer to Fig. 3).
Blazar optical continuum is well-understood to be synchrotron and thus, the observed spectrum directly traces the underlying particle spectrum. The same holds for the IC spectrum i.e. X-ray, if its away from the peak and IC happens in the Thomson regime. For a power-law particle distribution of spectral index (), the observed radiation energy spectrum is . OJ 287 being an LBL source, the X-ray is a good tracer of the low-energy part while the optical-UV directly traces the high-energy part of the broken power-law particle distribution required for broadband SED modeling (e.g. Singh et al., 2022). The reported optical to X-ray spectrum corresponding to the lowest X-ray flux thus implies a hard low-energy particle spectrum of and a high-energy spectrum of .
For blazar’s synchrotron spectrum, the observed frequency is related to the rest frame via where is the Larmor frequency, is the electron Lorentz factor, and is the bulk Doppler factor. Further, , depends solely on the magnetic field, B. Thus for a given B and , the extent of the spectrum depends on the Lorentz factor (energies) of the particles. Since X-ray lies at the tail of the high-energy synchrotron spectrum, the combined optical to X-ray spectrum thus provides a potential direct tracer of the extent of the high-energy particle spectrum. The finding of an extended optical-UV synchrotron spectrum reported here clearly indicates a much extended high-energy particle spectrum compared to the bright X-ray phases of the source. On the other hand, the natural explanation of most of the flat X-ray spectra associated with the low and intermediate X-ray flux states of the LBL/LSP state of the source by adding the high-energy synchrotron tail to the lowest hard X-ray spectrum further strengthens previous claims/finding that most of the X-ray spectral changes are due to optical-UV synchrotron spectrum (Singh et al., 2022).
The relativistic particle spectrum has two main ingredients – the spectral index and the extent (energy-limits) of the spectrum. The spectral index is related to the particle acceleration processes and the extent of the spectrum is related to the size of the acceleration region – the Hilas energy criteria (Hillas, 1984). The reported extended high-energy spectrum implies a comparatively larger acceleration/emission region compared to the flaring states that in general indicate a steepening or cutoff. The inference is also consistent with short variability timescales, indicating a compact emission region during flares. Indirectly the larger acceleration/emission region could possibly be the large-scale jet emission. Since the reported hard X-ray is sum of synchrotron tail and IC – mostly of the low-energy part of particle distribution, a harder spectrum at X-ray may not be a direct reflection of harder particle spectrum but can also result from a higher-lower-energy cutoff of the underlying particle spectrum (Inoue & Takahara, 1996) – consistent with a larger acceleration/emisison region argued above. But if its actual then the lower-limit of the hard particle spectrum indicates magnetic reconnection as the most likely driver (e.g. Guo et al., 2014) while the upper-limit appears consistent with the shock scenario (Malkov & Drury, 2001).
Though OJ 287 has been studied extensively at all wavelengths, and especially at optical and X-rays, most of the studies focusing on the latter have separately explored optical-UV and X-rays (e.g. Siejkowski & Wierzcholska, 2017; Kushwaha et al., 2021; Komossa et al., 2022, and references therein) or the X-ray flux have been comparatively higher (e.g. Singh et al., 2022; Seta et al., 2009). Given the blazar broadband emission, a consideration of all likely processes is a must to gain further insight into the source behavior and thus, the jet physics, extra/hidden emission components, etc. A detailed outcomes of this systematic analysis will be will be presented in the accompanying paper (Kushwaha, 2023, in preparation).
5 Summary and Conclusions
We explored the simultaneous optical to X-ray observations (spectra) of the BL Lacertae object OJ 287 by the Neils Geherel’s Swift Observatory to date with a focus on the lowest X-ray state and found a power-law optical-UV synchrotron continuum of photon spectral index that extends to X-ray energies. Modeling the corresponding X-ray spectrum accounting synchrotron component contribution, we found a hard 0.3-10 keV X-ray spectrum with . This is harder than the reported hardest spectrum () considering only the X-ray data and is consistent with the hard X-ray spectrum reported from the Swift-BAT data (20-100 keV). The optical-UV directly traces the underlying high-energy particle spectrum with a PL spectrum of while X-ray implies a harder PL spectrum of . The harder spectrum in the latter case may not be real and could result from a comparatively higher lower-energy-cutoff in the particle spectrum.
The reported hard X-ray can naturally explain most of the observed flat X-ray spectra when combined with the corresponding optical-UV spectrum, The finding further strengthens previous claim that most of the flat X-ray spectra of the source in the LBL/LSP spectral phase of the source are due to the optical-UV synchrotron spectrum extending to X-ray energies.
The extended optical-UV spectrum implies an extended high-energy particle spectrum, and thus, a relatively large acceleration/emission region size per the Hilas criteria and is consistent also with the indication of a comparatively higher lower-energy-cutoff in the particle spectrum implied from the hard X-ray spectrum. The larger size suggests the inferred low-emission component could possibly be associated with the large-scale jet.
Acknowledgments
The author thank the anonymous referees for valuable inputs and suggestions.
The author acknowledges financial support from the Department of Science and Technology (DST), Government of India, through the DST-INSPIRE faculty grant (DST/
INSPIRE/04/2020/002586). This work made use of data supplied by the UK Swift
Science Data Centre at the University of Leicester.
Facilities: Swift.
Software: Gnuplot (version: 5.2; http://www.gnuplot.info/), SHERPA,
HEASOFT
References
- Abdo et al. (2010) Abdo, A. A., Ackermann, M., Agudo, I., et al. 2010, ApJ, 716, 30, doi: 10.1088/0004-637X/716/1/30
- Brien & VERITAS Collaboration (2017) Brien, S. O., & VERITAS Collaboration. 2017, in International Cosmic Ray Conference, Vol. 301, 35th International Cosmic Ray Conference (ICRC2017), 650, doi: 10.22323/1.301.0650
- Cardelli et al. (1989) Cardelli, J. A., Clayton, G. C., & Mathis, J. S. 1989, ApJ, 345, 245, doi: 10.1086/167900
- Dey et al. (2018) Dey, L., Valtonen, M. J., Gopakumar, A., et al. 2018, ApJ, 866, 11, doi: 10.3847/1538-4357/aadd95
- Evans et al. (2009) Evans, P. A., Beardmore, A. P., Page, K. L., et al. 2009, MNRAS, 397, 1177, doi: 10.1111/j.1365-2966.2009.14913.x
- Fossati et al. (1998) Fossati, G., Maraschi, L., Celotti, A., Comastri, A., & Ghisellini, G. 1998, MNRAS, 299, 433, doi: 10.1046/j.1365-8711.1998.01828.x
- Gao et al. (2018) Gao, S., Fedynitch, A., Winter, W., & Pohl, M. 2018, Nature Astronomy, 154, doi: 10.1038/s41550-018-0610-1
- Gehrels et al. (2004) Gehrels, N., Chincarini, G., Giommi, P., et al. 2004, ApJ, 611, 1005, doi: 10.1086/422091
- Goyal et al. (2018) Goyal, A., Stawarz, Ł., Zola, S., et al. 2018, ApJ, 863, 175, doi: 10.3847/1538-4357/aad2de
- Guo et al. (2014) Guo, F., Li, H., Daughton, W., & Liu, Y.-H. 2014, Phys. Rev. Lett., 113, 155005, doi: 10.1103/PhysRevLett.113.155005
- Gupta et al. (2017) Gupta, A. C., Agarwal, A., Mishra, A., et al. 2017, MNRAS, 465, 4423, doi: 10.1093/mnras/stw3045
- Gupta et al. (2019) Gupta, A. C., Gaur, H., Wiita, P. J., et al. 2019, AJ, 157, 95, doi: 10.3847/1538-3881/aafe7d
- Hayashida et al. (2015) Hayashida, M., Nalewajko, K., Madejski, G. M., et al. 2015, ApJ, 807, 79, doi: 10.1088/0004-637X/807/1/79
- HI4PI Collaboration et al. (2016) HI4PI Collaboration, Ben Bekhti, N., Flöer, L., et al. 2016, A&A, 594, A116, doi: 10.1051/0004-6361/201629178
- Hillas (1984) Hillas, A. M. 1984, ARA&A, 22, 425, doi: 10.1146/annurev.aa.22.090184.002233
- Huang et al. (2021) Huang, S., Hu, S., Yin, H., et al. 2021, ApJ, 920, 12, doi: 10.3847/1538-4357/ac0eff
- Inoue & Takahara (1996) Inoue, S., & Takahara, F. 1996, ApJ, 463, 555, doi: 10.1086/177270
- Isobe et al. (2001) Isobe, N., Tashiro, M., Sugiho, M., & Makishima, K. 2001, PASJ, 53, 79, doi: 10.1093/pasj/53.1.79
- Komossa et al. (2017) Komossa, S., Grupe, D., Schartel, N., et al. 2017, in New Frontiers in Black Hole Astrophysics, ed. A. Gomboc, Vol. 324, 168–171, doi: 10.1017/S1743921317001648
- Komossa et al. (2021) Komossa, S., Grupe, D., Parker, M. L., et al. 2021, MNRAS, 504, 5575, doi: 10.1093/mnras/stab1223
- Komossa et al. (2022) Komossa, S., Grupe, D., Kraus, A., et al. 2022, MNRAS, 513, 3165, doi: 10.1093/mnras/stac792
- Kushwaha (2022) Kushwaha, P. 2022, Journal of Astrophysics and Astronomy, 43, 79, doi: 10.1007/s12036-022-09872-1
- Kushwaha (2023) —. 2023, in prep
- Kushwaha et al. (2021) Kushwaha, P., Pal, M., Kalita, N., et al. 2021, ApJ, 921, 18, doi: 10.3847/1538-4357/ac19b8
- Kushwaha et al. (2018a) Kushwaha, P., Gupta, A. C., Wiita, P. J., et al. 2018a, MNRAS, 473, 1145, doi: 10.1093/mnras/stx2394
- Kushwaha et al. (2018b) —. 2018b, MNRAS, 479, 1672, doi: 10.1093/mnras/sty1499
- Langejahn et al. (2020) Langejahn, M., Kadler, M., Wilms, J., et al. 2020, A&A, 637, A55, doi: 10.1051/0004-6361/202037469
- Malkov & Drury (2001) Malkov, M. A., & Drury, L. O. 2001, Reports on Progress in Physics, 64, 429, doi: 10.1088/0034-4885/64/4/201
- Murase & Bartos (2019) Murase, K., & Bartos, I. 2019, Annual Review of Nuclear and Particle Science, 69, 477, doi: 10.1146/annurev-nucl-101918-023510
- Nilsson et al. (2010) Nilsson, K., Takalo, L. O., Lehto, H. J., & Sillanpää, A. 2010, A&A, 516, A60, doi: 10.1051/0004-6361/201014198
- Pal et al. (2020) Pal, M., Kushwaha, P., Dewangan, G. C., & Pawar, P. K. 2020, ApJ, 890, 47, doi: 10.3847/1538-4357/ab65ee
- Seta et al. (2009) Seta, H., Isobe, N., Tashiro, M. S., et al. 2009, Publications of the Astronomical Society of Japan, 61, 1011, doi: 10.1093/pasj/61.5.1011
- Siejkowski & Wierzcholska (2017) Siejkowski, H., & Wierzcholska, A. 2017, MNRAS, 468, 426, doi: 10.1093/mnras/stx495
- Singh et al. (2022) Singh, K. P., Kushwaha, P., Sinha, A., et al. 2022, MNRAS, 509, 2696, doi: 10.1093/mnras/stab3161
- Sitko & Junkkarinen (1985) Sitko, M. L., & Junkkarinen, V. T. 1985, PASP, 97, 1158, doi: 10.1086/131679