Computational study of structural, elastic, electronic, phonon dispersion relation and thermodynamic properties of orthorhombic CaZrS3 for optoelectronic applications
Abstract
Chalcogenide perovskites offer superior thermal and aqueous stability as well as a benign elemental composition compared to organic halide perovskites for optoelectronic applications. In this study, the structural, electrical, elastic, phonon dispersion, and thermodynamic features of the orthorhombic phase of chalcogenide perovskite CaZrS3 (space group Pnma) were examined by first principles calculations utilizing the plane wave pseudopotentials (PW-PPs) in generalized gradient approximations (GGA). The ground state properties such as lattice parameters, unit cell volume, bulk modulus, and its derivative were calculated and are in a good agreement with existing findings. The mechanical properties such as bulk modulus, shear modulus, Young’s modulus and elastic anisotropy were calculated from the obtained elastic constants. The ratio of bulk modulus to shear modulus confirms that the orthorhombic phase of CaZrS3 is a ductile material. The absence of negative frequencies in phonon dispersion curve and the phonon density of states give an indication that the structure is dynamically stable. Finally, thermodynamic parameters such as free energy, entropy, and heat capacity were calculated with variation in temperature. The estimated findings follow the same pattern as previous efforts.
Key words: CaZrS3, electronic property, mechanical property, phonon dispersion, thermodynamic property
Abstract
Õàëüêîãåíiäíi ïåðîâñêiòè çàáåçïåчóþòü âiäìiííó òåðìiчíó òà âîäíó ñòiéêiñòü, à òàêîæ äîáðîÿêiñíèé åëåìåíòíèé ñêëàä äëÿ îïòîåëåêòðîííèõ çàñòîñóâàíü ó ïîðiâíÿííi ç îðãàíiчíèìè ãàëîãåíiäíèìè ïåðîâñêiòàìè. Ó äàíié ðîáîòi ñòðóêòóðíi, åëåêòðèчíi, ïðóæíi, òåðìîäèíàìiчíi õàðàêòåðèñòèêè òà ôîíîííà äèñïåðñiÿ îðòîðîìáiчíî¿ ôàçè õàëüêîãåíiäíîãî ïåðîâñêiòó CaZrS3 (ïðîñòîðîâà ãðóïà Pnma) äîñëiäæóâàëèñÿ çà äîïîìîãîþ ïåðøîïðèíöèïíèõ ðîçðàõóíêiâ iç âèêîðèñòàííÿì ïñåâäîïîòåíöiàëiâ ïëîñêî¿ õâèëi â óçàãàëüíåíèõ ãðàäiєíòíèõ íàáëèæåííÿõ. Áóëè îáчèñëåíi òàêi âëàñòèâîñòi îñíîâíîãî ñòàíó, ÿê ïàðàìåòðè ґðàòêè, îá’єì åëåìåíòàðíî¿ êîìiðêè, ìîäóëü âñåñòîðîííüîãî ñòèñêó òà éîãî ïîõiäíà, ùî äîáðå óçãîäæóþòüñÿ ç ðåçóëüòàòàìè, íàÿâíèìè â íàóêîâié ëiòåðàòóði. Ìåõàíiчíi âëàñòèâîñòi, òàêi ÿê ìîäóëi âñåñòîðîííüîãî ñòèñêó i çñóâó, ìîäóëü Þíãà òà ïðóæíà àíiçîòðîïiÿ, áóëè ðîçðàõîâàíi íà îñíîâi îòðèìàíèõ êîíñòàíò ïðóæíîñòi. Çíàчåííÿ чàñòêè ìîäóëÿ âñåñòîðîííüîãî ñòèñêó òà ìîäóëÿ çñóâó ïiäòâåðäæóє, ùî îðòîðîìáiчíà ôàçà â CaZrS3 є ïëàñòèчíèì ìàòåðiàëîì. Âiäñóòíiñòü âiä’єìíèõ чàñòîò íà êðèâié ôîíîííî¿ äèñïåðñi¿ òà ôîíîííà ãóñòèíà ñòàíiâ âêàçóþòü íà òå, ùî öÿ ñòðóêòóðà є äèíàìiчíî ñòiéêîþ. Íàñàìêiíåöü, áóëè îáчèñëåíi òàêi òåðìîäèíàìiчíi ïàðàìåòðè, ÿê âiëüíà åíåðãiÿ, åíòðîïiÿ òà òåïëîєìíiñòü â çàëåæíîñòi âiä òåìïåðàòóðè. Ðåçóëüòàòè ïðîâåäåíèõ îöiíîê âèÿâëÿþòü òàêi æ çàêîíîìiðíîñòi, ÿê i ïîïåðåäíi.
Ключовi слова: CaZrS3, åëåêòðîííi âëàñòèâîñòi, ìåõàíiчíi âëàñòèâîñòi, äèñïåðñiÿ ôîíîíiâ, òåðìîäèíàìiчíi âëàñòèâîñòi
1 Introduction
The quest for technological advancement, particularly in the field of semiconductors, plays a significant role in several optoelectronic, photonic, and energy technologies. Among current semiconductors, the prevailing materials like silicon, group III–V, and group II–VI are typically constructed by a fourfold coordinated tetrahedral network of covalent bonds. There have been major successes in developing solar cell semiconductor materials such as Si, GaAs, CuInxGa1-xSe2 (CIGS), and lead halide perovskite based materials [1, 2, 3]. Over the past decades, inorganic-organic/organometal lead halides have been extensively studied since the early 20th century [4, 5]. In 1970, for the first time, Weber reported the synthesis and physical properties of CH3NH3PbX (X Cl, Br, I) organometal lead halide perovskite [4]. During this time, the organometal lead halide perovskites emerged as a candidate and very promising materials for light harvesting in the solar cell as reported in 2009 [5]. The latest area in solar cell materials is the organic-inorganic hybrid lead (Pb) halide perovskites, for which the efficiency reached 22.7 in 2018 [3], starting from 3.8 in 2009 [5].These hybrid perovskites, however, have poor thermal and moisture stability, as well as the presence of lead toxicity [6]. The intrinsic poor long-term stability of CH3NH3PbI3-based perovskite solar cells, as well as the presence of toxicity, has hindered their industrial application and commercialization. Inorganic lead-free perovskites have recently been widely investigated to address these issues. Recently, chalcogenide perovskites have received attention due to their promising photovoltaic and thermoelectric properties, with initial studies conducted on oxide perovskites that have good band gaps for optical absorption [7]. Chalcogenide perovskites assume an ABX3 configuration with A, and B are elements with a combined valence of 6 (with different valences), while X is typically S or Se. These materials belong to a new class of ionic semiconductors. The band gap of these materials can be systematically tuned in a wide range from ultra-violet to infrared. Due to their predicted strong iconicity, they may exhibit unique physical properties such as being free of deep-level defects, which is beneficial for energy harvesting and other optoelectronic applications [8]. It should be emphasized that oxide perovskites, with a chemical formula ABO3, have long been a focus of active research. This family of materials exhibits unusually rich properties ranging from colossal magnetoresistance, ferroelectricity to superconductivity and charge density waves, resulting from the interplay of different degrees of freedom with similar energy scales. The intriguing physics of their chalcogenide counterparts, however, is largely unexplored [8].
In recent years, theoretical calculations based on the density functional theory (DFT) have been used to reveal and predict the structural, mechanical, electrical, optical, and thermal properties of crystal materials. CaZrS3, which is the focus of this work, is a family of chalcogenide perovskite crystal material that was considered theoretically for optoelectronic applications [8, 9, 10, 11, 12]. The relaxed lattice parameters and band gap of CaZrS3 were estimated using DFT as implemented in VASP and the Perdew, Burk, and Ernzerhof (GGA-PBE) generalized gradient approximation [13]. In addition, the lattice parameter and the band gap of CaZrS3 were also calculated using the FPLAPW method with DFT as implemented in WIEN2K, approximating the exchange correlation potential with PBE-GGA, Engel-Vosko (EV) method and Hubbard parameter (GGA+U) [12]. However, to our knowledge, the structural, elastic, electronic, phonon dispersion and thermodynamic properties of CaZrS3 are not yet well investigated for optoelectronic application. Moreover, investigation of elastic, phonon dispersion and thermodynamic properties of CaZrS3 using the first principle computational methods remains unexplored. In this paper, the structural, elastic, electronic, and phonon dispersion relation and thermal properties of CaZrS3 are carefully examined. The electronic properties are calculated by considering PBE-GGA [14] and also DFT with the Hubbard functional (DFT+U) [15] for exchange correlation potential using Quantum ESPRESSO package (QE). In addition, phonon dispersion and the thermodynamic properties of CaZrS3 are studied using a (in , , and direction, respectively) supercell containing 40 atoms created in a PHONOPY package [16].
2 Computational methods
In this study, the DFT as implemented in the QE [17] within the generalized gradient approximation (GGA) functional [14] and with the Hubbard correction (DFT+U) [15] was used. The effective Hubbard parameter () was calculated iteratively for Zr- orbitals. For this study, a cell with 20 atoms (4-Ca, 4-Zr, and 12-S) in orthorhombic phase for structural, elastic and electronic property calculations was used. The ultra-soft pseudopotentials (US-PP) were used to treat the interaction of the electrons with the ion cores as in [18]. The corresponding valence electrons considered for the calculations are Ca — [Ar], Zr — [Kr], and S — [Ne]. Crystal structure optimization was done using a plane wave cutoff energy of 60 Ry and the Brillouin zone with a Monkhorst-Pack -point grid [19] based on the convergence criteria energy Ry, force Ry/Bohr, and cell pressure 0.5 kbar. Using the optimized structure, the elastic properties were calculated by THERMO_PW package within Quantum ESPRESSO package [17]. In addition, the thermal properties were calculated with the help of PHONOPY package [16]. To study the phonon dispersion relation and thermodynamic properties of CaZrS3, a supercell of in , , and direction with 40 atoms was created and used for computations.
3 Results and discussion
3.1 Crystal structure
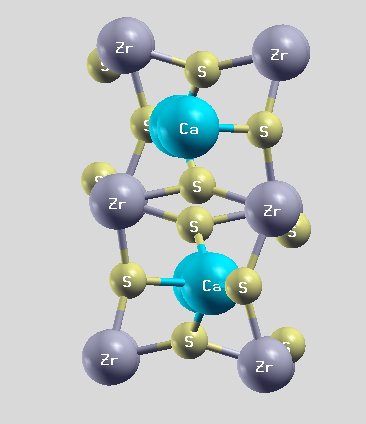
Most of the material properties are governed by their crystal structures. A stable crystal structure is the one with the lowest energy arrangement of atoms at a given temperature and pressure [20]. In this study, an orthorhombic phase of CaZrS3 [space group (62) point group ] with the crystallographic structure of GdFeO3-type was considered. Each Ca atom is centrally located in the spatial region defined by its neighbouring S and Zr atoms in the lattice, which is composed of distorted ZrS6 corner-sharing octahedral as visualized in figure 1. The ionic components are Ca+2, Zr+4 and S-2 ions.
The structural stability of perovskite materials in general is determined by the Goldschmidt tolerance factor [13],
| (3.1) |
where and are ionic radii for Ca+2, Zr+4 and S-2 ions, respectively. The sizes of the ions are known to have a major influence on the structural distortion of perovskites. Thus, materials with a tolerance factor of result in a distorted perovskite structure with tilted octahedral, while for the materials have an ideal cubic structure, and when the tolerance factor is much higher () or lower (), non-perovskite structures are commonly formed [21, 22]. The ionic radii of Ca, Zr and S, and the calculated tolerance factor CaZrS3 are shown in table 1. Here, since the calculated value falls within a distorted perovskite range, CaZrS3 stability is defined, and Pnma symmetry is adopted.
| Ions | Radius (Å) | Tolerance factor |
|---|---|---|
| Ca+2 | 1.00 | |
| Zr+4 | 0.79 | 0.76 |
| S-2 | 1.84 |
Here, for structural optimization of CaZrS3, the values of cutoff energy and -point grid size obtained from the convergence test were utilized. Structural optimization was performed setting the convergence criteria; change in energy, Ry and change in force, Ry/Å. The optimized equilibrium lattice constants were , , and . These values are in good agreement with the theoretical and experimental values, as summarized in table 2. Moreover, a series of strained lattices were used to calculate the static lattice potential corresponding to total energy. From these results, the equilibrium unit cell volume, bulk modulus, and its pressure derivative can be calculated. A series of total energy calculations as a function of volume can be fitted to an equation of state (EOS) according to Murnaghan [23]:
| (3.2) |
where is an equilibrium bulk modulus that effectively measures the curvature of the energy versus volume curve about the relaxed volume , and is the derivative of the bulk modulus.
The calculated values of the bulk modulus, equilibrium unit cell volume and the dimensionless bulk modulus derivative of CaZrS3 are given in table 2. The calculated values of the unit cell volume and bulk modulus are in a good agreement with the experimental and the previous theoretical values, respectively as shown in table 2.
| Source | Lattice parameter (Å) | Vol (Å | (GPa) | |||
| a | b | c | ||||
| The calculated value | 6.57 | 7.06 | 9.63 | 447.78 | 81.8 | 4.09 |
| Theory [10]a | 7 .0856 | 9.6647 | 6.5588 | 449.1479 | 82.4513 | 4.1716 |
| [10]b | 7.0719 | 9.6611 | 6.5817 | 449.6771 | 105.7320 | |
| [13]c | 6.56 | 7.06 | 9.63 | |||
| [11]c | 7.02 | 6.47 | 9.53 | |||
| [12]c | 7.07 | 9.63 | 6.57 | |||
| Experimental [24] | 7.03 | 6.54 | 9.59 | |||
| [21] | 7.03 | 9.59 | 6.54 | 440.66 | ||
| a(FP-LAPW method) DFT implemented in WIEN2K. | ||||||
| b(PP-PW method) DFT implemented in WIEN2K. | ||||||
| c(PAW method) DFT implemented in VASP. | ||||||
3.2 Elastic properties
Mechanical properties
The elastic constant of crystals gives fundamental information for the study of mechanical characteristics of materials, as they are related to the mechanical properties of the material such as the elastic moduli, Poisson’s ratio, and elastic anisotropy factor of materials. To calculate the elastic constants, we applied the non-volume-conserving method. The complete elastic constant tensor was determined from calculations of the stresses induced by small deformations of the equilibrium primitive cell. The elastic constant tensors are given by [25, 26, 27];
| (3.3) |
where stands for the Helmholtz free energy, and are the applied stress and Eulerian strain tensors, and stands for the coordinates.
In this case, for orthorhombic system, there are nine independent elastic constants that should satisfy the well-known Born stability criteria [28].
| (3.4) |
The calculated elastic constants (table 3) satisfy the mechanical stability conditions above and , and .
| The calculated | 120.9 | 59.4 | 38.5 | 155.47 | 36.91 | 146.5 | 44.5 | 28.6 | 51.4 |
| value |
Using the Voigt-Reuss-Hill (VRH) average approximation, mechanical parameters such as the Young modulus (), Poisson’s ratio () and shear modulus () are computed from the calculated elastic constants as [28, 29], the elastic constants and calculated mechanical properties from the elastic constants are shown in table 3 and table 4, respectively.
| The calculated | 76.36 | 42.73 | 1.78 | 108.04 | 0.26 | 0.35 |
| value |
Bulk modulus is an essential physical parameter in describing the compressibility of solids under the hydrostatic pressure. Large value of bulk modulus results in higher compressibility of a solid material. The Bulk modulus value (76.36 GPa) calculated from elastic constants is found to be close to the value calculated from the equation of state (81.8 GPa) as in table 2. The shear modulus is another important parameter that can describe the shape change under the shear force. The larger the shear modulus is, the higher is the shape change resistance of the solid material. The calculated value of the shear modulus is 42.73 GPa and it is comparable to the value obtained by [10]. Furthermore, determining the ratio of is important for understanding the brittle and ductile behavior of materials in the material fabrication. The ductility and brittleness of materials can be determined based on the value of ratio according to Pugh [30]. The cutoff value is 1.75. When , the material behaves in a ductile manner, otherwise, it exhibits brittle properties. From table 4, our calculated ratio for value is 1.78 for CaZrS3 in GdFeO3-type phase, showing that CaZrS3 in this phase is ductile. Another mechanical parameter that provides information about the feature of the bonding forces is Poisson’s ratio (). In the evaluation of Poisson’s ratio, the values 0.25 and 0.5 are the lower and upper limits of the central force, respectively [31]. From table 4, the calculated Poisson’s ratio () is 0.26 (which is between 0.25 and 0.5) indicating that the inter-atomic forces are central.
The universal anisotropic index [] is a measure to define the elastic anisotropic or isotropic characteristics based on the contributions of both bulk and shear modulus [32]. It is one of the important physical parameters used to study the service life time of materials. The material is isotropic if the value of ; otherwise it () refers to the anisotropic mechanical properties. Any value smaller or greater than zero represents a higher extent of anisotropy. Based on this, for orthorhombic phase of CaZrS3, the calculated value for is 0.35, indicating that the CaZrS3 was found to be anisotropic.
Debye temperature
The thermal properties of a solid material are related to two physical parameters: Debye temperature () and melting temperature , respectively. The Debye temperature is another essential physical term that can be used to characterize solid-state physics phenomena such as lattice vibration, elastic constants, specific heat, and melting point. The magnitude of the Debye temperature is helpful to know the thermal conductivity of solid materials. The higher the value of the Debye temperature is, the higher is its thermal conductivity. The Debye temperature () of CaZrS3 can be estimated from the averaged sound velocity, , given by [33],
| (3.5) |
where is Plank’s constant, is Boltzmann’s constant, is Avogadro’s number, is density, is molecular weight, is the number of atoms in a formula unit, is the longitudinal sound velocity, and is the transverse sound velocity. The longitudinal and transverse sound velocities can be obtained from density, shear and bulk modulus of the material as:
| (3.6) |
Moreover, the Debye average sound velocity which represents the maximum frequency of the material is described by . The melting point of a material depends on Debye temperature; a larger Debye temperature of the material shows a higher melting temperature [34]. The melting temperature of a stable phase of CaZrS3 can be determined based on an elastic constant using [35],
| (3.7) |
The calculated values of longitudinal sound velocity, transverse sound velocity and Debye temperature for CaZrS3 are given in table 5. It was observed that the calculated values for Debye temperature and melting point are 415.5 K, and 1267.6 K, respectively.
| (gcm-3) | (m/s) | (m/s) | (m/s) | (m/s) | (K) | (K) | |
|---|---|---|---|---|---|---|---|
| The calculated value | 3.4826 | 6283.72 | 3557.14 | 3759.0 | 3932.83 | 415.5 | 1267.6 |
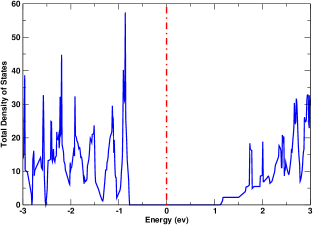
3.3 Electronic properties: density of states (DOS) and band structure
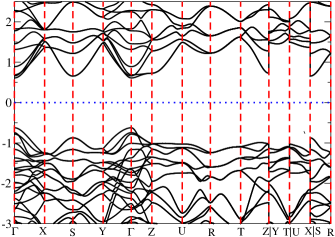
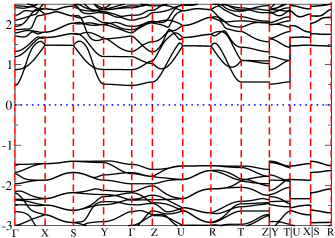
The energy band structure and density of states of materials are used to determine the electronic properties of solid materials. The accessible electronic energy levels of solid materials are represented by electronic band structures. In this study, the electronic band structure along the high symmetry direction of the Brillouin zone was estimated using the GGA-PBE functional and the Hubbard correction (GGA+U) for exchange correlation potential, as shown in figure 2. The GGA-PBE functional fails to approximate the exact exchange correlation potential, since the band gap value obtained by approximating the exchange correlation potential with GGA-PBE functional is 1.23 eV (table 6), which appears to be underestimated as compared to experimental band gap values of 1.90 eV [8, 24]. Furthermore, the band gap was calculated with the Hubbard correction for on-site interaction, yielding a band gap of 1.88 eV, which is close to the experimental result [8, 24].
| Source | GGA-PBE | HSE06 | GGA+U |
|---|---|---|---|
| The calculated value | 1.23 | 1.88 | |
| Theory [13] | 1.24 | 2.04 | |
| [11] | 2.22 | ||
| Experimental [8, 24] | 1.90 |
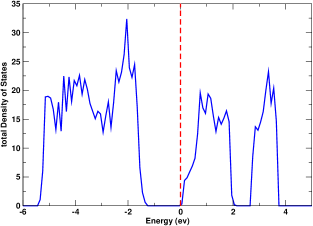
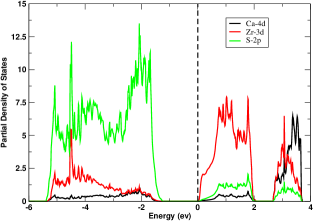
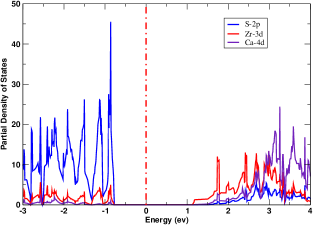
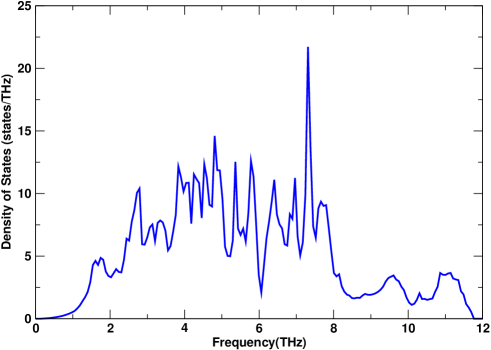
The DOS is also used to describe how state occupancy behaves at different energy levels. It provides information on both occupied and empty states. The states that are available for occupancy have a high DOS at a certain energy level. However, there is no state occupied at DOS equal to zero. In this study, the total and partial densities of states were obtained for the equilibrium states of the phases using GGA-PBE correlation interaction and also with GGA+U as shown in figure 3 and figure 4. The density of states is discontinuous for the width from the top of the valence band to the bottom of the conduction band which is normally refered to the band gap of the system. Moreover, figure 4 shows that the maximum valence band is mainly contributed by S- orbitals and the minimum conduction band is mainly dominated by Zr- orbitals. On the other hand, Ca- orbitals are observed on both maximum valence and minimum conduction bands, and the rest of the orbitals have a small contribution.
3.4 Phonon dispersion relation
Phonon vibration plays an essential role in dynamic behaviors and in thermal properties, which are central topics in fundamental issues of materials science. The phonon frequency of crystalline structures is one of the fundamental aspects when considering the phase stability, phase transformations, and thermodynamics of these materials. The phonon density of states is given by [36, 37]
| (3.8) |
where is the number of unit cells in a crystal. Divided by , is normalized so that the integral over frequency becomes , where is the number of atoms.
Considering the atom specific phonon density of states projected along a unit direction vector , is defined as [37]
| (3.9) |
From the canonical distribution in statistical mechanics for phonons under the harmonic approximation, the energy of the phonon system is given as
| (3.10) |
where , and are the temperature, the Boltzmann constant, and the reduced Planck constant, respectively. Here, from statistical mechanics, gives the mean phonon number distribution function.
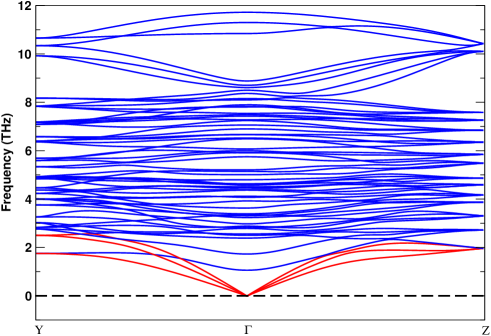
A supercell of (in , , and -direction) containing 40 atoms was created to study the phonon dispersion relation for CaZrS3, using a PHONOPY package with Quantum ESPRESSO package as implemented in [16]. It is known that a crystal constituent of 40 atoms in bulk system (three dimensions , , coordinates) has 120 degrees of freedom (, where is the number of atoms). The phonon dispersion relation for frequency bands and frequency density of states were calculated and displayed as shown in figure 5 and figure 6, respectively. As indicated in figure 5, it was observed that there are three (3) acoustic branches and 117 optical branches () mode of vibrations. Here, also the results showed that CaZrS3 possesses no imaginary phonon frequency modes. Hence, it is structurally and lattice dynamically stable. This finding agrees with the results of the analysis of the elastic constants and Goldschmidt tolerance factor.
3.5 Thermodynamic properties
Thermodynamic properties of materials are one of the foundations of solid-state science and industry. The investigation of these properties is important in order to determine their specific behavior when these materials are subjected to high pressure and temperature. Using the thermodynamic relations, a number of thermal properties, such as constant volume heat capacity , Helmholtz free energy , and entropy , can be computed as functions of temperature as [26, 36, 38]
| (3.11) |
| (3.12) |
| (3.13) |
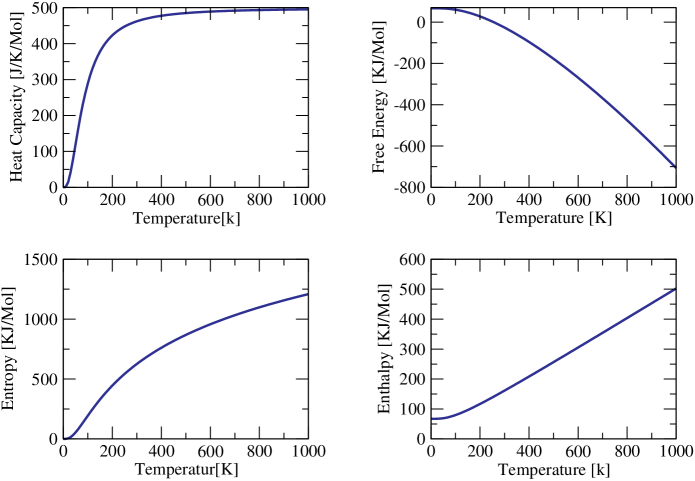
Here also, a supercell of of (in , , and -direction) containing 40 atoms was used to study the thermodynamic properties of CaZrS3, using a PHONOPY package with Quantum ESPRESSO package as implemented in [16]. At finite temperatures ranging from 0 K to 1000 K, thermodynamic parameters such as enthalpy, free energy, entropy, and heat capacity were computed and plotted in figure 7. In this consideration, the volume and temperature are independent variables. From figure 7, one can observe that below 10 K, the values of the entropy and heat capacity are almost zero. The free energy diminishes gradually as the temperature rises, whereas the entropy rises rapidly, following reasonable trends shown in [36, 39, 40]. As a result, the enthalpy increases linearly with the increment of temperature. The increase in enthalpy at high temperatures leads to a decrease in the free energy which is associated with defects. It is clearly observed that for the temperature below 400 K, the heat capacity increases rapidly, whereas for temperature above 400 K it increases slowly (almost increasing linearly) with temperature and gradually approaches the Dulong-Petit limit (classical limit) owing to the anharmonic approximations of the Debye model as observed in [36, 41, 42]. The calculated heat capacity graph is also smooth and continuous confirming that there is no phase change occurring in CaZrS3 up to 1000 K [36].
4 Conclusion
Chalcogenide perovskites have emerged as a non-toxic and stable photovoltaic material that has similar optoelectronic capabilities to lead halide hybrid perovskites. In this study, the first-principles calculations using the Quantum ESPRESSO software package were used to study the structural, electrical, elastic, phonon dispersion relation, and temperature-dependent thermodynamic characteristics of orthorhombic CaZrS3 for optoelectronic applications. The THERMO_PW package was used to compute the elastic characteristics of the material using the optimized structure. The PHONOPY package was also used to calculate the phonon dispersion and thermal characteristics. The computed lattice parameters , , and correspond well to theoretical and experimental results. The elastic constants were used to calculate mechanical parameters of CaZrS3, such as the bulk modulus, shear modulus, Young’s modulus, and elastic anisotropy. CaZrS3 was found to be classified as a ductile material according to the determined value of ratio (1.78). Poisson’s ratio obtained the value of 0.26, indicating that interatomic forces are central. The measured global anisotropic index value of 0.35 validates the anisotropic nature of CaZrS3. The band gap value of CaZrS3 was calculated by approximating the exchange correlation potential with GGA/PBE and GGA+U. The band gap value calculated using GGA/PBE is 1.23 eV, which is percent less than the experimental result. However, the computed band gap value using GGA+U is 1.88 eV, which is close to the experimental band gap value. The absence of imaginary (negative frequencies in the figures) frequencies in phonon dispersion curve and the phonon density of states give an indication that the structure is dynamically stable. The temperature dependence of thermodynamic parameters including enthalpy, entropy, free energy, and heat capacity is calculated and analyzed.
Funding
Funding: This study was funded by College of Natural Sciences for supporting PhD student (grant number: CNSPHYS-04-2021/2022), and also supported by subsidy fund by Arba Minch University (under project: Gov/AMU/TH3/CNS/phy/01/14).
Acknowledgement
One of the authors, Mulugetta Duressa Kassa, expresses his thanks and appreciation to the Department of Physics, College of Natural Sciences, Jimma University, for providing financial suport for this study and Prof. Omololu Akin-Ojo (director, ICTP-EAIFR) for valuable suggestions on computational techniques. The authors would also like to acknowledge EAFIR and ICTP for High Performance Cluster Machine (HPC) support during the computation.
References
- [1] Green M. A., Prog. Photovoltaics, 2012, 20, 472–476, doi:10.1002/pip.1147.
- [2] Yoshikawa K., Kawasaki H., Yoshida W., Irie T., Konishi K., Nakano K., Uto T., Adachi D., Kanematsu M., Uzu H., Yamamoto K., Nat. Energy, 2017, 2, 17032, doi:10.1038/nenergy.2017.32.
- [3] Snaith H. J., Nat. Mater., 2018, 17, 372–376, doi:10.1038/s41563-018-0071-z.
- [4] Weber D., Z. Naturforsch. B, 1978, 33, 1443–1445, doi:10.1515/znb-1978-1214.
-
[5]
Kojima A., Teshima K., Shirai Y., Miyasaka T., J. Am. Chem. Soc., 2009, 131, 6050–6051,
doi:10.1021/ja809598r - [6] Babayigit A., Ethirajan A., Muller M., Conings, B., Nat. Mater., 2016, 15, 247–251, doi:10.1038/nmat4572.
- [7] Grinberg I., West D. V., Torres M., Gou G., Stein D. M., Wu L., Chen G., Gallo E. M., Akbashev A. R., Davies P. K., Spanier J. E., Rappe A. M., Nature, 2013, 503, 509–512, doi:10.1038/nature12622.
- [8] Perera S., Hui H., Zhao C., Xue H., Sun F., Deng C., Gross N., Milleville C., Xu X., Watson D. F., Weinstein B., Sun Y., Zhang S., Zeng H., Nano Energy, 2016, 22, 129–135, doi:10.1016/j.nanoen.2016.02.020.
- [9] Elumalai N. K., Mahmud M. A., Wang D., Uddin A., Energies, 2016, 9, 861, doi:10.3390/en9110861.
- [10] Oumertem M., Maouche D., Berri S., Bouarissa N., Rai D. P., Khenata R., Ibrir M., J. Comput. Electron., 2019, 18, 415–427, doi:10.1007/s10825-019-01317-3.
-
[11]
Zhang Y., Shimada T., Kitamura T., Wang J., J. Phys. Chem. Lett., 2017, 8, 5834–5839,
doi:10.1021/acs.jpclett.7b02591. -
[12]
Majumdar A., Adeleke A. A., Chakraborty S., Ahuja R., J. Mater. Chem. C, 2020, 8, 16392–16403,
doi:10.1039/d0tc04516k. -
[13]
Kumar M., Singh A., Gill D., Bhattacharya S., J. Phys. Chem. Lett., 2021, 12, 5301–5307,
doi:10.1021/ACS.JPCLETT.1C01034. -
[14]
Perdew J. P., Burke K., Ernzerhof M., Phys. Rev. Lett., 1996, 77, 3865–3868,
doi:10.1103/PHYSREVLETT.77.3865. - [15] Floris A., Timrov I., Himmetoglu B., Marzari N., de Gironcoli S., Cococcioni M., Phys. Rev. B, 2020, 101, 064305, doi:10.1103/PhysRevB.101.064305.
- [16] Togo A., Tanaka I., Scr. Mater., 2015, 108, 1–5, doi:10.1016/J.SCRIPTAMAT.2015.07.021.
- [17] Giannozzi P., Baroni S., Bonini N., Calandra M., Car R., Cavazzoni C., Ceresoli D., Chiarotti G. L., Cococcioni M., Dabo I., et al., J. Phys.: Condens. Matter, 2009, 21, 395502, doi:10.1088/0953-8984/21/39/395502.
- [18] Vanderbilt D., Phys. Rev. B, 1990, 41, 7892, doi:10.1103/PhysRevB.41.7892.
- [19] Monkhorst H. J., Pack J. D., Phys. Rev. B, 1976, 13, doi:10.1103/PhysRevB.13.5188.
-
[20]
Sadeghi I., Ye K., Xu M., Li Y., LeBeau J. M., Jaramillo R., Adv. Funct. Mater., 2021, 31, 2105563,
doi:10.1002/adfm.202105563. -
[21]
Lelieveld R., Ijdo D. J. W., Acta Crystallogr., Sect. B: Struct. Sci, 1980, 36, 2223–2226,
doi:10.1107/s056774088000845x. -
[22]
Pilania G., Ghosh A., Hartman S. T., Mishra R., Stanek C. R., Uberuaga B. P., npj Comput. Mater., 2020, 6, 71,
doi:10.1038/s41524-020-0338-1. - [23] Murnaghan F. D., Proc. Natl. Acad. Sci. U.S.A., 1944, 30, No. 9, 244–247, doi:10.1073/pnas.30.9.244.
-
[24]
Glazer A. M., Acta Crystallogr., Sect. B: Struct. Sci, 1972, 28, 3384–3392,
doi:10.1107/s0567740872007976. - [25] Karki B. B., Ackland G. J., Crain J., J. Phys.: Condens. Matter, 1997, 9, 8579–8589, doi:10.1088/0953-8984/9/41/005.
- [26] Wallace D. C., Am. J. Phys., 1972, 40, 1718–1719, doi:10.1119/1.1987046.
- [27] Luan X., Qin H., Liu F., Dai Z., Yi Y., Li Q., Crystals, 2018, 8, 307, doi:10.3390/cryst8080307.
- [28] Voigt W., Lehrbuch der Kristallphysik, Verlag und Druck, Von BG Teubner, Leipzig und Berlin, 1928.
- [29] Walpole L. J., Adv. Appl. Mech., 1981, 21, 169–242, doi:10.1016/S0065-2156(08)70332-6.
-
[30]
Pugh S. F., London Edinburgh Dublin Philos. Mag. J. Sci., 1954, 45, 823–843,
doi:10.1080/14786440808520496. -
[31]
Ravindran P., Fast L., Korzhavyi P. A., Johansson B., Wills J., Eriksson O., J. Appl. Phys., 1998, 84, 4891–4904,
doi:10.1063/1.368733. -
[32]
Ranganathan S. I., Ostoja-Starzewski M., Phys. Rev. Lett., 2008, 101, 055504,
doi:10.1103/PhysRevLett.101.055504. - [33] Jia G., Yang L., Physica B, 2010, 405, 4561–4564, doi:10.1016/J.PHYSB.2010.08.038.
-
[34]
Lu W. F., Li C. J., Sarac B., Şopu D., Yi J. H., Tan J., Stoica M., Eckert J., J. Alloys Compd., 2017, 705, 445–455,
doi:10.1016/J.JALLCOM.2017.02.085. - [35] Fine M. E., Brown L. D., Marcus H. L., Scr. Metall., 1984, 18, 951–956, doi:10.1016/0036-9748(84)90267-9.
- [36] Kittel C., Introduction to Solid State Physics, 7th edn., Wiley, 2007.
- [37] Dove M. T., Introduction to Lattice Dynamics, Cambridge University Press, 1993.
- [38] Gross N., Sun Y. Y., Perera S., Hui H., Wei X., Zhang S., Zeng H., Weinstein B. A., Phys. Rev. Appl., 2017, 8, 044014, doi:10.1103/PhysRevApplied.8.044014.
- [39] Lee C., Gonze X., Phys. Rev. B, 1995, 51, 8610–8613, doi:10.1103/PHYSREVB.51.8610.
- [40] Foiles S. M., Phys. Rev. B, 1994, 49, 14930–14938, doi:10.1103/PhysRevB.49.14930.
-
[41]
Osei-Agyemang E., Balasubramanian G., ACS Appl. Energy Mater., 2020, 3, 1139–1144,
doi:10.1021/acsaem.9b02185. -
[42]
Li H., Zhang L., Zeng Q., Guan K., Li K., Ren H., Liu S., Cheng L., Solid State Commun., 2011, 151, 602–606,
doi:10.1016/j.ssc.2011.02.005.
Ukrainian \adddialect\l@ukrainian0 \l@ukrainian
[Äîñëiäæåííÿ ñòðóêòóðíèõ, ïðóæíèõ, åëåêòðîííèõ, ôîíîííèõ äèñïåðñiéíèõ i òåðìîäèíàìiчíèõ âëàñòèâîñòåé]Äîñëiäæåííÿ ñòðóêòóðíèõ, ïðóæíèõ, åëåêòðîííèõ, ôîíîííèõ äèñïåðñiéíèõ i òåðìîäèíàìiчíèõ âëàñòèâîñòåé îðòîðîìáiчíîãî CaZrS3 äëÿ çàñòîñóâàíü â îïòèчíié åëåêòðîíiöi Ì. Ä. Êàññà, Í. Ã. Äåáåëî, Ì. Ì. Âîëäåìàðiÿì
Ôiçèчíèé ôàêóëüòåò óíiâåðñèòåòó Äæèììè, 378, Äæèììà, Åôiîïiÿ