A Virgo Environmental Survey Tracing Ionised Gas Emission (VESTIGE)
XV. The H luminosity function of the Virgo cluster††thanks: Based on observations obtained with
MegaPrime/MegaCam, a joint project of CFHT and CEA/DAPNIA, at the Canada-French-Hawaii Telescope
(CFHT) which is operated by the National Research Council (NRC) of Canada, the Institut National
des Sciences de l’Univers of the Centre National de la Recherche Scientifique (CNRS) of France and
the University of Hawaii.
Abstract
Context. We use a complete set of deep narrow-band imaging data for 384 galaxies gathered during the Virgo Environmental Survey Tracing Ionised Gas Emission (VESTIGE) to derive the first H luminosity function of the Virgo cluster within its virial radius. The data, which are sensitive to the emission of a single O-early B ionising star, allow us to cover the whole dynamic range of the H luminosity function (1036 1042 erg s-1). After they are corrected for [NII] contamination and dust attenuation, the data are used to derive the star formation rate function in the range 10-4 10 M⊙ yr-1. These luminosity functions are derived for gas-rich and gas-poor systems and for objects belonging to the different substructures of the Virgo cluster. They are then compared to those derived at other frequencies or using different tracers of star formation in Virgo, in other nearby and high- clusters, in the field, and finally to those predicted by the IllustrisTNG cosmological hydrodynamical simulations (TNG50 and TNG100). The H luminosity function of the Virgo cluster is fairly flat ( = -1.07 when fitted with a Schechter function) in the range 1038.5 1040.5 erg s-1, and it abruptly decreases at lower luminosities. When compared to those derived for other nearby clusters and for the field, the slope and the characteristic luminosity of the Schechter function change as a function of the dynamical mass of the system, of the temperature of the X-rays gas, and of the dynamical pressure exerted on the interstellar medium of galaxies moving at high velocity within the intracluster medium. All these trends can be explained in a scenario in which the activity of star formation of galaxies is reduced in massive clusters due to their hydrodynamical interaction with the surrounding medium, suggesting once again that ram-pressure stripping is the dominant mechanism affecting galaxy evolution in local clusters of dynamical mass 1014 M⊙. The comparison with the IllustrisTNG cosmological hydrodynamical simulations shows a more pronounced decrease at the faint end of the distribution. If the Virgo cluster is representative of typical nearby clusters of similar mass, this difference suggests that the stripping process in simulated galaxies in these environments is more efficient than observed.
Aims.
Methods.
Results.
Key Words.:
Galaxies: star formation; Galaxies: ISM; Galaxies: evolution; Galaxies: interactions; Galaxies: clusters: general; Galaxies: clusters: individual: Virgo1 Introduction
The properties of galaxies inhabiting rich environments are significantly different than those in the field. They are principally relaxed systems (elliptical and lenticulars; Dressler 1980, 1997), while the late-type population is characterised by a reduced atomic (Haynes & Giovanelli 1984; Solanes et al. 2001; Gavazzi et al. 2005) and molecular (Fumagalli et al. 2009; Zabel et al. 2022) gas content. Because of this lack of gas, cluster galaxies also have a reduced star formation activity compared to that of similar objects in the field (e.g. Gavazzi et al. 1998; Lewis et al. 2002; Gomez et al. 2003; Peng et al. 2010; Boselli et al. 2014).
Different perturbing mechanisms have been proposed to explain these systematic differences between cluster and field galaxies. They include gravitational perturbations with nearby companions (e.g. Merritt 1983), with the gravitational potential well of the cluster itself (Byrd & Valtonen 1990), and their combined effect in multiple fly-by encounters (galaxy harassment; Moore et al. 1998), the hydrodynamic interaction of the interstellar medium (ISM) of galaxies with the surrounding hot ( 107-108 K) and low-density ( 10-3 cm-3) intergalactic medium (IGM) (ram-pressure stripping, Gunn & Gott 1972, Boselli et al. 2022a; thermal evaporation; Cowie & Songaila 1977; viscous stripping; Nulsen 1982), and the gentle stop of gas infall on the disc when galaxies become satellites of larger haloes (starvation; Larson et al. 1980). These perturbing mechanisms have different effects on the process of star formation. If the lack of gas that is removed during all types of interactions leads to a reduction of the star formation activity, this quenching phenomenon occurs on different timescales. In a starvation scenario, the cessation of the infall of fresh gas induces a slow reduction of the star formation activity on the disc that fades as soon as the available cold ISM is consumed by star formation (e.g. Larson et al. 1980, Boselli et al. 2006). In gravitational perturbations, which are able to simultaneously remove all the baryonic components of galaxies (gas, dust, and stars), the instabilities created during the encounter induce gas infall into the nucleus, possibly feeding a centralised starburst activity while decreasing star formation in the disc (e.g. Lake et al. 1998). Statistically, the typical timescales necessary to reduce the activity of star formation of harassed galaxies are also very long because multiple fly-by encounters with other cluster members are necessary (eg. Moore et al. 1998; Gnedin et al. 2003; Bialas et al. 2015). Hydrodynamic interactions, which act only on the different phases of the ISM, remove the gas from the outside in, producing truncated gaseous and star-forming discs (see for a review Boselli & Gavazzi 2006, 2014). There is growing evidence from observations (Boselli et al. 2016a; Fossati et al. 2018) and simulations (Quilis et al. 2000; Schulz & Struck 2001; Tonnesen et al. 2007; Roediger & Bruggen 2007; Lotz et al. 2019) that these mechanisms can remove the gas and reduce the activity of star formation of the perturbed galaxies on timescales shorter ( 0.5-1 Gyr) than the typical cluster-crossing timescale ( 1.7 Gyr). The quenching process is particularly efficient in dwarf systems, where the gas is loosely bound to the shallow gravitational potential well of the galaxy (e.g. Boselli et al. 2008).
The analysis of different sets of data aimed at identifying the dominant perturbing process, combined with tuned models and simulations, still gives inconsistent results. While the analysis of nearby samples of galaxies with multifrequency data (e.g. Vollmer et al. 2001; Gavazzi et al. 2010; Boselli et al. 2014; Yagi et al. 2010) and the detailed analysis of selected representative objects (e.g. Vollmer et al. 2008; Kenney et al. 2014; Fossati et al. 2018; Longobardi et al. 2020; Boselli et al. 2021; Junais et al. 2021; see also Poggianti et al. (2017) and the GASP survey111GAs-Stripping Phenomena in galaxies with MUSE) all indicate ram-pressure stripping as the dominant perturbing mechanism in nearby clusters such as Coma, Virgo, and A1367 (Sun et al. 2006; Zhan et al. 2013; Merluzzi et al. 2013; Jachym et al. 2014; Fumagalli et al. 2014; Fossati et al. 2016; Gullieuszik et al. 2017; Bellhouse et al. 2019; Ramatsoku et al. 2019). Other statistical studies based on large samples (Wetzel et al. 2013) or on selected regions of the sky (e.g. McGee et al. 2009; De Lucia et al. 2012; Haines et al. 2015) rather favour long timescales for quenching and so possibly starvation. These inconsistent results, as extensively discussed in Boselli et al. (2016a), can be explained by several facts, including the use of different age-sensitive tracers, of different representative samples, or possibly of inconsistent definitions of cluster and/or satellite galaxies in the various observations and simulation analyses.
The use of multifrequency observations combined with tuned models and simulations is of paramount importance for identifying the dominant perturbing mechanism in rich environments. Of particular importance are all age-sensitive tracers that can be used to quantify the typical timescales for reducing the star formation activity of the perturbed galaxies. A particular role is played by the H line emission, which is the only tracer able to resolve quenching episodes on timescales shorter than 10 Myr (Kennicutt 1998).
With the purpose of studying the effects of the perturbations on the star formation activity of cluster galaxies, we are undertaking the Virgo Environmental Survey Tracing Ionised Gas Emission (VESTIGE; Boselli et al. 2018a). This is a deep H narrow-band imaging survey of the whole Virgo cluster up to its virial radius, corresponding to 104 deg.2 on the plane of the sky. The excellent quality of the data in terms of sensitivity and angular resolution allowed us to make detailed studies of several representative objects undergoing a perturbation (e.g. Boselli et al. 2018b; Fossati et al. 2018; Vollmer et al. 2021; Sardaneta et al. 2022) and to analyse the quenching process down to the scale of individual HII regions (Boselli et al. 2021). VESTIGE is now almost complete (76%) and allows us to make the first statistical studies on the H-derived star formation properties of the perturbed galaxies. We have recently completed a dedicated work on the origin of the ultra-diffuse galaxies inhabiting the cluster (Junais et al. 2022) and another study on the main-sequence relation (Boselli et al. 2023). In this work, we present the H luminosity function of Virgo. The luminosity function of galaxies is a statistical tool that is often used in the literature to constrain numerical models of galaxy evolution in the full cosmological context. It has been used, for instance, to show the different slopes observed at the faint and bright ends between observed galaxy populations and the predictions of simulations and semianalytic models to prove the importance of the feedback mechanism by supernovae and active galactic nuclei (AGNs) in galaxy evolution (e.g. Benson et al. 2003; Croton et al. 2006; Somerville & Dave 2015). In the cluster environment, the optical luminosity function has shown an excess of dwarf galaxies with respect to the field (Yagi et al. 2002; de Propris et al. 2003; Popesso et al. 2005; Ferrarese et al. 2016; see however Blanton et al. 2005). The origin of this difference is still debated.
Constructing the H luminosity function of nearby clusters of galaxies is particularly challenging for several reasons. The first reason is that it requires an H selection that can only be made when untargeted surveys are available. At present, this can be done only using two different techniques. The first technique is based on objective prism spectroscopy, and the second technique uses narrow-band imaging. The angular extension on the sky of nearby clusters means that wide-field cameras and prisms are required, while large apertures are required to achieve the sensitivity required to detect the weak emission of quenched systems. Slitless grism spectroscopy, now often used for environmental studies at high redshift with the Hubble space telescope (HST; e.g. Zeimann et al. 2013; Vulcani et al. 2017; Fossati et al. 2017; Matharu et al. 2022), has been used in the past for a few nearby clusters using photographic plates with the Burrell-Schmidt telescope at Kitt Peak (Moss et al. 1988; Moss & Whittle 2000). These works were limited to fluxes of 10-13 erg s-1 cm-2 and equivalent widths of 20 Å, that is, to the most active galaxy population. Wide-field narrow-band imaging has become available at several 4- to 8-metre class telescopes only in recent years. Despite this, studies of nearby clusters are still limited principally because very expensive large narrow-band filters especially designed to match their transmissivity curve with the velocity distribution of the target clusters are lacking. The only exceptions are the clusters A1367 and Coma, which were studied in detail with the Subaru telescope (Yagi et al. 2010, 2017). These works provided spectacular results, such as the identification of extended low surface brightness ionised gas tails associated with 50% of the late-type galaxies, proving that ram-pressure stripping is the dominant perturbing mechanism here. The data obtained so far, however, still did not allow us to derive the H luminosity function of the two clusters because of several main technical problems, such as the subtraction of the stellar continuum and strong reflection of bright stars, which hamper a correct measure of the total flux of the detected sources. Narrow-band imaging has been used to measure the bright end ( 1040-1041 erg s-1) of the H luminosity function of a few clusters at higher redshift (0.4 0.8; e.g. Kodama et al. 2004; Koyama et al. 2010; Sobral et al. 2016). Even though a similar observational technique was adopted, the results obtained so far are not always consistent: Some clusters are characterised by a steep rise at faint luminosities (Kodama et al. 2004; Koyama et al. 2010), and others by a relatively flat slope in the densest regions (Sobral et al. 2011).
VESTIGE provides us with a unique set of H narrow-band imaging data that is perfectly suited for this purpose. It is the widest and deepest survey for which this exercise can be performed. Its sensitivity is five orders of magnitudes better than that of previous prism surveys. The sensitivity is comparable to that gathered with Subaru for Coma and A1367 because of the excellent transmissivity of the narrow-band filter, the long exposures, and the observing strategy, which is especially tailored to optimise the flat fielding (see Sec. 2) so that the low surface brightness tails of stripped ionised gas can be detected and the flux of all detected galaxies can be measured simultaneously with exquisite accuracy ( 10%). Furthermore, the proximity of the cluster (16.5 Mpc, Mei et al. 2007) allows us to detect dwarf systems and thus to sample the luminosity function down to the emission of a single ionising O or early-B star. The H luminosity function presented in this work is thus the deepest ever achieved for any type of environment. Although it is limited to a single cluster, it will be an excellent reference for years to come for cosmological galaxy simulations, which are now able to trace the star formation activity down to the dwarf population.
The paper is structured as follows: In Sec. 2 we present the observations and the data reduction. In Sec. 3 we derive the star formation rate (SFR) of the detected galaxies after correcting the data for [NII] contamination and dust attenuation. In Sec. 4 we measure the H luminosity function and SFR functions, fit them with a Schechter function, and compare them with those derived for the field or for other clusters at different redshift. We discuss the results in the framework of galaxy evolution in Sec. 5 specifically in comparison to results from the Illustris TNG (The Next Generation) project, and we give our conclusions in Sec. 6.
2 Observations and data reduction
2.1 VESTIGE narrow-band imaging
The data analysed in this work were extracted from the VESTIGE survey. This H narrow-band (NB) imaging survey covers the whole Virgo cluster up to its virial radius (104 deg.2). A full description of the data acquisition and reduction is given in Boselli et al. (2018a). Briefly, the data were collected using MegaCam at the CFHT in two filters, the NB filter MP9603 centred on H ( = 6591 Å; = 106 Å), and the broad-band filter, which is necessary for the subtraction of the stellar continuum. The NB filter is optimally designed to include the emission of the H ( = 6563 Å) and of the two [NII] lines ( = 6548, 6583 Å) for all galaxies at the redshift of the cluster (-300 3000 km s-1; hereafter, we refer to the H+[NII] band as H unless stated otherwise. The observations were carried out with two-hour integration in the NB filter and with 12 minutes in the broad-band filter. This last is necessary to secure the subtraction of the stellar continuum (Boselli et al. 2019). The survey is 76% complete as of February 2023. Full sensitivity has been reached almost everywhere within the VESTIGE footprint, with possible shorter exposures at the cluster periphery, where the survey still needs to be completed. The sensitivity of the survey in the NB is 4 10-17 erg s-1 cm-2 (5) for point sources and 2 10-18 erg s-1 cm-2 arcsec-2 (1 after smoothing the data to 3″resolution) for extended sources. The sensitivity might drop by a factor of 1.5 in some of the outer cluster regions, in which mapping has been secured by about half of the programmed exposures ( 1 h). This limiting sensitivity is still far below the sensitivity that was used to constrain the luminosity function, and this incompleteness therefore does not affect the results of this work. The observations were carried out in excellent seeing conditions in both bands (FWHM=0.76″ 0.07″).
The data were reduced using Elixir-LSB (Ferrarese et al. 2012). This pipeline is especially designed to optimise the detection of low surface brightness and extended regions such as those expected in galaxies interacting with their surrounding environment. The photometric calibration and the astrometric corrections of the images were made using standard MegaCam procedures such as those described in Gwyn (2008). The resulting photometric accuracy in the two bands is 0.02-0.03 mag.
2.2 Galaxy identification
The H emitting sources we used in our analysis were identified as extensively described in Boselli et al. (2023).
Since completeness in the selection is necessary for an accurate determination of the luminosity function, we recall
the adopted criteria here.
Galaxies were identified as line emitters in the continuum-subtracted images as
1) counterparts of the galaxies included in the Virgo cluster catalogue (VCC; Binggeli et al. 1985) and identified as Virgo cluster members
based on their redshift ( 3000 km s-1; 307 objects);
2) ounterparts of sources detected in HI at the redshift of the cluster in the Arecibo Legacy Fast ALFA survey (ALFALFA; Giovanelli et al. 2005). ALFALFA
is a blind HI survey carried out at the Arecibo telescope and covers the whole footprint of VESTIGE, with a typical
sensitivity of = 2.3 mJy at 10 km s-1 spectral resolution and 3.2′ angular resolution. ALFALFA is thus able to detect sources
at the distance of the Virgo cluster with HI masses down to 107.5 M⊙. Because of the tight correlation between atomic gas
content and star formation, HI emitting sources are ideal priors for H detections.
For this purpose, we searched for
any H emitting counterpart at the position of the HI emitting sources in the Virgo cluster ( 3000 km s-1)
that were listed within the catalogue of Haynes et al. (2018) and identified 37 objects that were not included in the VCC.
3) counterparts of the 3869 galaxies identified as Virgo cluster members after the study of different scaling relations using the
Next Generation Virgo cluster Survey (NGVS) data,
as described in Ferrarese et al. (2012, 2020) and Lim et al. (2020) (31 objects). This catalogue is complete to a stellar mass of
1.6107 M⊙, and it is 50% complete to 6.2105 M⊙ (Ferrarese et al. 2020).
4) four bright galaxies with extended H emission located outside the VCC and NGVS footprints.
5) five objects not included in the previous catalogues with clear extended line emission identified after visual inspection
of all the VESTIGE continuum-subtracted images. Their fairly extended emission suggests that they are local low-mass blue compact dwarf (BCD) galaxies rather than
background line emitters. For two of them, we gathered a spectrum at the Apache Point Observatory (APO) 3.5 m telescope using the
dual imaging spectrograph (DIS), and we identified (as expected)
a line emission within the NB VESTIGE band. The S/N in the spectrum, however, is too low to detect other emission or absorption lines, and thus
prevents an unambiguous identification of these sources as Virgo cluster members.
Furthermore,
6) we excluded all point-source line emitters to avoid any possible contamination of background sources. Although their identification
using multiple colour-colour diagrams derived combining the two VESTIGE bands (H and ) with the four NGVS bands ()
is still pending, a preliminary analysis of this sample suggests that they are predominantly Ly emitters at 4.4, as well as
several [OII] and [OIII] emitters at 0.8 and 0.4, respectively.
7) to statistically quantify the number of line emitters with extended emission, which thus might be potentially members of the Virgo cluster, and that
might have been missed by this selection,
we ran the code SExtractor (Bertin & Arnouts 1996) in dual mode on the NB H and on the broad-band images and identified
all resolved sources with an excess of emission in the NB (3). We then visually inspected all the sources with a radius 1″ in both the NB and broad-band images and rejected all objects with a compact morphology ( 3″) consistent with
that of background galaxies at 0.4 (e.g. van der Wel et al. 2014). We repeated this exercise on ten randomly
selected fields ( 10 deg.2, 10% of the full survey), and we finally identified only one extended object composed of several
compact star-forming regions, thus with a morphology which might suggest being member of the Virgo cluster. If it is assumed to lie at the distance of the cluster (16.5 Mpc),
its luminosity would be = 1.8 1038 erg s-1. Because this number is very small, we cannot apply any luminosity-dependent
statistical correction to the data.
To conclude, the sample of galaxies we used in this work to construct the H and SFR luminosity functions is composed of 384 galaxies, 379 of which have a secure redshift identification. Because the NB filter transmissivity profile and the redshift distribution within the cluster match perfectly, we can consider the five remaining galaxies without a redshift (point 5 above) as highly probable Virgo cluster members. The statistical properties of the sample, including the identification of galaxies in the phase-space diagram, are extensively described in Boselli et al. (2023). The sample spans the following ranges in H luminosity: 1036.5 1042 erg s-1, corresponding to 10-5 10 M⊙ yr-1 in SFR (see Sec. 3.3), stellar mass, 106 1011.5 M⊙, and atomic gas mass, 106.5 109.7 M⊙.
2.3 Flux extraction
The flux extraction procedure is also extensively described in Boselli et al. (2023). It consists in measuring both the galaxy emission and the sky background on the continuum-subtracted images, which are calibrated with a photometric uncertainty of 2-3 % (see Sec. 2.1). The galaxy emission and the sky background are measured within the same elliptical aperture defined to encompass all the emission associated with each galaxy, but at the same time, minimise the contribution of the sky background within the aperture. The ellipse includes only the galaxy emission, and it excludes any possible emission for extended features located outside the stellar disc (extraplanar HII regions or diffuse gas tails), whose contribution is always minor. The flux and its uncertainty are then estimated by measuring the sky background 1000 times within about five times the diameter of the target to minimise any possible effects due to large-scale residual gradients in the continuum-subtracted frame (the main source of uncertainty in the estimated fluxes). The uncertainties on the fluxes were obtained as the quadratic sum of the uncertainties on the flux counts and the uncertainties on the background (rms of the bootstrap iterations). The uncertainties on the flux counts were derived assuming a Poissonian distribution for the source photo-electrons. The uncertainty on the flux is generally 10%. We also checked the quality of the flux calibration by comparing the the H fluxes derived in this work with those extracted from the integral field unit (IFU) spectroscopy gathered with the Multi-Unit Spectroscopic Explorer (MUSE) at the Very Large Telescope (VLT) for a few selected galaxies. The accuracy is excellent in star-forming systems (three objects with a difference of 5%; Boselli et al. 2018b, 2021, 2022b) and slightly lower in a bright lenticular (NGC 4526, 18%; Boselli et al. 2022b) because the subtraction of the stellar continuum emission in the NB data is difficulat.
2.4 Multifrequency data
A large set of multifrequency data was used in the following analysis. These data are necessary for the identification of the H emitting sources in the VESTIGE images (see Sec. 2.2) and for the correction of the H data for [NII] contamination and dust attenuation. Spectroscopic data were used to quantify the [NII] contamination and the Balmer decrement. As in other VESTIGE papers, HI data were used to identify perturbed systems via the HI-deficiency parameter (Haynes & Giovanelli 1984) as those with 0.4, where the HI-deficiency parameter is defined with the recent calibration of Cattorini et al. (2023). The complete set of multifrequency data is extensively described in Boselli et al. (2023).
3 Derived parameters
3.1 [NII] contamination
The [NII] contamination in the NB filter was derived using the spectroscopic data. In order of priority, we used the VLT MUSE and the Focal Reducer and Low-dispersion Spectrograph (FORS) data whenever available (five galaxies; Fossati et al. 2018, Boselli et al. 2018b, 2021, 2022a), the integrated spectra of the Herschel Reference Survey (HRS; Boselli et al. 2015) (72 galaxies) and Virgo galaxies (Gavazzi et al. 2004) (44 objects), public Sloan Digital Sky Survey (SDSS) spectra (115 objects), or assuming the standard scaling relation between the [NII]/H ratio and the stellar mass published in Boselli et al. (2023) (141 objects).
|
Notes: units are erg s-1 for the H luminosities.

3.2 Dust attenuation
The dust attenuation was estimated using two independent techniques, as extensively described in Boselli et al. (2023).The first technique relies on the determination of the Balmer decrement, which is possible through the available spectroscopic data described in the previous section. For this purpose, we used the same priority as we adopted for the [NII] contamination correction in the choice of the spectroscopic data. For galaxies without spectroscopic data, we derived the Balmer decrement using the standard scaling relation between and the galaxy stellar mass given in Boselli et al. (2023).
The dust attenuation was also derived using the prescription of Calzetti et al. (2010) based on the Wide-field Infrared Survey Explorer (WISE; Wright et al. 2010) 22 m emission available for all the massive galaxies of the sample. Finally, to reduce systematic effects in the data, the dust attenuation in the H line was derived as
| (1) |
The dust attenuation in the H band is 3 mag, with most objects having 0.4 mag, as shown in Fig. (2) of Boselli et al. (2023).
3.3 H luminosities and SFRs
The H fluxes corrected for [NII] contamination and dust attenuation were used to measure the H luminosities as described in Boselli et al. (2023). These were derived assuming galaxies at the distance of their associated subcluster structure, as defined in Boselli et al. (2014): 16.5 Mpc for cluster A, cluster C, and the low-velocity cloud (LVC), 23 Mpc for cluster B and for the W′ cloud, and 32 Mpc for the W and M clouds (see Gavazzi et al. 1999; Mei et al. 2007). We rcall that Boselli et al. (2014) assumed that the distances of clusters A and C and of the LVC were at 17 Mpc. For consistency with other NGVS works, we adopt here 16.5 Mpc for these substructures.
Finally, H luminosities were converted into SFR using the relation of Calzetti et al. (2010) derived for a Chabrier initial mass function (IMF),
| (2) |
We recall that this conversion is valid only whenever several conditions are satisfied: 1) The escape fraction of ionising photons and the number of ionising photons absorbed by dust before ionising the surrounding gas are null (e.g. Boselli et al. 2009); 2) The contribution to the ionising radiation due to AGNs or evolved stars is negligible; 3) The star formation activity of the galaxy is almost constant on timescales longer than or comparable to that of the typical age of the ionising stars ( 10 Myr) (stationarity condition, e.g. Boselli et al. 2009); 4) The IMF is sufficiently sampled to avoid stochastic effects (e.g. Fumagalli et al. 2011); 5) The contribution of other heating mechanisms such as thermal conduction and mixing with the surrounding hot IGM, turbulence due to Kelvin-Helmholtz instabilities, and shock heating created during the stripping process, is negligible.
Point 1) is probably satisfied in fairly normal galaxies such as those observed in the Virgo cluster (values different than but still close to zero are generally observed in strong starbursts; Izotov et al. 2016; Leitherer et al. 2016; Chisholm et al. 2018; see however Choi et al. 2020, rare in this cluster environment). As extensively discussed in Boselli et al. (2023), condition 2) is also satisfied because the number of AGNs in the sample is very limited (four using the BPT diagram; Baldwin et al. 1981; or eight using the WHAN classification; Cid Fernandes et al. 2011), and in all these objects, the H emission is largely dominated by the emission of HII regions in the disc. We also estimated that the contribution of evolved stars to the production of the ionising radiation is only 2% (Boselli et al. 2023). Points 3) and 4) are not necessarily satisfied in the most extreme dwarf systems detected in the survey. The H emission in these objects is often dominated by one or a few HII regions that might turn on or off , depending on the star formation history of the parent galaxy, which at these very low stellar masses ( 106 M⊙) is generally very bursty (e.g. Mateo 1998). At the same time, at the faintest luminosities reached by the VESTIGE survey, which is complete to 1036 erg s-1, we are close to the stochastic sampling of the IMF (see Boselli et al. 2023). We therefore derived the H and the luminosity functions of the cluster simultaneously, keeping in mind that the faint end of the luminosity function ( 1037 erg s-1 corresponding to 5 10-5 M⊙ yr-1) might be affected by these effects. Finally, the possible contribution of other processes to the ionisation of the gas mentioned in point 5) is hardly quantifiable given the very complex physics that describe them and the difficulty of including them in tuned models and simulations (e.g. Melekh et al. 2015; Sander & Hensler 2021). The clumpy structure of the H images similar to that observed in other photometric bands sensitive to the young stellar distribution (far- (FUV) and near-ultraviolet (NUV), -band) means that their contribution to the total H emission of the Virgo galaxies analysed in this work remains negligible.
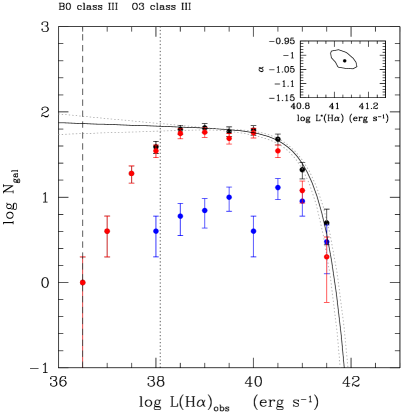
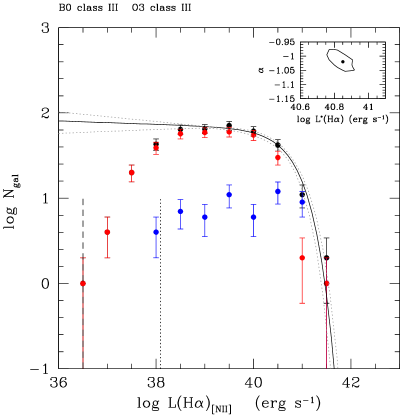
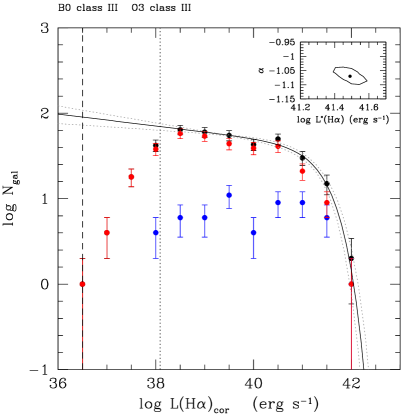
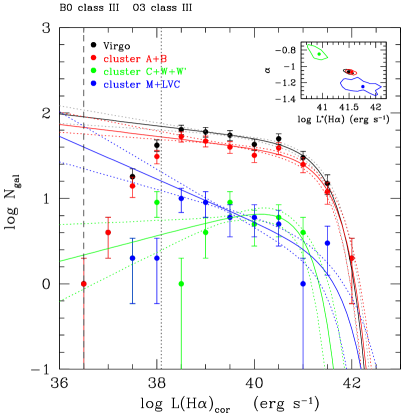
We also recall that the limiting luminosity of the VESTIGE survey, 1036 erg s-1, is lower than the H luminosity expected for the ionisation due to a single O star and is rather comparable to that of a single early-B star. These are the stars with the lowest mass and temperature that are able to produce ionising photons that cause the H emission in star-forming regions (Sternberg et al. 2003). The H luminosity of a single star can be derived by converting the photon ionisation rate into a SFR using eq. 2 of Kennicutt (1998), and then into assuming an IMF (Chabrier in this work). Values of for different ionising stars are available in Sternberg et al. (2003). For comparison with the H luminosity function of Virgo cluster galaxies, we plot in Figs. 1, 3, and 4 the expected for an O3 and B0 class III star. VESTIGE is able to detect the emission of any single ionising star, and is thus sampling the whole dynamic range of the H luminosity function of galaxies in the Virgo cluster.
4 H luminosity function
4.1 H luminosity function of the Virgo cluster
We derived the differential H luminosity function of the Virgo cluster by counting the number of galaxies per bin of H luminosity (0.5 dex in log scale) detected by VESTIGE. Because of the sensitivity of the survey, which is able to detect the emission of a single late-B ionising star, and the applied source identification technique based on optical priors of stellar mass up to 2 orders of magnitude below the expected H detection limit suggested by the main-sequence relation (Boselli et al. 2023), we considered the VESTIGE survey complete down to 1036 erg s-1. We thus do not apply any completeness correction.
The volume covered by the survey is the one included within a pyramid with a base equal to the VESTIGE footprint (104 deg.2) and with a height corresponding to the width of the narrow-band filter (3000 km s-1, corresponding to 42.9 Mpc for = 70 km s-1 Mpc-1). This leads to a volume of 851.7 Mpc3. This volume is significantly larger than the volume of the main body of the Virgo cluster, = 1.55 Mpc (Ferrarese et al. 2012). For consistency with previous NGVS and VESTIGE works we assume throughout this analysis = 1.55 Mpc; this value is slightly larger then the one recently presented in Boselli et al. (2022a), = 0.974 Mpc, and should thus be considered only as an upper limit. Because Virgo has a very complex 3D structure that is formed by several subgroups located at different distances (e.g. de Vaucouleurs 1961; Binggeli et al. 1987; Gavazzi et al. 1999; Solanes et al. 2002; Mei et al. 2007; Boselli et al. 2014b), we cannot accurately estimate its volume. For this reason, the luminosity functions derived in this work and their parametric fits were derived using the total number of objects without any normalisation.
Figure 1 shows the luminosity function of the observed H+[NII] luminosity (), the H luminosity corrected for [NII] contamination (), and that corrected for [NII] contamination and dust attenuation (). These H densities were derived within bins of 0.5 dex using the full sample of H detected galaxies (384 sources). We derived the luminosity function for the whole sample and separately for the HI-normal ( 0.4) and the HI-deficient ( 0.4) galaxies, the former representing unperturbed systems similar to those populating the field, the latter perturbed objects typical of high-density environments. We fit the luminosity function using a Schechter (1976) function of the form
| (3) |
following the formalism of Metha et al. (2015) and Fossati et al. (2021), deriving the posterior distribution and the best-fit parameters using the MULTINEST Bayesian algorithm (Feroz & Hobson 2008; Feroz et al. 2019). Because the observed shape of the non-parametric luminosity function abruptly decreases below 1038 erg s-1, we limited the fit to galaxies with 1038 erg s-1 (340 objects). The best fit to the data, derived for the observed and corrected H luminosity functions, is shown in Fig. 1, and the best-fit parameters are listed in Table 1. Figure 1 shows that the H luminosity function of the cluster steeply decreases at the bright end, above 1041 erg s-1, mildly increases in the range 1038.5 1041 erg s-1, and abruptly decreases at lower luminosities. It also shows that the luminosity function is dominated by HI-poor systems. Finally, this result is robust with respect to the adopted corrections of the observed flux for [NII] contamination and dust attenuation because these corrections are substantial only in objects with the highest H luminosities (massive galaxies), which are not numerous in this sample. The slope of the faint end does not significantly change in the three luminosity functions, while obviously does given the nature of the applied corrections (Fig. 1).
|
Notes: H luminosities are corrected for [NII] contamination and dust attenuation. Units are erg s-1 for the H luminosities.
4.2 H luminosity function of the different cluster substructures
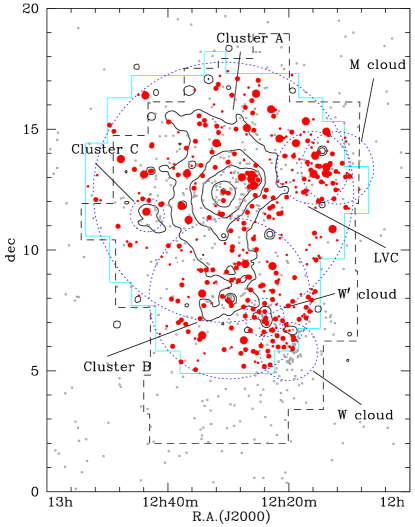
Figure 3 shows the H luminosity function corrected for [NII] contamination and dust attenuation of the whole cluster and compares it to that derived for the two main substructures of Virgo (clusters A and B) and to other minor substructures (clusters C, W, W′, M, and the LVC). All these substructures are defined as in Boselli et al. (2014) and are shown in Fig. 2. Membership to these substructures is defined as indicated in Table 3.
|
Note: Galaxies in the overlapping regions that satisfy the membership criteria of two different structures are assumed to be members of the smallest structure
for clusters C, W, W’, M, and the LVC clouds. Those in the overlapping region between clusters A and B are assigned to the substructure whose
centre is closest to the galaxy.
: Radius used to identify the different substructures. For clusters A and B, this corresponds to the radius from Ferrarese et al. (2012).
: Velocity range up to 3500 km s-1 taken in Boselli et al. (2014) to include field galaxies at the periphery of the cluster.
Only one object within the VESTIGE footprint with 3000 3500 km s-1 is clearly detected by VESTIGE,
VCC 357 ( = 3008 km s-1), here considered as a Virgo cluster member.
: Mean distance of each single substructure.
To increase the statistics in the different clouds, we separated the galaxies belonging to clusters C, W, and W′ clouds from those belonging to the M and LVC clouds because the first subsample is dominated by early-type systems and gas-deficient spirals and the second one by gas-rich star-forming objects (Gavazzi et al. 1999). The best-fit parameters again measured for galaxies with 1038 erg s-1 are given in Table 2. Despite the limited statistics in clusters C, W, and W′ clouds (33 objects) and in the M and LVC clouds (41 galaxies), Fig. 3 suggests that the slope of the H luminosity function in the luminosity range 1038 1040 erg s-1 is steeper in the M and LVC clouds ( = -1.25), which are dominated by gas-rich star-forming galaxies, than in the more relaxed clusters A and B ( = -1.07) or in the other smaller substructures (clusters C, W, and W’ clouds, = -0.85) (the marginalised PDFs of in the M+LVC and C+W+W′ subsamples are statistically different at 4 significance). Figure 3 also shows the luminosity function derived for gas-rich ( 0.4) and gas-poor ( 0.4) galaxies and shows them separately for objects located within and outside = 0.5, where is the distance from M87, the centre of cluster A. Clearly, star-forming galaxies are lacking principally in the inner regions of the cluster. The gas-rich star-forming systems are also lacking, principally those with low H luminosities. These results do not depend on the reduced sensitivity of the VESTIGE survey in the outskirts of the cluster, where completeness is reached for 2 1036 erg s-1.

4.3 Star formation rate function and comparison with other tracers
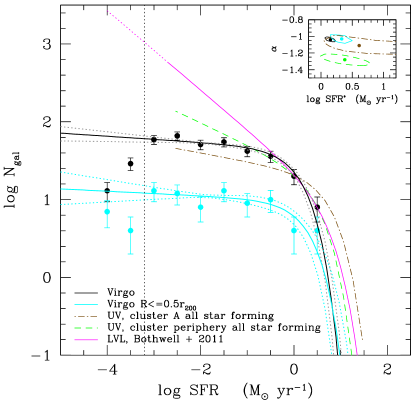
Figure 4 shows the SFR function derived in this work using VESTIGE H imaging data and compares it with the one derived using GALEX ultraviolet (UV) data of the GALEX ultraviolet Virgo cluster survey (GUViCS; Boselli et al. 2011). For this exercise, we excluded galaxies M87, NGC 4262, and NGC 4552, in which the H emission is due to processes other than photoionisation of young massive stars (Boselli et al. 2019, 2022b). The best-fit parameters of the Schechter function are given in Table 4. Since the GUViCS data are taken in a wider region ( 300 deg.2 vs. 104 deg.2 for VESTIGE), they were used to derive the luminosity function separately for the cluster periphery (at a distance from M87 6.1∘, corresponding to 1.1) and for galaxies belonging to the inner regions of the main body of cluster A ( 0.5, see Boselli et al. 2014). These last are comparable to those derived in this work using the H galaxies located in the inner cluster, marked in cyan in Fig. 4. As for the previous comparisons, however, the GUViCS data are normalised to the number of objects detected by VESTIGE in the bin = 1 M⊙ yr-1.
The uncertainties in the derivation of the best-fit parameters of the H derived star formation function are significantly lower than those estimated using the GALEX UV data. Figure 4 shows that the UV derived SFR function of the cluster periphery is significantly steeper at the faint end than the one derived using H data ( = -1.28 vs. = -1.04). At the bright end, the NUV luminosity function for cluster A gives more galaxies, although the overall shape of the NUV luminosity function is still consistent with the observed number of H emitting sources. The difference at the bright end is more pronounced when the H derived function is compared to the NUV function derived for cluster A, which gives more galaxies with a high star formation activity. At the faint end, the two distributions are fairly consistent ( = -1.11 vs. = -1.03 for galaxies located at 0.5). The limited depth of the GUViCS survey does not allow us to reach galaxies with SFRs log -2.6 M⊙ yr-1, and thus it cannot confirm the abrupt decrease in activity observed in the H data below this limit.
The VESTIGE SFR function is also compared to the SFR derived for the Local Volume Legacy (LVL) survey sample by Bothwell et al. (2011) using a combination of UV, IR, and H data (bivariate luminosity function; Fig. 4). This SFR function is well fitted by a Schechter function with = 5.8 M⊙ yr-1 (for a Chabrier IMF) and = -1.510.08 down to its completeness limit of log -2.7 M⊙ yr-1, but it still increases with a similar slope down to the detection limit of log -4 M⊙ yr-1. Clearly, the number of star-forming objects in the field is significantly higher than that in the Virgo cluster for 0.1 M⊙ yr-1.
|
Notes: units are in M⊙ yr-1 for the SFRs.
5 Discussion
5.1 H luminosity function of the Virgo cluster
The exceptional quality of the VESTIGE survey in terms of sensitivity and image quality allowing us to derive the H luminosity function of the Virgo cluster for the first time. This exercise was made on a statistically significant sample of 384 Virgo cluster members. Because of the depth of the survey, this sample is complete and includes all possible emitting sources where the gas is ionised by massive stars. The unique set of available multifrequency data allowed us to correct the VESTIGE narrow-band imaging data for [NII] contamination and dust attenuation with high accuracy. The analysis presented in Sec. 4, and in particular in Fig. 1, clearly indicates that the derivation of the luminosity function is robust compared to these corrections, which only mildly modify the shape of both the non-parametric and parametric (Schechter) functions. For this reason, the data also allow us to derive the SFR function of the cluster very well.
The non-parametric luminosity function is well represented by a Schechter function in the luminosity range 1038 1042 erg s-1 and does not require other parametrisations that are sometime used to characterise the field luminosity function (Saunders’s formalism; Gunawardhana et al. 2013). The luminosity function is poorly constrained at the bright end because only a limited volume is sampled (851.7 Mpc3), but it is excellent at the faint end. The abrupt decrease at 1038 erg s-1 is probably real for the following reasons. First of all, this limiting luminosity is two orders of magnitude above the detection limit of the survey ( 1036 erg s-1) derived by measuring the detection rate of fake sources of similar luminosity injected in real images (Boselli et al. 2018a). Second, H sources have been searched for in all the stellar continuum-subtracted frames in which galaxies have been detected in the deep optical NGVS frames (Ferrarese et al. 2012). According to the recently derived main-sequence relation (Boselli et al. 2023), the limiting H luminosity of 1036 erg s-1 occurs at about two orders of magnitude above the stellar mass sensitivity limit of NGVS. It is thus very unlikely that any H emitting source associated with an optically identified galaxy has been lost after visual inspection of all the galaxies identified as Virgo cluster members in the NGVS survey (3869 galaxies). A preliminary statistical analysis of all line emitters automatically identified using SExtractor used on 10% of the mapped region indicates only one potential Virgo cluster member candidate (see Sec. 2.2). Possible sources might have been missed whenever their surface brightness in H is below the detection limit of the survey ( 2 10-18 erg s-1 cm-2 arcsec-2) throughout the optical disc of the galaxy. This is a very low surface brightness that can be reached and overtaken only with a few facilities after very long exposure times (e.g. MUSE at the VLT). It is difficult to quantify the possible frequency of galaxies with an H surface brightness below this threshold.

Figures 1 and 3 clearly indicate that the H luminosity function of Virgo is dominated by gas-poor ( 0.4) galaxies. The ratio of gas-rich to gas-poor objects strongly decreases with decreasing H luminosity, as illustrated in Fig. 5. At H luminosities of 1038 erg s-1 , there are no HI-rich galaxies, while galaxies with a normal HI gas content dominate at 1041 erg s-1. A similar trend is also observed for galaxies located at 0.5, while the large uncertainties due to the poor statistics prevent us from detecting any trend in the inner cluster ( 0.5). Figures 2 and 3 also show that star-forming galaxies, and in particular, low-mass systems, are less frequent in the inner cluster regions. The difference between the SFR function of Virgo, which is flat at the faint end ( = -1.04), and of the local volume, which steeply rises with a slope of = -1.510.08 in the same range of star formation activity (10-4 10-1 M⊙ yr-1) is also clear.
All this observational evidence can be explained considering that external perturbations affecting galaxy evolution in clusters, such as ram-pressure stripping (Gunn & Gott 1972), act principally on the HI content, which constitutes the main gas reservoir feeding star formation. These stripping mechanisms are increasingly efficient with the decrease in stellar mass of galaxies (in unperturbed systems traced by the H luminosity, main-sequence relation) because their shallower gravitational potential keeps the gas well anchored to the stellar disc (Boselli et al. 2022a). In the lowest H luminosity regime ( 1038 erg s-1, corresponding to 107 M⊙), the stripping of the gas is total so that the star formation activity is fully quenched on very short timescales (e.g. Boselli et al. 2008, 2014, 2022b, 2023; Junais et al. 2022). Thus, the probability of observing Virgo cluster galaxies with these very low H luminosities is very low, while this is not the case in the field (Bothwell et al. 2011). Despite the poor statistics, Fig. 3 also seems to indicate that in the luminosity range 1038 1041 erg s-1 , the H luminosity function is almost flat inside all the relaxed substructures of the cluster that are dominated by early-type systems and that are well identified in the plane of the sky versus redshift distribution (see Boselli et al. 2014). The slope, in contrast, seems to be significantly steeper (at the 4 level) in the two main infalling regions at the north-west side of the cluster (M and LVC clouds). These clouds are characterised by gas-rich star-forming systems that might be infalling for the first time into the cluster (Gavazzi et al. 1999).
5.2 Comparison with other photometric bands
The H luminosity function derived in this work can be used quantify the impact of the environment on the star formation process (and its quenching) on strong statistical grounds. This can be achieved by comparing the H luminosity function of Virgo to those available in the literature in other photometric bands, for other cluster galaxies, and for the field. This exercise is shown in Fig. 6, but it is clearly restricted by the lack of data sampling the faint end of the luminosity functions in other nearby clusters or in the field, all limited to 1038.5-39 erg s-1.

We first compared the slope of the luminosity function derived in this work ( = -1.07) with those measured in the Virgo cluster in other bands. The slope derived using the GUViCS data in the NUV, a photometric band that is sensitive to the emission of the young stellar population, is = -1.18 when measured within the main body of cluster A ( 0.5), and it is = -1.22 at the cluster periphery ( 1.1 ; Boselli et al. 2016c). Steeper slopes are measured on the photographic plate material of the VCC survey within a very similar sky region ( = -1.30, Sandage et al. 1985), and in the -band when derived using SDSS data for galaxies within 1 Mpc from M87 ( = -1.28 for 0.65 ; Rines & Geller 2008). There are other estimates of the slope, but they are limited to selected regions: in the very inner 4 deg.2 ( 0.2 ), -1.43 (Lieder et al. 2012) and = -1.33, but possibly increasing to = -1.60 when including ultra-compact dwarf (UCD) galaxies (Ferrarese et al. 2016). Other estimates concern different stripes that extend from the cluster centre to the periphery (Trentham & Hodgkin 2002, -1.37; Sabatini et al. 2003, -1.6). All these results suggest a steepening of the slope with the ageing of the stellar population within the Virgo cluster, as depicted in Fig. 7. In the optical bands, the faint end of the luminosity function of Virgo is dominated by early-type quiescent dwarf ellipticals and spheroidals (Sandage et al. 1985; Ferrarese et al. 2016). For comparison, in the optical bands, the slope of the luminosity function in the field is -1.0 when it is derived using the SDSS data (Blanton et al. 2003), or steeper ( -1.5) whenever it is corrected to take into account the possible contribution of low surface brightness objects (Blanton et al. 2005). In the field, the faint end is dominated by star-forming systems.

5.3 Comparison with the field and with other clusters
We compared the properties of the Virgo H luminosity function with those observed in the field and in other clusters of galaxies (see Fig 6). The H luminosity function of field galaxies was derived in the literature using different samples of H selected or optically selected (bivariate luminosity function) objects. These include those derived using the emission line galaxies of the Universidad Complutense de Madrid objective-prism survey (UCM; Gallego et al. 1995, Perez-Gonzalez et al. 2003), the narrow-band imaging Wyoming Survey for H (WySH; Dale te al. 2010), the Subaru Deep Field (SDF; Fujita et al. 2003; Ly et al. 2007; Morioka et al. 2008), the HST COSMOS2 field (Shioya et al. 2008), the Calar Alto Deep Imaging Survey (CADIS; Hippelein et al. 2003), the Taurus Tunable Filter Field Galaxy Survey (Jones & Bland-Hawthorn 2001), optically selected galaxies from the Smithsonian Hectospec Lenisng Survey (SHELS; Westra et al. 2010), or from the galaxy and mass assembly survey (GAMA) and SDSS (Guanawhardana et al. 2013).
Figure 6 (left panel) shows the comparison between the H luminosity function derived in this work using data corrected for [NII] contamination and dust attenuation and other H luminosity functions for field galaxies in the local Universe ( 0.16). Because of the overdensity of galaxies in the Virgo cluster, a direct comparison of the parameter would be dominated by the very different number density of objects in the two environments and would offer little additional information. For a fair comparison of the shapes, all the field Schechter functions were normalised to the number of galaxies the Virgo cluster sample has in the bin centred at = 1041 erg s-1. Because of the limited number of bright objects detected in this small sampled volume, we limited the comparison to the slope and characteristic luminosity. The typical and parameters of these field H luminosity functions in the local Universe range within -1.59 -1.20 and 41.74 log 42.43 erg s-1. These numbers are significantly (5 and 3 , respectively) different than those derived for the Virgo cluster (see Table 1), with a steeper slope and a brighter characteristic luminosity in field objects with respect to the Virgo cluster galaxies.
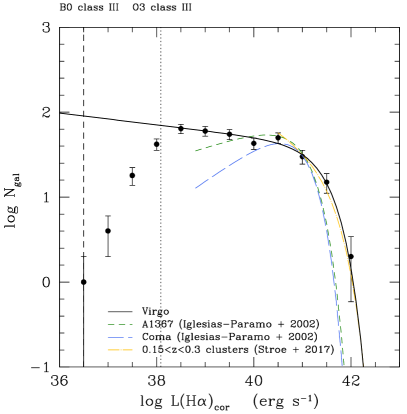
Deep wide-field H narrow-band imaging surveys of clusters are optimal for identifying all emitting sources using an unbiased selection. They also have the advantage of providing integrated fluxes in extended sources, which limits any possible systematic effect in aperture corrections that are substantial in nearby extended sources. Their main limitation, however, is the need of tuned wide-field narrow-band expensive filters with a transmissivity curve centred on the H emitting line at the redshift of the targeted clusters. For this reason, the number of nearby clusters observed using untargeted narrow-band imaging surveys is very limited. A dozen clusters at redshift 0.3 have been observed so far using this technique (e.g. Balogh & Morris 2000; Couch et al. 2001; Balogh et al. 2002; Umada et al. 2004; Stroe et al. 2017; see also Liu et al. 2021 for Fourier transform spectrograph imaging), while those in the very nearby universe are only Virgo (Boselli et al. 2018a), Coma (Iglesias-Paramo et al. 2002; Yagi et al. 2010), and A1367 (Iglesias-Paramo et al. 2002; Yagi et al. 2017). Although deep Subaru narrow-band imaging data are available for both Coma and A1367 (Yagi et al. 2010, 2017), the difficulty of optimising the subtraction of the stellar continuum emission prevented the determination of accurate H fluxes for all the detected cluster members.
Their fluxes, however, have been measured using shallower narrow-band imaging data gathered with the wide-field camera at the Isaac Newton telescope (INT) (Iglesias-Paramo et al. 2002). A fair comparison with these two clusters would require similar sets of data taken at similar cluster-centric distances and at comparable redshift. A tentative comparison with Coma and A1367, whose data were taken with narrow-band imaging, is possible, but should be made with care to properly consider possible systematic biases in the results. The filter used at the INT telescope is the [SII] rest-frame narrow-band filter, which only partially overlaps with the velocity distribution of the galaxies in Coma and A1367. The luminosity functions derived for these two clusters by Iglesias-Paramo et al. (2002) were calculated after adopting a quite uncertain statistical correction necessary to take this effect into account. Furthermore, both clusters were observed on a contiguous 1 deg.2 field, corresponding to 0.5 and 0.6 , respectively. Because the efficiency of most of the perturbing mechanisms depends on the cluster-centric distance, this might introduce systematic effects in the comparison. Finally, the H luminosity function in Virgo is significantly deeper ( 1036 erg s-1) than in Coma and A1367 ( 1038.5-39 erg s-1).
Figure 6 (right panel) shows the comparison of the Virgo H luminosity function derived using the VESTIGE data with those published in Iglesias-Paramo et al. (2002) for Coma and A1367. Because these surveys are limited to the inner cluster regions, where the density of galaxies is higher than at the cluster periphery, we normalised the parametric Schechter luminosity functions of Iglesias-Paramo et al. (2002) to the Virgo luminosity function by imposing the same number of objects in the bin centred at = 1041 erg s-1. The best-fit parameters of the Schchter function derived by Iglesias-Paramo et al. (2002) scaled to = 70 km s-1 Mpc-1 are = -0.82 and log = 41.01 erg s-1 within 0.6 for A1367 and = -0.60 and log = 40.94 erg s-1 within 0.5 for Coma. The values of Virgo are intermediate between those derived in these massive clusters and in the field. Interestingly, the slope in the optical bands is very steep in Coma, steeper than in the field (de Propris et al. 1998; Mobasher & Trentham 1998; Andreon & Pello 2000; Balogh et al. 2001; see for a comparison Boselli & Gavazzi 2006). In A1367, the slope is = -1.07 (Iglesias-Paramo et al. 2003), comparable to the field but steeper than the one measured in H.
We also compare in Fig. 6 the H luminosity function of Virgo derived in this work with the composite luminosity function of cluster galaxies at redshfit 0.15 0.30 derived by Stroe et al. (2017) using a similar narrow-band imaging technique to identify the emitting sources and measure their total flux. Figure 6 does not show any systematic difference between the bright end of the H luminosity function of Virgo galaxies and the composite luminosity function of cluster galaxies at redshift 0.15 0.30. Because the dynamic range covered by this composite luminosity function is limited, the comparison cannot be made for 1040.5 erg s-1.
Overall, these results are qualitatively consistent with an evolutionary picture in which galaxies enter the cluster as gas-rich systems, lose their gas content, and quench their star formation activity on relatively short timescales (shorter than the typical crossing time of the cluster) to become quiescent objects without H emission. The VESTIGE luminosity function only traces the distribution of star-forming objects in H, while in the other bands, it simultaneously includes star-forming and quiescent systems. Perturbing processes such as ram-pressure stripping, often invoked as the dominant process in the Virgo cluster (e.g. Vollmer et al. 2001; Boselli et al. 2014, 2023), can explain these observed trends. First of all, they remove the gas from the perturbed galaxies with an efficiency that increases with the decrease in the total mass of the perturbed object just because dwarf systems have a shallower gravitational potential well than massive objects that are unable to retain the cold gas anchored to the stellar disc. There is growing evidence that the stripping process, and the following quenching of the star formation activity, is more rapid ( 0.5-1 Gyr; e.g. Boselli et al. 2006, 2016a, 2021; Fossati et al. 2018) than the typical crossing time of the cluster ( 1.7 Gyr in Virgo, Boselli & Gavazzi 2006). The H emission, which is sensitive to the emission of young ( 10 Myr) and massive O - early-B stars, stops 10 Myr after any star formation activity is halted, and this occurs when all the ISM of the perturbed galaxies is removed during the interaction. In dwarf systems, this occurs on short timescales. Galaxies become quiescent systems and are no longer sampled in the H luminosity function (flatter ). In the NUV band, where the emission is dominated by A-F stars whose presence on the main sequence lasts 100-500 Myr (Boissier et al. 2008; Boselli et al. 2009), galaxies are no longer counted in the luminosity function on longer timescales. They change colour, become red systems, and steepen the faint end of the luminosity function in the optical bands at longer wavelengths. In massive systems, some gas can be retained in the inner regions where the gravitational potential well is the deepest. Here, star formation can still occur, but at an overall rate that is slower than that of similar objects in the field. A typical example is NGC 4569, a star-forming massive galaxy in the core of the Virgo cluster that goes through a ram-pressure stripping event and is characterised by a truncated gaseous (HI and molecular) and star-forming disc (e.g. Vollmer et al. 2004; Boselli et al. 2006, 2016b). Perturbed massive objects are indeed expected to reduce their activity, falling below the main-sequence relation (Boselli et al. 2023). They thus shift to lower H luminosities in the luminosity function, and might explain the observed decrease in the characteristic H luminosity observed in Virgo (log = 41.49 erg s-1) with respect to the field (41.74 log 42.43 erg s-1). The steep slope in the M and LVC clouds might be caused by the first infall of these substructures into the cluster. Galaxies that are predominantly HI-rich are just starting to feel the perturbation of the surrounding cluster environment (LVC) here or are still too far away to feel it (M cloud, located at 15 Mpc behind cluster A). They might just be galaxies that are pre-processed within their own substructure.
To determine how this evolutionar picture might depend on the cluster properties, we compare the best-fit parameters of the Schechter function derived for Coma, A1367, and Virgo in Fig. 8, where we plot the dependence of the slope of the faint end and the characteristic luminosity (in log scale) as a function of three representative cluster parameters, that is, the total mass of the clusters (, taken from Boselli et al. 2022a), the typical temperature of the intergalactic medium, and the typical hydrodynamic pressure exerted by the intergalactic medium () on galaxies moving within the cluster with a mean velocity . For this purpose, we assumed the typical density of the intergalactic medium and the velocity dispersion of the three clusters (for the infalling spiral component) from Boselli & Gavazzi (2006). Figure 8 suggests that both the characteristic luminosity and the slope of the H luminosity function are related to the properties of the clusters, and they increasingly deviate from those measured in the field with the increase in the cluster mass, temperature, and exerted pressure ( = ). Although to be taken with caution for the reasons mentioned above, Fig. 8 is perfectly consistent with the evolutionary picture just mentioned, simply by considering that the gas-stripping and star formation-quenching phenomena become increasingly important in more extreme environments.
5.4 Comparison with high- clusters
The comparison of the H luminosity function derived in this work with the one determined for clusters at intermediate and high redshift is of paramount importance for identifying the main perturbing mechanisms in galaxy evolution with cosmic time. In particular, comparing the statistical properties of samples of cluster galaxies selected according to similar criteria at different epochs is crucial for posing strong observational constraints on the timescales for the quenching phenomenon that is now well established in nearby cluster galaxies. Considerable effort has been expended in recent years to derive the star formation properties of galaxies in clusters at different redshift using the H emission line (e.g. Finn et al. 2008; Nantais et al. 2020). In several cases, H selected galaxies were used to do this, either using the grism spectroscopy provided by the HST (e.g. Zeimann et al. 2013; Cooper et al. 2022), or using narrow-band imaging data such as those gathered in this work (e.g. Kodama et al. 2004; Finn et al. 2004, 2005; Koyama et al. 2010, 2011, 2018; Sobral et al. 2011, 2016; Shimakawa et al 2018). Overall, these works consistently indicate that i) the star formation activity in the densest regions of rich clusters is suppressed with respect to the field, and ii) that the mean star formation activity of cluster galaxies rapidly decreases from 0.8 to 0. The H luminosity function of intermediate-redshift cluster galaxies (0.4 0.8), however, was derived only for a very limited number of objects. The results obtained from these analyses are not always consistent, possibly because of poor statistics, a strong cluster mass dependence, and rapid galaxy evolution. A comparison of the best-fit Schechter parameters derived in these works with those of Virgo is made difficult by the very different sampled H luminosity range, which is limited to 1040 erg s-1 for clusters at 0.4 and 1041 erg s-1 for clusters at 0.8. According to the well-known covariance of the Schechter function parameters ( and are correlated variables which depend on the sampled luminosity range), the observed flattening of the H luminosity function observed in Virgo in the range 1038 1041 erg s-1 cannot be measured at higher redshift if, as expected, is close to the detection limit. Keeping in mind all these possible uncertainties, we can speculate that the decrease in the star formation activity of cluster galaxies occurred in the last 4 Gyr principally in dwarf systems. This statement is suggested by the recent build-up of the faint end of the red sequence observed in clusters (e.g. De Lucia et al. 2007, 2009; Stott et al. 2007, 2009; Gilbank & Balogh 2008) and favours an efficient mechanism that can remove the gas from the galactic disc and quench the activity of star formation on short timescales (e.g. ram-pressure stripping; Boselli et al. 2022a).
|
5.5 Comparison with cosmological simulations
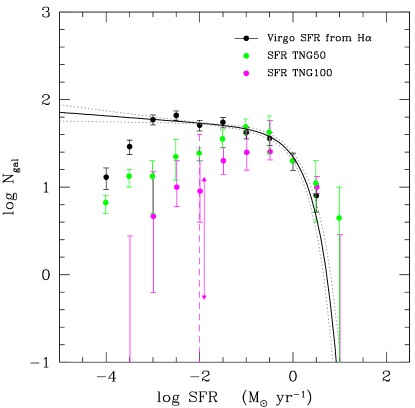
In Fig. 9 we compare the SFR function of the Virgo cluster presented in Fig. 6 with the predictions of hydrodynamical cosmological simulations of galaxies, specifically, those from the IllustrisTNG project222https://www.tng-project.org (Nelson et al. 2019). These are based on an extensive model of galaxy formation, including the solution of gravity and magnetohydrodynamics in expanding universes and feedback from stars and from supermassive black holes (Pillepich et al. 2018a), so that phenomena that drive environmental processes in dense groups and clusters (tidal and ram-pressure stripping, gravitational interactions, mergers, etc.) all emerge from the solution of the numerically solved equations.
For this purpose, we used two different sets of simulated clusters and the galaxies therein. The first set was extracted from the smallest volume and highest resolution TNG50 run (Pillepich et al. 2019; Nelson et al. 2019), which allowed us to sample star-forming galaxies down to the stellar mass limit of 106 M⊙ and 10-5 M⊙ yr-1 (Joshi et al. 2021), comparable to the stellar mass and star-forming range sampled by the VESTIGE survey (Boselli et al. 2023). The TNG50 simulation includes two clusters of mass 1014 M⊙ (extensively studied e.g. by Joshi et al. (2020)), comparable to the mass of the Virgo cluster. These two massive dark matter haloes have a total of 109 star-forming galaxies within (projected distance, see Table 5). To increase the statistics and assess the effects of variance, we also considered the TNG100 run (Naiman et al. 2018; Marinacci et al. 2018; Nelson et al. 2018; Pillepich et al. 2018b; Springel et al. 2018), which includes 14 clusters of mass 1014 4 1014 M⊙. For these simulations, the limiting SFR is 10-4 M⊙ yr-1 , while the one in stellar mass is rather 108 M⊙ (Donnari et al. 2019). The TNG100 clusters used in this analysis include 517 star-forming galaxies, that is, galaxies with a non-vanishing simulated SFR.
We identified galaxy members of the simulated clusters using the seme criteria as were applied in the case of the Virgo cluster, that is, as those objects located at a projected distance (which corresponds to the angular extension of the VESTIGE footprint) and with a line-of-sight (LoS) velocity with respect to the cluster 2000 km s-1, the velocity range covered by the NB filter (see Boselli et al. 2018a for details). For the simulated galaxies, this corresponds to the subhalo velocity relative to the host in the z-direction, here taken as a proxy for the LoS velocity.
To focus only on the shapes of the different luminosity functions, the results of the simulations were normalised to the number of galaxies observed in Virgo within the star-forming rate bin centred at = 1 M⊙ yr-1. The comparison at high SFRs ( 10 M⊙ yr-1) should be considered with extreme caution given the very limited number of observed and simulated objects. We thus focus on the slope of the distribution for 1 M⊙ yr-1.
While the observed Virgo shows a mild but significant increase in the number of galaxies with a decreasing SFR in the range 10-3 1 M⊙ yr-1 ( = -1.04), the number of star-forming objects decreases with decreasing SFR in the TNG50 and TNG100 simulated clusters, that is, the drop in number of star-forming galaxies seems to occur at lower SFR values in the simulations than in the Virgo cluster. This decrease is more pronounced in the TNG100 simulated clusters than in TNG50 clusters: Even though the quenched fractions of Virgo-mass cluster galaxies have been shown to be completely robust against resolution effects between TNG100 and TNG50 (Donnari et al. 2021b, see their Fig. 10), some resolution effects might affect the simulation-predicted actual values of SFR, especially at these low levels of star formation. For simulated galaxies, there can also be large systematic uncertainties or differences in the way in which the galaxy SFRs are estimated: The thick vertical magenta error bar at = 10-2 M⊙ yr-1 shows an estimate of this uncertainty, which amounts to 0.6 dex at least.
Barring resolution effects and systematic issues in the sample selection and in the comparison of the SFR proxies, the difference between the luminosity functions of the TNG50 and TNG100 simulations on the one hand and that observed in Virgo, on the other, might have several origins. The error bar in the TNG50 curve of Fig. 9 indicates the dynamic range of the luminosity function when the two massive clusters are considered as separate entities. The error bar in the TNG100 luminosity function gives the 25% and 75% percentiles of the distributions of the 14 clusters when they are considered as independent entities. According to the TNG simulations and based on the luminosity functions across 16 hosts, the cluster-to-cluster variation may be 0.9 dex at least at = 10-2 M⊙ yr-1. This is larger than the difference between the observed luminosity function of Virgo and the average simulated luminosity functions (about dex at the same value). We note that despite the large dispersion in the number of star-forming objects per luminosity bin measured in the 14 individual TNG100 clusters, none of them reaches the values observed in Virgo for , and all show a decreasing number of objects going from to M⊙ yr-1.
At the same time, Virgo might not be representative of clusters with a dynamical mass 1014 4 1014 M⊙ () because it is a young dynamically unrelaxed system that is still populated by gas-rich star-forming objects when compared to other nearby clusters (e.g. Boselli & Gavazzi 2006, Boselli et al. 2014). To examine this possibility, the observation of other nearby clusters of similar mass is paramount, and in the context of validating the realism of simulations, a comparison with a larger number of simulated Virgo-like hosts is of the essence.
Despite the complexities discussed above, the comparison of Fig. 9 may suggest that the lower number and the decrease in the number of star -forming objects at the faint end of the luminosity function in TNG Virgo-like simulated clusters may be related to the efficiency of the various physical mechanisms in removing the gas from member galaxies (ram-pressure stripping, gravitational perturbations, and feedback). Similar comparisons have been made extensively in previous analyses: For example, Donnari et al. (2021b) have shown that TNG produces quenched fractions for both centrals and satellites that are broadly consistent with observations at , at least for galaxies more massive than 109 M⊙, even though the quantitative agreement between TNG and the Sloan Digital Sky Survey for satellite quenched fractions in groups and clusters strongly depends on the host and galaxy mass range. For cluster galaxies, the level of agreement was found to be strikingly good for intermediate group-mass scale hosts (1013-14 M⊙) and to decrease for TNG low-mass galaxies in either Milky Way-mass or massive (1015 M⊙) hosts.
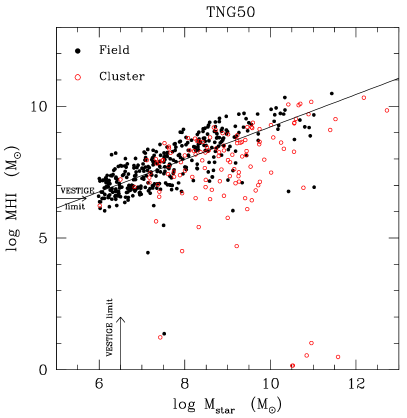
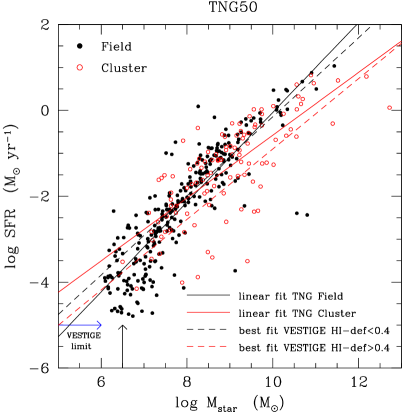
As expected from theoretical arguments and observations, galaxies in dense environments exhibit a lower gas-mass content than their analogues in the field: We refer to the simulated cluster objects in the versus and versus scaling relations in Fig. 10, for instance. In a previous detailed analysis, Stevens et al. (2019) have shown that the HI content of TNG100 galaxies is aligned with that inferred from surveys such as ALFALFA (Giovanelli et al. 2005) and the extended GALEX Arecibo SDSS survey (xGASS, Catinella et al. 2018). This is also the case here, where the simulated galaxies follow the scaling relations traced by the Virgo objects. There is, however, a sistematic difference in the low-mass regime that is not sampled in the xGASS sample, which is limited to 109 M⊙. Figure 10 shows that in the stellar mass range 108 M⊙ , the number of simulated cluster objects in the versus and versus scaling relations is significantly smaller than that in the field. Most of the simulated dwarf galaxies in the cluster do not contain cold gas, thus their star formation activity is completely stopped, suggesting that the stripping process in these systems is too efficient. Although the observed catalogue is H selected, we can compare the fraction of star-forming objects at a stellar mass limit in the observations and in the simulations. The NGVS catalogue is complete down to a stellar mass of 1.6 107 M⊙ (1340 objects catalogued as Virgo cluster members with a stellar mass above this limit; Ferrarese et al. 2020). At this stellar mass limit, the VESTIGE survey detected 360 star forming galaxies (27%), while the fraction of star-forming objects in the TNG50 simulated clusters is 103/987 = 10%. These considerations suggest that if Virgo is an average host, the stripping process in the TNG simulations may be too efficient for very low-mass satellites in Virgo-mass clusters.
6 Conclusion
Based on their untargeted nature, we used the NB H imaging data for 384 galaxies gathered during the VESTIGE survey to derive the first H luminosity function of the galaxies in the Virgo cluster within its virial radius. The extremely deep data allowed us to measure the H emission of galaxies from the brightest objects down to the emission of a single ionising star, thus sampling the full range of the H luminosity function (1036 1042 erg s-1) throughout the cluster. The H luminosity function was derived for the whole cluster, for its different substructures, and separately for HI-rich and HI-poor galaxies, with the latter considered as systems perturbed by their surrounding environment. Using a unique set of multifrequency data, we corrected the observed H luminosities for [NII] contamination and dust attenuation, and converted them to derive the SFR function of the cluster members. We fit the H and luminosity functions with a Schechter function. These luminosity functions steeply increase up to their characteristic luminosity ( = 1041.49 erg s-1, = 100.15 M⊙ yr-1), have a flat slope ( = -1.07 and = -1.03) in the range 1038.5 1040.5 erg s-1 and 10-3 10-0.5 M⊙ yr-1, and abruptly decline at lower luminosities.
The IllustrisTNG cosmological hydrodynamical simulations for clusters with a mass similar to that of Virgo (1-4 1014 M⊙) predict a number of galaxies that is lower than is observed by VESTIGE for Virgo by 0.2-0.6 dex with TNG50 and 0.5-1.0 dex with TNG100 in the SFR range 10-3 0.1 M⊙ yr-1. Although a large ( 0.9 dex) cluster-to-cluster variation is predicted by the simulations and the significant uncertainty related to the use of different tracers of star formation ( 0.6 dex), none of the 16 simulated clusters reproduces the SFR function observed in Virgo. If Virgo is representative of clusters of this mass, this difference suggests that gas stripping is more efficient in the simulated low-mass satellites in Virgo-mass clusters than observed. Only the observations of other nearby clusters with similar properties can solve this important question.
When compared to those derived for the field and for Coma and A1367, the characteristic parameters of the fitted Schechter function of the observed H luminosity function seem related with the total dynamical mass of the cluster, the temperature of the of the hot IGM, and the mean dynamical pressure exerted by the IGM on the galaxies moving within the cluster. All these relations, which need to be confirmed on a larger statistical sample of local clusters of different mass, suggest that the activity of star formation of galaxies is reduced with increasing efficiency in more massive clusters. This result is expected by all modern cosmological numerical simulations, including IllustrisTNG (Donnari et al. 2021a), that is, in a scenario in which the dominant mechanism that causes the gas stripping and the following quenching of the star formation activity in massive clusters ( 1014 M⊙) is the hydrodynamic interaction of the ISM of the infalling star-forming galaxies with the hot IGM trapped with the gravitational potential well of the cluster (ram-pressure stripping).
Acknowledgements.
We thank the anonymous referee for constructive comments and suggestions which helped improving the quality of the manuscript. We are grateful to the whole CFHT team who assisted us in the preparation and in the execution of the observations and in the calibration and data reduction: Todd Burdullis, Daniel Devost, Bill Mahoney, Nadine Manset, Andreea Petric, Simon Prunet, Kanoa Withington. We acknowledge financial support from “Programme National de Cosmologie and Galaxies” (PNCG) funded by CNRS/INSU-IN2P3-INP, CEA and CNES, France. This research has made use of the NASA/IPAC Extragalactic Database (NED) which is operated by the Jet Propulsion Laboratory, California Institute of Technology, under contract with the National Aeronautics and Space Administration and of the GOLDMine database (http://goldmine.mib.infn.it/) (Gavazzi et al. 2003). MA and DN acknowledge funding from the Deutsche Forschungsgemeinschaft (DFG) through an Emmy Noether Research Group (grant number NE 2441/1-1). MB gratefully acknowledges support by the ANID BASAL project FB210003 and from the FONDECYT regular grant 1211000.References
- Baldwin et al. (1981) Baldwin, J. A., Phillips, M. M., & Terlevich, R. 1981, PASP, 93, 5
- Balogh & Morris (2000) Balogh, M. L. & Morris, S. L. 2000, MNRAS, 318, 703
- Balogh et al. (2002) Balogh, M. L., Couch, W. J., Smail, I., et al. 2002, MNRAS, 335, 10
- Bellhouse et al. (2019) Bellhouse, C., Jaffé, Y. L., McGee, S. L., et al. 2019, MNRAS, 485, 1157
- Benson et al. (2003) Benson, A. J., Bower, R. G., Frenk, C. S., et al. 2003, ApJ, 599, 38
- Bertin & Arnouts (1996) Bertin, E., & Arnouts, S. 1996, A&AS, 117, 393
- Bialas et al. (2015) Bialas, D., Lisker, T., Olczak, C., et al. 2015, A&A, 576, A103
- Binggeli et al. (1985) Binggeli, B., Sandage, A., & Tammann, G. A. 1985, AJ, 90, 1681
- Binggeli et al. (1987) Binggeli, B., Tammann, G. A., & Sandage, A. 1987, AJ, 94, 251
- Blanton et al. (2003) Blanton, M. R., Hogg, D. W., Bahcall, N. A., et al. 2003, ApJ, 592, 819
- Blanton et al. (2005) Blanton, M. R., Lupton, R. H., Schlegel, D. J., et al. 2005, ApJ, 631, 208
- Böhringer et al. (1994) Böhringer, H., Briel, U. G., Schwarz, R. A., et al. 1994, Nature, 368, 828
- Boissier et al. (2008) Boissier, S., Gil de Paz, A., Boselli, A., et al. 2008, ApJ, 681, 244-257
- (14) Boselli, A., & Gavazzi, G. 2006, PASP, 118, 517
- Boselli & Gavazzi (2014) Boselli, A., & Gavazzi, G. 2014, A&A Rev., 22, 74
- (16) Boselli, A., Boissier, S., Cortese, L., & Gavazzi, G. 2008, ApJ, 674, 742
- Boselli et al. (2009) Boselli, A., Boissier, S., Cortese, L., et al. 2009, ApJ, 706, 1527
- (18) Boselli, A., Boissier, S., Heinis, S., et al. 2011, A&A, 528, A107
- Boselli et al. (2014) Boselli, A., Voyer, E., Boissier, S., et al. 2014, A&A, 570, AA69
- Boselli et al. (2015) Boselli, A., Fossati, M., Gavazzi, G., et al. 2015, A&A, 579, A102
- Boselli et al. (2016) Boselli, A., Roehlly, Y., Fossati, M., et al. 2016a, A&A, 596, A11
- Boselli et al. (2016) Boselli, A., Cuillandre, J. C., Fossati, M., et al. 2016b, A&A, 587, A68
- Boselli et al. (2016) Boselli, A., Boissier, S., Voyer, E., et al. 2016c, A&A, 585, A2
- Boselli et al. (2018) Boselli, A., Fossati, M., Ferrarese, L., et al. 2018a, A&A, 614, A56
- Boselli et al. (2018) Boselli, A., Fossati, M., Consolandi, G., et al. 2018b, A&A, 620, A164
- Boselli et al. (2019) Boselli, A., Fossati, M., Longobardi, A., et al. 2019, A&A, 623, A52
- Boselli et al. (2021) Boselli, A., Lupi, A., Epinat, B., et al. 2021, A&A, 646, A139
- Boselli et al. (2022) Boselli, A., Fossati, M., & Sun, M. 2022a, A&A Rev., 30, 3
- Boselli et al. (2022) Boselli, A., Fossati, M., Longobardi, A., et al. 2022b, A&A, 659, A46
- Boselli et al. (2023) Boselli, A., Fossati, M., Roediger, J., et al. 2023, A&A, 669, A73
- Bothwell et al. (2011) Bothwell, M. S., Kennicutt, R. C., Johnson, B. D., et al. 2011, MNRAS, 415, 1815
- Byrd & Valtonen (1990) Byrd, G., & Valtonen, M. 1990, ApJ, 350, 89
- Calzetti et al. (2010) Calzetti, D., Wu, S.-Y., Hong, S., et al. 2010, ApJ, 714, 1256
- Cardelli et al. (1989) Cardelli, J. A., Clayton, G. C., & Mathis, J. S. 1989, ApJ, 345, 245
- Catinella et al. (2018) Catinella, B., Saintonge, A., Janowiecki, S., et al. 2018, MNRAS, 476, 875
- Cattorini et al. (2023) Cattorini, F., Gavazzi, G., Boselli, A., et al. 2023, A&A, 671, A118
- Chisholm et al. (2018) Chisholm, J., Gazagnes, S., Schaerer, D., et al. 2018, A&A, 616, A30
- Choi et al. (2020) Choi, Y., Dalcanton, J. J., Williams, B. F., et al. 2020, ApJ, 902, 54
- Cid Fernandes et al. (2011) Cid Fernandes, R., Stasińska, G., Mateus, A., et al. 2011, MNRAS, 413, 1687
- Cooper et al. (2022) Cooper, J. R., Rudnick, G. H., Brammer, G. G., et al. 2022, MNRAS, 509, 5382
- Couch et al. (2001) Couch, W. J., Balogh, M. L., Bower, R. G., et al. 2001, ApJ, 549, 820
- Cowie & Songaila (1977) Cowie, L. L., & Songaila, A. 1977, Nature, 266, 501
- Croton et al. (2006) Croton, D. J., Springel, V., White, S. D. M., et al. 2006, MNRAS, 365, 11
- Dale et al. (2010) Dale, D. A., Barlow, R. J., Cohen, S. A., et al. 2010, ApJ, 712, L189
- De Lucia et al. (2007) De Lucia, G., Poggianti, B. M., Aragón-Salamanca, A., et al. 2007, MNRAS, 374, 809
- De Lucia et al. (2009) De Lucia, G., Poggianti, B. M., Halliday, C., et al. 2009, MNRAS, 400, 68
- De Lucia et al. (2012) De Lucia, G., Weinmann, S., Poggianti, B. M., Aragón-Salamanca, A., & Zaritsky, D. 2012, MNRAS, 423, 1277
- De Propris et al. (2003) De Propris, R., Colless, M., Driver, S. P., et al. 2003, MNRAS, 342, 725
- de Vaucouleurs (1961) de Vaucouleurs, G. 1961, ApJS, 6, 213
- Donnari et al. (2019) Donnari, M., Pillepich, A., Nelson, D., et al. 2019, MNRAS, 485, 4817
- Donnari et al. (2021) Donnari, M., Pillepich, A., Joshi, G. D., et al. 2021a, MNRAS, 500, 4004
- Donnari et al. (2021) Donnari, M., Pillepich, A., Nelson, D., et al. 2021b, MNRAS, 506, 4760
- Dressler (1980) Dressler, A. 1980, ApJ, 236, 351
- Dressler et al. (1997) Dressler, A., Oemler, A., Jr., Couch, W. J., et al. 1997, ApJ, 490, 577
- Feroz & Hobson (2008) Feroz, F. & Hobson, M. P. 2008, MNRAS, 384, 449
- Feroz et al. (2019) Feroz, F., Hobson, M. P., Cameron, E., et al. 2019, The Open Journal of Astrophysics, 2, 10
- Ferrarese et al. (2006) Ferrarese, L., Côté, P., Jordán, A., et al. 2006, ApJS, 164, 334
- Ferrarese et al. (2012) Ferrarese, L., Côté, P., Cuillandre, J.-C., et al. 2012, ApJS, 200, 4
- Ferrarese et al. (2016) Ferrarese, L., Côté, P., Sánchez-Janssen, R., et al. 2016, ApJ, 824, 10
- Ferrarese et al. (2020) Ferrarese, L., Côté, P., MacArthur, L. A., et al. 2020, ApJ, 890, 128
- Finn et al. (2004) Finn, R. A., Zaritsky, D., & McCarthy, D. W. 2004, ApJ, 604, 141
- Finn et al. (2005) Finn, R. A., Zaritsky, D., McCarthy, D. W., et al. 2005, ApJ, 630, 206
- Finn et al. (2008) Finn, R. A., Balogh, M. L., Zaritsky, D., et al. 2008, ApJ, 679, 279
- Fossati et al. (2016) Fossati, M., Fumagalli, M., Boselli, A., et al. 2016, MNRAS, 455, 2028
- Fossati et al. (2017) Fossati, M., Wilman, D. J., Mendel, J. T., et al. 2017, ApJ, 835, 153
- Fossati et al. (2018) Fossati, M., Mendel, J. T., Boselli, A., et al. 2018, A&A, 614, A57
- Fossati et al. (2021) Fossati, M., Fumagalli, M., Lofthouse, E. K., et al. 2021, MNRAS, 503, 3044
- Fujita et al. (2003) Fujita, S. S., Ajiki, M., Shioya, Y., et al. 2003, ApJ, 586, L115
- Fumagalli et al. (2009) Fumagalli, M., Krumholz, M. R., Prochaska, J. X., et al. 2009, ApJ, 697, 1811
- Fumagalli et al. (2011) Fumagalli, M., da Silva, R. L., & Krumholz, M. R. 2011a, ApJ, 741, L26
- Fumagalli et al. (2014) Fumagalli, M., Fossati, M., Hau, G. K. T., et al. 2014, MNRAS, 445, 4335
- Gallego et al. (1995) Gallego, J., Zamorano, J., Aragon-Salamanca, A., et al. 1995, ApJ, 455, L1
- Gavazzi et al. (1998) Gavazzi, G., Catinella, B., Carrasco, L., Boselli, A., & Contursi, A. 1998, AJ, 115, 1745
- Gavazzi et al. (1999) Gavazzi, G., Boselli, A., Scodeggio, M., Pierini, D., & Belsole, E. 1999, MNRAS, 304, 595
- Gavazzi et al. (2003) Gavazzi, G., Boselli, A., Donati, A., Franzetti, P., & Scodeggio, M. 2003, A&A, 400, 451
- Gavazzi et al. (2004) Gavazzi, G., Zaccardo, A., Sanvito, G., Boselli, A., & Bonfanti, C. 2004, A&A, 417, 499
- Gavazzi et al. (2005) Gavazzi, G., Boselli, A., van Driel, W., & O’Neil, K. 2005, A&A, 429, 439
- Gavazzi et al. (2010) Gavazzi, G., Fumagalli, M., Cucciati, O., et al. 2010, A&A, 517, A73
- Gilbank & Balogh (2008) Gilbank, D. G. & Balogh, M. L. 2008, MNRAS, 385, L116
- Giovanelli et al. (2005) Giovanelli, R., Haynes, M. P., Kent, B. R., et al. 2005, AJ, 130, 2598
- Gnedin (2003) Gnedin, O. Y. 2003, ApJ, 589, 752
- Gómez et al. (2003) Gómez, P. L., Nichol, R. C., Miller, C. J., et al. 2003, ApJ, 584, 210
- Gullieuszik et al. (2017) Gullieuszik, M., Poggianti, B. M., Moretti, A., et al. 2017, ApJ, 846, 27
- Gunawardhana et al. (2013) Gunawardhana, M. L. P., Hopkins, A. M., Bland-Hawthorn, J., et al. 2013, MNRAS, 433, 2764
- Gunn & Gott (1972) Gunn, J. E., & Gott, J. R., III 1972, ApJ, 176, 1
- Gwyn (2008) Gwyn, S. D. J. 2008, PASP, 120, 212
- Haynes & Giovanelli (1984) Haynes, M. P. & Giovanelli, R. 1984, AJ, 89, 758
- Hippelein et al. (2003) Hippelein, H., Maier, C., Meisenheimer, K., et al. 2003, A&A, 402, 65
- Iglesias-Páramo et al. (2002) Iglesias-Páramo, J., Boselli, A., Cortese, L., et al. 2002, A&A, 384, 383
- Iglesias-Páramo et al. (2003) Iglesias-Páramo, J., Boselli, A., Gavazzi, G., et al. 2003, A&A, 397, 421
- Izotov et al. (2016) Izotov, Y. I., Schaerer, D., Thuan, T. X., et al. 2016, MNRAS, 461, 3683
- Jáchym et al. (2014) Jáchym, P., Combes, F., Cortese, L., Sun, M., & Kenney, J. D. P. 2014, ApJ, 792, 11
- Jones & Bland-Hawthorn (2001) Jones, D. H. & Bland-Hawthorn, J. 2001, ApJ, 550, 593
- Joshi et al. (2020) Joshi, G. D., Pillepich, A., Nelson, D., et al. 2020, MNRAS, 496, 2673
- Joshi et al. (2021) Joshi, G. D., Pillepich, A., Nelson, D., et al. 2021, MNRAS, 508, 1652
- Junais et al. (2021) Junais, Boissier, S., Boselli, A., et al. 2021, A&A, 650, A99
- Junais et al. (2022) Junais, Boissier, S., Boselli, A., et al. 2022, A&A, 667, A76
- Kenney et al. (2014) Kenney, J. D. P., Geha, M., Jáchym, P., et al. 2014, ApJ, 780, 119
- Kennicutt (1998) Kennicutt, R. C., Jr. 1998a, ARA&A, 36, 189
- Kodama et al. (2004) Kodama, T., Balogh, M. L., Smail, I., et al. 2004, MNRAS, 354, 1103
- Koyama et al. (2010) Koyama, Y., Kodama, T., Shimasaku, K., et al. 2010, MNRAS, 403, 1611
- Koyama et al. (2011) Koyama, Y., Kodama, T., Nakata, F., et al. 2011, ApJ, 734, 66
- Koyama et al. (2018) Koyama, Y., Hayashi, M., Tanaka, M., et al. 2018, PASJ, 70, S21
- Lake et al. (1998) Lake, G., Katz, N., & Moore, B. 1998, ApJ, 495, 152
- Larson et al. (1980) Larson, R. B., Tinsley, B. M., & Caldwell, C. N. 1980, ApJ, 237, 692
- Lewis et al. (2002) Lewis, I., Balogh, M., De Propris, R., et al. 2002, MNRAS, 334, 673
- Lieder et al. (2012) Lieder, S., Lisker, T., Hilker, M., et al. 2012, A&A, 538, A69
- Lim et al. (2020) Lim, S., Côté, P., Peng, E. W., et al. 2020, ApJ, 899, 69
- Liu et al. (2021) Liu, Q., Yee, H. K. C., Drissen, L., et al. 2021, ApJ, 908, 228.
- Longobardi et al. (2020) Longobardi, A., Boselli, A., Fossati, M., et al. 2020, A&A, 644, A161
- Lotz et al. (2019) Lotz, M., Remus, R.-S., Dolag, K., et al. 2019, MNRAS, 488, 5370
- Ly et al. (2007) Ly, C., Malkan, M. A., Kashikawa, N., et al. 2007, ApJ, 657, 738
- Marinacci et al. (2018) Marinacci, F., Vogelsberger, M., Pakmor, R., et al. 2018, MNRAS, 480, 5113
- Mateo (1998) Mateo, M. L. 1998, ARA&A, 36, 435
- Matharu et al. (2021) Matharu, J., Muzzin, A., Brammer, G. B., et al. 2021, ApJ, 923, 222.
- McGee et al. (2009) McGee, S. L., Balogh, M. L., Bower, R. G., Font, A. S., & McCarthy, I. G. 2009, MNRAS, 400, 937
- Mehta et al. (2015) Mehta, V., Scarlata, C., Colbert, J. W., et al. 2015, ApJ, 811, 141
- Mei et al. (2007) Mei, S., Blakeslee, J. P., Côté, P., et al. 2007, ApJ, 655, 144
- Melekh et al. (2015) Melekh, B., Recchi, S., Hensler, G., et al. 2015, MNRAS, 450, 111
- Merluzzi et al. (2013) Merluzzi, P., Busarello, G., Dopita, M. A., et al. 2013, MNRAS, 429, 1747
- Merritt (1983) Merritt, D. 1983, ApJ, 264, 24
- Moore et al. (1998) Moore, B., Lake, G., & Katz, N. 1998, ApJ, 495, 139
- Morioka et al. (2008) Morioka, T., Nakajima, A., Taniguchi, Y., et al. 2008, PASJ, 60, 1219
- Moss & Whittle (2000) Moss, C., & Whittle, M. 2000, MNRAS, 317, 667
- Moss et al. (1988) Moss, C., Whittle, M., & Irwin, M. J. 1988, MNRAS, 232, 381
- Naiman et al. (2018) Naiman, J. P., Pillepich, A., Springel, V., et al. 2018, MNRAS, 477, 1206
- Nantais et al. (2020) Nantais, J., Wilson, G., Muzzin, A., et al. 2020, MNRAS, 499, 3061
- Nelson et al. (2018) Nelson, D., Pillepich, A., Springel, V., et al. 2018, MNRAS, 475, 624
- Nelson et al. (2019) Nelson, D., Springel, V., Pillepich, A., et al. 2019a, Computational Astrophysics and Cosmology, 6, 2
- Nelson et al. (2019) Nelson, D., Pillepich, A., Springel, V., et al. 2019b, MNRAS, 490, 3234
- Nulsen (1982) Nulsen, P. E. J. 1982, MNRAS, 198, 1007
- Peng et al. (2010) Peng, Y.-j., Lilly, S. J., Kovač, K., et al. 2010, ApJ, 721, 193
- Pérez-González et al. (2003) Pérez-González, P. G., Zamorano, J., Gallego, J., et al. 2003, ApJ, 591, 827
- Pillepich et al. (2018) Pillepich, A., Springel, V., Nelson, D., et al. 2018a, MNRAS, 473, 4077
- Pillepich et al. (2018) Pillepich, A., Nelson, D., Hernquist, L., et al. 2018b, MNRAS, 475, 648
- Pillepich et al. (2019) Pillepich, A., Nelson, D., Springel, V., et al. 2019, MNRAS, 490, 3196
- Poggianti et al. (2017) Poggianti, B. M., Moretti, A., Gullieuszik, M., et al. 2017, ApJ, 844, 48
- Popesso et al. (2005) Popesso, P., Böhringer, H., Romaniello, M., et al. 2005, A&A, 433, 415
- Quilis et al. (2000) Quilis, V., Moore, B., & Bower, R. 2000, Science, 288, 1617
- Ramatsoku et al. (2019) Ramatsoku, M., Serra, P., Poggianti, B. M., et al. 2019, MNRAS, 487, 4580
- Rines & Geller (2008) Rines, K. & Geller, M. J. 2008, AJ, 135, 1837
- Roediger & Brüggen (2007) Roediger, E., & Brüggen, M. 2007, MNRAS, 380, 1399
- Sabatini et al. (2003) Sabatini, S., Davies, J., Scaramella, R., et al. 2003, MNRAS, 341, 981
- Sandage et al. (1985) Sandage, A., Binggeli, B., & Tammann, G. A. 1985, AJ, 90, 1759
- Sander & Hensler (2021) Sander, B. & Hensler, G. 2021, MNRAS, 501, 5330
- Sardaneta et al. (2022) Sardaneta, M. M., Amram, P., Boselli, A., et al. 2022, A&A, 659, A45
- Schechter (1976) Schechter, P. 1976, ApJ, 203, 297
- Schlegel et al. (1998) Schlegel, D. J., Finkbeiner, D. P., & Davis, M. 1998, ApJ, 500, 525
- Schulz & Struck (2001) Schulz, S. & Struck, C. 2001, MNRAS, 328, 185
- Shimakawa et al. (2018) Shimakawa, R., Kodama, T., Hayashi, M., et al. 2018, MNRAS, 473, 1977
- Shioya et al. (2008) Shioya, Y., Taniguchi, Y., Sasaki, S. S., et al. 2008, ApJS, 175, 128
- Sobral et al. (2011) Sobral, D., Best, P. N., Smail, I., et al. 2011, MNRAS, 411, 675
- Sobral et al. (2016) Sobral, D., Stroe, A., Koyama, Y., et al. 2016, MNRAS, 458, 3443
- Solanes et al. (2001) Solanes, J. M., Manrique, A., García-Gómez, C., et al. 2001, ApJ, 548, 97
- Solanes et al. (2002) Solanes, J. M., Sanchis, T., Salvador-Solé, E., et al. 2002, AJ, 124, 2440
- Somerville & Davé (2015) Somerville, R. S. & Davé, R. 2015, ARA&A, 53, 51
- Springel et al. (2018) Springel, V., Pakmor, R., Pillepich, A., et al. 2018, MNRAS, 475, 676
- Sternberg et al. (2003) Sternberg, A., Hoffmann, T. L., & Pauldrach, A. W. A. 2003, ApJ, 599, 1333
- Stevens et al. (2019) Stevens, A. R. H., Diemer, B., Lagos, C. del P., et al. 2019, MNRAS, 483, 5334
- Stott et al. (2007) Stott, J. P., Smail, I., Edge, A. C., et al. 2007, ApJ, 661, 95
- Stott et al. (2009) Stott, J. P., Pimbblet, K. A., Edge, A. C., et al. 2009, MNRAS, 394, 2098
- Stroe et al. (2017) Stroe, A., Sobral, D., Paulino-Afonso, A., et al. 2017, MNRAS, 465, 2916
- Sun et al. (2006) Sun, M., Jones, C., Forman, W., et al. 2006, ApJ, 637, L81
- Tonnesen et al. (2007) Tonnesen, S., Bryan, G. L., & van Gorkom, J. H. 2007, ApJ, 671, 1434
- Trentham & Hodgkin (2002) Trentham, N. & Hodgkin, S. 2002, MNRAS, 333, 423
- Tresse & Maddox (1998) Tresse, L. & Maddox, S. J. 1998, ApJ, 495, 691
- Umeda et al. (2004) Umeda, K., Yagi, M., Yamada, S. F., et al. 2004, ApJ, 601, 805
- van der Wel et al. (2014) van der Wel, A., Franx, M., van Dokkum, P. G., et al. 2014, ApJ, 788, 28
- Vollmer et al. (2001) Vollmer, B., Cayatte, V., Balkowski, C., & Duschl, W. J. 2001a, ApJ, 561, 708
- Vollmer et al. (2004) Vollmer, B., Balkowski, C., Cayatte, V., van Driel, W., & Huchtmeier, W. 2004, A&A, 419, 35
- Vollmer et al. (2008) Vollmer, B., Braine, J., Pappalardo, C., & Hily-Blant, P. 2008, A&A, 491, 455
- Vollmer et al. (2021) Vollmer, B., Fossati, M., Boselli, A., et al. 2021, A&A, 645, A121
- Vulcani et al. (2017) Vulcani, B., Treu, T., Nipoti, C., et al. 2017, ApJ, 837, 126
- Yagi et al. (2002) Yagi, M., Kashikawa, N., Sekiguchi, M., et al. 2002, AJ, 123, 87
- Yagi et al. (2010) Yagi, M., Yoshida, M., Komiyama, Y., et al. 2010, AJ, 140, 1814
- Yagi et al. (2017) Yagi, M., Yoshida, M., Gavazzi, G., et al. 2017, ApJ, 839, 65
- Westra et al. (2010) Westra, E., Geller, M. J., Kurtz, M. J., et al. 2010, ApJ, 708, 534
- Wetzel et al. (2013) Wetzel, A. R., Tinker, J. L., Conroy, C., & van den Bosch, F. C. 2013, MNRAS, 432, 336
- Wright et al. (2010) Wright, E. L., Eisenhardt, P. R. M., Mainzer, A. K., et al. 2010, AJ, 140, 1868-1881
- Zabel et al. (2022) Zabel, N., Brown, T., Wilson, C. D., et al. 2022, ApJ, 933, 10
- Zeimann et al. (2013) Zeimann, G. R., Stanford, S. A., Brodwin, M., et al. 2013, ApJ, 779, 137
- Zhang et al. (2013) Zhang, B., Sun, M., Ji, L., et al. 2013, ApJ, 777, 122