Direct observation of oxygen polarization in Sr2IrO4 by O -edge x-ray magnetic circular dichroism
Abstract
X-ray absorption spectroscopy (XAS) and magnetic circular dichroism (XMCD) measurements at the oxygen (O) -edge were performed to investigate the magnetic polarization of ligand O atoms in the weak ferromagnetic (WFM) phase of the Ir perovskite compound Sr2IrO4. With the onset of the WFM phase below K, XMCD signals corresponding to XAS peaks respectively identified as originating from the magnetic moments of apical and planar oxygen (OA and OP) in the IrO6 octahedra were observed. The observation of magnetic moments at OA sites is consistent (except for the relative orientation) with that suggested by prior muon spin rotation (SR) experiment in the non-collinear antiferromagnetic (NC-AFM) phase below K. Assuming that the OA magnetic moment observed by SR is also responsible for the corresponding XMCD signal, the magnetic moment of OP is estimated to be consistent with the previous SR result. Since the OA XMCD signal is mainly contributed by Ir 5 and orbitals which also hybridize with OP, it is inferred that the relatively large OP magnetic moment is induced by Ir 5 orbitals. Moreover, the inversion of OA moments relative to Ir moments between the two magnetic phases revealed by XMCD suggests the presence of competing magnetic interactions for OA, with which the ordering of OA moments in the NC-AFM phase may be suppressed to .
Layered iridium perovskites (Srn+1IrnO3n+1, …) are interesting materials to study the unconventional properties of 5 electrons arising from the competition between spin-orbit (SO) interactions, crystal fields, and Coulomb interactions (electron correlations) with comparable energies. Recent studies using various microscopic probes have revealed that the monolayer compound Sr2IrO4 can be regarded as a Mott insulator realized in the multiplet reorganized by the relatively strong SO interaction. The 5 (Ir4+) electrons occupy the states with effective angular momentum and spin are split into doublet and quartet, in which a gap is induced in the doublet band by the Coulomb repulsion, resulting in an insulator state with pseudo-spin that consists of three spin-orbit components in the band with equal weights:
where denotes the spin state Kim et al. (2008, 2009); Jackeli and Khaliullin (2009); Wang and Senthil (2011). While the model is supported by resonant and inelastic x-ray scattering Kim et al. (2009, 2012); Bertinshaw et al. (2019), the simple description with equal weights for the orbital populations has been called into question due to a non-negligible tetragonal distortion of the IrO6 octahedra Chapon and Lovesey (2011); Haskel et al. (2012); Moretti Sala et al. (2014); Jeong et al. (2020); Perkins et al. (2014).
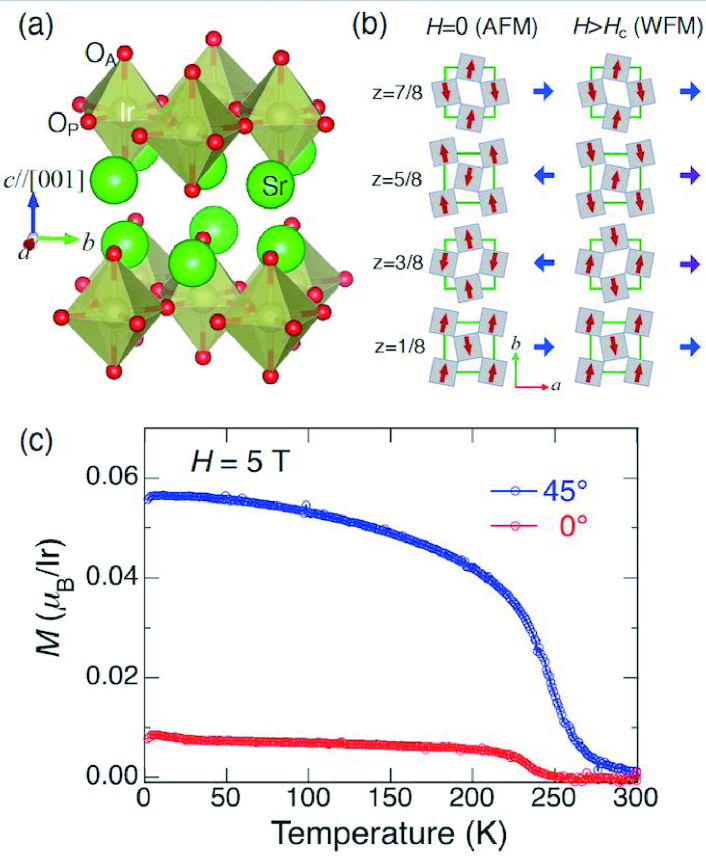
Sr2IrO4 crystalizes in a tetragonal structure with space group [see Fig. 1(a)], and exhibits antiferromagnetic (AFM) order at the transition temperature K under zero external field Crawford et al. (1994); Huang et al. (1994); Kim et al. (2009); Ge et al. (2011); Ye et al. (2013); Dhital et al. (2013); Sung et al. (2016). The AFM phase exhibits an extra feature of non-collinear (NC) Ir spin canting (11∘) within the plane [Fig. 1(b), left], which is mainly attributed to the rotation of IrO6 octahedra by the lattice distortion Kim et al. (2008). It also undergoes metamagnetic transition to weak ferromagnetic (WFM) phase due to the alignment of Ir canting along the axis above T [Fig. 1(b), right].
Nevertheless, that the NC-AFM phase does not necessarily fit within the framework of the model is also evident in its complex magnetic properties at lower temperatures. It was shown that bulk magnetization [] decreases anomalously at K and , suggesting that AFM correlations are enhanced below Chikara et al. (2009); Li et al. (2013). The decrease in the Ir-O-Ir bond angle in correlation with suggests that this is related with a change in the exchange coupling Li et al. (2013). Moreover, anomalous behavior of frequency-dependent ac-dielectric loss is reported around Chikara et al. (2009), strongly suggesting the critical slowing down of electric polarization fluctuation Katsura et al. (2005); Nagaosa (2008). Therefore, it is natural to infer the existence of electro-magnetic cross-correlations in the NC-AFM due to the inverse Dzyaloshinsky-Moriya (DM) mechanism (or the “spin current" mechanism Sergienko and Dagotto (2006)). While the DM interaction seems to have little role in the the framework, the rotation of the IrO6 octahedra generates a DM and a term to the magnetic interaction, which limits the mutual angle between adjacent pseudospins to with the octahedron rotation angle Jackeli and Khaliullin (2009).
Our previous muon spin rotation (SR) measurements of the internal magnetic field () in Sr2IrO4 revealed a gradual development of the second stage of magnetic order below Miyazaki et al. (2015). Furthermore, the felt by muons occupying sites close to the apical oxygen (OA) of the IrO6 octahedra showed a further increase, which can only be consistent with the selective appearance of ordered magnetic moments (0.03 at , antiparallel with the Ir moments) at the OA sites. This is reminiscent of the correlation between charge transfer to O and associated orbital polarization and the non-collinear Mn spin structure in the multiferroic YMn2O5 that we recently found by SR and resonant x-ray scattering, supporting the multiferroic scenario for the charge sector anomaly reported in the low - region Ishii et al. (2020).
However, it is difficult to determine only by SR as a local probe whether the O moments are in a long-range ordered state. Specifically, the possibility remains that the muon, as a pseudo-hydrogen, forms a hydroxyl-like OMu state that accompanies an electron localized on the adjacent magnetic ion (i.e., a polaron state) to modulate , as has recently been pointed out for other magnetic oxides Dehn et al. (2020, 2021). In any case, there is still no other information of O polarization in Sr2IrO4, remaining at the circumstantial stage.
The x-ray absorption spectroscopy (XAS) and magnetic circular dichroism (XMCD) at the O -absorption edge can provide useful information on O holes (unoccupied 2 orbitals) and their magnetic polarization in transition metal oxides, because the 2 orbitals are strongly linked with the ground state properties; it was used to reveal the mechanism of the metal-insulator transition of La1-xSrxMnO3 Koide et al. (2001) and the evolution of O orbital moment order in La1-xSrxCoO3 Okamoto et al. (2000); Medling et al. (2012). Furthermore, the O -edge XMCD of CrO2 has been used to explicitly demonstrate the delocalization of the hybridized states of Cr 3 and O 2 Goering et al. (2002).
Here, we present a study using O -edge XAS and XMCD in the WFM phase of Sr2IrO4 to examine the possible O hole polarization due to O 2-Ir 5 orbital hybridization. The XMCD signal was observed at 5 T in accordance with the development of the WFM phase below , where the signal from the planar oxygen (OP) is significantly enhanced compared to that from OA. The temperature dependence of the XMCD signal (with negative sign) is nearly proportional to the bulk magnetization measured under similar conditions, suggesting that magnetic moments of both OP and OA are parallel to those of Ir and their magnitude are proportional. Assuming that the OA magnetic moment observed by SR in the NC-AFM phase is also responsible for the corresponding XMCD signal, the magnetic moment of OP is extrapolated to be from the ratio of XMCD signal intensity between OP and OA. Since the OA signal is mainly contributed by Ir 5 and orbitals which also hybridize with OP, the relatively large is mainly attributed to the Ir 5 orbitals. This is consistent with recent reports that the orbitals predominantly contribute to the magnetism of Ir Jeong et al. (2020). Notably, the orientation of the OA moments relative to Ir moments in the WFM phase is reversed from that in the NC-AFM phase, suggesting that competing magnetic correlations are acting on OA, leading to the suppression of OA ordering to in the NC-AFM phase.
Single-crystal samples were grown by the self-flux method in platinum crucibles with Ir, SrCO3, and SrCl2 weighed and mixed in molar ratios of 1:2:7, respectively. The sintering conditions were from 1300 ∘C to 900 ∘C at a rate of 8 ∘C/hr, followed by cooling down to room temperature. Single crystals of approximately 1 mm mm (7–9 mg) in size were obtained, which were flaky and layered with a metallic luster. X-ray diffraction of the flake surface obtained with adhesive tape showed a plane of Sr2IrO4, and no Sr3Ir2O7 phase (which is easily stacked as an impurity) was detected. measurements with parallel and perpendicular to the axis showed a clear AFM/WFM transition around 240–250 K. At a low field ( T, ), showed a relatively rapid increase from 240 K to 220 K, followed by a gradual concave decrease with decreasing temperature. These behaviors of indicates that the samples were of the same high quality as reported in previous studies. The temperature dependence of measured by MPMS (Quantum Design) under T (corresponding to the WFM phase) with the polar angle between the axis and being 0∘ and 45∘ is shown in Fig. 1(c).
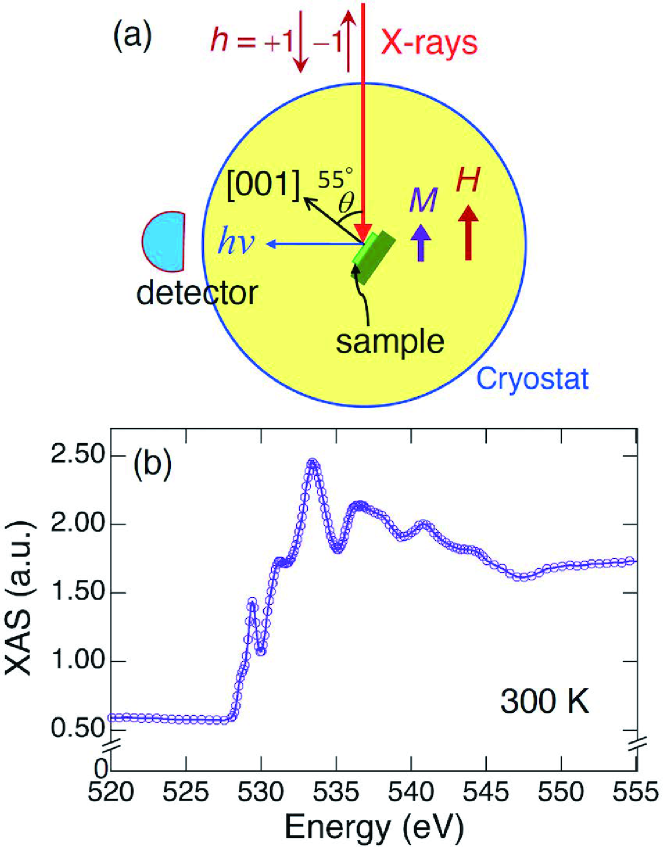
The XAS-XMCD measurements were performed using circularly polarized synchrotron radiation from the undulator beamline BL-16A at the Photon Factory, High Energy Accelerator Research Organization (KEK) Amemiya et al. (2010). A single crystal with surface obtained by exfoliation was mounted on the copper cold finger with silver grease, and sample temperature was controlled by a He gas-flow cryostat. The XAS spectra were obtained in the partial-fluorescence-yield mode over the energy range of 520–555 eV, centered around the O -edge (530 eV) with alternative polarization (helicity , where positive sign corresponds to the direction opposite to ), and temperature was scanned from 10 to 300 K. Due to geometrical restrictions among incident x-rays, superconducting magnet, and the x-ray detector, the experiment was conducted in the arrangement schematically shown in Fig. 2(a): the incident x-ray beam was parallel with the external magnetic field, and it was obliquely incident at (“magic angle” for eliminating the contribution of magnetic dipolar term) to the axis of the sample crystal. Since BL-16A is capable of polarization switching at about 10 Hz in combination with a kicker magnet Amemiya et al. (2013), an attempt was made to detect small changes in magnetic-field-induced O polarization by using the differential spectroscopy to suppress the effect of drift over a few hours. In addition, to eliminate systematic errors due to the different beam properties of the two undulators, XMCD measurements were made on two alternative combinations of mutual undulator polarity. Fig. 2(b) shows an example of raw XAS data observed at 300 K.
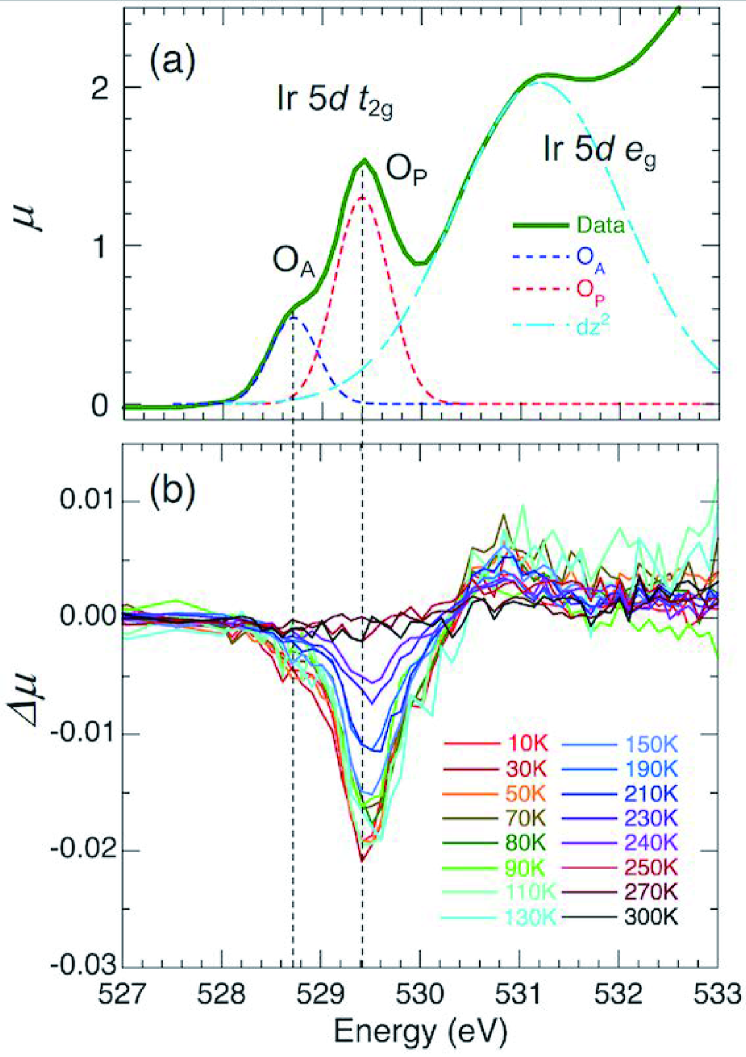
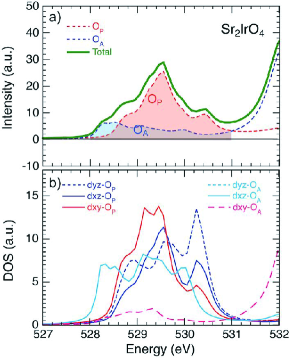
The helicity-dependent XAS spectra, , were obtained by subtracting averaged offset for eV as background and normalized by the average intensity for [see Fig. 2(b)]. It turned out that the total XAS spectrum [] was independent of temperature within the range of experimental accuracy. An example of obtained at 300 K are shown in Fig. 3(a). The peaks around 528–530 eV and 530–535 eV reproduce the previously reported O -edge XAS spectra which are respectively assigned to the and bands of Ir 5 mixed with O 2 Kim et al. (2008); Moon et al. (2006); Liu et al. (2015); Ilakovac et al. (2019). This is in good agreement with the estimation of the lowest energy unoccupied orbitals to be in the Ir band from the partial density of states obtained from band calculations Bhandari et al. (2019), and we can conclude that the spectra in Fig. 3(a) are assigned in the same manner. Furthermore, from comparison with the linear-polarization dependence of XAS reported earlier, we can infer that the peaks at 528.70(4) eV and 529.40(2) eV are respectively contributed by OA and OP of the IrO6 octahedra Moon et al. (2006); Ilakovac et al. (2019); Lu et al. (2018). The relative XAS signal intensity of OA and OP in the 300 K data is estimated to be from the curve fit [see Fig. 3(a)].
Here, let us examine the influence of polarization to the relative XAS intensity between OA and OP. For circularly polarized light, the dependence of is given by for OA and for OP, where and are the number of holes in the and states hybridized with orbitals Mizokawa et al. (2001). The ratio is then deduced from the equation
| (1) |
which yields for the present case of . This value suggests that the relative hole occupancy for , , and orbitals is approximately .
The XMCD spectrum is defined as
| (2) |
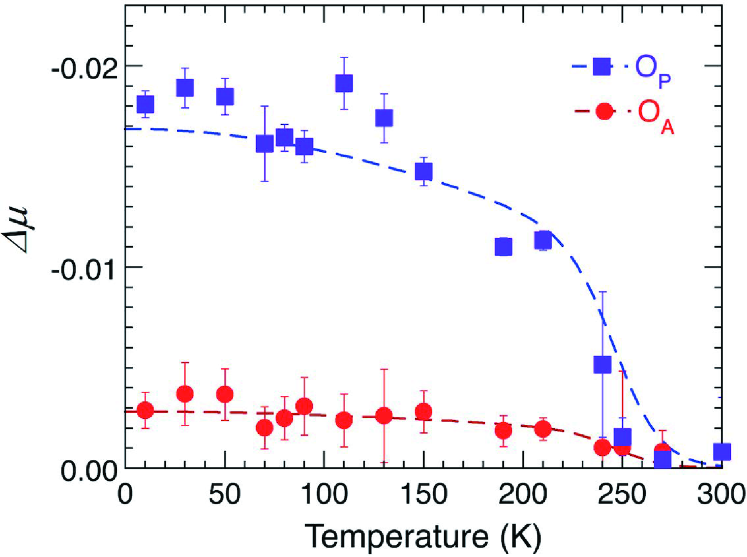
and the spectra for each measurement temperature are shown in Fig. 3(b), where the OP signal clearly increases with decreasing temperature from around . A similar tendency is also observed for the OA signal. These two peaks and the structure around 531 eV are approximated by three Gaussian distributions, and the peak intensities are estimated by curve fitting for eV). (The positive peak at 531 eV is considered an artifact because the intensity is only of the corresponding XAS signal.) As shown in Fig. 4, the temperature dependence of the peak intensity roughly follows that of measured under the similar conditions [ T, 45∘, see Fig. 1(c)]: the dashed curves in Fig. 4 are obtained by curve fitting using a form
with only the normalization factor as a parameter [yielding and for OP and OA, respectively]. This indicates that the O 2 magnetic moments are polarized, confirming that the polarization of the O 2 state is induced by hybridization between the O 2 and Ir 5 orbitals.
The negative sign of the OA/P signals implies that the orientation of the O 2 orbital magnetic moment is in the same direction as that of (and ). The value of used in deducing was roughly the same as the value of for the OP signal [see Fig. 2(b)], and hardly changed with temperature. Thus, the value of appears to suggest that the mixing between O 2 and Ir 5 is at most a few %. (Because the ambiguity in the energy range of signal integral makes it difficult to apply the sum rules Thole et al. (1992); Carra et al. (1993) to the XMCD spectra at the O -edge, we did not estimate the magnitude of the orbital moment from its signal intensity.) Moreover, it should be noted that XMCD is proportional to the net average moment which is biased by the residual ferromagnetic component associated with the WFM phase for (/Ir plus O moment contribution)].
However, the small does not necessarily mean that orbital hybridization is small, given the signal intensity originally expected for O -edge XMCD; the SO interaction to split O 2 and 2 levels is generally considered to be weak due to the small gradient of the Coulomb potential. Indeed, a strong hybridization of the O 2 and Ir 5 orbitals has been assumed to explain the significant reduction of the ordered Ir magnetic moment () Kim et al. (2008), the AFM exchange interaction between neighboring Ir ions, and the tilted Ir moment associated with octahedral rotation Jackeli and Khaliullin (2009); Perkins et al. (2014). Therefore, the results in Fig. 4 are only to suggest that the orientations and magnitudes of the O orbital moments relative those of Ir are nearly unchanged regardless of temperature in the WFM phase.
It is noticeable in Figs. 3 and 4 that, in view of the relative XAS signal intensity between OA and OP, the XMCD signal from OP is significantly enhanced compared to that from OA []. To theoretically explore its origin, we calculated XAS spectra and partial density of states using the FDMNES code Bunău and Joly (2009); Guda et al. (2015), and found that the Ir orbital is exclusively coupled with OP (see Supplemental Material SM for details). Assuming that the origin of the OA XMCD signal is common to inferred from SR in the NC-AFM phase, the OP moment size can be evaluated by scaling that of (, ) by the ratio of the XMCD signals of OP and OA normalized by the XAS intensity, , yielding .
In the ZF-SR measurement, it is difficult to distinguish the OP contribution proportional to Ir magnetization from that of Ir, and the magnetic polarization of OP was not considered in the previous SR study Miyazaki et al. (2015). Therefore, we reexamined whether the occurrence of the magnetic polarization of OP is consistent with the previous SR result. Specifically, assuming and that both OA and OP have the same ratio of spin to orbital moments and that their magnitudes do not change with the magnetic field, we simulated the internal magnetic field at the muon sites by changing the size of . As a result, it turned out that the simulation reproduces the observed SR spectra when in the same direction as Ir, which is in excellent agreement with that extrapolated from OP using the XAS-XMCD result. Thus, assuming that observed by SR in the NC-AFM phase is also responsible for the corresponding XMCD signal in the WFM phase, the XMCD and SR results are found to be perfectly in line with each other (except for the orientation relative to that of ). That both and are small is also consistent with the absence of a corresponding signal in the polarized neutron experiment in the WFM phase Jeong et al. (2020).
The earlier XAS measurements using linear-polarized light indicate that the OA signal mainly reflects the contribution of unoccupied 2/2 orbitals produced by the hybridization with the Ir 5 / orbitals, while the OP involves all of the 5 orbitals Lu et al. (2018); FDMNES calculations suggest that this is also the case for circularly polarized light (see SM SM ). From the partial density of states for OP XAS signal obtained from the FDMNES calculation, the relative contribution of the orbital to those of and is evaluated to be , in good agreement with the experimental evaluation. Thus, the relatively large OP signal suggests that the Ir 5 orbitals are mainly responsible for the OP polarization. This is consistent with recent reports that the orbitals are dominant in the Ir 5 ground state Chapon and Lovesey (2011); Haskel et al. (2012); Moretti Sala et al. (2014); Jeong et al. (2020).
The relationship between the temperature dependence of the XMCD signal in the WFM phase () and that of the spontaneous order of OA magnetic moments suggested by SR () is not obvious at this stage. The latter is observed only in the NC-AFM phase below around and reaches a maximum moment size of below 20 K. Nevertheless, considering that the direction of the OA moments in the NC-AFM phase below is reversed from that in the WFM phase, it is strongly suggested that competing magnetic correlations are acting on OA in the NC-AFM phase, suppressing the ordering of OA moments for . In the WFM phase, on the other hand, the AFM-like correlations are suppressed by the external magnetic field, and the OA moments are interpreted as aligned with the Ir magnetic moments over the whole temperature range below .
Concerning the anomalous ac-dielectric loss below in the NC-AFM phase Chikara et al. (2009), we point out that the Ir spins can be regarded to take on a cycloidal magnetic structure when the magnetic modulation vectors () are chosen in some specific directions connecting the IrO2 planes (see Supplemental Material SM including Refs.Kenzelmann et al. (2005); Yamasaki et al. (2007); Bogdanov et al. (2015)). This suggests that electric polarization () perpendicular to can be induced by the inverse DM mechanism. Such a cycloidal magnetic structure is always paired with one showing inverted spin rotation generating an opposite electric polarization (), and therefore considered to induce an anti-ferroelectric correlation without producing macroscopic polarization. Interestingly, it has been reported that the ac-dielectric loss in the -axis direction below is nearly twice as large as that in the -axis direction Chikara et al. (2009). This anisotropic response is consistent with what would be expected from the aforementioned direction of electric polarization and supports the scenario due to the inverse DM mechanism.
It should be noted that the temperature dependence of XMCD intensity in Fig. 4 seems to deviate considerably from that of at lower temperatures: it peaks around 40 K and 120 K and shows a minimum around . This trend is also confirmed for the integrated signals of the two peaks ( eV, not shown) in the XMCD spectra, suggesting that the orbital hybridization may vary slightly with temperature. It is tempting to imagine that this variation is also related to the anomalies described above SM , but further study will be needed to determine whether this is the case.
Finally, we note that the observed O -edge XMCD is unusually large compared to that in the compounds. Since the Ir electrons are subject to the strong SO interaction and their magnetization is related to a stronger orbital contribution than in most of the transition metals, it is interesting to compare the relative O -edge XMCD intensity to the magnitude of the average Ir magnetic moment in this context. Specifically, the relative XMCD intensity of the OP peak ( divided by ) is compared to the projected moment of Ir () to yield . Comparing this to the ferromagnetic CrO2 along the -axis Goering et al. (2002), the similar estimation yields which is 14 times smaller than that for Ir. Thus, the O -edge XMCD induced by Ir magnetic moment is more than an order of magnitude greater than that of the normal ferromagnets.
In summary, we have demonstrated by O -edge XAS-XMCD measurements that ligand O has finite orbital magnetic moments induced by hybridization with Ir 5 orbitals in the WFM phase of Sr2IrO4. We combined the present result with that of the previous SR in the NC-AFM phase to evaluate the magnitude of the weak magnetic moments at the OP and OA sites. The orientation of the OA moments relative to Ir moments inferred by XMCD is reversed from that in the NC-AFM phase, suggesting that competing magnetic correlations are acting on OA, leading to the suppression of OA ordering to in the latter phase. The magnetic polarization of O holes confirms modulation in charge distribution involving ligand O, and it also suggests that anti-ferroelectric correlations due to the inverse Dzyaloshinsky-Moriya mechanism is likely responsible for the observed anomalous dielectric loss in the NC-AFM phase.
We thank Y. Joly for help in using the FDMNES code. Thanks are also to H. Sagayama for helpful discussion. The XAS/XMCD experiments were conducted under the support of Inter-University-Research Programs by Institute of Materials Structure Science, KEK (Proposal No. 2021G544). This work was partially supported by JSPS KAKENHI (Grant No. 19K15033). We also acknowledge the Neutron Science and Technology Center, CROSS for the use of PPMS in their user laboratories.
References
- Kim et al. (2008) B. J. Kim, H. Jin, S. J. Moon, J.-Y. Kim, B.-G. Park, C. S. Leem, J. Yu, T. W. Noh, C. Kim, S.-J. Oh, J.-H. Park, V. Durairaj, G. Cao, and E. Rotenberg, Phys. Rev. Lett. 101, 076402 (2008).
- Kim et al. (2009) B. J. Kim, H. Ohsumi, T. Komesu, S. Sakai, T. Morita, H. Takagi, and T. Arima, Science 323, 1329 (2009).
- Jackeli and Khaliullin (2009) G. Jackeli and G. Khaliullin, Phys. Rev. Lett. 102, 017205 (2009).
- Wang and Senthil (2011) F. Wang and T. Senthil, Phys. Rev. Lett. 106, 136402 (2011).
- Kim et al. (2012) J. Kim, D. Casa, M. H. Upton, T. Gog, Y.-J. Kim, J. F. Mitchell, M. van Veenendaal, M. Daghofer, J. van den Brink, G. Khaliullin, and B. J. Kim, Phys. Rev. Lett. 108, 177003 (2012).
- Bertinshaw et al. (2019) J. Bertinshaw, Y. K. Kim, G. Khaliullin, and B. J. Kim, Annu. Rev. of Condens. Matter Phys. 10, 315 (2019).
- Chapon and Lovesey (2011) L. C. Chapon and S. W. Lovesey, J. Phys.: Condens. Matt. 23, 252201 (2011).
- Haskel et al. (2012) D. Haskel, G. Fabbris, M. Zhernenkov, P. P. Kong, C. Q. Jin, G. Cao, and M. van Veenendaal, Phys. Rev. Lett. 109, 027204 (2012).
- Moretti Sala et al. (2014) M. Moretti Sala, S. Boseggia, D. F. McMorrow, and G. Monaco, Phys. Rev. Lett. 112, 026403 (2014).
- Jeong et al. (2020) J. Jeong, B. Lenz, A. Gukasov, X. Fabrèges, A. Sazonov, V. Hutanu, A. Louat, D. Bounoua, C. Martins, S. Biermann, V. Brouet, Y. Sidis, and P. Bourges, Phys. Rev. Lett. 125, 097202 (2020).
- Perkins et al. (2014) N. B. Perkins, Y. Sizyuk, and P. Wölfle, Phys. Rev. B 89, 035143 (2014).
- Crawford et al. (1994) M. K. Crawford, M. A. Subramanian, R. L. Harlow, J. A. Fernandez-Baca, Z. R. Wang, and D. C. Johnston, Phys. Rev. B 49, 9198 (1994).
- Huang et al. (1994) Q. Huang, J. Soubeyroux, O. Chmaissem, I. Sora, A. Santoro, R. Cava, J. Krajewski, and W. Peck, J. Solid State Chem. 112, 355 (1994).
- Ge et al. (2011) M. Ge, T. F. Qi, O. B. Korneta, D. E. De Long, P. Schlottmann, W. P. Crummett, and G. Cao, Phys. Rev. B 84, 100402 (2011).
- Ye et al. (2013) F. Ye, S. Chi, B. C. Chakoumakos, J. A. Fernandez-Baca, T. Qi, and G. Cao, Phys. Rev. B 87, 140406 (2013).
- Dhital et al. (2013) C. Dhital, T. Hogan, Z. Yamani, C. de la Cruz, X. Chen, S. Khadka, Z. Ren, and S. D. Wilson, Phys. Rev. B 87, 144405 (2013).
- Sung et al. (2016) N. H. Sung, H. Gretarsson, D. Proepper, J. Porras, M. L. Tacon, A. V. Boris, B. Keimer, and B. J. Kim, Phil. Mag. 96, 413 (2016).
- Chikara et al. (2009) S. Chikara, O. Korneta, W. P. Crummett, L. E. DeLong, P. Schlottmann, and G. Cao, Phys. Rev. B 80, 140407 (2009).
- Li et al. (2013) L. Li, P. P. Kong, T. F. Qi, C. Q. Jin, S. J. Yuan, L. E. DeLong, P. Schlottmann, and G. Cao, Phys. Rev. B 87, 235127 (2013).
- Katsura et al. (2005) H. Katsura, N. Nagaosa, and A. V. Balatsky, Phys. Rev. Lett. 95, 057205 (2005).
- Nagaosa (2008) N. Nagaosa, J. Phys.: Condens. Matt. 20, 434207 (2008).
- Sergienko and Dagotto (2006) I. A. Sergienko and E. Dagotto, Phys. Rev. B 73, 094434 (2006).
- Momma and Izumi (2011) K. Momma and F. Izumi, J. Appl. Crystallogr. 44, 1272 (2011).
- Miyazaki et al. (2015) M. Miyazaki, R. Kadono, M. Hiraishi, A. Koda, K. M. Kojima, K. Ohashi, T. Takayama, and H. Takagi, Phys. Rev. B 91, 155113 (2015).
- Ishii et al. (2020) Y. Ishii, S. Horio, Y. Noda, M. Hiraishi, H. Okabe, M. Miyazaki, S. Takeshita, A. Koda, K. M. Kojima, R. Kadono, H. Sagayama, H. Nakao, Y. Murakami, and H. Kimura, Phys. Rev. B 101, 224436 (2020).
- Dehn et al. (2020) M. H. Dehn, J. K. Shenton, S. Holenstein, Q. N. Meier, D. J. Arseneau, D. L. Cortie, B. Hitti, A. C. Y. Fang, W. A. MacFarlane, R. M. L. McFadden, G. D. Morris, Z. Salman, H. Luetkens, N. A. Spaldin, M. Fechner, and R. F. Kiefl, Phys. Rev. X 10, 011036 (2020).
- Dehn et al. (2021) M. H. Dehn, J. K. Shenton, D. J. Arseneau, W. A. MacFarlane, G. D. Morris, A. Maigné, N. A. Spaldin, and R. F. Kiefl, Phys. Rev. Lett. 126, 037202 (2021).
- Koide et al. (2001) T. Koide, H. Miyauchi, J. Okamoto, T. Shidara, T. Sekine, T. Saitoh, A. Fujimori, H. Fukutani, M. Takano, and Y. Takeda, Phys. Rev. Lett. 87, 246404 (2001).
- Okamoto et al. (2000) J. Okamoto, H. Miyauchi, T. Sekine, T. Shidara, T. Koide, K. Amemiya, A. Fujimori, T. Saitoh, A. Tanaka, Y. Takeda, and M. Takano, Phys. Rev. B 62, 4455 (2000).
- Medling et al. (2012) S. Medling, Y. Lee, H. Zheng, J. F. Mitchell, J. W. Freeland, B. N. Harmon, and F. Bridges, Phys. Rev. Lett. 109, 157204 (2012).
- Goering et al. (2002) E. Goering, A. Bayer, S. Gold, G. Schütz, M. Rabe, U. Rüdiger, and G. Güntherodt, Europhys. Lett. 58, 906 (2002).
- Amemiya et al. (2010) K. Amemiya, A. Toyoshima, T. Kikuchi, T. Kosuge, K. Nigorikawa, R. Sumii, and K. Ito, AIP Conf. Proc. 1234, 295 (2010).
- Amemiya et al. (2013) K. Amemiya, M. Sakamaki, T. Koide, K. Ito, K. .Tsuchiya, K. Harada, T. Aoto, T. Shioya, T. Obina, S. Yamamoto, and Y. Kobayashi, J. Phys.: Conf. Ser. 425, 152015 (2013).
- Moon et al. (2006) S. J. Moon, M. W. Kim, K. W. Kim, Y. S. Lee, J.-Y. Kim, J.-H. Park, B. J. Kim, S.-J. Oh, S. Nakatsuji, Y. Maeno, I. Nagai, S. I. Ikeda, G. Cao, and T. W. Noh, Phys. Rev. B 74, 113104 (2006).
- Liu et al. (2015) X. Liu, M. P. M. Dean, J. Liu, S. G. Chiuzbăian, N. Jaouen, A. Nicolaou, W. G. Yin, C. R. Serrao, R. Ramesh, H. Ding, and J. P. Hill, J. Phys.: Condens. Matt. 27, 202202 (2015).
- Ilakovac et al. (2019) V. Ilakovac, A. Louat, A. Nicolaou, J.-P. Rueff, Y. Joly, and V. Brouet, Phys. Rev. B 99, 035149 (2019).
- Bhandari et al. (2019) C. Bhandari, Z. S. Popović, and S. Satpathy, New J. Phys. 21, 013036 (2019).
- Lu et al. (2018) X. Lu, P. Olalde-Velasco, Y. Huang, V. Bisogni, J. Pelliciari, S. Fatale, M. Dantz, J. G. Vale, E. C. Hunter, J. Chang, V. N. Strocov, R. S. Perry, M. Grioni, D. F. McMorrow, H. M. Rønnow, and T. Schmitt, Phys. Rev. B 97, 041102 (2018).
- Mizokawa et al. (2001) T. Mizokawa, L. H. Tjeng, G. A. Sawatzky, G. Ghiringhelli, O. Tjernberg, N. B. Brookes, H. Fukazawa, S. Nakatsuji, and Y. Maeno, Phys. Rev. Lett. 87, 077202 (2001).
- Thole et al. (1992) B. T. Thole, P. Carra, F. Sette, and G. van der Laan, Phys. Rev. Lett. 68, 1943 (1992).
- Carra et al. (1993) P. Carra, B. T. Thole, M. Altarelli, and X. Wang, Phys. Rev. Lett. 70, 694 (1993).
- Bunău and Joly (2009) O. Bunău and Y. Joly, J. Phys.: Condens. Matter 21, 345501 (2009).
- Guda et al. (2015) S. A. Guda, A. A. Guda, M. A. Soldatov, K. A. Lomachenko, A. L. Bugaev, C. Lamberti, W. Gawelda, C. Bressler, G. Smolentsev, A. V. Soldatov, and Y. Joly, J. Chem. Theory Comput. 11, 4512 (2015).
- (44) See Supplemental Material at [URL will be inserted by publisher] for details on the calculated XAS spectra using the FDMNES code and on the inverse DM mechanism envisaged for the origin of anomalous dielectric loss at lower temperatures.
- Kenzelmann et al. (2005) M. Kenzelmann, A. B. Harris, S. Jonas, C. Broholm, J. Schefer, S. B. Kim, C. L. Zhang, S.-W. Cheong, O. P. Vajk, and J. W. Lynn, Phys. Rev. Lett. 95, 087206 (2005).
- Yamasaki et al. (2007) Y. Yamasaki, H. Sagayama, T. Goto, M. Matsuura, K. Hirota, T. Arima, and Y. Tokura, Phys. Rev. Lett. 98, 147204 (2007).
- Bogdanov et al. (2015) N. A. Bogdanov, V. M. Katukuri, J. Romhányi, V. Yushankhai, V. Kataev, B. Büchner, J. van den Brink, and L. Hozoi, Nature Commun. 6, 7306 (2015).
Supplemental Material: Direct observation of oxygen polarization in Sr2IrO4 by O -edge x-ray magnetic circular dichroism
R. Kadono et al.
I O -edge XAS spectra calculated by the FDMNES code
We have conducted theoretical calculations on the O -edge XAS spectra under circular polarization observed in Sr2IrO4 to evaluate the contributions from planar (OP) and apical (OA) oxygen using the FDMNES code Bunău and Joly (2009); Guda et al. (2015). The calculations were performed under a variety of input conditions, and the result best reproduce the energy dependence of the observed XAS spectra is shown in Fig S1(a). In this calculation, we used the Muffin-tin approximation with a cluster radius of 7 Å, and considered spin-orbit interaction and the on-site Coulomb energy (Hubbard eV) for Ir. We did not consider the screening due to oxygen excitation. Instead, the appropriate energy shift was assumed in the convolution calculation (to produce a Lorentzian absorption spectrum with the contribution from the occupied state removed) to reproduce the pre-edge spectra. The same convolution procedure was applied to the calculated partial density of states (DOS) for OP and OA, where the obtained DOS spectra for Ir 5 orbitals are shown in Fig S1(b).
The calculated result (solid line) in Fig S1(a) shows that the peak structures around 528.7 eV and 529.4 eV in the observed XAS spectra are well reproduced, although the linewidth is slightly wider and the shape is more complicated. It is also noticeable that the peak due to the hybridization between the OA and orbitals appears at higher energies than the experimental value. The corresponding partial DOS spectra in Fig S1(b) indicate that the XAS intensity over the energy range below 531 eV (hatched areas in Fig. S1) is dominated by the O 2-Ir 5 hybridization, and the relative ratio of the OA and OP signal intensities over the corresponding energy region is calculated to be OA : OP = 1: 2.71. Although the separation of the OA and OP spectra is not good in this calculation, the obtained ratio agrees with the experimental value [OA : OP = 1 : 2.39(24)] within the error, supporting our interpretation.
Furthermore, looking at the partial DOS of the Ir orbitals contributing to the XAS spectra of OP and OA in the same energy region, it can be seen that all , , and orbitals contribute almost equally in the OP XAS intensity, whereas there is almost no contribution from in that of OA. The ratio of the contribution of the and orbitals to the OP XAS intensity is calculated to be .
II Possible anti-ferroelectric correlation due to the spin current mechanism
Cycloidal helical magnetism is one of the most typical causes of multiferroic behavior accompanying ferroelectricity. In the most general case, when two angled magnetic moments and with spin-orbit interactions are aligned across an anion, the electron distribution is expected to shift in the direction perpendicular to the vector connecting via the anions Katsura et al. (2005). This phenomenon can be expressed by the following equation,
| (S1) |
where is the induced electric dipole moment, is a constant that depends on the spin-orbit interaction and the hopping integral, and is the vector connecting the two spin sites. This expression is closely related to the Hamiltonian for the Dzyaloshinsky-Moriya (DM) interaction,
| (S2) |
which explains the phenomenon that the two spins tilt when the coupling angle determined by the crystal structure is finite. However, when the spins are fixed in Eq. (S2) and is taken as a variable, it has the same meaning as in Eq. (S1). This effect of a tilted spin pair giving rise to an electric dipole moment is called the inverse DM interaction. Although Eq. (S1) originally focused on the electron distribution and ignored the atomic displacement Katsura et al. (2005), it holds for both cases.
Now, when is always in the same direction, the electric dipole moments will also add up to produce a macroscopic electric polarization. Considering a one-dimensional spin chain, this condition is satisfied for the cycloidal helix where magnetic modulation vector and the spin rotation plane are parallel. For a common modulation vector, the electric polarization is reversed when the direction of spin rotation is opposite. Such an electric polarization generation mechanism is also called a “spin current mechanism” Sergienko and Dagotto (2006), and it has been experimentally verified that many materials, including TbMnO3 Kenzelmann et al. (2005); Yamasaki et al. (2007), exhibit multiferroic ordering by this mechanism.
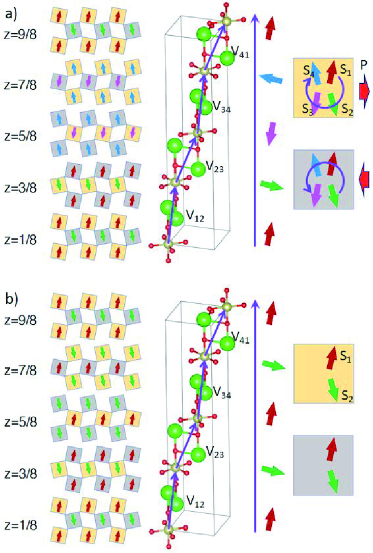
As shown in Fig. S2(a), a closer look at the 3D magnetic structure of Ir in the NC-AFM phase of Sr2IrO4 shows that a series of the connection vectors can be taken along the axis to have a cycloidal component parallel to the helical plane of spin rotation [i.e., ]. Therefore, the spin current mechanism may cause electric polarization perpendicular to such a modulation vector. On the other hand, since the cycloid along the vector connecting neighboring Ir sites rotates in the opposite direction, the electric polarization is also reversed and no bulk electric polarization is generated. The existence of such anti-ferroelectric correlations explains the experimental fact of the anomalous increase in ac-dielectric loss below K Chikara et al. (2009). The same consideration for the WFM phase in Fig. S2(b) shows that the magnetic structure along the same modulation vector as in Fig. S2(a) is ferrimagnetic and no microscopic electric polarization occurs.
The electric polarization induced by the spin current mechanism is expected to be accompanied by a change in the relative electron distribution (i.e., orbital hybridization) between cations and anions; given that the increase in anti-ferroelectric correlation below indicates a phase transition (or crossover) to the final 3D spin structure of Ir, this would be accompanied by a change in the Ir-O Sr-O-Ir electron distribution along the magnetic modulation vector. The ordering of the magnetic moment of the apical oxygen suggested by SR Miyazaki et al. (2015) can be interpreted as a consequence of modulated hybridization. It is interesting to note that an anomalous electron distribution involving Sr is suggested by electron spin resonance (ESR) experiments in the WFM phase at low temperatures (4 K) Bogdanov et al. (2015).