TransWorldNG: Traffic Simulation via Foundation Model
Abstract
Traffic simulation is a crucial tool for transportation decision-making and policy development. However, achieving realistic simulations in the face of the high dimensionality and heterogeneity of traffic environments is a longstanding challenge. In this paper, we present TransWordNG, a traffic simulator that uses Data-driven algorithms and Graph Computing techniques to learn traffic dynamics from real data. The functionality and structure of TransWorldNG are introduced, which utilize a foundation model for transportation management and control. The results demonstrate that TransWorldNG can generate more realistic traffic patterns compared to traditional simulators. Additionally, TransWorldNG exhibits better scalability, as it shows linear growth in computation time as the scenario scale increases. To the best of our knowledge, this is the first traffic simulator that can automatically learn traffic patterns from real-world data and efficiently generate accurate and realistic traffic environments.
I Introduction
Modeling and simulating transportation systems realistically pose a challenge due to the high variability and diversity of traffic behaviors, as well as the spatial and temporal fluctuations that are difficult to model. Various traffic simulation models such as SUMO [1], MATSim [2], AimSun [3], VISSIM [4], and others have been developed to simulate traffic systems with diverse scales. Although these models are useful, they still encounter limitations in realistically simulating the growing complexity and heterogeneity of urban transportation systems due to the restricted capability of the underlying parametric models and manually encoded rules [5]. To address this gap, advanced traffic simulation techniques are necessary that can generate more realistic traffic behaviors from real-world data [6, 7]. This is critical for aiding traffic planners and policymakers in making well-informed decisions.
Traditional approaches often rely on physical dynamic models and implement data-driven approaches to learn parameters in the pre-defined models [8]. However, such approaches may introduce oversimplifications and assumptions that curtail their accuracy and applicability [9]. As a result, traditional models are suitable for specific tasks but not scalable or extensible, posing challenges in adapting to varying environments and managing large and complex data inputs. Furthermore, the intrinsic complexity of transportation systems, influenced by diverse agents and factors that affect traffic behavior, makes it a challenging task to realistically capture the temporal variability and complexity of traffic conditions. The dynamic and constantly evolving nature of transportation environments necessitates a flexible approach to simulating the traffic system that can quickly adapt to changes in the environment.
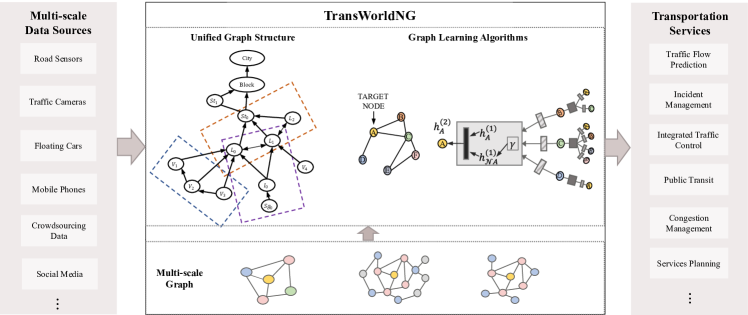
To solve these problems in traffic simulation, we have developed TransWorldNG (where NG denotes the new generation), which automatically generates simulation scenarios from multi-scale and high-dimensional data, the framework of TransWorldNG is shown in Fig. 1. The first generation of TransWorld was initially developed by CAST Lab that uses Agent-based modeling (ABM) technology and object-oriented programming [10, 11, 7]. Building on its framework, we have re-designed a data-driven traffic simulator that is empowered by the foundation model utilizing Data-driven algorithms and Graph Computing techniques to simulate intricate traffic systems [12].
One of the key features of TransWorldNG is the utilization of graph structures and dynamic graph generation algorithms to model the intricate relationships and interactions among agents in the traffic system. This approach enhances previous ABM-based traffic simulation techniques by providing a more comprehensive and adaptable representation of the changing environment. Additionally, the use of graph structures and dynamic graph generation algorithms can enhance the scalability and efficiency of TransWorldNG by enabling parallel processing of the simulation and supporting the handling of large-scale data.
To overcome the limitations of traditional modeling approaches that rely on physical dynamics models, TransWorldNG adopts a data-driven approach with behavior models that are directly learned from real-world data. This approach provides a more direct and dependable representation of the real scenario. Furthermore, the graph structure of TransWorldNG allows for adaptive scaling, which amplifies its flexibility. Users can easily modify the nodes or edges in the graph structure to input multi-source data, with varying degrees of granularity.
This study presents the functionality and structure of TransWorldNG, the contributions of this paper are as follows:
-
•
A unified graph-based structure has been proposed that permits a flexible representation of the varying traffic environments, facilitating TransWorldNG to adapt to the environment changes in real-time.
-
•
A data-driven traffic simulation framework has been introduced which can realistically and efficiently learn traffic dynamics from real-world data.
-
•
The underlying software designing principles, comprising of system structure, workflows, and interfaces for users, have been provided.
II Related Works
II-A Multi-agent Traffic Modeling and Simulation
Agent-based modeling is a widely used technique for modeling and simulating transportation systems, which involves simulating the interactions of a large number of agents in a system with different characteristics, behaviors, and interactions with other agents [13, 14]. The theoretical framework has developed over several decades, including game theory, control theory, graph theory, and complex network theory [13, 15]. Transportation systems can be considered as multi-agent systems composed of different types of traffic participants, each with their own goals and behaviors, and their interactions affect the changes in the entire traffic system. Recent research on modeling and simulation of complex traffic systems is mostly based on multi-agent methods [14, 16].
The modeling of multi-agent systems involves using mathematical models to describe the behavior of individual agents or the entire system in order to better understand traffic evolution and complex traffic phenomena [17]. In the field of traffic systems, models are typically categorized into three types based on their modeling scales: macroscopic, mesoscopic, and microscopic models [9, 14, 2, 18].
II-B Data-driven Traffic Modeling and Simulation
The advancement of modeling complex transportation systems is expected to be driven by the availability of large-scale and multi-source data [19]. Data-driven techniques in transportation modeling utilize machine learning, deep learning, and other algorithms to analyze large-scale and multi-source data and learn rules directly from the data to models. This is in contrast to knowledge-driven approaches, which rely on human-defined rules and models to develop transportation models [20]. Urban big data can be used to assess the effects of different characteristics, such as road network topology and intersection shapes, on traffic flow in urban areas. Machine learning techniques, such as neural networks, support vector machines, and regression trees, can be trained using these data to anticipate traffic flow, speed, and congestion [21]. This can provide valuable insights into the behavior of urban transportation systems and inform effective transportation planning and management strategies. Previous data-driven approaches in transportation research are mostly employed for single-task research, such as forecasting vehicle trajectories, predicting traffic congestion, route optimization, and so on [22, 23, 24]. These approaches have limitations in their ability to handle the complex interactions between multiple types of agents in a heterogeneous environment for large-scale systems.
III Framework, System Structure, and Workflows of TransWorldNG
III-A The Framework of TransWorldNG
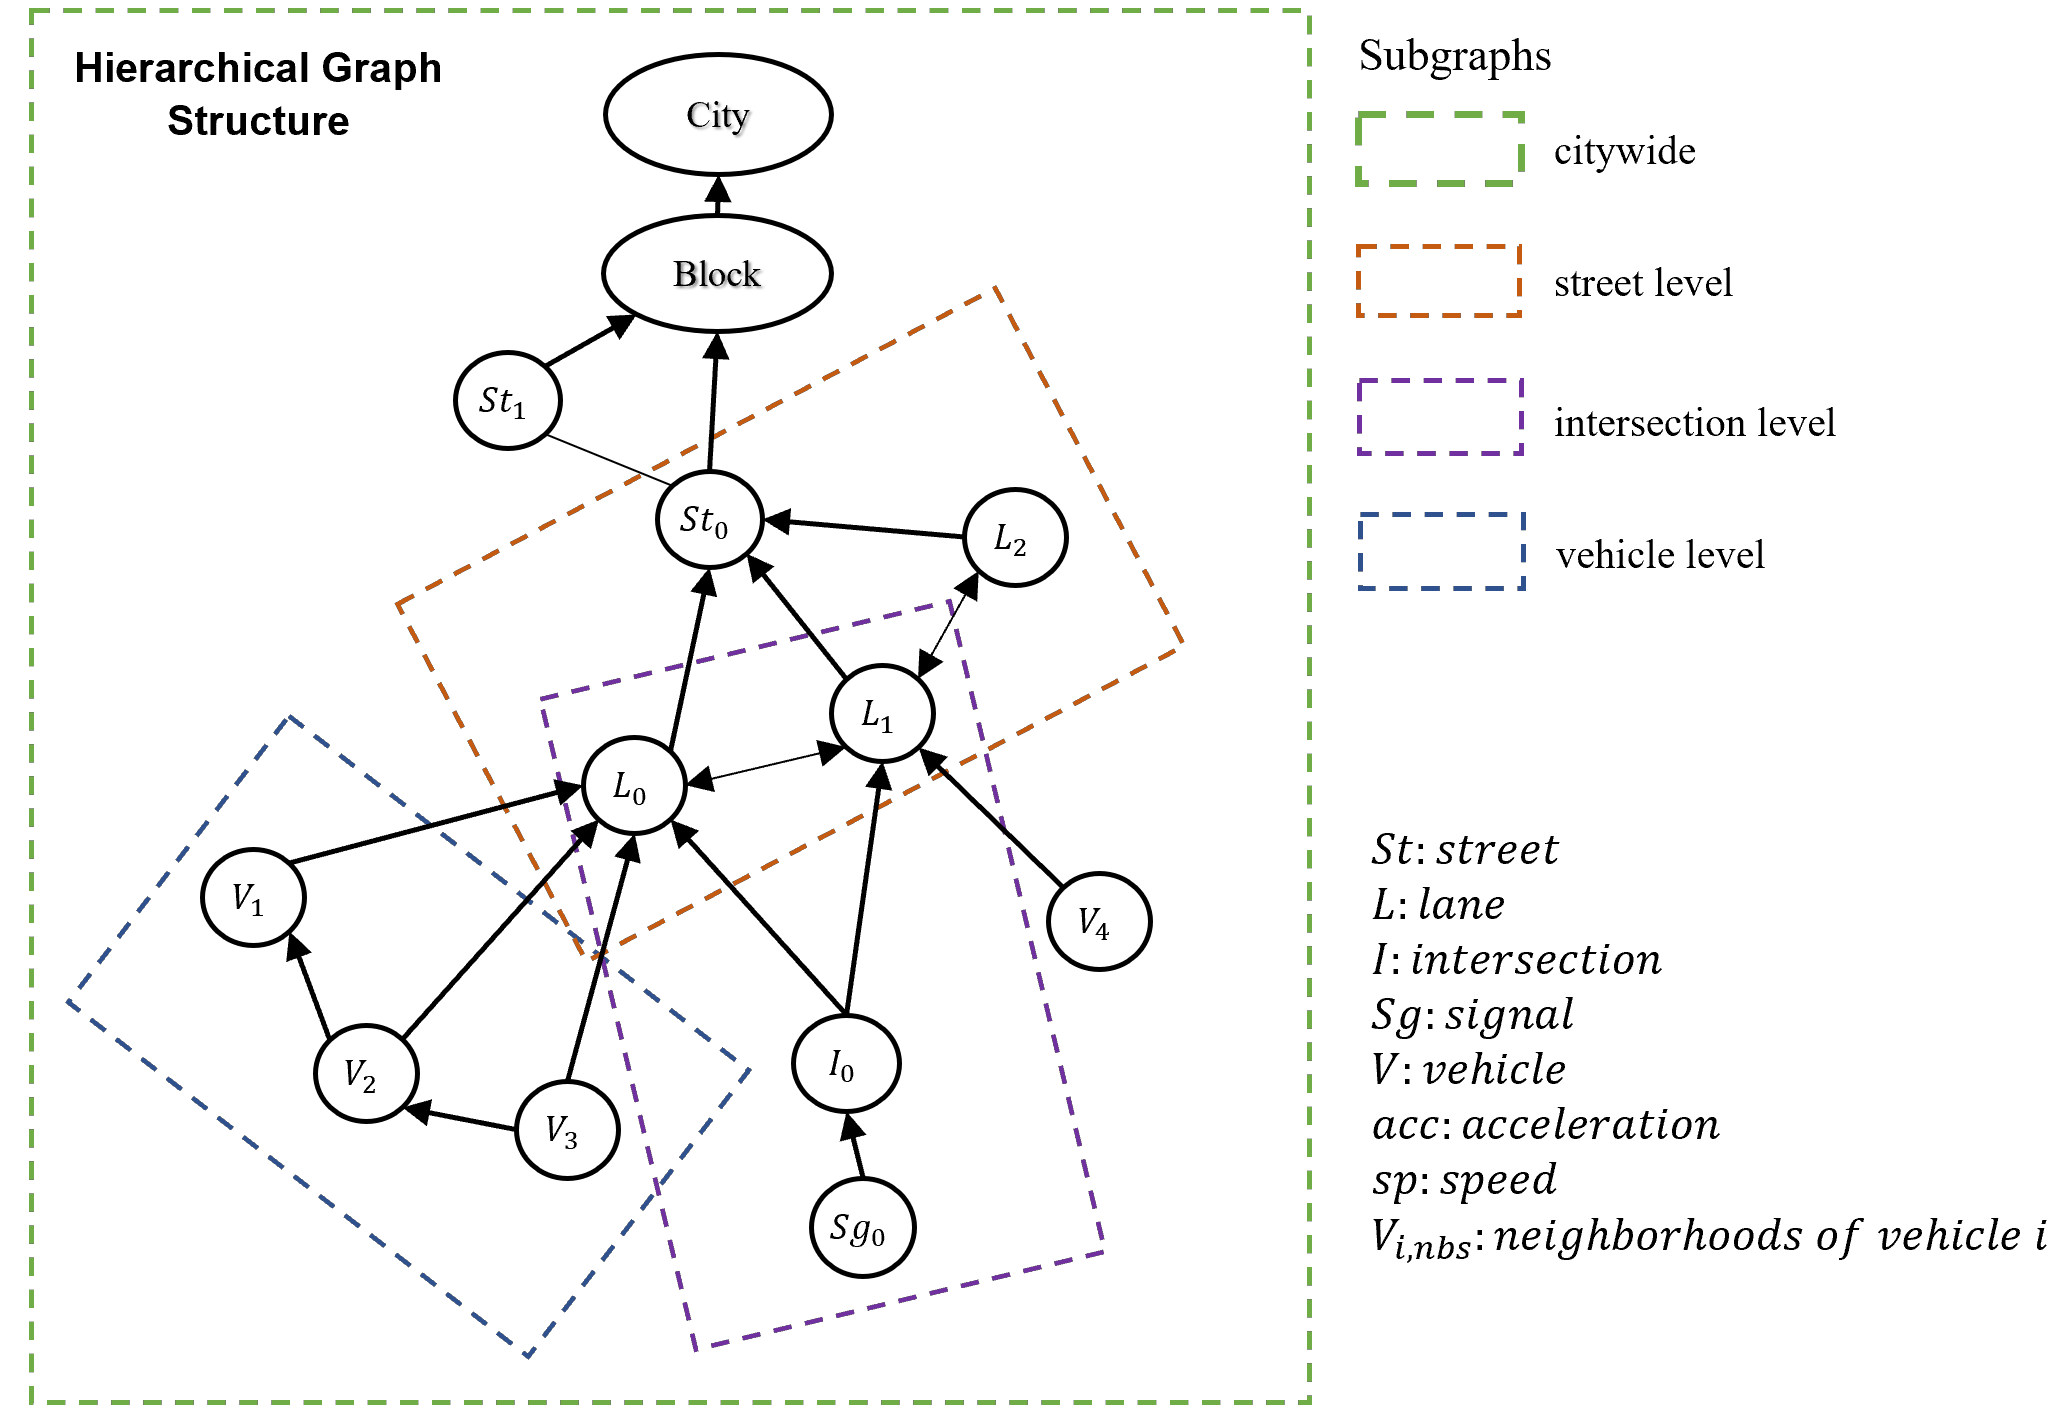
Transportation system modeling traditionally involves defining the behavior of agents and their interactions beforehand, which is time-consuming and error-prone when new agents or scenarios need to be added. A graph-based approach to transportation system modeling offers a more efficient and adaptable solution, as it allows for the representation of data and relationships between agents in a natural and straightforward way [25, 26]. By using a graph data structure, new data can be added to the system by introducing new nodes or edges to the graph, without the need to hard-code specific behaviors or rules. Fig. 2 illustrates the topology of the hierarchical graph of the dynamic traffic system at various scales, from the vehicle level presenting the dynamics of individual vehicles to the intersection level showing traffic signal control strategies and traffic conditions at bottlenecks, to the street, block, and city levels showing strategies and policies that have impacts on a larger scale. This multi-scale approach allows TransWorldNG NG to provide a comprehensive view of the traffic system and enable transportation planners to make informed decisions based on the simulation results.
III-A1 Representation of transportation system via heterogeneous dynamic graphs
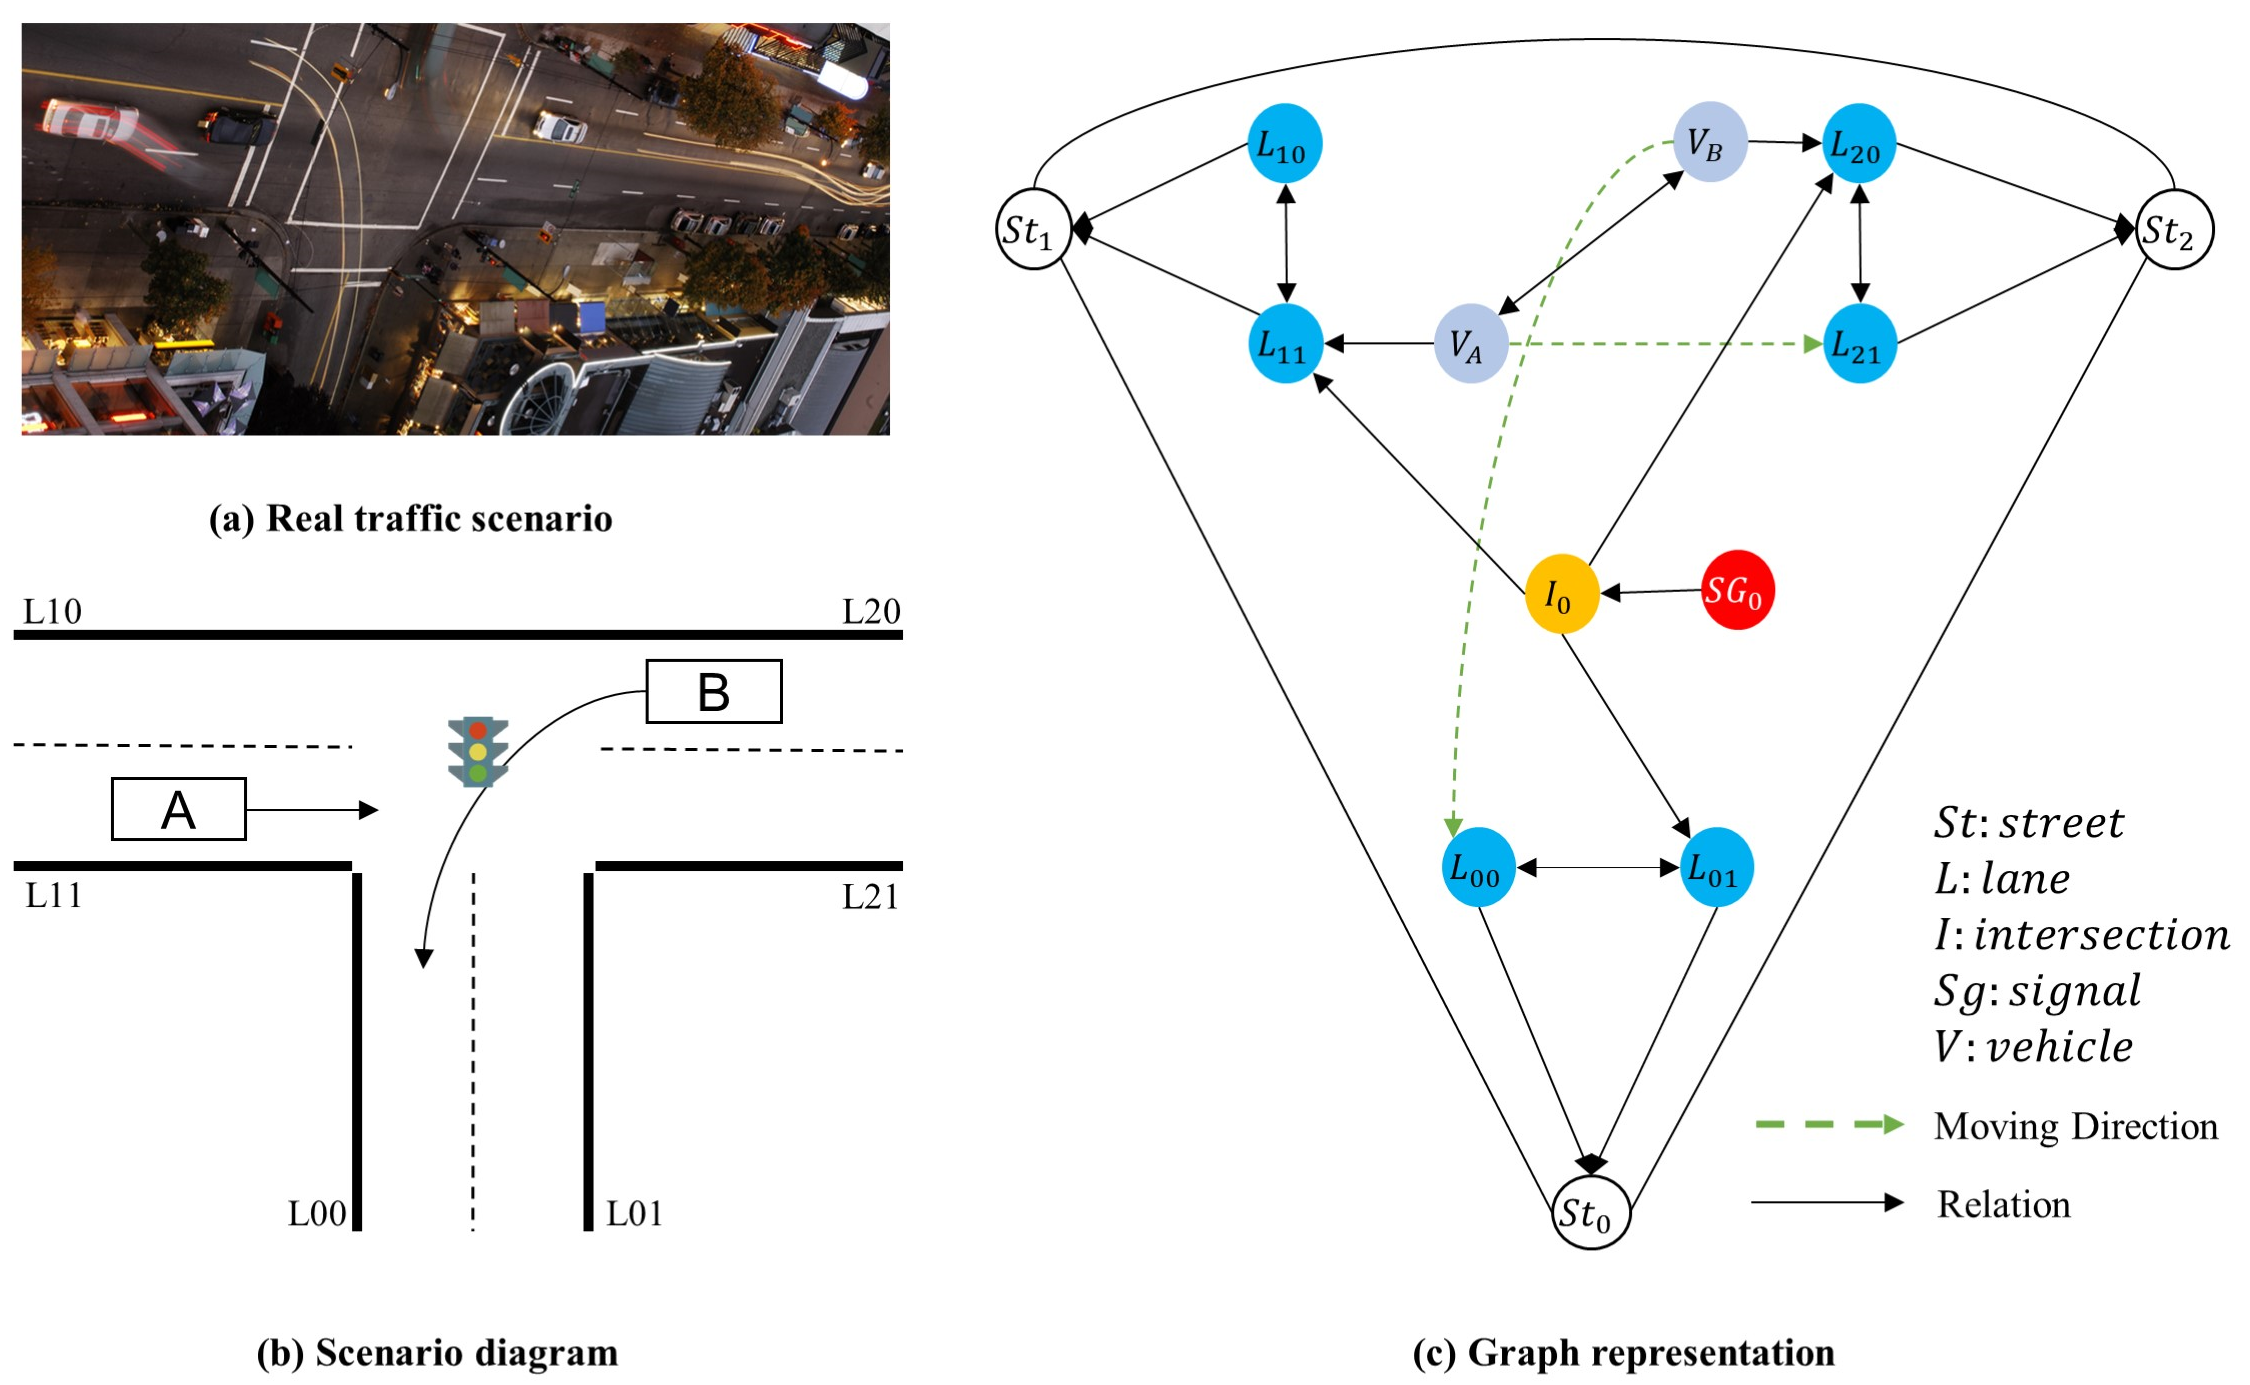
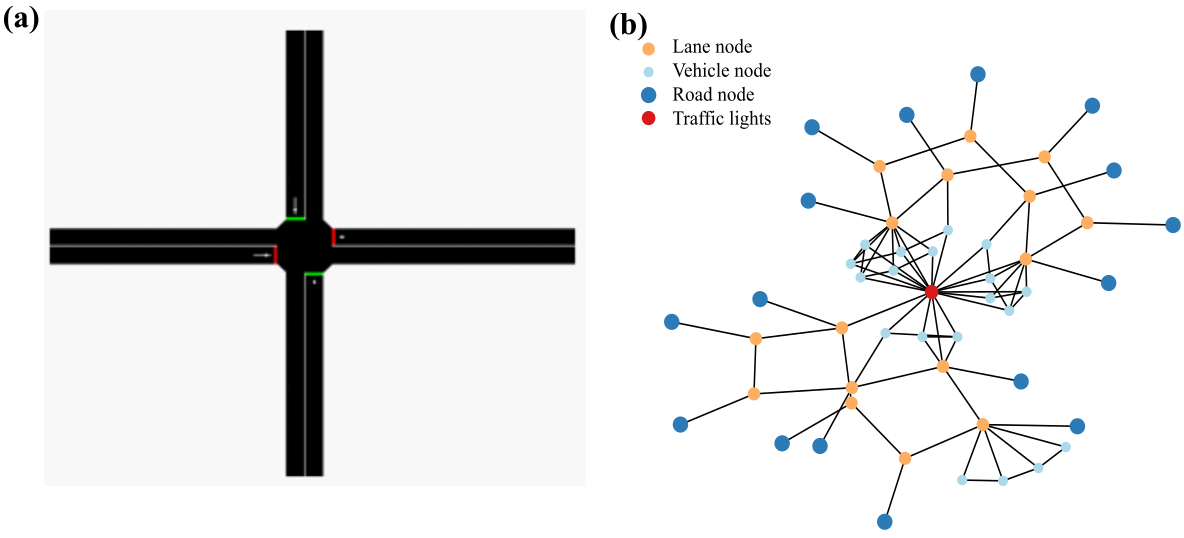
TransWorldNG uses a unified graph data structure to represent traffic systems, this makes it flexible to changes in the environment, as it would allow for easy updates and modifications. New data can be added to the graph by introducing new nodes or edges, without the need to hard-code specific behaviors or rules. This flexibility and adaptability make it easier to model and simulate large and complex transportation systems. Fig. 3 illustrates an example of a traffic scenario represented as a graph, showing how the relationships and interactions in a transportation system can be represented using a graph.
Mathematically, we can define the traffic system as a dynamic heterogeneous graph, . The graph consists of vertices () that represent agents and edges () that define the relationships between those agents. Each agent () is associated with a node type by a unique mapping:
| (1) |
(). Similarly, each edge () is directed and associated with an edge type:
| (2) |
The attributes of agents can be represented as node features on the graph. For instance, a vehicle agent might have attributes such as position, speed, and acceleration, which can be saved as node features. Assuming nodes and edges have feature dimensions and respectively, features can be represented as:
| (3) |
III-A2 Dynamic Graph Learning model to simulate traffic behavior and relationships
TransWorldNG can learn from the data and generate simulation scenarios without relying on pre-defined models or assumptions. The use of a data-driven and model-free approach allows TransWorldNG to discover new patterns and relationships in the data that may not have been previously known or considered. This can lead to insights and solutions that were not possible with traditional modeling approaches.
To simulate complex traffic behavior and relationships, the Heterogeneous Graph Transformer (HGT) model can be used to model heterogeneous graphs in transportation systems [27]. The HGT model is a powerful graph neural network that can handle the heterogeneity of graphs by utilizing specific representations for different types of nodes and edges. It uses a multi-head attention mechanism to aggregate information from neighbors of different node types, and a graph transformer layer to update the node embeddings, for details refer to [27].
We denote the output of the -th HGT layer as , is the node representation of node at the -th HGT layer. By stacking layers, the node representation for the whole graph can be represented as . Since the traffic network is time-varying, we consider the evolution of the traffic system as a conditional graph translation process that consists of a sequence of static graphs:
| (4) |
Given the dynamic heterogeneous graph, shows the state of the traffic simulation system, with input node features, denoted as . The output of the -th HGT layer for the target node is denoted as . To aggregate information to the target node from all its neighbors, it can be achieved by updating the vector :
| (5) |
The -th HGT layer’s output for the target node is equal to:
| (6) |
The MSE loss is employed to measure the difference between the predicted values and the true values. In practice, the MSE loss can be optimized using various optimization algorithms such as Stochastic Gradient Descent (SGD), Adam, or RMSProp to minimize the difference between predicted and true values [28, 29].
III-B System Structure
The overall system architecture of TransWorldNG is shown in Fig. 4. The system supports data inputs from different sources, including sensors, GPS devices, and other connected devices. These data inputs are processed and transformed into a graph data structure, which is then fed into the simulation core in the simulation layer. Using mathematical models and algorithms, the simulation core simulates traffic flow, predicts congestion, and optimizes the transport network based on different traffic scenarios. The software layers can be divided into three categories: data layer, simulation layer, and interface layer.
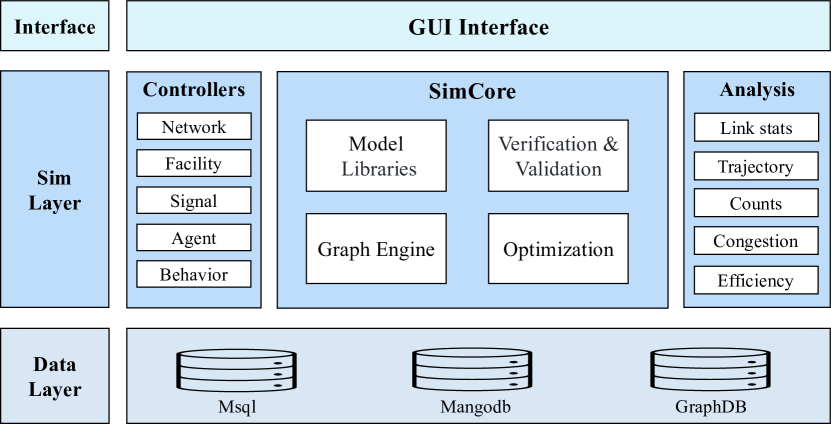
Data Layer: The data layer includes both graph and non-graph data. The non-graph data is stored in a relational database like MySQL and Mangodb, while the graph data structure is stored in a graph database. This allows for the efficient handling of different types of data in a complementary manner.
Simulation Layer: The simulation layer includes the simulation core, which consists of the simulation core, controllers, and analysis modules.
-
•
SimCore: The simulation core consists of the model libraries, graph engine, optimization module, and verification and validation processes. The model libraries provide a range of models for simulating and analyzing the transportation network data, while the graph engine provides algorithms for processing and analyzing the graph data. The optimization module uses algorithms to find the optimal parameters for the models, and the verification and validation processes ensure that the data and results are accurate and reliable.
-
•
Controller: The controller module is responsible for controlling network dynamics, traffic signals, and agent behaviors, and uses the simulation core to simulate different scenarios.
-
•
Analysis: The analysis module provides insights into the transportation network’s performance by processing and analyzing simulation results, such as link statistics, trajectory analysis, traffic counts, congestion analysis, efficiency measures, and more.
Interface Layer: The interface layer includes the GUI interface that displays simulation results to the user, shown in Fig 5. The GUI interface provides visualizations and graphs to help the user understand and interpret the simulation results.
III-C Workflow
TransWorldNG is designed to be intuitive and user-friendly. The simulation core generates traffic patterns based on the input data and parameters specified by the user. These traffic patterns can be visualized in real-time or exported for further analysis. The workflow of TransWorldNG compared to traditional simulation models can be found in Fig. 6. The key modules in TransWorldNG are the following:
-
•
Graph Construction: TransWorldNG constructs a heterogeneous graph representation of the traffic environment from real-world traffic data. Nodes represent individual agents, while edges represent the relationships and interactions between agents.
-
•
Graph Embedding: The graph is embedded into a high-dimensional space using a heterogeneous graph transformer model.
-
•
Pre-training: The graph transformer model is pre-trained on a large dataset of real-world traffic scenarios, enabling it to learn the patterns and relationships.
-
•
Simulation: The pre-trained is then used to generate simulations of new traffic scenarios. The system can make dynamic adjustments during the simulation to model changes in the traffic environment.
-
•
Evaluation: The simulations generated by TransWorldNG can be evaluated based on various metrics, such as accuracy and efficiency, which can help to improve the system for better performance.

IV CASE STUDY
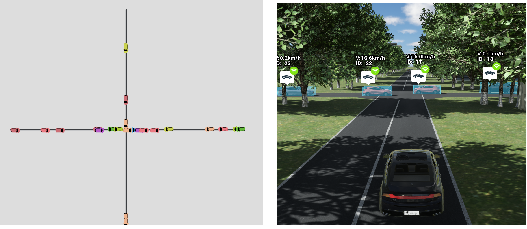
This section aims to demonstrate the capabilities and advantages of TransWorldNG compared to existing traffic simulators. A case study is conducted to compare TransWorldNG with SUMO [1], a widely used traffic simulator. A 4-way signalized intersection is simulated using both TransWorldNG and SUMO. Fig. 7 (a) shows the 4-way signalized intersection, which is a classic example scenario in SUMO. The road network has 8 roads and 16 lanes, and there are 768 vehicles running in this network. These vehicles all start from the left direction and have three default routes they can take: going down to the right road, turning left to the north road, or turning right to the south road. The scenario also has one traffic light located at the central intersection.
IV-A Data-Driven Traffic Behavior Learning with TransWorldNG
We investigated the ability of TransWorldNG to learn car-following behaviors from data. To evaluate its performance, we compared the car-following behavior generated by TransWorldNG to the Intelligent Driver Model (IDM) and the Krauss model. The Krauss model is the default car-following model of the SUMO traffic simulation software. Fig. 8 presents the comparison of vehicle acceleration and speed for the front car, as predicted by the three models.
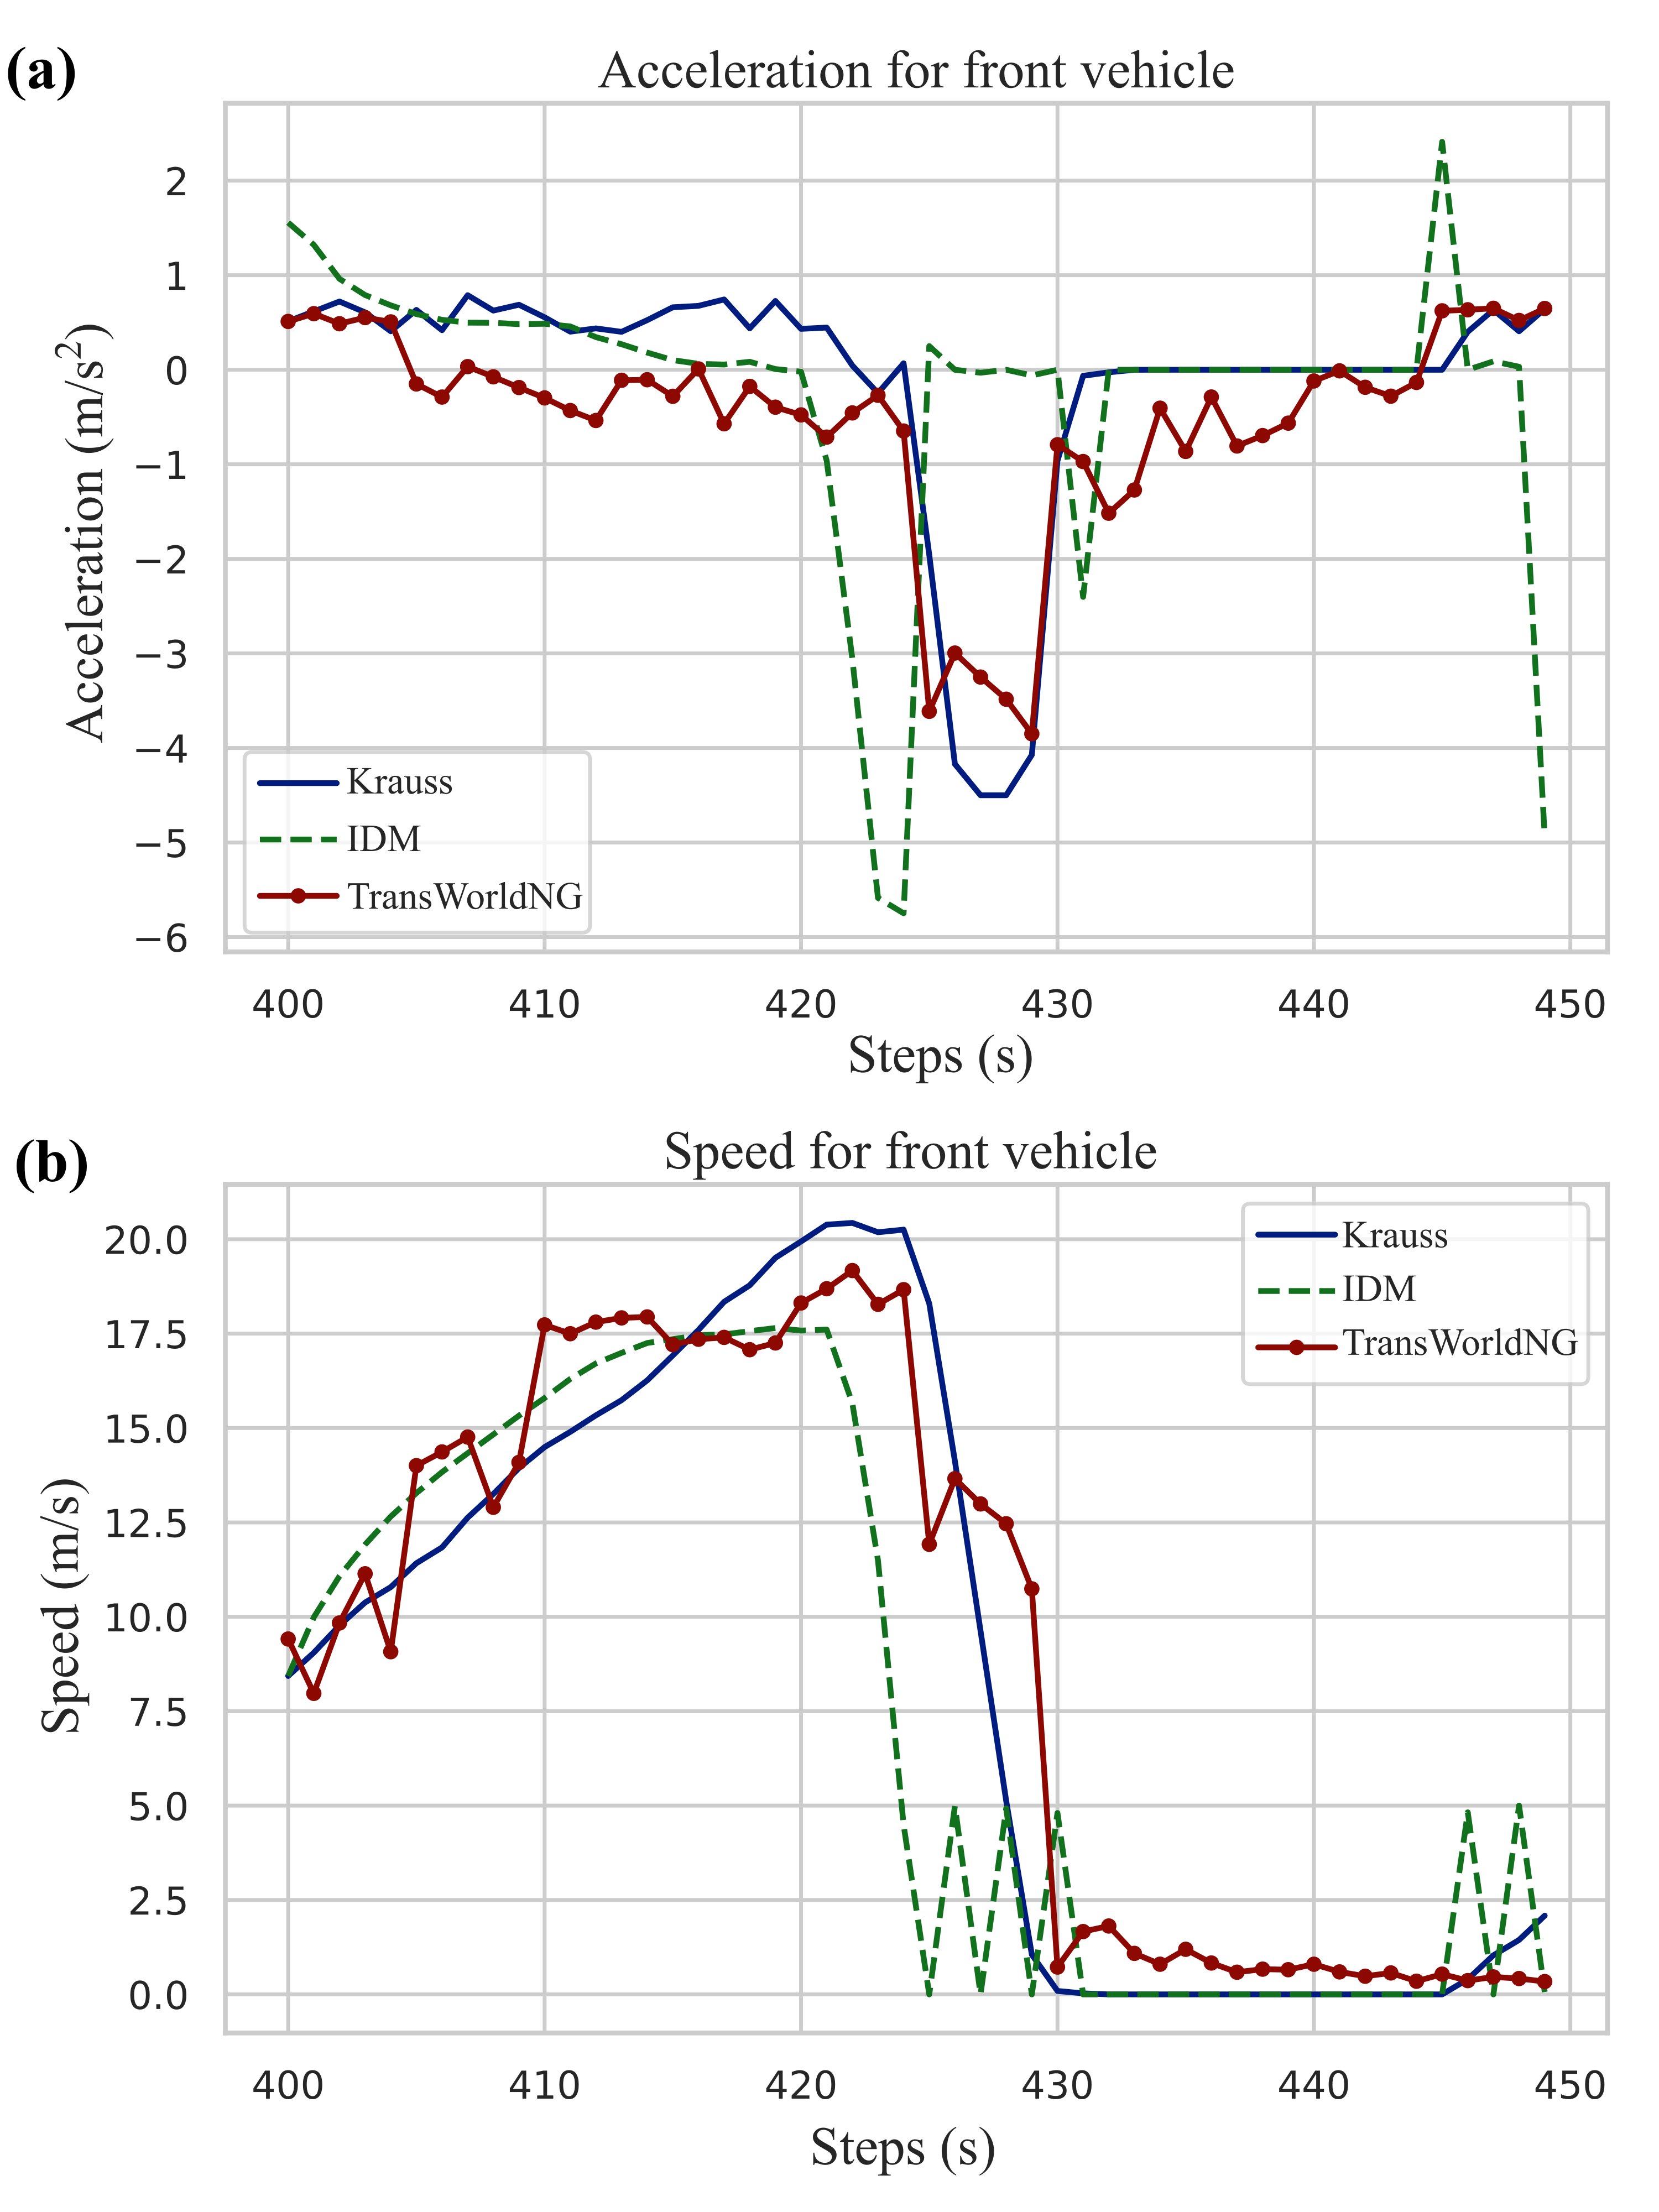
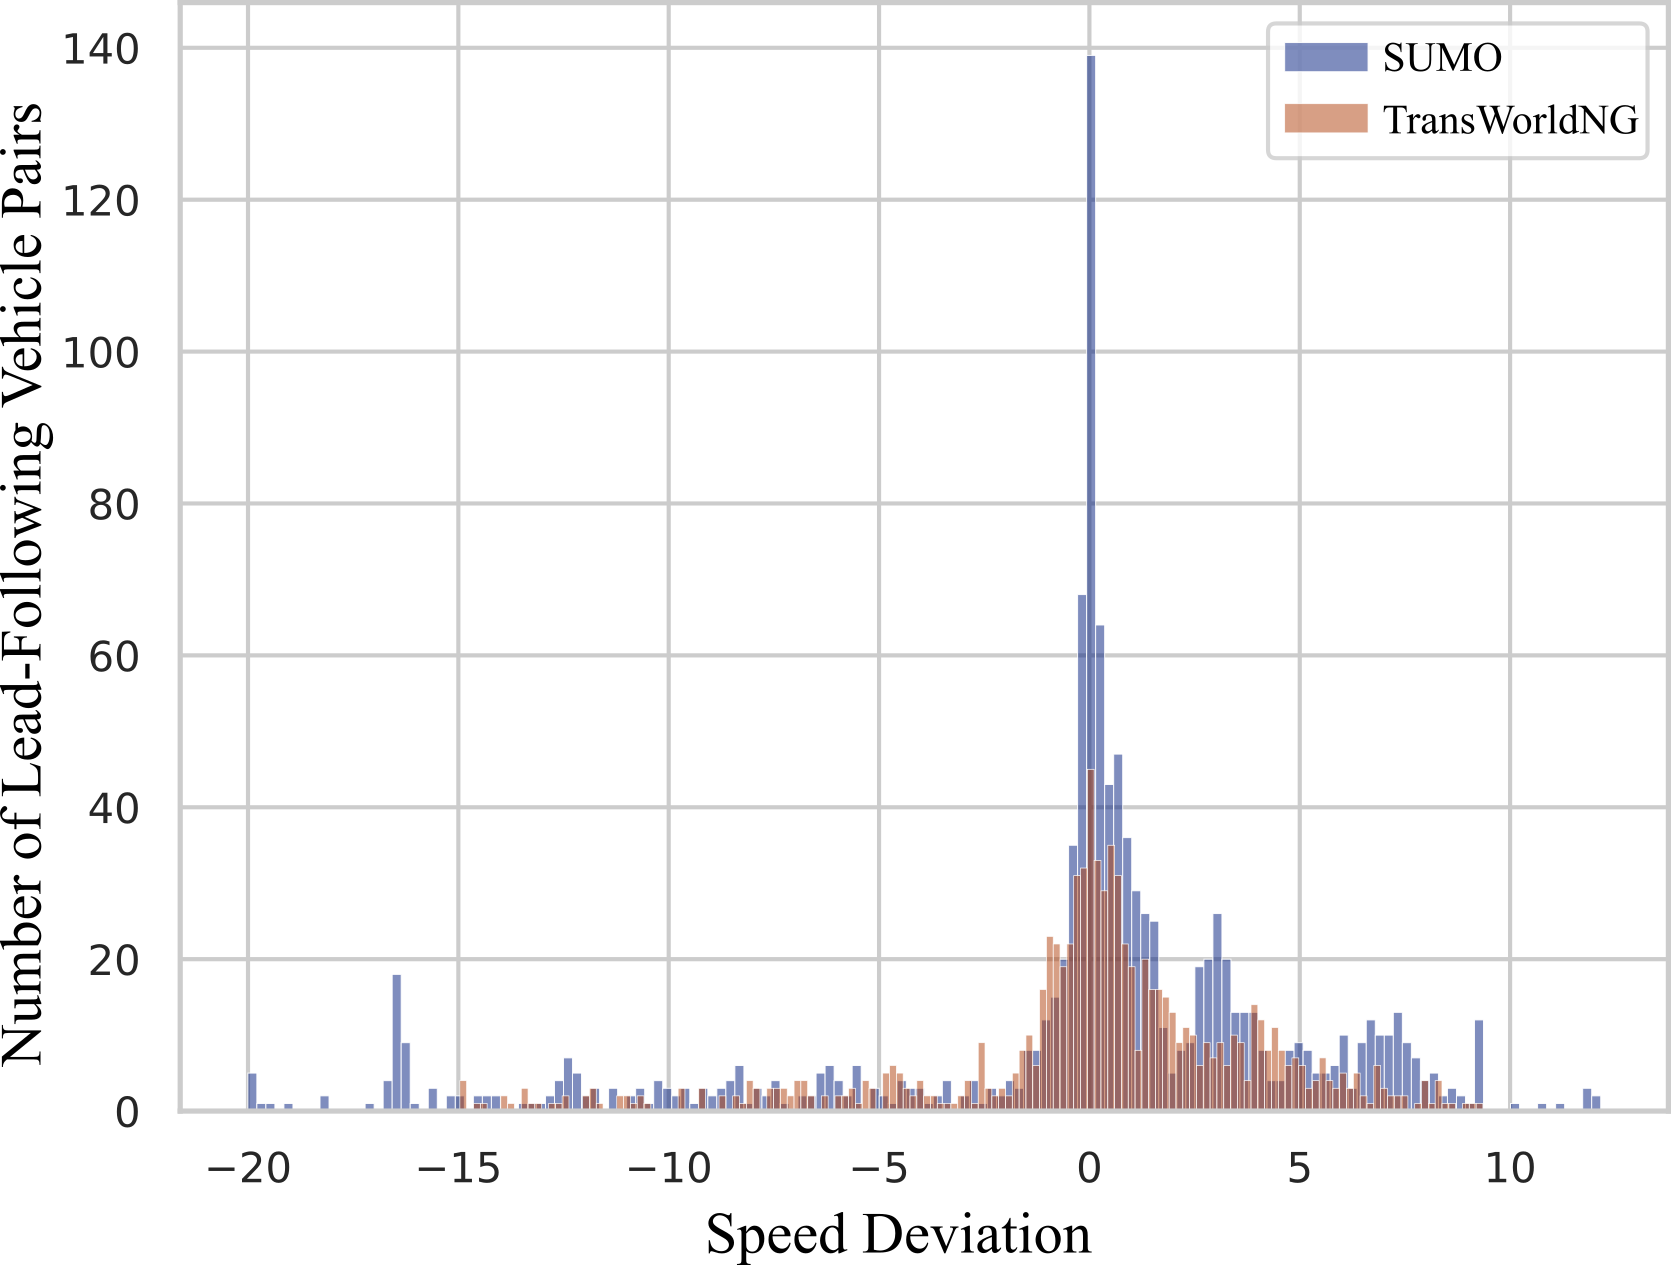
Fig. 9 presents a histogram of the frequency of speed deviations observed during a simulation, showing the performance of the two simulation environments in terms of speed control and accuracy. A narrower distribution with a smaller spread and a peak closer to zero typically indicates better speed control and accuracy in the simulation environment. Both histograms in the figure show similar distributions, indicating that TransWorldNG performs car-following behavior as well as the classic models. This suggests that the automatically generated car-following behavior in TransWorldNG is effective.
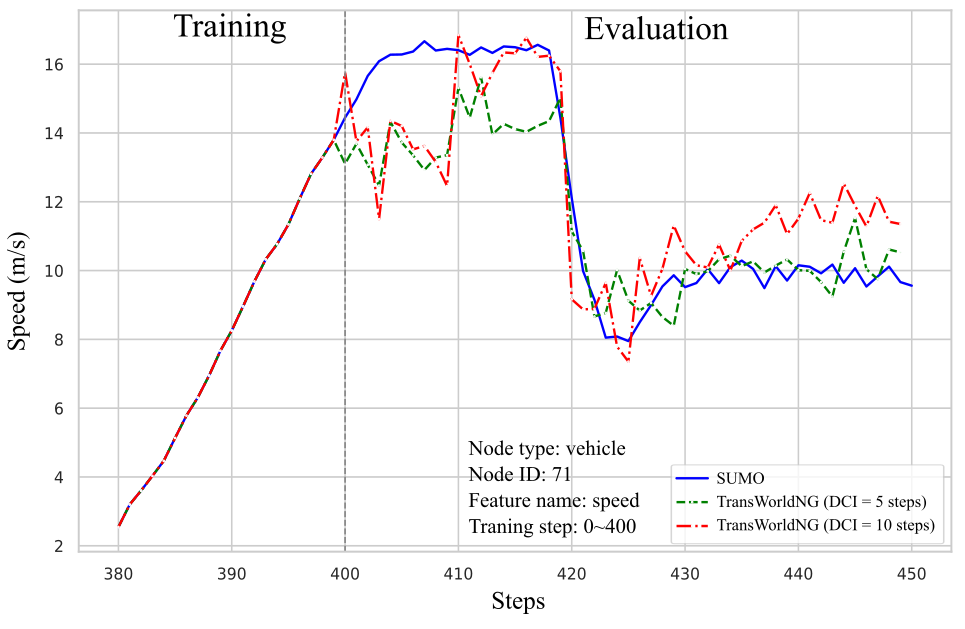
IV-B Impact of Data Collection Interval on Model Performance
Since TransWorldNG is a data-driven approach, to understand the trade-off between prediction accuracy and data collection frequency in TransWorldNG, we conducted experiments with different data collection intervals (5 and 10 steps) and compared the results with SUMO. The findings reveal interesting insights into the relationship between data collection interval and prediction accuracy. As expected, with shorter data collection intervals (e.g., 5 steps), the TransWorldNG model can capture more frequent updates in traffic dynamics, resulting in higher prediction accuracy. However, as the data collection interval increases (e.g., 10 steps), the prediction accuracy decreases, indicating that the model’s ability to capture real-time changes in traffic dynamics is reduced. These findings highlight the importance of data collection frequency in the TransWorldNG model and emphasize the need for careful consideration of data collection intervals to achieve optimal prediction accuracy.
IV-C Assessing the Computational Performance of TransWorldNG
Evaluating the computational performance of TransWorldNG is an important aspect of assessing the system’s efficiency and scalability for large-scale traffic simulations. Simulation time and the number of agents are typically inversely proportional, meaning that as the number of agents increases, the simulation time will also increase. One way to evaluate the computational performance of TransWorldNG is to measure the percentage increase in runtime as the percentage increase in the number of agents.
Fig. 11 compares the percentage increase in simulation calculation time between TransWorldNG and SUMO as the system scale increases. The results demonstrate that as the system scale increases, the percentage increase in simulation calculation time grows substantially more slowly for TransWorldNG than for SUMO. This indicates that the proposed framework can dramatically improve the computing efficiency of large-scale traffic simulation. These results highlight the benefits of using TransWorldNG as a framework for large-scale traffic simulation.
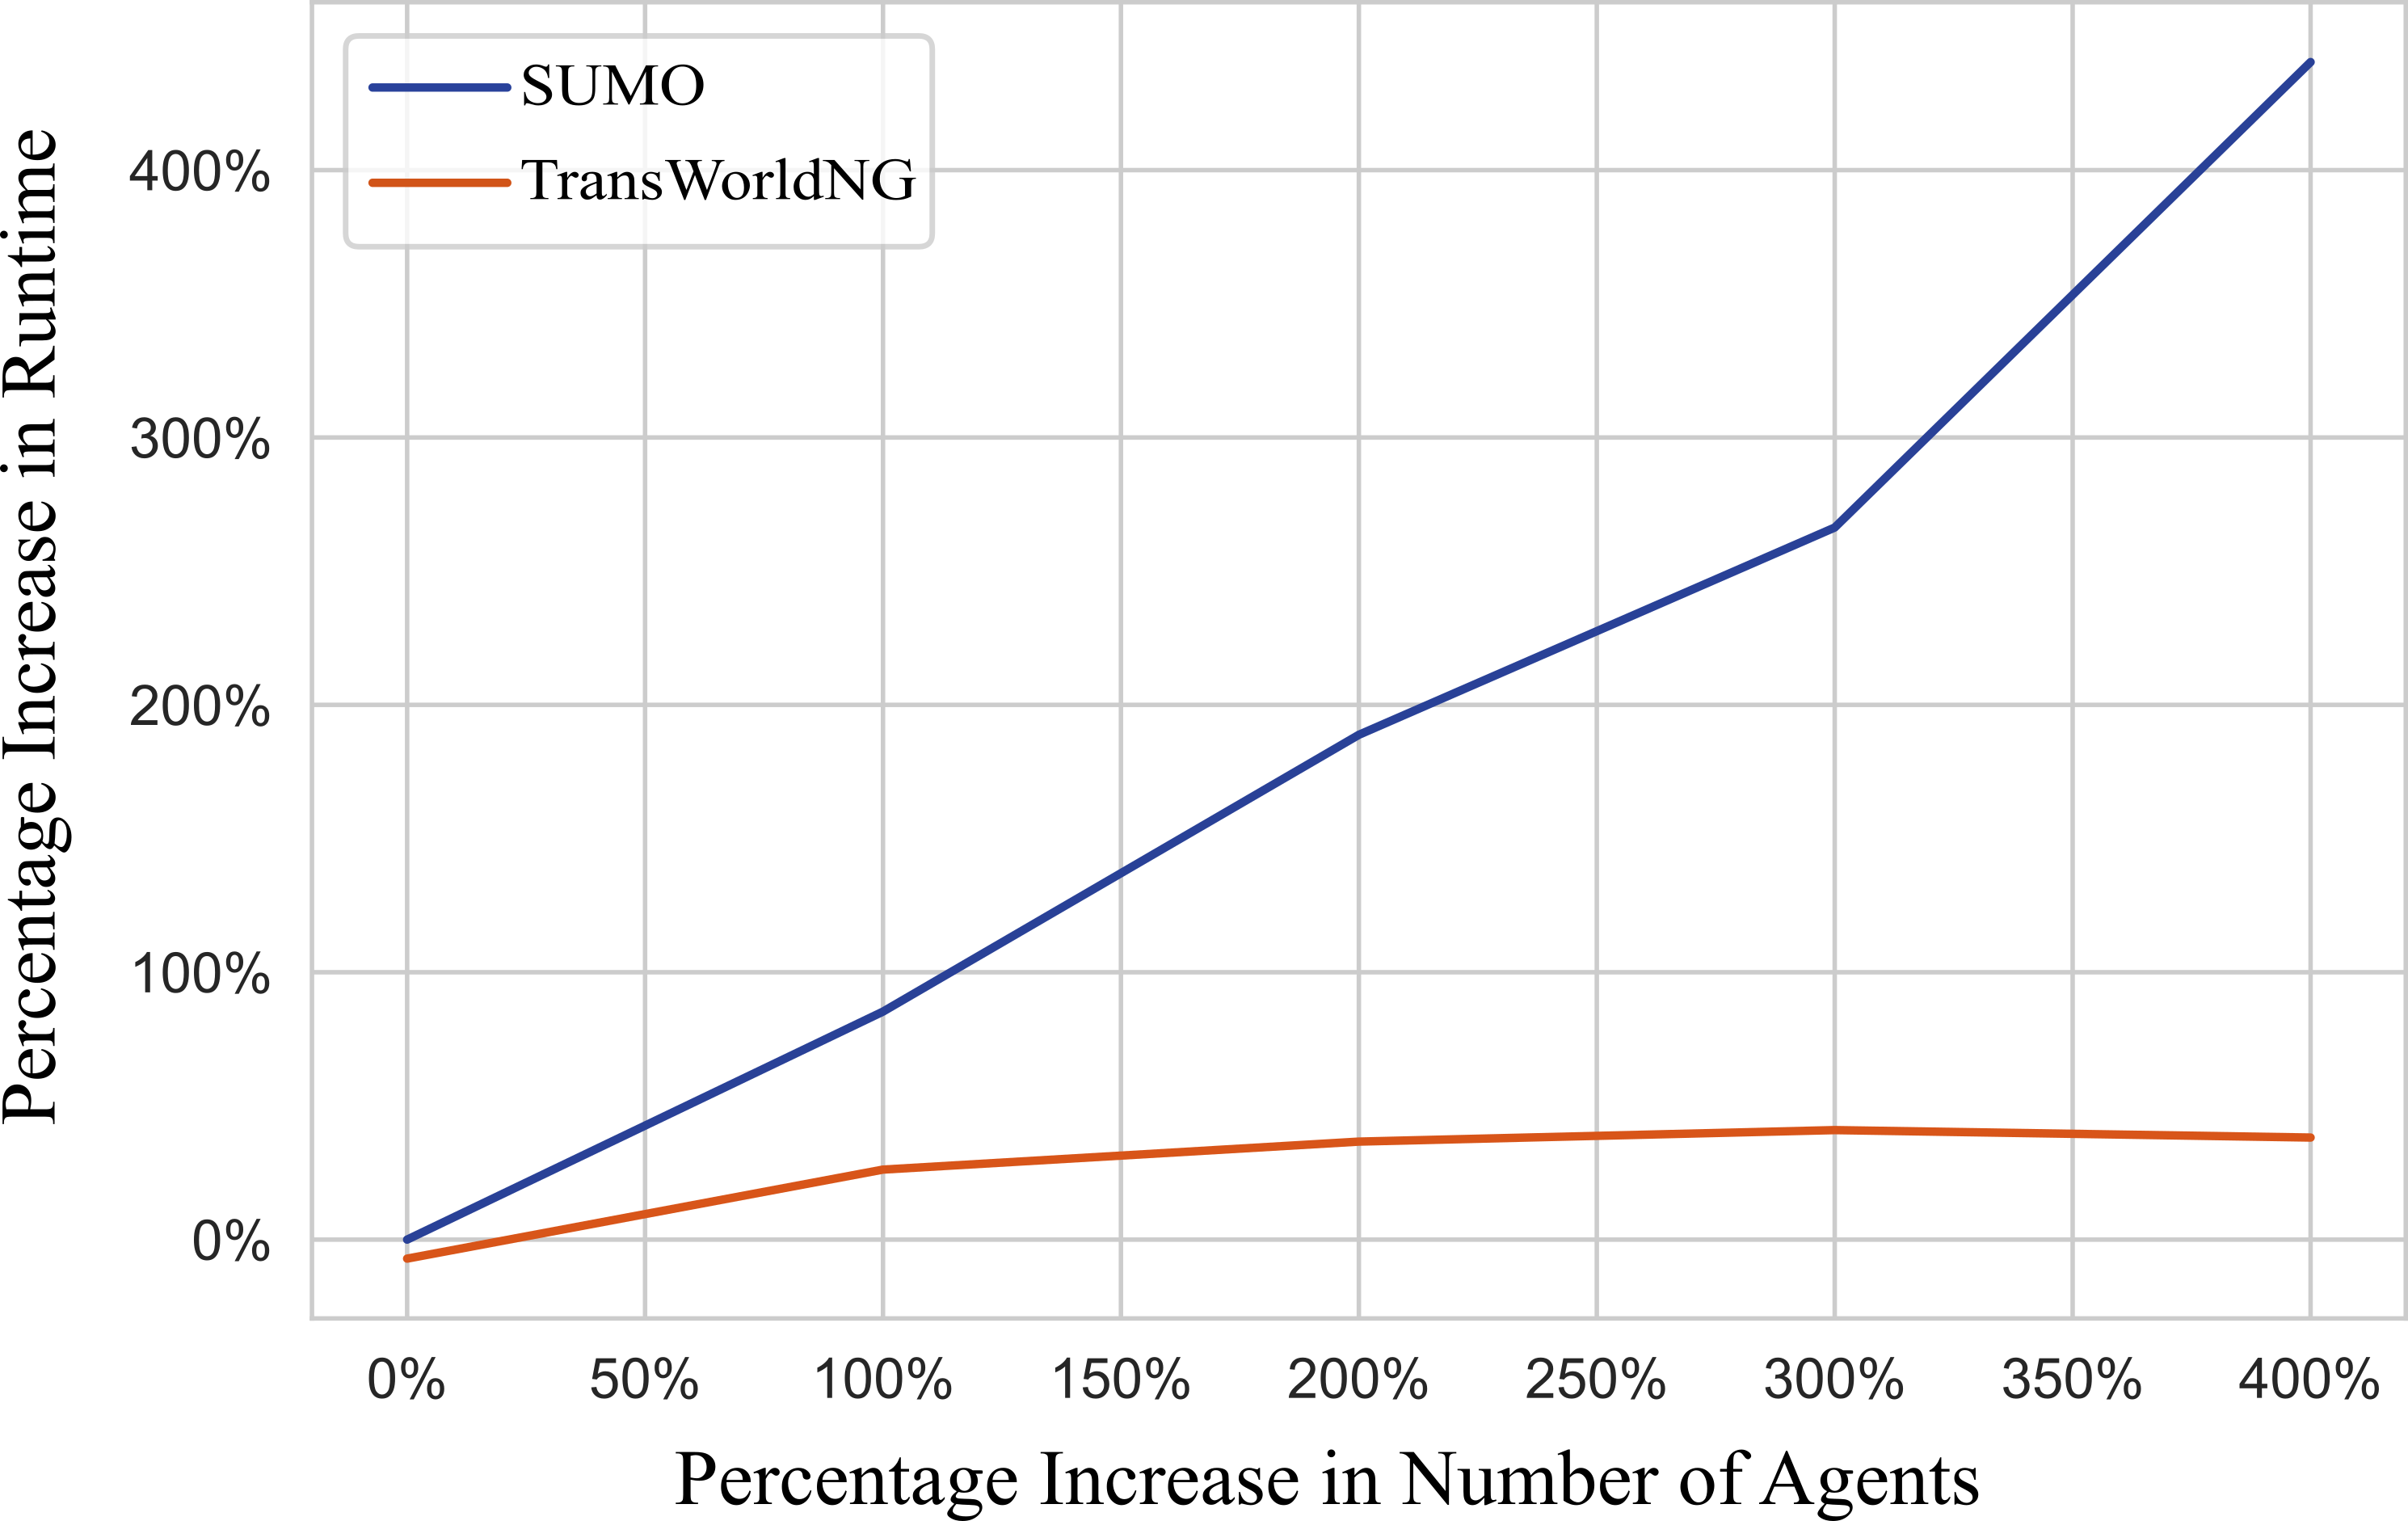
One of the key reasons for TransWorldNG’s good performance is its use of a graph structure and pre-trained models. The use of a graph structure enables parallel processing of traffic data, which can significantly reduce simulation calculation time. Additionally, the pre-trained models used in TransWorldNG can help reduce the amount of computation required during simulation, as the models have already learned many of the underlying patterns and relationships in the traffic data. Another factor that contributes to TransWorldNG’s superior performance is its model-free approach. Unlike SUMO, which relies on pre-defined models of traffic behavior, TransWorldNG is able to adapt to different traffic scenarios and levels of abstraction without the need for extensive model development and calibration. This allows for more efficient and flexible simulation of complex traffic scenarios.
V Conclusion
This study introduced the simulation framework and system structure of TransWorldNG, which utilize a traffic foundation model with data-driven automatic modeling capabilities to resolve the issues of limited structural complexity and high computation complexity of traditional simulators. The graph structure and data-driven method permit dynamic adjustments during simulation to reflect real-time changes in the urban system environment, allowing for the insertion of new data and expert knowledge for real-time mapping of the simulation system to the actual city. TransWorldNG can facilitate event-driven causal analysis of urban phenomena and can combine multi-field data to provide a simulation test platform for integrated decision-making. Future directions for TransWorldNG could include the integration of emerging technologies such as Mobility as a Service (MaaS) and AI-driven simulation technologies [19], as well as the development of more robust functionality using the framework presented in this study.
While TransWorldNG offers many advantages for traffic simulation, there are also some potential challenges that should be explored in future research. One potential challenge is the need for high-quality data that accurately represent real-world traffic patterns and behaviors. TransWorldNG relies on large amounts of data to generate its simulations, so the accuracy and quality of this data can significantly impact the reliability and usefulness of the simulations. Additionally, the collection, processing, and storage of such large amounts of data can also be a challenge [30]. In addition, while TransWorldNG is designed to be highly scalable and flexible, it may still face challenges in terms of computational resources and processing power. Running large-scale simulations can require significant computing resources, potential solutions include using cloud computing, distributed computing, and parallel processing, which need to be studied in future research. Furthermore, traffic simulation often involves predicting traffic flow over extended time periods. The potential use of large language models (LLMs), such as GPT, to generate a wider range of realistic scenarios may improve the accuracy and effectiveness of traffic simulations [31].
Data Availability
The SUMO simulation platform and data is publicly available at https://www.eclipse.org/sumo. The simulation data of the 4-way intersection scenario is available from SUMO at https://github.com/eclipse/sumo/blob/main/docs/web/docs/Tutorials.
Code availability
The code of TransWorldNG was implemented in Python using the deep learning framework of PyTorch. Code, trained models, and scripts reproducing the experiments of this paper are available at https://github.com/PJSAC/TransWorldNG.
References
- [1] P. A. Lopez, E. Wiessner, M. Behrisch, L. Bieker-Walz, J. Erdmann, Y.-P. Flotterod, R. Hilbrich, L. Lucken, J. Rummel, and P. Wagner, “Microscopic Traffic Simulation using SUMO,” in 2018 21st International Conference on Intelligent Transportation Systems (ITSC). Maui, HI: IEEE, Nov. 2018, pp. 2575–2582. [Online]. Available: https://ieeexplore.ieee.org/document/8569938/
- [2] H. Andreas, N. Kai, and A. W, Kay, “Introducing MATSim.” ETH Zurich, Aug. 2016, medium: application/pdf. [Online]. Available: http://hdl.handle.net/20.500.11850/164522
- [3] AIMSUN, “AIMSUN Next,” Tech. Rep., 2022. [Online]. Available: https://www.aimsun.com/aimsun-next
- [4] PTV, “Vissim 5.40-01, user manual. Planung Transport Verkehr AG, Karlsruhe, Germany,” Tech. Rep., 2012.
- [5] X. Yan, Z. Zou, S. Feng, H. Zhu, H. Sun, and H. X. Liu, “Learning naturalistic driving environment with statistical realism,” Nature Communications, vol. 14, no. 1, p. 2037, Apr. 2023. [Online]. Available: https://www.nature.com/articles/s41467-023-37677-5
- [6] W. Fan, P. Chen, D. Shi, X. Guo, and L. Kou, “Multi-agent modeling and simulation in the AI age,” Tsinghua Science and Technology, vol. 26, no. 5, pp. 608–624, Oct. 2021. [Online]. Available: https://ieeexplore.ieee.org/document/9409754/
- [7] L. Li, Y. Lin, Y. Wang, and F.-Y. Wang, “Simulation Driven AI: From Artificial to Actual and Vice Versa,” IEEE Intelligent Systems, vol. 38, no. 1, pp. 3–8, Jan. 2023. [Online]. Available: https://ieeexplore.ieee.org/document/10059315/
- [8] D. Wang, K. Ozbay, and Z. Bian, “A Mixture Model-based Clustering Method for Fundamental Diagram Calibration Applied in Large Network Simulation,” in 2020 IEEE 23rd International Conference on Intelligent Transportation Systems (ITSC). Rhodes, Greece: IEEE, Sept. 2020, pp. 1–6. [Online]. Available: https://ieeexplore.ieee.org/document/9294346/
- [9] J. Barceló, Ed., Fundamentals of Traffic Simulation, ser. International Series in Operations Research & Management Science. New York, NY: Springer New York, 2010, vol. 145. [Online]. Available: http://link.springer.com/10.1007/978-1-4419-6142-6
- [10] F.-Y. Wang and J. J. Zhang, “Transportation 5.0 in CPSS: Towards ACP-based society-centered intelligent transportation,” in 2017 IEEE 20th International Conference on Intelligent Transportation Systems (ITSC). Yokohama: IEEE, Oct. 2017, pp. 762–767. [Online]. Available: http://ieeexplore.ieee.org/document/8317905/
- [11] X. Wang, R. Jiang, L. Li, Y. Lin, X. Zheng, and F.-Y. Wang, “Capturing Car-Following Behaviors by Deep Learning,” IEEE Transactions on Intelligent Transportation Systems, vol. 19, no. 3, pp. 910–920, Mar. 2018. [Online]. Available: http://ieeexplore.ieee.org/document/7970189/
- [12] X. Wang, D. Wang, L. Chen, and Y. Lin, “Building Transportation Foundation Model via Generative Graph Transformer,” 2023, publisher: arXiv Version Number: 1. [Online]. Available: https://arxiv.org/abs/2305.14826
- [13] C. M. Macal and M. J. North, “Agent-based modeling and simulation,” in Proceedings of the 2009 Winter Simulation Conference (WSC). Austin, TX, USA: IEEE, Dec. 2009, pp. 86–98. [Online]. Available: http://ieeexplore.ieee.org/document/5429318/
- [14] J. Nguyen, S. T. Powers, N. Urquhart, T. Farrenkopf, and M. Guckert, “An overview of agent-based traffic simulators,” Transportation Research Interdisciplinary Perspectives, vol. 12, p. 100486, Dec. 2021. [Online]. Available: https://linkinghub.elsevier.com/retrieve/pii/S2590198221001913
- [15] P. Feldman and A. Bucchiarone, “Diversity in Massively Multi-agent Systems: Concepts, Implementations, and Normal Accidents,” in Massively Multi-Agent Systems II, D. Lin, T. Ishida, F. Zambonelli, and I. Noda, Eds. Cham: Springer International Publishing, 2019, vol. 11422, pp. 111–129, series Title: Lecture Notes in Computer Science. [Online]. Available: http://link.springer.com/10.1007/978-3-030-20937-7˙8
- [16] B. Chen and H. H. Cheng, “A Review of the Applications of Agent Technology in Traffic and Transportation Systems,” IEEE Transactions on Intelligent Transportation Systems, vol. 11, no. 2, pp. 485–497, June 2010. [Online]. Available: https://ieeexplore.ieee.org/document/5462881/
- [17] D. Wang, M. Tayarani, B. Yueshuai He, J. Gao, J. Y. Chow, H. Oliver Gao, and K. Ozbay, “Mobility in post-pandemic economic reopening under social distancing guidelines: Congestion, emissions, and contact exposure in public transit,” Transportation Research Part A: Policy and Practice, vol. 153, pp. 151–170, Nov. 2021. [Online]. Available: https://linkinghub.elsevier.com/retrieve/pii/S0965856421002299
- [18] H. Zhang, S. Feng, C. Liu, Y. Ding, Y. Zhu, Z. Zhou, W. Zhang, Y. Yu, H. Jin, and Z. Li, “CityFlow: A Multi-Agent Reinforcement Learning Environment for Large Scale City Traffic Scenario,” in The World Wide Web Conference. San Francisco CA USA: ACM, May 2019, pp. 3620–3624. [Online]. Available: https://dl.acm.org/doi/10.1145/3308558.3314139
- [19] T. Kevan, “Can AI Take Simulation to a New Level?” Nov. 2020, section: Simulate. [Online]. Available: https://www.digitalengineering247.com/article/can-ai-take-simulation-to-a-new-level
- [20] Y. Wu, H. Tan, L. Qin, B. Ran, and Z. Jiang, “A hybrid deep learning based traffic flow prediction method and its understanding,” Transportation Research Part C: Emerging Technologies, vol. 90, pp. 166–180, May 2018. [Online]. Available: https://linkinghub.elsevier.com/retrieve/pii/S0968090X18302651
- [21] A. M. Avila and I. Mezić, “Data-driven analysis and forecasting of highway traffic dynamics,” Nature Communications, vol. 11, no. 1, p. 2090, Apr. 2020. [Online]. Available: https://www.nature.com/articles/s41467-020-15582-5
- [22] N. van Oort, D. Sparing, T. Brands, and R. M. P. Goverde, “Data driven improvements in public transport: the Dutch example,” Public Transport, vol. 7, no. 3, pp. 369–389, Dec. 2015. [Online]. Available: http://link.springer.com/10.1007/s12469-015-0114-7
- [23] B. S. Kerner, Introduction to Modern Traffic Flow Theory and Control. Berlin, Heidelberg: Springer Berlin Heidelberg, 2009. [Online]. Available: http://link.springer.com/10.1007/978-3-642-02605-8
- [24] R. Jia, P. Jiang, L. Liu, L. Cui, and Y. Shi, “Data Driven Congestion Trends Prediction of Urban Transportation,” IEEE Internet of Things Journal, vol. 5, no. 2, pp. 581–591, Apr. 2018. [Online]. Available: https://ieeexplore.ieee.org/document/7949003/
- [25] Y. Zhou, Y. Zhang, Z. Zhao, K. Zhang, and C. Gou, “Towards Driving Scene Understanding: A Paradigm and Benchmark Dataset for Ego-centric Traffic Scene Graph Representation,” IEEE Journal of Radio Frequency Identification, pp. 1–1, 2022. [Online]. Available: https://ieeexplore.ieee.org/document/9900075/
- [26] Z. Wu, S. Pan, F. Chen, G. Long, C. Zhang, and P. S. Yu, “A Comprehensive Survey on Graph Neural Networks,” IEEE Transactions on Neural Networks and Learning Systems, vol. 32, no. 1, pp. 4–24, Jan. 2021. [Online]. Available: https://ieeexplore.ieee.org/document/9046288/
- [27] Z. Hu, Y. Dong, K. Wang, and Y. Sun, “Heterogeneous Graph Transformer,” 2020, publisher: arXiv Version Number: 1. [Online]. Available: https://arxiv.org/abs/2003.01332
- [28] D. P. Kingma and J. Ba, “Adam: A Method for Stochastic Optimization,” 2014, publisher: arXiv Version Number: 9. [Online]. Available: https://arxiv.org/abs/1412.6980
- [29] S. Ruder, “An overview of gradient descent optimization algorithms,” 2016, publisher: arXiv Version Number: 2. [Online]. Available: https://arxiv.org/abs/1609.04747
- [30] Y. Yu, S. Yao, J. Li, F.-Y. Wang, and Y. Lin, “SWDPM: A Social Welfare-Optimized Data Pricing Mechanism,” 2023, publisher: arXiv Version Number: 1. [Online]. Available: https://arxiv.org/abs/2305.06357
- [31] F.-Y. Wang, Q. Miao, X. Li, X. Wang, and Y. Lin, “What Does ChatGPT Say: The DAO from Algorithmic Intelligence to Linguistic Intelligence,” IEEE/CAA Journal of Automatica Sinica, vol. 10, no. 3, pp. 575–579, Mar. 2023. [Online]. Available: https://ieeexplore.ieee.org/document/10057173/