Evidence of a Polar Cyclone on Uranus from VLA Observations
Abstract
We present observations of Uranus in northern spring with the VLA from 0.7 cm to 5 cm. These observations reveal details in thermal emission from Uranus’ north pole at 10s of bars, including a dark collar near 80∘N and a bright spot at the polar center. The bright central spot resembles observations of polar emission on Saturn and Neptune at shallower pressures. We constrain the variations in temperature and NH3/H2S abundances which could explain these features. We find that the brightness temperature of the polar spot can be recreated through 5 K temperature gradients and/or 10 depletion of NH3 or H2S vapor between 10-20 bars, both consistent with the presence of a cyclonic polar vortex. The contrast of the polar spot may have increased since 2015, which would suggest seasonal evolution of Uranus’ polar circulation at depth.
Geophysical Research Letters
Jet Propulsion Laboratory, California Institute of Technology, Pasadena, CA, USA National Radio Astronomy Observatory, Socorro, NM, USA Department of Earth and Planetary Sciences, University of California, Berkeley, CA, USA
Alex Akinsalexander.akins@jpl.nasa.gov
VLA observations in 2021 and 2022 reveal a bright, compact spot centered at Uranus’ pole at several wavelengths
Constraints on horizontal temperature and composition gradients necessary to explain the polar emission structure are derived
Inferred patterns in temperature, zonal wind speed and trace gas abundance variations are consistent with the presence of a compact cyclonic vortex
1 Introduction
Uranus’ obliquity affords unique opportunities for polar observing, which can contribute to our general understanding of polar circulation processes on giant planets. Our current understanding of Uranus’ polar circulation (we define the pole as 60∘ latitude) suggests net subsidence as the characteristic feature of vertical motion. This pattern is inferred from emission and reflection contrasts in multi-wavelength observations [de Pater \BOthers. (\APACyear1989), de Pater \BOthers. (\APACyear1991), Hofstadter \BBA Butler (\APACyear2003), Sromovsky \BOthers. (\APACyear2019), Roman \BOthers. (\APACyear2020)], which suggest depletion of absorbing gases at the poles down to 10s of bars. Zonal wind profiles of polar latitudes, estimated nominally at 1.5 bar, have been most recently updated by \citeAKarkoschka2015 at southern latitudes based on Voyager 2 images and \citeASromovsky2015 at northern latitudes based on Keck observations. Mean zonal wind speeds decay monotonically from a maximum of 250 m/s near 60∘ to near-zero at 90∘, and there appears to be significant asymmetry between the northern and southern pole zonal wind profiles [Karkoschka (\APACyear1998), Sromovsky \BBA Fry (\APACyear2005), Sromovsky \BOthers. (\APACyear2015)]. This asymmetry, as well as analyses of Voyager gravity measurements, suggests that zonal wind speeds are vertically confined globally and should decay with altitude in the upper troposphere (e.g. see \citeAFletcher2020 for a recent review). As new observations and analysis techniques push limitations of spatial resolution and sensitivity, new features have emerged in images of Uranus that complicate this broader picture. For example, complex polar features have been observed at the CH4 weather level, including a multitude of compact bright features in the northern hemisphere suggestive of small-scale vertical convection acting against net subsidence [Sromovsky \BOthers. (\APACyear2012), Sromovsky \BOthers. (\APACyear2015)].
At many wavelengths, this is the first solstice for which ground-based and near-Earth observatories are sufficiently sensitive to resolve fine details in polar thermal emission. This is certainly true for microwave observations with the Very Large Array (VLA), which underwent an order of magnitude bandwidth upgrade in 2012 that significantly improved the achievable sensitivity. Unlike mid-infrared, near-infrared, and visible observations, which have informed our understanding of Uranus’ circulation at and above the H2S and CH4 cloud levels, microwave observations are sensitive to thermal emission from deeper in the troposphere (primarily 10-50 bar at the poles). Post-upgrade VLA observations of Uranus are now sufficiently sensitive to resolve faint zonal banding patterns at lower latitudes at the 10 bar level. Observations of Uranus in 2015 described by \citeAMolter2021, specifically the Ku band (2 cm) image, provided evidence of latitudinal structure in tropospheric thermal emission at Uranus’ north pole. In their 2 cm image, a faint dark collar and compact polar spot appear at 80∘N and 90∘N respectively, and these features were either less pronounced or absent in images obtained at other wavelengths during that campaign. Interestingly, \citeAGEO1988 and \citeAHofstadter1990 also found 80∘S to also be a local brightness minimum in VLA observations made in the 1980s, although the contrast of the collar in these images was at or beneath the background noise level.
As part of an ongoing effort to analyze over 40 years of VLA observations of Uranus, new observations were obtained in late 2021 and early 2022. These observations have confirmed the presence of polar features at several wavelengths that were apparent in the 2 cm 2015 observations and suggest a brightening of the central polar spot. This striking feature is visually similar to mid-infrared observations of Saturn’s South Pole in 2004 described by \citeAOrton2005 and further observed at both poles by Cassini [Fletcher \BOthers. (\APACyear2018)]. A polar vortex was also observed on Neptune’s south pole in the near- and mid-IR as well as at radio wavelengths [Luszcz-Cook \BOthers. (\APACyear2010), Fletcher \BOthers. (\APACyear2014), de Pater \BOthers. (\APACyear2014), Tollefson \BOthers. (\APACyear2021)]. Since polar vortices appear to be common features on planets [Mitchell \BOthers. (\APACyear2021)] and the formation of central polar cyclones on ice giant planets have been predicted from modeling studies [Brueshaber \BOthers. (\APACyear2019)], it seems likely that this feature on Uranus also indicates the presence of a compact polar vortex.
In this letter, we describe recent VLA observations of Uranus from 0.7-5 cm and discuss their implications for atmospheric dynamics at the north pole. In Section 2, we discuss the reduction and imaging of the data. In Section 3, we infer constraints on the orders of magnitude of tropospheric temperature and composition variations necessary to create the observed polar structure. Additionally, we use the derived gradients in atmospheric temperature to derive a notional zonal wind profile at 50 bar assuming geostrophic balance, suggesting an strengthening of zonal wind with depth immediately surrounding the polar spot. Finally, we provide additional discussion and concluding comments.
2 Observations
Here, we provide an overview of the observations and their reduction/imaging. A manuscript is in preparation that will provide further details regarding the reduction and imaging of these and other Uranus observations, and we refer the interested reader to \citeATaylor1999 for more information on radio interferometer datasets and their analysis. A table of relevant information for these observation datasets is included in Supporting Information. We obtained observations of Uranus with the VLA when the sub-observer latitude was near 55∘N. Observations at K (22 GHz, 1.4 cm), Ka (33 GHz, 0.9 cm) and Q (44 GHz, 0.7 cm) band were taken in October 2021 with the array in B configuration, and observations at C (6 GHz, 5 cm), and Ku (15 GHz, 2 cm) bands were taken in March 2022 with the array in the more extended A configuration. All reduction and imaging of the data was conducted using the CASA package [McMullin \BOthers. (\APACyear2007)]. The calibrated interferometer correlations (or visibilities) were flagged for frequency-dependent issues in the wideband spectra, and the visibilities were then averaged within 128MHz-wide sub-bands to reduce data volume. Further flagging was conducted to remove time-dependent issues, and limb-darkened disk starting models were fit to the visibility amplitudes [Butler \BBA Bastian (\APACyear1999)]. To form images, these disk models were subtracted from the observations, the residuals were deconvolved using the multi-scale CLEAN algorithm [Cornwell (\APACyear2008)], and the models were then re-added in image space. Iterative phase self-calibration was applied during the imaging process to correct for atmospheric path fluctuations between calibrator scans, concluding with visibility phase compensation intervals on the order of ten times the visibility integration period (two seconds) [Brogan \BOthers. (\APACyear2018)]. Multi-term multifrequency synthesis was used to derive high dynamic range images necessary to observe faint spatial contrasts [R\BPBIJ. Sault \BBA Wieringa (\APACyear1994)]. Experiments were also performed in which imaging was conducted using a starting model including previously observed equator-pole emission contrasts on Uranus, and we found that the resulting images were consistent with those using the starting model without this contrast.
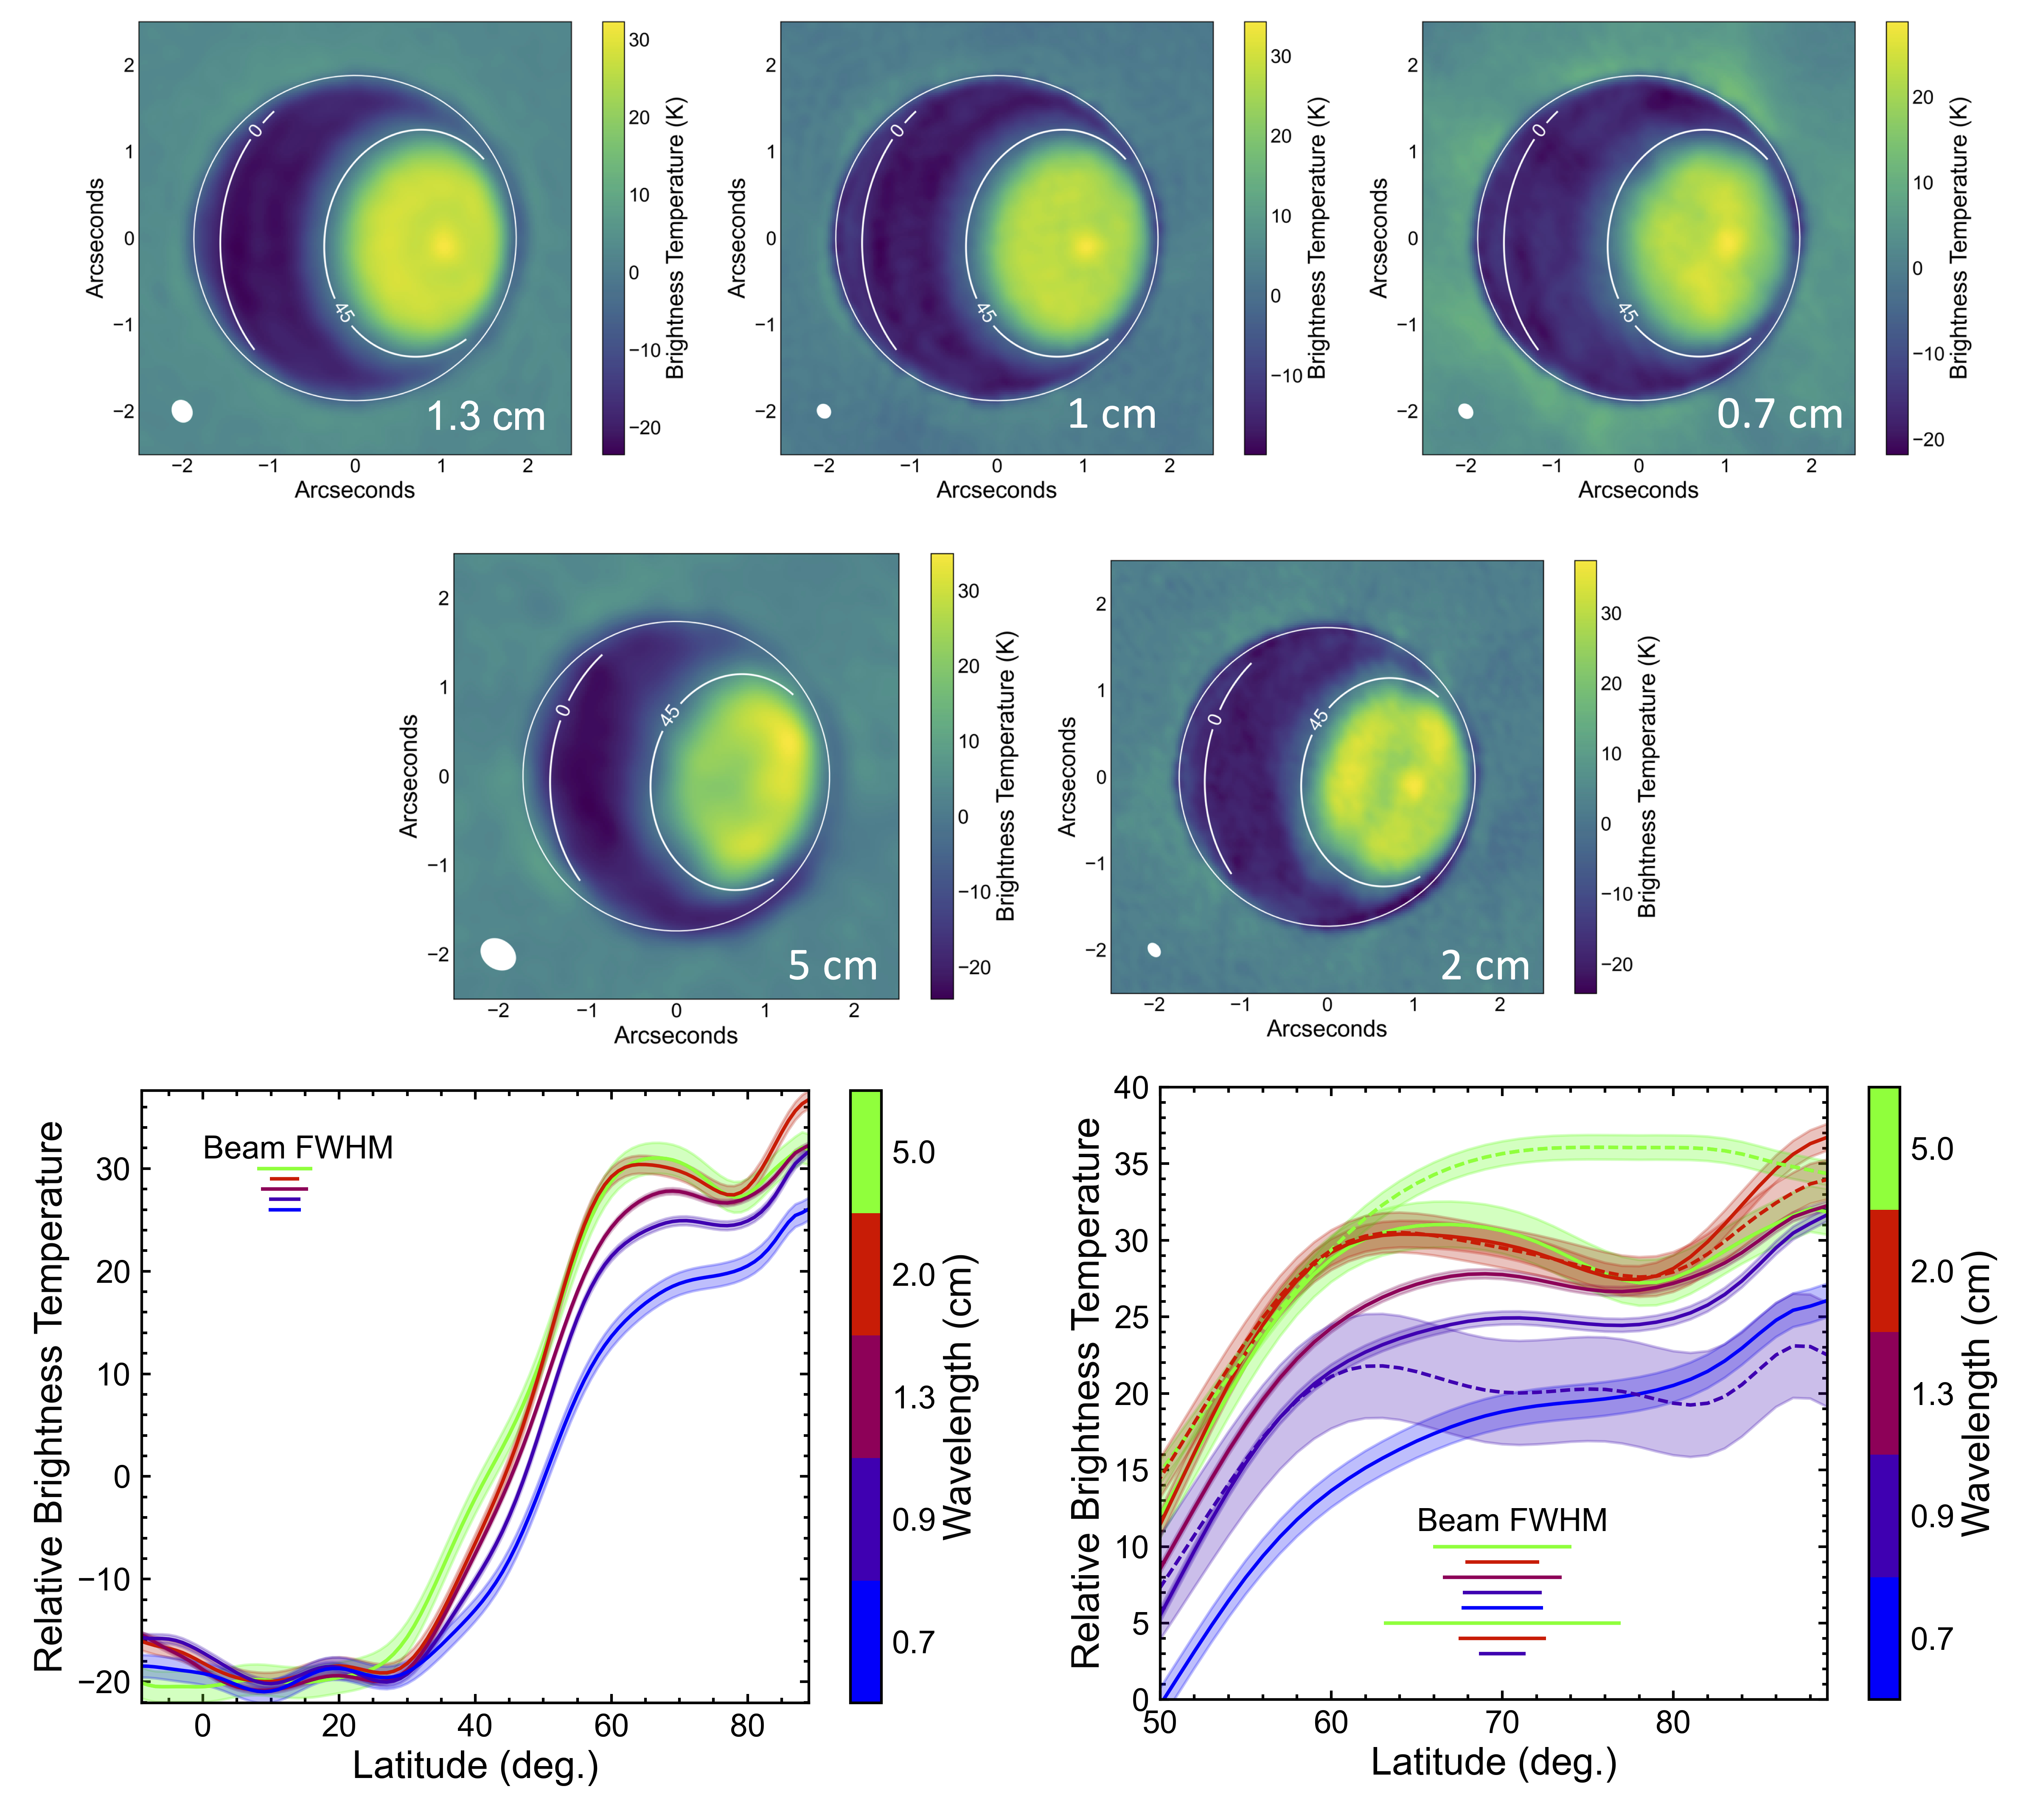
The final brightness temperature images subtracted by disk models are shown in Figure 1. These disk models are weighted by emission angle as , and the limb-darkening parameter ranges from at 5 cm to at 0.7 cm. The sensitivity of the images is at or below 1 K as determined from the root mean square of the emission in the source-free region in all bands, and the absolute calibration of the brightness temperature is on the order 3-5% [Perley \BBA Butler (\APACyear2017)]. In addition to the 5 cm image shown in Figure 1, another image was made with adjusted visibility weighting to improve the spatial resolution within the diameter of the polar spot at the cost of image sensitivity (see Supporting Information). Latitudinal brightness cross sections for all wavelengths (including the re-weighted high resolution C band image) are also shown at the bottom of Figure 1, and these profiles are shifted vertically to obtain alignment between 0-20 degrees latitude. The polar regions of these cross sections are shown in comparison with the corresponding cross sections of the 2015 observations at C, Ku, and Ka band described by \citeAMolter2021. In addition to shifting the cross-sections to match the 2021 and 2022 observations near 60 degrees, the 2015 profiles have also been adjusted to compensate for differences in observation geometry (see Supporting Information).
The central polar spot is brighter than the 60-70 degree latitude region by 3.5 K in the 2015 2 cm observation, whereas the spot is brighter in the 2021 and 2022 observations by 6-7 K () at several wavelengths. When considering the additional 50% difference (2.5 degrees latitude) in spatial resolution at 90 degrees between the 2 cm observations in 2015 and 2022, the change in the central spot contrast between the observations is significant on the order of . For the re-weighted 5 cm image, the center of the pole does not appear brighter than average of the polar cap. This does not rule out the presence of a brightness contrast at longer wavelengths, only that such a contrast falls below the detection threshold of these observations. The dark trough between 75-80 degrees latitude observed in the 2015 2 cm image is also present in several bands in the new observations, and the collar contrast appears to increase with wavelength. While unable to resolve a polar bright spot, observations with the VLA during the previous south polar solstice (near 1985) also suggest the presence of the dark collar at the limit of the observation sensitivity.
3 Analysis
To interpret the observations, we use a microwave radiative transfer code and equilibrium cloud-condensation model (ECCM) similar to those employed by \citeAdePater1985, Hofstadter2003 (see also the RadioBEAR code used by e.g. \citeAMolter2021, Tollefson2021a). We assume atmospheric structure derived from the Voyager 2 equatorial radio occultation profile where the temperature is extrapolated using a wet adiabatic lapse rate. At lower latitudes, fit parameters include the deep abundances of trace gases including H2S, NH3, and PH3, which are thought to be the species most likely to affect microwave propagation. Additionally, a relative humidity parameter is fit for condensation of the dominant trace gas (either H2S or NH3) above the NH4SH cloud base located between 15-20 bars.
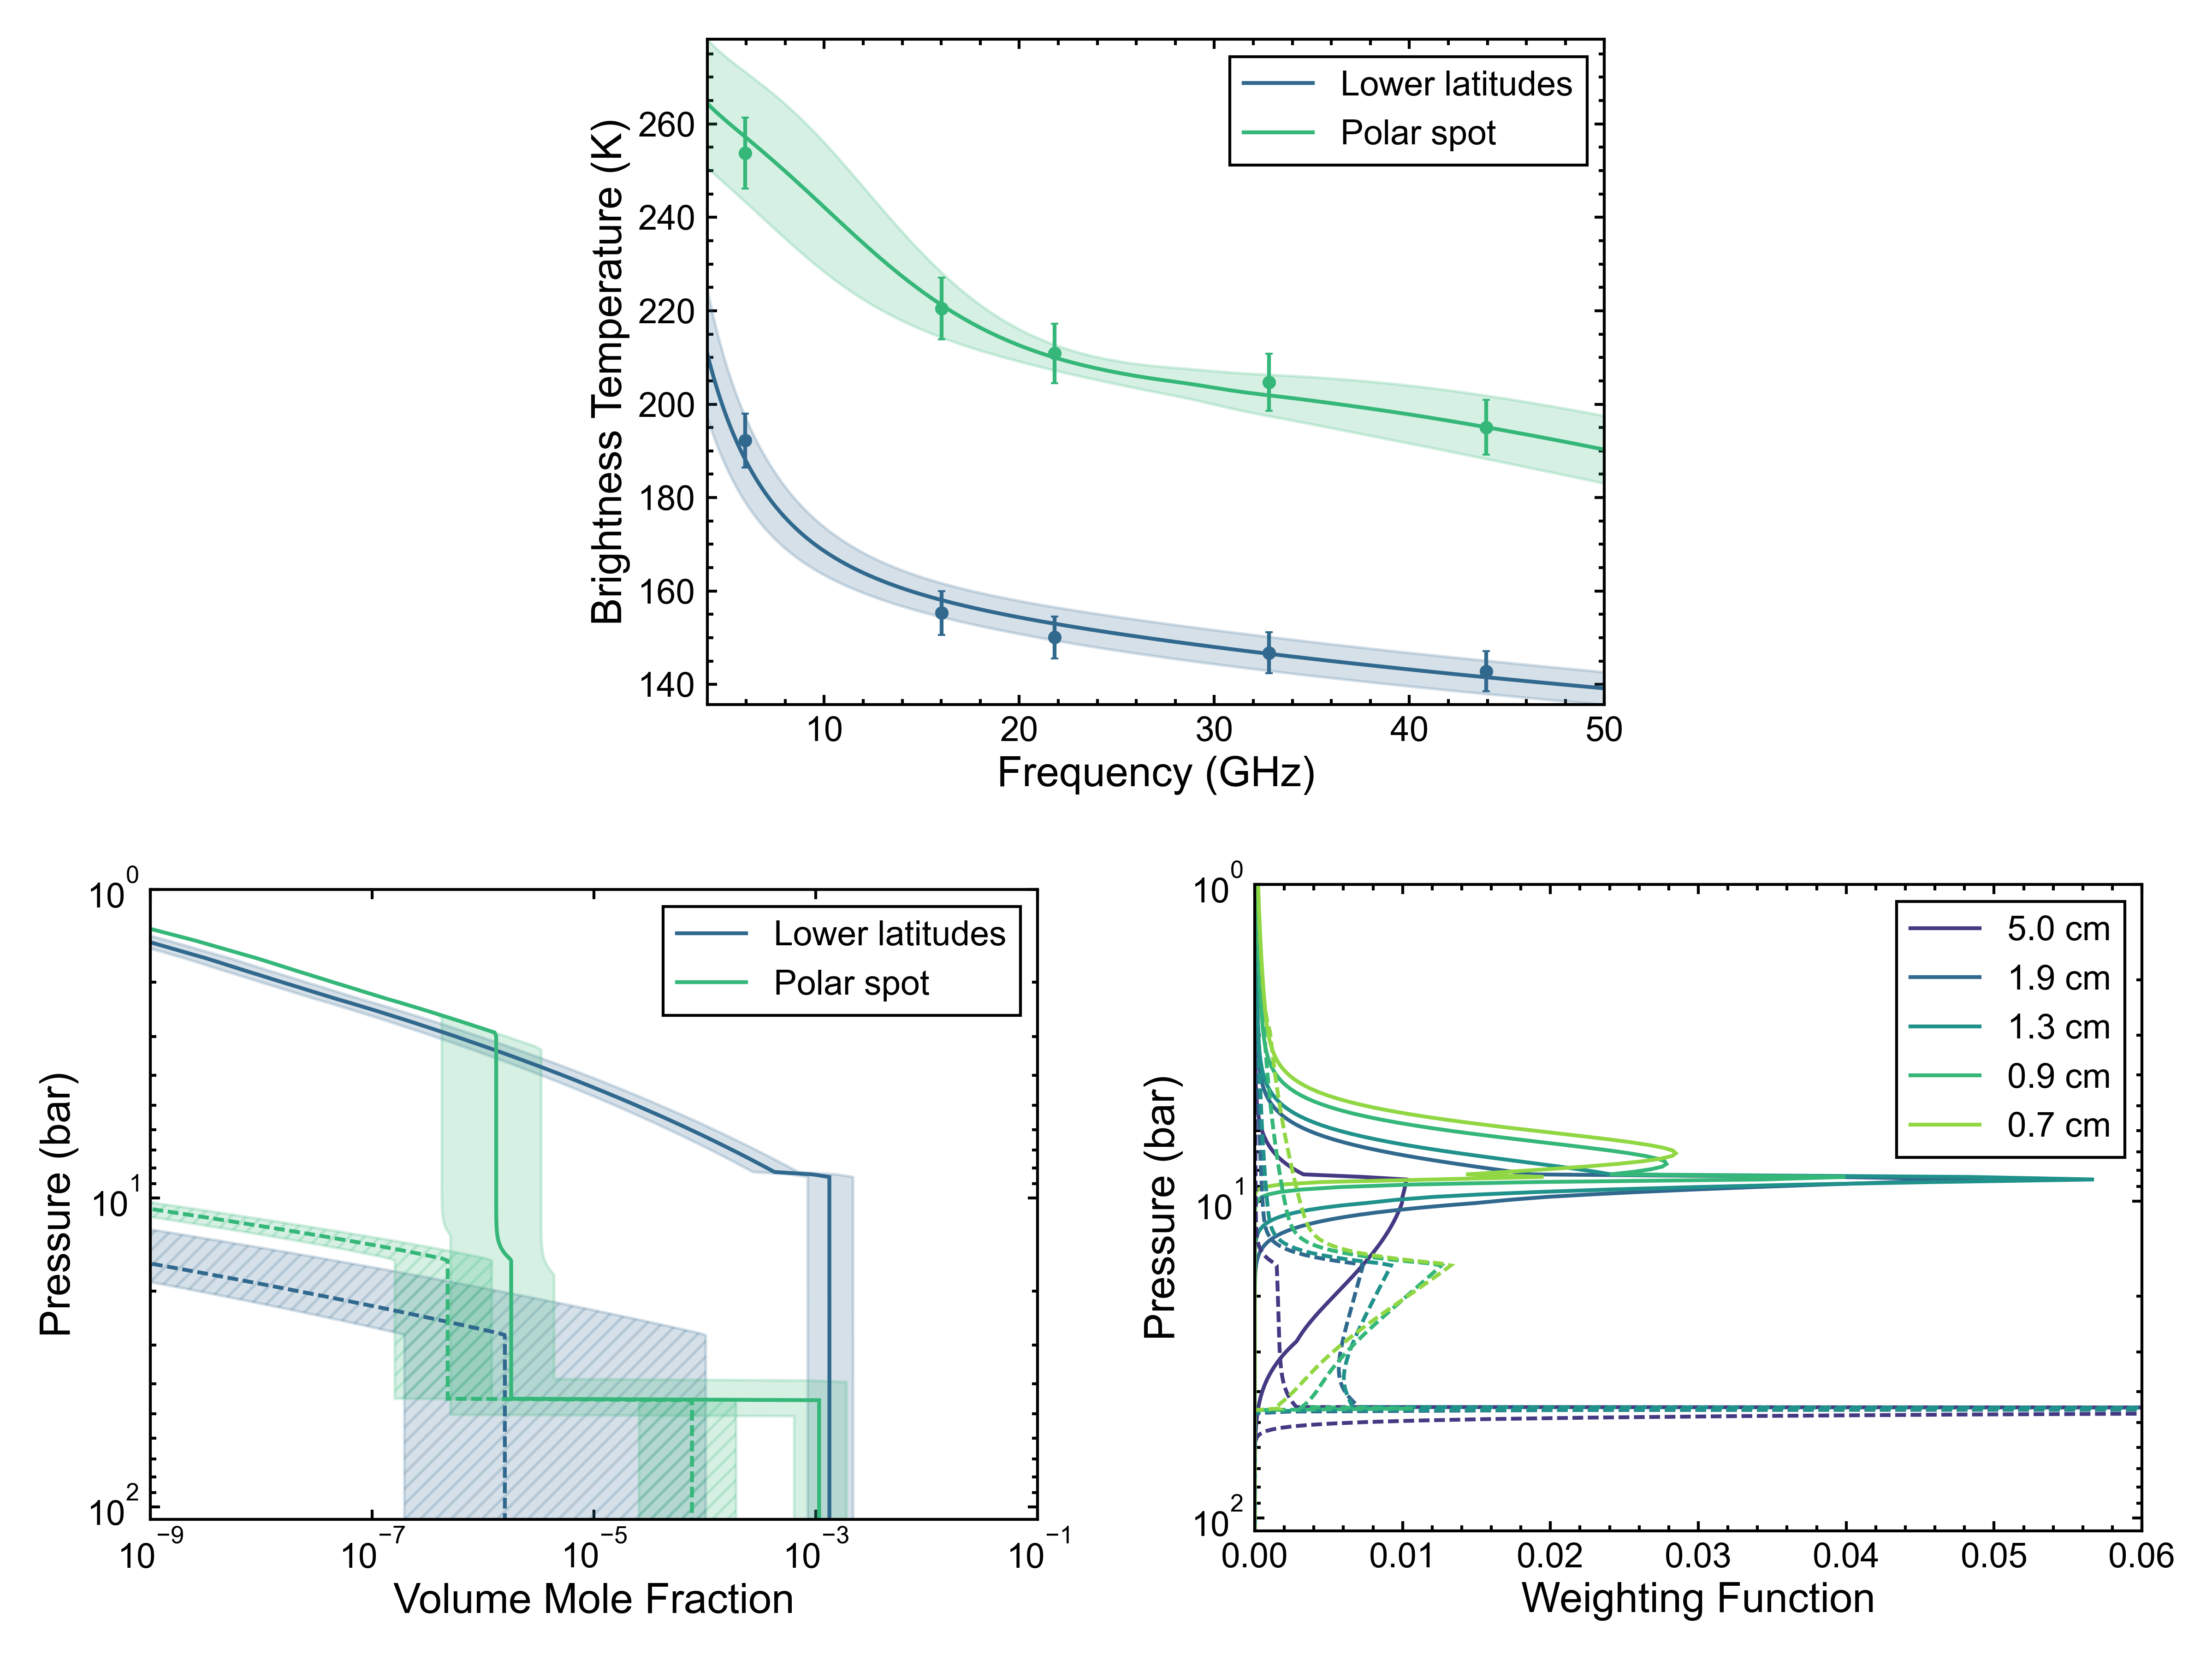
We are interested in the latitude dependence of the brightness temperature structure, so the observations are binned in latitude and assigned an effective emission angle by averaging over the cosine of the emission angle for each pixel. We perform fits using the ECCM over the lower latitude region () and multiple polar latitudes using a Markov Chain Monte Carlo approach similar to that discussed in \citeAMolter2021. Figure 2 shows the results of the retrievals over the lower latitudes and at the central polar spot (see Supporting Information for MCMC retrievals at other latitudes). We find in the equatorial region an H2S-dominant solution with a sub-NH4SH cloud abundance of ppm and H2S relative humidity of %. We additionally estimate an upper limit to PH3 abundance at 1.2 ppm. Overall, our fit to the lower-latitude brightness temperature spectrum is consistent within uncertainties with the results of \citeAMolter2021 for the 2015 observations.
For the polar spot, the nominal ECCM solution is unable match the observed microwave brightness temperature spectrum, so we impose a step boundary layer in the deep atmosphere, following \citeAMolter2021. The trace gas abundances below the step are constrained to fall within the range retrieved over the lower latitudes. The inclusion of this step improved the fits to the polar spot spectrum. The pressure at which this step occurred is determined as bars, which is consistent with uncertainties with the step location from \citeAMolter2021. Due to the Ku-Q band spectral slope, polar ECCM fits require both H2S and NH3 to be present at altitudes above the step with H2S being more abundant. This is in contrast with the retrievals of \citeAMolter2021 which prefer an NH3 dominant fit in the polar region. We refer the reader to Supporting Information for numerical results of MCMC fits over the polar region and a comparison of fits with and without a deep atmosphere step boundary.
In general, the microwave brightness temperature of Uranus depends on the atmospheric temperature and wavelength-dependent opacity of atmospheric gases (see e.g. Figure 8 in \citeAMolter2021). Thus, for a given set of measurements, non-unique solutions exist for the vertical temperature structure and vertical distribution of microwave absorbers, and the use of an ECCM constrains the range of achievable solutions. The difficulty in joint absolute determination of atmospheric temperature and composition profiles in the absence of model assumptions from these observations is also a result of the uncertainty in the VLA flux calibration. Whereas statistical uncertainty in the retrieved vertical structure is determined by the flux calibration accuracy, statistical uncertainties in the variations of atmospheric state with latitude are instead determined by the noise in the images, which is approximately ten times smaller. We can therefore determine relatively strong constraints on how the atmospheric state varies with latitude along isobars, which we report here. We consider two end-member cases to explain these observations: 1) the brightness temperature variations are solely caused by changes in atmospheric temperature, or 2) they are solely caused by changes in atmospheric composition, specifically the abundances of NH3 and H2S vapors. For our retrievals, we adjust the profiles of either temperature or gas abundance to match latitude-dependent brightness temperature spectra by scaling the reference polar spot profile at specific points on a coarse grid (see Supporting Information for a discussion of the choice of grid points).
First (end-model 1), we assume that composition is constant over the north polar region and adjust the temperature profile to fit brightness temperature spectra over a range of latitudes (. From the fit temperature variations as a function of latitude, the vertical wind shear is computed using the thermal wind equation [Pedlosky (\APACyear1987)]. Starting from the assumed zonal wind profile of \citeASromovsky2015 at 1.5 bar, the wind shear is integrated with depth to estimate the zonal wind speed at 50 bar. The temperature deviation from the reference profile, vertical wind shear, and zonal wind profiles are shown in Figure 3. Poleward of 70∘, the temperature decreases below 20 bar to match the dark collar, and at 85∘, the temperature increases sharply to match the polar spot. The inferred zonal wind around the polar spot increases with depth while the zonal wind speed towards the center of the spot does not increase significantly, consistent with a cyclonic circulation structure. Next (end-model 2), we assume that the temperature is constant and adjust the profiles of either H2S or NH3 gas independently to match the latitude-dependent spectra, with the retrieved distributions shown in Figure 4. Since the volume mole fractions of these gases change by multiple orders of magnitude over this pressure range, these distributions are displayed as percent difference from the mean profile averaged over all latitudes. Gas abundances increase below 20 bar to match the spectrum of the dark collar and are significantly depleted over the polar spot above 20 bars. Uncertainties in these estimates for horizontal variability in both temperature and composition are provided in Supporting Information.
![[Uncaptioned image]](/html/2305.15521/assets/figures/Figure_3.jpg)
![[Uncaptioned image]](/html/2305.15521/assets/figures/Figure_4.jpg)
4 Discussion
The bright spot and dark collar at the north pole of Uranus were detected on several days at different wavelengths with consistency independent of imaging approach (e.g. using different visibility weightings, starting models, self-calibration solutions, etc.). Their consistent detection provides strong evidence that these features are real and not imaging artifacts. Both of these features exhibit wavelength dependence, with the central polar spot contrast increasing at shorter wavelengths and the collar contrast increasing at longer wavelengths. Additionally, these observation suggest (albeit at the 2 level) that the polar spot has brightened since 2015, which would imply a strengthening of the polar cyclone as Uranus approaches solstice. While these images are zonally smeared, unsmearing techniques [R. Sault \BOthers. (\APACyear2004)] are not attempted, since the longitude-resolved maps of 2015 observations presented by \citeAMolter2021 do not exhibit significant variation in longitude. Our ECCM fits to the lower latitude spectra suggest reasonable agreements with the recent results of \citeAMolter2021, and we expect further analysis of Uranus observations over a longer record to provide insights in seasonal variability in a more general sense. ECCM fits to spectra at polar latitudes, however, disagree with the results of \citeAMolter2021 in requiring an H2S-dominant solution. This is not entirely surprising, as these observations more densely sample the wavelength range of Uranus’ spectrum which achieve the poorest fit in \citeAMolter2021 Figure 9. While the ECCM constraints can match lower latitude spectra well, they appear less able to adequately fit the polar spectrum, and future work should consider in greater detail how different model assumptions impact the ability to fit polar observations specifically.
The overall accuracy in the brightness temperature spectra determined from the pipeline-calibrated VLA observations is set by the accuracy of the absolute flux calibrator (order 3-5%), and this determines the statistical uncertainty in the retrieved vertical profiles presented in Figure 2. Uncertainties in the spatial brightness temperature distribution within each image, however, are determined by the image sensitivities. In all cases, the off-source image noise is an order of magnitude lower than the uncertainty in the absolute brightness temperature. This motivates our focus in Figures 3 and 4 on the changes with latitude in retrieved temperature and composition, which can in principle be determined with greater accuracy than the vertical structure. For all retrievals, the polar spot was chosen as the reference location (i.e. non-retrieved quantities were set to the values retrieved over the polar spot using the MCMC/ECCM fits) since it is the brightest region on the planet and requires the lowest absorber abundances. Fitting scaled composition profiles at lower polar latitudes then requires only the addition of either H2S or NH3, whereas the opposite approach would require the abundances of both absorbers to be subtracted to fit brighter regions. Additionally, our approach assumes that the absolute magnitude of the retrieved temperature and composition does not have a large effect on the inference of variability with latitude from the observations. This is likely accurate when ECCM constraints are imposed but will be less accurate if the atmospheric structure deviates significantly from these models. The finite angular resolution of the observations (shown in the bottom left corner of the images in Figure 1) will artificially smooth the distribution of retrieved quantities with latitude and therefore impact the determination of their variability.
The derived variations in temperature as a function of latitude (end-model 1, Figure 3) suggest a warmer temperature within the polar spot above the NH4SH cloud level and a slight temperature depression below this cloud in the colder polar collar. The assumption of geostrophic balance allows us to use the gradients in temperature with latitude to derive profiles of vertical shear in the zonal wind, and we determine an estimate of the 50 bar zonal wind profile in the limiting case that temperature drives all variations in polar brightness temperature. We note that the derived zonal wind profile, while qualitatively appropriate within the necessary assumption of geostrophy, may suffer from biases due to the necessity to integrate wind shear down from a starting altitude of 1.5 bar and the fact that our observations lose sensitivity to temperature and opacity variations above 5 bar generally. If changes in atmospheric temperature are the dominant factor in elevated microwave brightness temperatures observed at the polar spot (i.e. end-model 1 is closer to the truth), then the thermal wind calculation implies zonal wind speed increases westwards with depth at the periphery (i.e. within 5 degrees) of the polar spot, consistent with the presence of a polar cyclone. Assuming that compositional gradients (end-model 2, Figure 4) drive the brightness temperature structure, changes with latitude in either NH3 or H2S abundances are consistent in the requirement of an increase in opacity between 75-80∘ and a decrease in opacity over the polar spot. We note that while the results in Figures 3 and 4 suggest that the NH4SH cloud base serves a boundary between different regimes of horizontal variability, the precise location of this boundary is not quantitatively constrained here and is related to the retrieval grid choice (see Supporting Information). Generally, fits to spectra appear consistent with a boundary region within approximately 5 bar of the predicted NH4SH cloud layer. While prior explanations for the equator-pole contrast in microwave emission observed on Uranus postulate a mean descending meridional circulation over the polar cap, the variability in composition with latitude illustrated by Figure 4 suggests that smaller-scale cells may exist that locally enhance gas abundances at 80∘. Since H2S is less microwave-opaque per molecule than NH3, the percentage variability shown in Figure 4 implies larger variations in mole fraction across latitude for this gas (mean profiles are similar to those determined via MCMC fitting at 70∘ and shown in Supporting Information). In Supporting Information, we present estimates of uncertainty in Figures 3 and 4 and the minimum achieved cost functions. In all cases, fits at the polar spot are poorer than those at lower polar latitudes, which further motivates our suggestion of a more detailed assessment of atmospheric models applicable to Uranus’ polar thermal emission.
Elevated temperatures, stronger peripheral zonal circulation, and a drier atmosphere are all hallmarks of cyclonic vortex circulation, as previously observed on Saturn and Neptune [Fletcher \BOthers. (\APACyear2018), Fletcher \BOthers. (\APACyear2014), de Pater \BOthers. (\APACyear2014), Tollefson \BOthers. (\APACyear2021)]. If the north polar spot is indeed a cyclonic vortex, then a combination of physical temperature and compositional differences is likely to cause the elevated brightness temperatures. While the vertical motion at the poles is likely net descending, our observations suggest that small-scale meridional cells might be present at depth. The connection of these brightness temperature structures with patterns observed in images at other wavelengths is unclear and should be the subject of future work. ALMA observations presented by \citeAMolter2021 do not exhibit the emission trough and central spot observed in the VLA observations, suggesting local confinement of these features deeper than the 10 bar level. The central polar spot in our observations appears to have the same horizontal extent as the slightly off-center polar spot identified by \citeAKarkoschka2015 from analysis of Voyager ISS observations, and this spot was found to rotate two hours faster than regions immediately surrounding it. However, mid-IR observations sensitive to comparable pressure ranges (0.5 - 1 bar) have not observed a corresponding change in emission relative to other polar latitudes that would indicate the presence of a compact cyclone [Flasar \BOthers. (\APACyear1987), Roman \BOthers. (\APACyear2020)]. While the location of the dark collar in the VLA observations is also close to a low reflectivity feature in Keck 1.6 m observations of Uranus’ south pole, the relationship between these features is ambiguous, since the same feature observed by the VLA in 2015 is not present in 2015 Keck observations [Sromovsky \BOthers. (\APACyear2012), Sromovsky \BOthers. (\APACyear2019)]. Interestingly, the 13 m thermal maps presented by \citeARoman2020, which are sensitive to both stratospheric polar thermal polar emission and acetylene abundance, exhibit greater morphological similarity to our Figure 1 than their 18 m observations, which are sensitive to tropospheric temperature (although the locations of peaks and troughs in polar emission are offset by several degrees). The diversity of Uranus’ morphology across wavelengths is generally suggestive of a multi-layered meridional circulation structure [Fletcher \BOthers. (\APACyear2020)], and further efforts should focus on synthesizing recent results to derive further insight into Uranus’ atmospheric processes.
5 Conclusions
In this letter, we present new 0.7 cm - 5 cm VLA observations of Uranus resulting in detailed views of Uranus’ polar structure. These observations confirm the detection of a dark collar at 75∘-80∘ latitude observed in 2015 data described by \citeAMolter2021 (and marginally by \citeAHofstadter1990), and find that the central spot is significantly brighter than the rest of the pole in several wavelength bands. We find that while the bright spot contrast decays with depth, the dark collar contrast increases with depth. We considered the range of variations in atmospheric thermal structure and composition that could reproduce this feature on Uranus. In the case that all polar brightness temperature variations are the result of changes in temperature, we also determine estimates of zonal winds that suggest cyclonic circulation at the polar spot, whereas the alternate case (brightness temperature variations are caused only by changes in composition) suggests gas depletion at least above the NH4SH cloud. It is plausible that both processes are occurring by analogy with Cassini CIRS observations of Saturn’s polar cyclone [Fletcher \BOthers. (\APACyear2018)] and observations of Neptune’s polar vortex [Fletcher \BOthers. (\APACyear2014), Roman \BOthers. (\APACyear2022)]. At lower polar latitudes, inferences of temperature and composition gradients both suggest that small-scale circulation cells are superimposed on the net descending motion characteristic of polar meridional circulation, enriching the dark collar in gas. Additionally, comparison of 2 cm observations between 2015 and 2022 suggest a possible strengthening of the polar cyclone in recent years. As Uranus continues towards summer solstice, we encourage multi-wavelength observations from the microwave to the visible to monitor the evolution of Uranus’ polar atmospheric state so that further insight can be gained in the study of giant planet circulation processes. Further 2D or 3D modeling of Uranus’ polar circulation is also encouraged to further constrain the formation of such a feature. Additionally, the inclusion of a microwave radiometer on future missions to Uranus could result in significant improvements to the results reported here via reduction of uncertainties in absolute calibration and improvements in achievable spatial resolution at longer wavelengths.
6 Open Research
Raw VLA data used to generate images of Uranus from this report are available from the NRAO Data Archive at data.nrao.edu under project 21B-301. Data reduction and imaging were performed using the CASA software package (version 6.5.2), which is available at https://casa.nrao.edu/. Additionally, all processed images shown in Figure 1 are available at https://doi.org/10.5281/zenodo.7690111
Acknowledgements.
We acknowledge comments from two anonymous reviewers which improved the manuscript. This work was carried out at the Jet Propulsion Laboratory, California Institute of Technology, under contract with NASA and sponsored by the JPL Research and Technology Development Fund. This paper makes use of VLA data obtained under project VLA/21B-301. The National Radio Astronomy Observatory (NRAO) is a facility of NSF operated under cooperative agreement by Associated Universities, Inc. IdP and NM are supported by NASA grant NNX16AK14G through the Solar System Observations (SSO) program to the University of California, Berkeley.References
- Berge \BOthers. (\APACyear1988) \APACinsertmetastarGEO1988{APACrefauthors}Berge, G\BPBIL., Muhleman, D\BPBIO.\BCBL \BBA Linfield, R\BPBIP. \APACrefYearMonthDay19887. \BBOQ\APACrefatitleVery Large Array observations of Uranus at 2.0 CM Very large array observations of uranus at 2.0 cm.\BBCQ \APACjournalVolNumPagesThe Astronomical Journal96388. {APACrefURL} http://adsabs.harvard.edu/cgi-bin/bib_query?1988AJ.....96..388B {APACrefDOI} 10.1086/114817 \PrintBackRefs\CurrentBib
- Brogan \BOthers. (\APACyear2018) \APACinsertmetastarBrogan2018{APACrefauthors}Brogan, C\BPBIL., Hunter, T\BPBIR.\BCBL \BBA Fomalont, E\BPBIB. \APACrefYearMonthDay2018. \BBOQ\APACrefatitleAdvanced Gain Calibration Techniques in Radio Interferometry Advanced gain calibration techniques in radio interferometry.\BBCQ \APACjournalVolNumPages1-31. {APACrefURL} http://arxiv.org/abs/1805.05266 \PrintBackRefs\CurrentBib
- Brueshaber \BOthers. (\APACyear2019) \APACinsertmetastarBrueshaber2019{APACrefauthors}Brueshaber, S\BPBIR., Sayanagi, K\BPBIM.\BCBL \BBA Dowling, T\BPBIE. \APACrefYearMonthDay2019. \BBOQ\APACrefatitleDynamical regimes of giant planet polar vortices Dynamical regimes of giant planet polar vortices.\BBCQ \APACjournalVolNumPagesIcarus32346-61. {APACrefURL} https://doi.org/10.1016/j.icarus.2019.02.001 {APACrefDOI} 10.1016/j.icarus.2019.02.001 \PrintBackRefs\CurrentBib
- Butler \BBA Bastian (\APACyear1999) \APACinsertmetastarButler1999{APACrefauthors}Butler, B\BPBIJ.\BCBT \BBA Bastian, T\BPBIS. \APACrefYearMonthDay1999. \APACrefbtitleSolar System Objects. Solar system objects. \PrintBackRefs\CurrentBib
- Cornwell (\APACyear2008) \APACinsertmetastarCornwell2008{APACrefauthors}Cornwell, T\BPBIJ. \APACrefYearMonthDay2008. \BBOQ\APACrefatitleMultiscale CLEAN deconvolution of radio synthesis images Multiscale clean deconvolution of radio synthesis images.\BBCQ \APACjournalVolNumPagesIEEE Journal on Selected Topics in Signal Processing2793-801. {APACrefDOI} 10.1109/JSTSP.2008.2006388 \PrintBackRefs\CurrentBib
- de Pater \BOthers. (\APACyear2014) \APACinsertmetastarDePater2014{APACrefauthors}de Pater, I., Fletcher, L\BPBIN., Luszcz-Cook, S., DeBoer, D., Butler, B., Hammel, H\BPBIB.\BDBLMarcus, P\BPBIS. \APACrefYearMonthDay2014. \BBOQ\APACrefatitleNeptune’s global circulation deduced from multi-wavelength observations Neptune’s global circulation deduced from multi-wavelength observations.\BBCQ \APACjournalVolNumPagesIcarus237211-238. {APACrefURL} http://dx.doi.org/10.1016/j.icarus.2014.02.030 {APACrefDOI} 10.1016/j.icarus.2014.02.030 \PrintBackRefs\CurrentBib
- de Pater \BBA Massie (\APACyear1985) \APACinsertmetastardePater1985{APACrefauthors}de Pater, I.\BCBT \BBA Massie, S\BPBIT. \APACrefYearMonthDay1985. \BBOQ\APACrefatitleModels of the millimeter-centimeter spectra of the giant planets Models of the millimeter-centimeter spectra of the giant planets.\BBCQ \APACjournalVolNumPagesIcarus62143-171. {APACrefDOI} 10.1016/0019-1035(85)90177-0 \PrintBackRefs\CurrentBib
- de Pater \BOthers. (\APACyear1989) \APACinsertmetastardePater1989{APACrefauthors}de Pater, I., Romani, P\BPBIN.\BCBL \BBA Atreya, S\BPBIK. \APACrefYearMonthDay1989. \BBOQ\APACrefatitleUranus deep atmosphere revealed Uranus deep atmosphere revealed.\BBCQ \APACjournalVolNumPagesIcarus821989. {APACrefDOI} 10.1029/GL016i008p00933 \PrintBackRefs\CurrentBib
- de Pater \BOthers. (\APACyear1991) \APACinsertmetastardePater1991a{APACrefauthors}de Pater, I., Romani, P\BPBIN.\BCBL \BBA Atreya, S\BPBIK. \APACrefYearMonthDay1991. \BBOQ\APACrefatitlePossible microwave absorption by H2S gas in Uranus’ and Neptune’s atmospheres Possible microwave absorption by h2s gas in uranus’ and neptune’s atmospheres.\BBCQ \APACjournalVolNumPagesIcarus91220-233. {APACrefDOI} 10.1016/0019-1035(91)90020-T \PrintBackRefs\CurrentBib
- Flasar \BOthers. (\APACyear1987) \APACinsertmetastarFlasar1987{APACrefauthors}Flasar, F\BPBIM., Conrath, B\BPBIJ., Gierasch, P\BPBIJ.\BCBL \BBA Pirraglia, J\BPBIA. \APACrefYearMonthDay198712. \BBOQ\APACrefatitleVoyager infrared observations of Uranus’ atmosphere: Thermal structure and dynamics Voyager infrared observations of uranus’ atmosphere: Thermal structure and dynamics.\BBCQ \APACjournalVolNumPagesJournal of Geophysical Research: Space Physics9215011-15018. {APACrefURL} http://doi.wiley.com/10.1029/JA092iA13p15011 {APACrefDOI} 10.1029/JA092iA13p15011 \PrintBackRefs\CurrentBib
- Fletcher \BOthers. (\APACyear2014) \APACinsertmetastarFletcher2014{APACrefauthors}Fletcher, L\BPBIN., de Pater, I., Orton, G\BPBIS., Hammel, H\BPBIB., Sitko, M\BPBIL.\BCBL \BBA Irwin, P\BPBIG. \APACrefYearMonthDay2014. \BBOQ\APACrefatitleNeptune at summer solstice: Zonal mean temperatures from ground-based observations, 2003-2007 Neptune at summer solstice: Zonal mean temperatures from ground-based observations, 2003-2007.\BBCQ \APACjournalVolNumPagesIcarus231146-167. {APACrefDOI} 10.1016/j.icarus.2013.11.035 \PrintBackRefs\CurrentBib
- Fletcher \BOthers. (\APACyear2020) \APACinsertmetastarFletcher2020{APACrefauthors}Fletcher, L\BPBIN., de Pater, I., Orton, G\BPBIS., Hofstadter, M\BPBID., Irwin, P\BPBIG., Roman, M\BPBIT.\BCBL \BBA Toledo, D. \APACrefYearMonthDay2020. \BBOQ\APACrefatitleIce Giant Circulation Patterns: Implications for Atmospheric Probes Ice giant circulation patterns: Implications for atmospheric probes.\BBCQ \APACjournalVolNumPagesSpace Science Reviews2161-38. {APACrefURL} http://dx.doi.org/10.1007/s11214-020-00646-1 {APACrefDOI} 10.1007/s11214-020-00646-1 \PrintBackRefs\CurrentBib
- Fletcher \BOthers. (\APACyear2018) \APACinsertmetastarFletcher2018{APACrefauthors}Fletcher, L\BPBIN., Orton, G\BPBIS., Sinclair, J\BPBIA., Guerlet, S., Read, P\BPBIL., Antuñano, A.\BDBLCalcutt, S\BPBIB. \APACrefYearMonthDay2018. \BBOQ\APACrefatitleA hexagon in Saturn’s northern stratosphere surrounding the emerging summertime polar vortex A hexagon in saturn’s northern stratosphere surrounding the emerging summertime polar vortex.\BBCQ \APACjournalVolNumPagesNature Communications91-14. {APACrefDOI} 10.1038/s41467-018-06017-3 \PrintBackRefs\CurrentBib
- Hofstadter \BOthers. (\APACyear1990) \APACinsertmetastarHofstadter1990{APACrefauthors}Hofstadter, M\BPBID., Berge, G\BPBIL.\BCBL \BBA Muhleman, D\BPBIO. \APACrefYearMonthDay1990. \BBOQ\APACrefatitleVertical motions in the Uranian atmosphere: an analysis of radio observations Vertical motions in the uranian atmosphere: an analysis of radio observations.\BBCQ \APACjournalVolNumPagesIcarus84261-267. {APACrefDOI} 10.1016/0019-1035(90)90170-E \PrintBackRefs\CurrentBib
- Hofstadter \BBA Butler (\APACyear2003) \APACinsertmetastarHofstadter2003{APACrefauthors}Hofstadter, M\BPBID.\BCBT \BBA Butler, B\BPBIJ. \APACrefYearMonthDay2003. \BBOQ\APACrefatitleSeasonal change in the deep atmosphere of Uranus Seasonal change in the deep atmosphere of uranus.\BBCQ \APACjournalVolNumPagesIcarus165168-180. {APACrefDOI} 10.1016/S0019-1035(03)00174-X \PrintBackRefs\CurrentBib
- Karkoschka (\APACyear1998) \APACinsertmetastarKarkoschka1998{APACrefauthors}Karkoschka, E. \APACrefYearMonthDay1998. \BBOQ\APACrefatitleClouds of high contrast on Uranus Clouds of high contrast on uranus.\BBCQ \APACjournalVolNumPagesScience280570-572. {APACrefDOI} 10.1126/science.280.5363.570 \PrintBackRefs\CurrentBib
- Karkoschka (\APACyear2015) \APACinsertmetastarKarkoschka2015{APACrefauthors}Karkoschka, E. \APACrefYearMonthDay2015. \BBOQ\APACrefatitleUranus’ southern circulation revealed by Voyager 2: Unique characteristics Uranus’ southern circulation revealed by voyager 2: Unique characteristics.\BBCQ \APACjournalVolNumPagesIcarus250294-307. {APACrefURL} http://dx.doi.org/10.1016/j.icarus.2014.12.003 {APACrefDOI} 10.1016/j.icarus.2014.12.003 \PrintBackRefs\CurrentBib
- Luszcz-Cook \BOthers. (\APACyear2010) \APACinsertmetastarLuszcz-Cook2010{APACrefauthors}Luszcz-Cook, S\BPBIH., de Pater, I., Ádámkovics, M.\BCBL \BBA Hammel, H\BPBIB. \APACrefYearMonthDay2010. \BBOQ\APACrefatitleSeeing double at Neptune’s south pole Seeing double at neptune’s south pole.\BBCQ \APACjournalVolNumPagesIcarus208938-944. {APACrefDOI} 10.1016/j.icarus.2010.03.007 \PrintBackRefs\CurrentBib
- McMullin \BOthers. (\APACyear2007) \APACinsertmetastarMcMullin2007{APACrefauthors}McMullin, J\BPBIP., Waters, B., Schiebel, D., Young, W.\BCBL \BBA Golap, K. \APACrefYearMonthDay2007. \BBOQ\APACrefatitleCASA Architecture and Applications Casa architecture and applications.\BBCQ \BIn (\BVOL 376, \BPG 127-130). \PrintBackRefs\CurrentBib
- Mitchell \BOthers. (\APACyear2021) \APACinsertmetastarMitchell2021{APACrefauthors}Mitchell, D\BPBIM., Scott, R\BPBIK., Seviour, W\BPBIJ\BPBIM., Thomson, S\BPBII., Waugh, D\BPBIW., Teanby, N\BPBIA.\BCBL \BBA Ball, E\BPBIR. \APACrefYearMonthDay2021. \BBOQ\APACrefatitlePolar Vortices in Planetary Atmospheres Polar vortices in planetary atmospheres.\BBCQ \APACjournalVolNumPagesReviews of Geophysics591-24. {APACrefDOI} 10.1029/2020rg000723 \PrintBackRefs\CurrentBib
- Molter \BOthers. (\APACyear2021) \APACinsertmetastarMolter2021{APACrefauthors}Molter, E\BPBIM., de Pater, I., Luszcz-Cook, S., Tollefson, J., Sault, R\BPBIJ., Butler, B.\BCBL \BBA de Boer, D. \APACrefYearMonthDay20211. \BBOQ\APACrefatitleTropospheric Composition and Circulation of Uranus with ALMA and the VLA Tropospheric composition and circulation of uranus with alma and the vla.\BBCQ \APACjournalVolNumPagesThe Planetary Science Journal23. {APACrefURL} http://arxiv.org/abs/2010.11154https://iopscience.iop.org/article/10.3847/PSJ/abc48a {APACrefDOI} 10.3847/PSJ/abc48a \PrintBackRefs\CurrentBib
- Orton \BBA Yanamandra-Fisher (\APACyear2005) \APACinsertmetastarOrton2005{APACrefauthors}Orton, G\BPBIS.\BCBT \BBA Yanamandra-Fisher, P\BPBIA. \APACrefYearMonthDay20052. \BBOQ\APACrefatitleSaturn’s Temperature Field from High-Resolution Middle-Infrared Imaging Saturn’s temperature field from high-resolution middle-infrared imaging.\BBCQ \APACjournalVolNumPagesScience307696-698. {APACrefURL} https://www.science.org/doi/10.1126/science.1105730 {APACrefDOI} 10.1126/science.1105730 \PrintBackRefs\CurrentBib
- Pedlosky (\APACyear1987) \APACinsertmetastarPedlosky1987{APACrefauthors}Pedlosky, J. \APACrefYear1987. \APACrefbtitleGeophysical Fluid Dynamics Geophysical fluid dynamics. \PrintBackRefs\CurrentBib
- Perley \BBA Butler (\APACyear2017) \APACinsertmetastarPerley2017{APACrefauthors}Perley, R\BPBIA.\BCBT \BBA Butler, B\BPBIJ. \APACrefYearMonthDay20175. \BBOQ\APACrefatitleAn Accurate Flux Density Scale from 50 MHz to 50 GHz An accurate flux density scale from 50 mhz to 50 ghz.\BBCQ \APACjournalVolNumPagesThe Astrophysical Journal Supplement Series2307. {APACrefURL} http://dx.doi.org/10.3847/1538-4365/aa6df9https://iopscience.iop.org/article/10.3847/1538-4365/aa6df9 {APACrefDOI} 10.3847/1538-4365/aa6df9 \PrintBackRefs\CurrentBib
- Roman \BOthers. (\APACyear2022) \APACinsertmetastarRoman2022{APACrefauthors}Roman, M\BPBIT., Fletcher, L\BPBIN., Orton, G\BPBIS., Greathouse, T\BPBIK., Moses, J\BPBII., Rowe-Gurney, N.\BDBLHammel, H\BPBIB. \APACrefYearMonthDay2022. \BBOQ\APACrefatitleSubseasonal Variation in Neptune’s Mid-infrared Emission Subseasonal variation in neptune’s mid-infrared emission.\BBCQ \APACjournalVolNumPagesThe Planetary Science Journal378. {APACrefURL} http://dx.doi.org/10.3847/PSJ/ac5aa4 {APACrefDOI} 10.3847/psj/ac5aa4 \PrintBackRefs\CurrentBib
- Roman \BOthers. (\APACyear2020) \APACinsertmetastarRoman2020{APACrefauthors}Roman, M\BPBIT., Fletcher, L\BPBIN., Orton, G\BPBIS., Rowe-Gurney, N.\BCBL \BBA Irwin, P\BPBIG\BPBIJ. \APACrefYearMonthDay2020. \BBOQ\APACrefatitleUranus in Northern Midspring: Persistent Atmospheric Temperatures and Circulations Inferred from Thermal Imaging Uranus in northern midspring: Persistent atmospheric temperatures and circulations inferred from thermal imaging.\BBCQ \APACjournalVolNumPagesThe Astronomical Journal15945. {APACrefURL} http://dx.doi.org/10.3847/1538-3881/ab5dc7 {APACrefDOI} 10.3847/1538-3881/ab5dc7 \PrintBackRefs\CurrentBib
- R. Sault \BOthers. (\APACyear2004) \APACinsertmetastarSault2004{APACrefauthors}Sault, R., Engel, C.\BCBL \BBA de Pater, I. \APACrefYearMonthDay20044. \BBOQ\APACrefatitleLongitude-resolved imaging of Jupiter at 2 cm Longitude-resolved imaging of jupiter at 2 cm.\BBCQ \APACjournalVolNumPagesIcarus168336-343. {APACrefURL} https://linkinghub.elsevier.com/retrieve/pii/S0019103503003956 {APACrefDOI} 10.1016/j.icarus.2003.11.014 \PrintBackRefs\CurrentBib
- R\BPBIJ. Sault \BBA Wieringa (\APACyear1994) \APACinsertmetastarSault1994{APACrefauthors}Sault, R\BPBIJ.\BCBT \BBA Wieringa, M\BPBIH. \APACrefYearMonthDay1994. \BBOQ\APACrefatitleMulti-frequency synthesis techniques in radio interferometric imaging Multi-frequency synthesis techniques in radio interferometric imaging.\BBCQ \APACjournalVolNumPagesAstronomy and Astrophysics Supplemental Series. \PrintBackRefs\CurrentBib
- Sromovsky \BOthers. (\APACyear2015) \APACinsertmetastarSromovsky2015{APACrefauthors}Sromovsky, L\BPBIA., de Pater, I., Fry, P., Hammel, H.\BCBL \BBA Marcus, P. \APACrefYearMonthDay20159. \BBOQ\APACrefatitleHigh S/N Keck and Gemini AO imaging of Uranus during 2012–2014: New cloud patterns, increasing activity, and improved wind measurements High s/n keck and gemini ao imaging of uranus during 2012–2014: New cloud patterns, increasing activity, and improved wind measurements.\BBCQ \APACjournalVolNumPagesIcarus258192-223. {APACrefURL} http://dx.doi.org/10.1016/j.icarus.2015.05.029https://linkinghub.elsevier.com/retrieve/pii/S0019103515002390 {APACrefDOI} 10.1016/j.icarus.2015.05.029 \PrintBackRefs\CurrentBib
- Sromovsky \BBA Fry (\APACyear2005) \APACinsertmetastarSromovsky2005{APACrefauthors}Sromovsky, L\BPBIA.\BCBT \BBA Fry, P\BPBIM. \APACrefYearMonthDay2005. \BBOQ\APACrefatitleDynamics of cloud features on Uranus Dynamics of cloud features on uranus.\BBCQ \APACjournalVolNumPagesIcarus179459-484. {APACrefDOI} 10.1016/j.icarus.2005.07.022 \PrintBackRefs\CurrentBib
- Sromovsky \BOthers. (\APACyear2012) \APACinsertmetastarSromovsky2012{APACrefauthors}Sromovsky, L\BPBIA., Fry, P\BPBIM., Hammel, H\BPBIB., de Pater, I.\BCBL \BBA Rages, K. \APACrefYearMonthDay20128. \BBOQ\APACrefatitlePost-equinox dynamics and polar cloud structure on Uranus Post-equinox dynamics and polar cloud structure on uranus.\BBCQ \APACjournalVolNumPagesIcarus220694-712. {APACrefURL} http://dx.doi.org/10.1016/j.icarus.2012.05.029https://linkinghub.elsevier.com/retrieve/pii/S0019103512002114 {APACrefDOI} 10.1016/j.icarus.2012.05.029 \PrintBackRefs\CurrentBib
- Sromovsky \BOthers. (\APACyear2019) \APACinsertmetastarSromovsky2019{APACrefauthors}Sromovsky, L\BPBIA., Karkoschka, E., Fry, P\BPBIM., de Pater, I.\BCBL \BBA Hammel, H\BPBIB. \APACrefYearMonthDay2019. \BBOQ\APACrefatitleThe methane distribution and polar brightening on Uranus based on HST/STIS, Keck/NIRC2, and IRTF/SpeX observations through 2015 The methane distribution and polar brightening on uranus based on hst/stis, keck/nirc2, and irtf/spex observations through 2015.\BBCQ \APACjournalVolNumPagesIcarus317266-306. {APACrefURL} https://doi.org/10.1016/j.icarus.2018.06.026 {APACrefDOI} 10.1016/j.icarus.2018.06.026 \PrintBackRefs\CurrentBib
- Taylor \BOthers. (\APACyear1999) \APACinsertmetastarTaylor1999{APACrefauthors}Taylor, G\BPBIB., Carilli, C\BPBIL.\BCBL \BBA Perley, R\BPBIA. \APACrefYear1999. \APACrefbtitleSynthesis Imaging in Radio Astronomy II Synthesis imaging in radio astronomy ii (\BVOL 180). {APACrefURL} http://adsabs.harvard.edu/abs/1999ASPC..180.....T%5Cnhttp://adsabs.harvard.edu/cgi-bin/nph-data_query?bibcode=1999ASPC..180....1C&link_type=ABSTRACT%5Cnpapers3://publication/uuid/10AE7DD2-BF03-4C98-B08F-E37DB5D76182 \PrintBackRefs\CurrentBib
- Tollefson \BOthers. (\APACyear2021) \APACinsertmetastarTollefson2021a{APACrefauthors}Tollefson, J., de Pater, I., Molter, E\BPBIM., Sault, R\BPBIJ., Butler, B\BPBIJ., Luszcz-Cook, S.\BCBL \BBA DeBoer, D. \APACrefYearMonthDay2021. \BBOQ\APACrefatitleNeptune’s Spatial Brightness Temperature Variations from the VLA and ALMA Neptune’s spatial brightness temperature variations from the vla and alma.\BBCQ \APACjournalVolNumPagesThe Planetary Science Journal2105. {APACrefURL} http://dx.doi.org/10.3847/PSJ/abf837 {APACrefDOI} 10.3847/psj/abf837 \PrintBackRefs\CurrentBib