The Orbital Period vs. Absolute Magnitude Relationship of Intermediate Polars: Implications for Low States and Outbursts
Abstract
Recent advances in time-domain astronomy have led to fresh observational insights into intermediate polars, a subtype of magnetic cataclysmic variables generally accreting via a partial accretion disc. These new discoveries include detections of superhumps, low states, and outbursts. However, these studies have largely relied on relative photometry. Here we tabulate the absolute G magnitudes of confirmed intermediate polars, plot them against their orbital periods, and compare the results to similar studies of dwarf novae during quiescence and in outburst. This exercise suggests the presence of two distinct luminosity classes of intermediate polars, with practical and physical implications for the studies of low states and outbursts. In particular, we point out that two of the optically luminous systems showing short outbursts are also seen to exhibit superhumps, suggesting that they may be caused by the same underlying mechanism.
keywords:
novae, cataclysmic variables – X-rays: binaries1 Introduction
Cataclysmic variables (CVs) are semi-detached close binary systems in which a Roche lobe-filling late type star (the secondary) transfers matter onto a white dwarf (the primary). CVs are known to vary in the optical on a wide range of timescales, from seconds, hours, days to years (Hellier, 2001), making them excellent targets for time-domain surveys.
This includes observations with the Transiting Exoplanet Survey Satellite (TESS; Ricker et al. 2016). For the purpose of exoplanet search, TESS is designed to provide high cadence, high precision photometry almost continuously for a period of 28 days or integer multiples thereof, covering almost the entire sky over the course of the mission. This also makes it an excellent tool for the studies of CVs. Specifically, TESS data enable searches for rare photometric events and also enable significantly improved studies of multiply-periodic systems, particularly when the frequencies are closely spaced. The latter is the case for the intermediate polars (IPs, also called the DQ Her-type systems; Patterson 1994), in which the white dwarf magnetic field is sufficient (of order 10 MG) to disrupt the inner accretion disc, but not strong enough to synchronize the white dwarf spin to the orbit. The accretion flow follows the magnetic field lines to the magnetic pole regions in a form often called the accretion curtains. At the footpoints of the curtains, strong shocks form and produce X-rays (Mukai, 2017). The X-rays are reprocessed by the accretion curtains, the partial disc, and the secondary surface, resulting in optical light curves that are modulated on the spin (Ps), the orbital (Po), and/or the beat (Pb=[PsPo-1]-1) periods. In addition, the dense, nearly continuous coverage with TESS is also advantageous in the studies of superhumps in non-magnetic CVs (Bruch, 2022), seen originally in SU UMa type dwarf novae; we will discuss this in the context of IPs in subsection 3.2.
Most other time domain surveys do not have the dense coverage necessary to track the orbital, spin, and beat periods of IPs. However, surveys such as All-Sky Automated Survey for Supernovae (ASAS-SN; Shappee et al. 2014; Kochanek et al. 2017) and the observations by the amateur astronomers, as tabulated by the American Association of Variable Star Observers (AAVSO111https://www.aavso.org/) have longer baselines and allow searches for outbursts and low states.
Between TESS, ASAS-SN, and the AAVSO database, these time-domain observations have resulted in several recent publications on outbursts (see, e.g., Scaringi et al. 2022b; Hameury et al. 2022) and low states (e.g., Covington et al. 2022) of IPs. However, these studies have concentrated on relative photometry. Here we collect absolute magnitudes of IPs based on Gaia data and present them as a function of Po. This exercise allows us to place IPs on the same plane as other CVs with accretion discs, and hence provides the necessary context in which to interpret the low states and outbursts.
2 Absolute Magnitudes vs. Orbital Periods of IPs
For this compilation, we started with the list of 71 objects confirmed as IPs as of late 2021222https://asd.gsfc.nasa.gov/Koji.Mukai/iphome/catalog/alpha.html. Of these, 67 have positive parallax measurements in Gaia early Data Release 3 (EDR3; Gaia Collaboration et al. 2021). as well as Gaia G magnitudes (the G band covers 330–1050 nm; Gaia Collaboration et al. 2016). G magnitudes reported in the Gaia EDR3 catalog are the weighted means of calibrated measurements taken between 2014 July 25 and 2017 May 28 (Riello et al., 2021). For three IPs (CXOGBS J174954.5294335, IGR J181511052, and V1674 Her), negative parallax values are reported, while there is no Gaia counterpart to XY Ari, the IP behind the molecular cloud, MBM 12, so these systems are not included in this analysis. For the rest, we used the geometric distances of Bailer-Jones et al. (2021), and hence calculated their absolute G magnitudes MG. The orbital period and MG of these 67 IPs, along with several other properties explained below, are listed in Table 1 in order of MG.
| Object | Po (h) | MG | DBI1 | SX Ref | Outburst | Low State | ||
| 1RXS J180431.1273932 | 4.99 | 2.9: | 1.392 | 4.41034 | 4XMM-DR11 | N | N | |
| V667 Pup | 5.61 | 3.0 | 1.326 | 1.01034 | 5.11033 | 2SXPS | N | N |
| IGR J181732509 | 1.53 | 3.5: | 1.440 | 3.91034 | 2.91034 | 4XMM-DR11 | N | N |
| V4743 Sgr | 6.72 | 3.6: | 1.084 | 4.81033 | 4XMM-DR11 | N | N | |
| NY Lup | 9.87 | 3.8 | 0.784 | 1.81034 | 7.91033 | 4XMM-DR11 | Y | N |
| V1223 Sgr | 3.37 | 4.3 | 1.123 | 4.91033 | 3.41033 | 4XMM-DR11 | Y | Y |
| 1RXS J213344.1+510725 | 7.14 | 4.3 | 0.856 | 1.31034 | 6.11033 | 4XMM-DR11 | N | Y |
| V2731 Oph | 15.42 | 4.4 | 3.11034 | 1.11034 | 4XMM-DR11 | N | N | |
| GK Per | 47.92 | 4.4 | 1.31033 | 7.11032 | ASCA | Y | N | |
| V418 Gem | 4.37 | 4.5: | 1.002 | 8.01033 | 6.21033 | 4XMM-DR11 | N | N |
| IGR J150946649 | 5.88 | 4.5 | 0.894 | 3.41033 | 2.41033 | 4XMM-DR11 | N | N |
| V647 Aur | 3.47 | 4.5 | 1.064 | 6.01033 | 3.71033 | 4XMM-DR11 | N | N |
| EI UMa | 6.43 | 4.6 | 0.825 | 4.31033 | 5.41033 | 4XMM-DR11 | Y | N |
| Swift J2006.4+3645 | 17.28 | 4.6: | 3.31034 | 9.51033 | 2SXPS | N | N | |
| HZ Pup | 5.09 | 4.6: | 0.924 | 2.21033 | 4XMM-DR11 | N | N | |
| PQ Gem | 5.19 | 4.8 | 0.863 | 2.11033 | 1.81033 | 4XMM-DR11 | N | N |
| 1RXS J230645.0+550816 | 3.26 | 4.8: | 0.999 | 3.61033 | 4XMM-DR11 | N | N | |
| V405 Aur | 4.14 | 4.8 | 0.938 | 1.71033 | 1.21033 | 2SXPS | N | N |
| V2400 Oph | 3.43 | 4.9 | 0.961 | 2.81033 | 2.91033 | 4XMM-DR11 | N | N |
| AO Psc | 3.59 | 4.9 | 0.950 | 7.91032 | 1.21033 | 4XMM-DR11 | N | Y |
| MU Cam | 4.72 | 5.0 | 0.843 | 1.71033 | 1.11033 | 4XMM-DR11 | N | N |
| V515 And | 2.73 | 5.0 | 0.983 | 2.01033 | 2.71033 | 4XMM-DR11 | N | Y |
| V709 Cas | 5.33 | 5.1 | 0.770 | 4.81033 | 2.51033 | 4XMM-DR11 | N | N |
| PBC J0927.86945 | 4.79 | 5.2 | 0.784 | 1.51033 | 9.71032 | 4XMM-DR11 | N | N |
| BG CMi | 3.23 | 5.2 | 0.896 | 2.21033 | 2.21033 | 2SXPS | N | N |
| V2306 Cyg | 4.73 | 5.2 | 0.788 | 2.61033 | 2.81033 | 2SXPS | N | N |
| FO Aqr | 4.85 | 5.3 | 0.753 | 1.81033 | 9.81032 | 4XMM-DR11 | Y | Y |
| V2069 Cyg | 7.48 | 5.3 | 0.543 | 2.91033 | 1.51033 | 4XMM-DR11 | N | N |
| TV Col | 5.49 | 5.5 | 0.649 | 1.81033 | 1.81033 | 2SXPS | Y | N |
| IGR J165471916 | 3.72 | 5.5 | 0.783 | 2.91033 | 2.21033 | 2SXPS | N | N |
| V349 Aqr | 3.23 | 5.5: | 0.818 | 1.11033 | 4XMM-DR11 | N | N | |
| UU Col | 3.45 | 5.6: | 0.776 | 2.21033 | 4XMM-DR11 | N | N | |
| IGR J170144306 | 12.82 | 5.6 | 1.31033 | 1.11033 | 4XMM-DR11 | Y | N | |
| Swift J2138.8+5544 | 4.43 | 5.6: | 0.704 | 4.11033 | 2SXPS | N | N | |
| V1033 Cas | 4.03 | 5.6 | 0.733 | 4.11033 | 2.31033 | 4XMM-DR11 | N | N |
| V1062 Tau | 9.98 | 5.7 | 0.199 | 4.51033 | 4.61033 | 2SXPS | Y | Y |
| IGR J165003307 | 3.62 | 5.7 | 0.738 | 3.31033 | 1.71033 | 4XMM-DR11 | N | N |
| WX Pyx | 5.3 | 5.7 | 1.11033 | 4XMM-DR11 | N | N | ||
| IGR J083904833 | 8 | 5.8 | 5.31033 | 2.71033 | 2SXPS | N | N | |
| TX Col | 5.691 | 5.8 | 0.551 | 1.21033 | 1.81033 | 2SXPS | N | N |
| IGR J183081231 | 5.37 | 5.9: | 0.549 | 1.01034 | 4.61033 | 4XMM-DR11 | N | N |
| Swift J0717.82156 | 5.52 | 6.0: | 0.510 | 5.11033 | 3.31033 | 4XMM-DR11 | N | N |
| V1323 Her | 4.40 | 6.1 | 0.572 | 8.01032 | 4XMM-DR11 | N | Y | |
| AE Aqr | 9.88 | 6.1 | 0.088 | 1.51031 | 4XMM-DR11 | N | N | |
| DQ Her | 4.65 | 6.1 | 0.553 | 3.41030 | 4XMM-DR11 | N | N | |
| IGR J04571+4527 | 6.2 or 4.8 | 6.2 | 5.11033 | 3.01033 | 4XMM-DR11 | N | N | |
| IGR J171954100 | 4.01 | 6.2 | 0.576 | 1.81033 | 1.91033 | 4XMM-DR11 | N | N |
| Swift J183920.1045350 | 5.6 | 6.6: | 1.41033 | 4XMM-DR11 | N | N | ||
| RX J2015.6+3711 | 12.76 | 6.7 | 1.01033 | 4XMM-DR11 | N | N | ||
| V3037 Oph | 5.72 | 7.2: | 0.163 | 1.81033 | 4XMM-DR11 | N | N | |
| AX J1740.12847 | 2.1? | 7.5: | 2.31033 | 4XMM-DR11 | N | N | ||
| LAMOST J024048.51+195226.9 | 7.34 | 7.9 | 0.186 | N | N | |||
| V1460 Her | 4.99 | 7.9 | 0.038 | 1.61030 | 2SXPS | N | N | |
| IGR J19267+1325 | 3.45 | 8.3 | 0.068 | 1.11033 | 2SXPS | N | N | |
| AX J1832.30840 | 8.3: | 5.01033 | 2.21033 | 4XMM-DR11 | N | N | ||
| DO Dra | 3.97 | 8.8 | 0.111 | 8.21031 | 2.41032 | 2SXPS | Y | Y |
| HT Cam | 1.43 | 8.8 | 0.110 | 8.71031 | 4XMM-DR11 | Y | N | |
| DW Cnc | 1.44 | 9.0 | 0.060 | 8.91031 | 4XMM-DR11 | Y | Y | |
| 1RXS J211336.1+542226 | 4.17 | 9.1 | 0.209 | 3.41032 | 4.51032 | 4XMM-DR11 | N | Y |
| EX Hya | 1.64 | 9.4 | 0.059 | 1.01031 | 6.51031 | 4XMM-DR11 | Y | N |
| PBC J1841.1+0138 | 5.33 | 9.7: | 0.484 | 4.31032 | N | N | ||
| V598 Peg | 1.39 | 9.8 | 0,137 | 4.91031 | 4XMM-DR11 | N | N | |
| CTCV J20563014 | 1.76 | 9.9 | 0.196 | 1.81031 | 4XMM-DR11 | Y | N | |
| CC Scl | 1.41 | 10.3 | 0.265 | 7.91031 | XMM Slew | Y | N | |
| AX J1853.30128 | 1.45 | 10.7 | 0.370 | 3.71031 | 4XMM-DR11 | N | N | |
| V1025 Cen | 1.41 | 10.7 | 0.367 | 4.21031 | 1.11032 | 4XMM-DR11 | Y | Y |
| V455 And | 1.35 | 11.6 | 0.588 | 5.51028 | 4XMM-DR11 | Y | N | |
| 1Disc Brightness Index. See text for definition. | ||||||||
We argue below that an accuracy of 0.3 mag in MG is desirable to achieve our main objective. In comparison, a distance error of 4.7% results in an error in MG of 0.1 mag. Reported errors are smaller than this limit for 36 of the 67 IPs in Table 1. An additional 14 IPs have distance accurate to 15%, resulting in MG error of 0.3 mag. The remaining 17 IPs have have larger errors on the distance, and hence MG: these are indicated with a colon added to the MG values. Since these IPs are mostly at distances exceeding 2 kpc, they may also suffer significant interstellar reddening.
We also investigated the potential effects of long-term variability by inspecting the data collected by the American Association of Variable Star Observers333Specifically, we used their online Light Curve Generator (https://www.aavso.org/LCGv2/). between 2014 July 25 (JD=2456863.5) and 2017 May 28 (2457902.5). Most nearby IPs (e.g., 30 out of the 36 systems with distance errors 4.7%) are well covered by AAVSO observers, and in the majority of the case, there is a slight, likely systematic, offset in that G magnitudes are often 0.2 brighter than V magnitudes. Exceptions to this general rule include FO Aqr, which experienced a deep low state in 2016 (Littlefield et al., 2020), and this appears to be biasing the average Gaia value lower (G=13.9) compared with V13.7 that is typical of its normal state. Similarly, the Gaia average for V1025 Cen may be biased by as much as 1.5 mag lower due to a low state that is seen in the ASAS-SN data (Covington et al. 2022; note that there are no AAVSO data for this IP during the relevant period). GK Per, on the other hand, had an outburst in 2015, which appears to have biased the average Gaia measurement higher (G=12.6) compared to typical quiescent V magnitude of V13.1. However, this is because the outburst of GK Per is exceptionally long (see, e.g., Hameury & Lasota 2017); most IP outbursts are too infrequent and too brief to bias the Gaia averages significantly. We therefore take the Gaia G magnitudes as representative of their normal state, for the vast majority of these IPs.
The absolute G magnitudes of these 67 IPs range from 2.9 to 11.6, with a majority (37 systems) having MG in the 4.0–6.0 range. A simple histogram of IPs by their MG will have a single broad peak in this range, with five systems on the bright end and a long tail of 25 systems on the fainter end. While this is not particularly informative, a clear picture emerges when IPs are placed in the orbital period vs. absolute G magnitude plane (Figure 1). In this figure, 61 out of 67 IPs for which the orbital period is securely known are plotted.
The vast majority of these IPs fit within the standard framework of CV evolution driven by angular momentum loss (Knigge et al., 2011). In these systems, the secondary is on or near the main sequence, whose luminosity can be estimated, to first order, from the orbital period alone. The secular-average accretion rate can also be estimated from the orbital period, but with considerable scatter. In contrast, 5 of the 67 IPs have orbital periods in excess of 10 hrs (GK Per, Swift J2006.4+3645, V2731 Oph, IGR J17014-4306, and RX J2015.6+3711 in order of decreasing Po). The G magnitudes of these long-period IPs have a strong contribution from the evolved secondary, and the secular accretion rate is even more uncertain. The number of known CVs, magnetic or otherwise, with Po 10 hrs is relatively low and they exhibit a wide range of absolute G magnitudes and outburst behaviors. We therefore concentrate on IPs with Po 10 hrs in the rest of this paper.
2.1 Disc Brightness Index
In Figure 1, we also plot curves representing fits to the absolute magnitudes of dwarf novae in outburst and in quiescence. Dwarf novae are a common and well-studied type of non-magnetic CVs that are seen in the faint, quiescent, state the majority of the time, punctuated by occasional outbursts. Specifically in Figure 1, we use the absolute V magnitude-Po relationship for quiescent dwarf novae (MV,q=9.720.337Po) and those in outburst (MV,o=5.640.259Po) according to Warner (1987). Note that these relationships are only calibrated for Po 10 hrs.
The outburst absolute magnitudes of dwarf novae, as a function of Po, can be explained as due to high state discs having near-constant surface brightness, and the Po dependence of the radius of the primary Roche lobe, and hence the accretion disc (Warner, 1987). The case of dwarf novae in quiescence is far more complicated, with contributions from the emission lines, the secondary in the long orbital period systems, and the white dwarf in particularly faint systems. Nevertheless, it is not surprising that there is an orbital period dependence for quiescent dwarf novae. Similarly, MG of IPs, too, are expected to depend, in part, on Po.
There are several caveats and limitations for the comparison between IPs and Warner’s relationships for dwarf novae. First, Warner (1987) used the distances to the dwarf novae that were estimated using the techniques available at the time. Compared to what could be done with Gaia data, there could be additional scatters or offsets in the data used to construct these relationships. Second, Warner’s formula refer to the V band magnitudes, not the broad (effectively white light) Gaia G band. Dwarf novae at maximum are dominated by the hot discs and tend to have BV0.0, VR0.0, and RI0.0 (see, e.g., Spogli et al. 1998) so MV,o should be a reasonable approximation for the equivalent absolute G magnitude MG,o. However, the conversion between V and G magnitudes for quiescent dwarf novae is much less certain, and this is a potential source of errors of our study. Note also that we have not corrected MG of IPs for interstellar reddening, since there is no database of uniform and reliable reddening data for the IPs. Finally, inclination angles are poorly known for most IPs, so we have not corrected MG of IPs for inclination angle effects. This was done for dwarf novae by Warner (1987): discs seen face-on can be 1 magnitude brighter than average, while edge-on discs of deeply eclipsing systems are fainter by 1.7 magnitudes or more (Patterson, 2011). Nevertheless, Warner’s lines probably should give a reasonable indication of whether an IP is similar in the optical to dwarf novae during quiescence or in outburst.
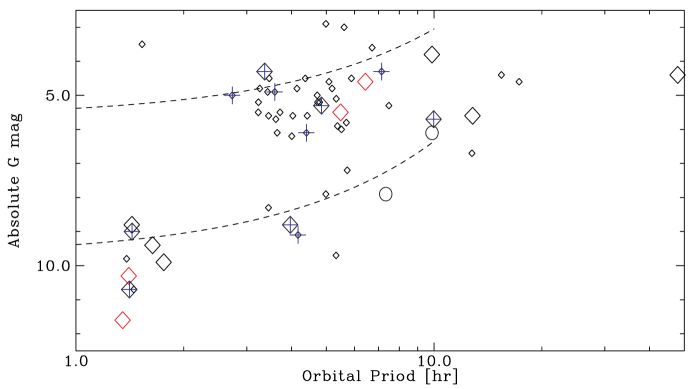
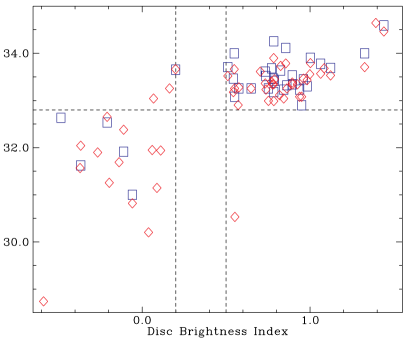
Figure 1 gives the impression of a dichotomy among IPs with Po below 10 hrs, one group near the quiescent dwarf nova line and the other near the outburst line. In an attempt to quantify this, we define a new parameter, which we call the disc brightness index (DBI), as [MG MV,q]/[MV,o MV,q] where MV,q and MV,o are functions of Po, as prescribed by Warner (1987). By construction, DBI of 0.0 indicates an object similar to a quiescent dwarf nova with the same orbital period, and 1.0 an object similar to dwarf nova with the same orbital period in outburst. The DBI values of the IPs are tabulated in Table 1, and a histogram of the number of IPs as a function of DBI in 0.1 increment is shown in Figure 2. Note that the two relationships of Warner (1987) differ by 3 magnitudes at all orbital periods for which they are defined. Therefore, an accuracy in DBI of 0.1 requires that MG of IPs to be known to 0.3 mag, which appears to be achieved for the majority of IPs in Table 1. One exception is V1025 Cen: if its low state resulted an underestimate of its MG by 1.5 mag, then its DBI is underestimated by 0.379, implying that it may have a DBI of +0.012 in its normal state. Since the zero point of the formula to correct for the inclination dependence of disc brightness (equation 4) used by Warner (1987) results in an average correction of 0.367 mag, the DBI of disc-dominated IPs are likely underestimated by 0.1.

This figure appears to confirm the dichotomy of IPs into two subclasses. Of the 56 IPs for which we have calculated the DBI (61 objects included in Figure 1 minus 5 with Po 10 hrs), 18 have DBI less than 0.2, 38 have DBI over 0.5, and there are none in the 0.2–0.5 range. We will use the term optically-determined low luminosity IPs (LLIPs) for the former, and optically-determined high luminosity IPs (HLIPs) for the latter. Note that, in the context of this work, these terms are not applied to IPs with orbital periods longer than 10 hrs.
Figure 2 should not be taken as a true representation of the underlying population. In particular, selection effects against discovering and/or recognizing LLIPs as such are likely. However, it would take a contrived set of circumstances for selection effects to create the appearance of a gap at DBI range of 0.2–0.5 if there was no such gap in the underlying population. Similarly, the various caveats mentioned above for the use of Warner’s lines may shift the peaks or broaden the distributions in DBI, but we cannot come up with a plausible scenario in which one or more of these limitation would create an apparent DBI gap at 0.2–0.5. Therefore, the conclusion that there are two separate populations seems reasonably secure.
2.2 Comparison of Optical and X-ray Luminosities
This is not the first time that high- and low-luminosity subclasses of IPs were considered. Previously, Pretorius & Mukai (2014) found that, while most IPs had hard X-ray (BAT-band) luminosity higher than erg s-1, there was an indication of a separate population of LLIPs with BAT-band luminosity of order erg s-1.
To investigate anew the X-ray based distinction between HLIPs and LLIPs, we have also collected hard X-ray fluxes from the Swift BAT 157 month survey444https://swift.gsfc.nasa.gov/results/bs157mon/ (see details of its predecessor, the BAT 105 month survey, in Oh et al. 2018), and the “soft” (10 keV) X-ray fluxes primarily from the fourth XMM-Newton serendipitous source catalogue (4XMM-DR11; Webb et al. 2020) and the Swift X-Ray Telescope Point-source Catalog (2SXPS; Evans et al. 2020). Neither catalog has an entry for CC Scl, but it is listed in the XMM-Newton Slew Survey Catalog (Saxton et al., 2008). Pointed XMM-Newton and Swift observations of GK Per are taken during its outbursts, so we used the quiescent ASCA observation (Ezuka & Ishida, 1999) instead for this object. For V4743 Sgr (=nova Sagittarii 2002 No. 3), we selected the 4XMM-DR11 entry for observation dated 2006 March 28, as this observation is most likely to be dominated by the accretion luminosity, rather than the residual effects of nova eruption as may well be the case for earlier observations.
All in all, we have collected 42 hard X-ray fluxes and 65 soft X-ray fluxes for the 67 IPs, and converted them to luminosities, with only one object, the candidate propeller LAMOST J024048.51+195226.9, without either. Of the 56 IPs for which DBI can be defined, hard X-ray luminosities are known for 35 objects and soft X-ray luminosities for 54 objects. These are plotted against DBI in Figure 3. We also plot a horizontal dashed line at log(LX)=32.8 to guide the eye.
It is clear that the optically-defined HLIPs are almost always X-ray luminous at this level, with the exception of DQ Her (DBI=0.553), which is not detected with BAT and has an XMM-Newton luminosity of 3.41030 erg s-1. However, DQ Her is a deeply eclipsing system and it is thought that the the viewing geometry is so exactly edge-on that we have no direct line of sight to the post-shock region above the white dwarf surface (Mukai et al., 2003). The intrinsic X-ray luminosity of DQ Her is therefore likely much higher than the observed luminosity. Note also that, when corrected for the high inclination, the DBI of DQ Her is also significantly higher than the value adopted here (0.553).
In contrast, the optically-defined LLIPs are widely distributed in their X-ray luminosities but predominantly below the log(LX)=32.8 line. The exceptions are V1062 Tau (DBI=0.199, BAT luminosity of 4.51033 erg s-1 and Swift luminosity of 4.61033 erg s-1), V3037 Oph (DBI=0.163, no BAT detection, and XMM-Newton luminosity of 1.81033 erg s-1), and IGR J19267+1325 (DBI=0.068, no BAT detection, and Swift luminosity of 1.11033 erg s-1). Of these, V1062 Tau has an orbital period of 9.98 hr, at the edge of the regime where DBI can be defined. Perhaps our analysis based on DBI is not valid for this system. The latter two may suffer substantial optical reddening (A2 and AV=1.40.7 respectively; Thorstensen & Halpern 2013; Butler et al. 2009). If verified, this could push their DBI numbers high enough to place them in the 0.2–0.5 gap or even among the (optically-determined) HLIPs. This does point out the need for a systematic investigation of interstellar reddening to see if the gap between HLIPs and LLIPs (Figure 2) is complete or if there are a few in-between systems.
We can conclude that the X-ray luminosity and the optical brightnesses, as indicated by DBI, of IPs are strongly correlated, with possible outliers. Both are therefore likely to be controlled largely by a single parameter, presumably the accretion rate. In contrast, MG of IPs does not provide a useful discriminant, as it is also strongly influenced by the size of the partial accretion disc.
3 Discussion
3.1 IP Subclasses and Orbital Periods
It is well known that CVs in general have lower mass transfer rates below the 2–3 hr “period gap” than above (Knigge et al., 2011), and this indeed turns out to be a important factor in determining which IPs have low X-ray and optical luminosities. Specifically, 9 out of 10 IPs below the period gap are seen to be LLIPs. These systems are relatively nearby, and so a large correction due to interstellar reddening is not expected for these systems.
The 10th system, IGR J181732509, was suggested to be an LLIP based solely on its short orbital period (Mukai, 2017). However, it is luminous both in X-rays ( erg s-1) and in the optical (MG=3.5, DBI=1.440). These numbers were calculated using a distance of 4.69 kpc. However, the the Gaia parallax of 0.22120.0859 mas corresponds to a possible range of 3.62–6.14 kpc according to Bailer-Jones et al. (2021). Using the lower bound instead, IGR J181732509 has MG=4.1, or DB=1.275, so the distance uncertainty does not impact our assessment that this system is an HLIP. Therefore, it must have an accretion rate far in excess of the secular average, perhaps similar to (but not as extreme as) T Pyx (Po=1.83 hr, MV=0.9 according to Patterson et al. 2017, although uncertainties remain regarding the distance to this object).
In contrast, in the orbital period range of 2.7 to 10 hrs, there are 9 LLIPs and 37 HLIPs. Of the 9 LLIPs in this range, two systems, AE Aqr and LAMOST J024048.51+195226.9, are candidate propeller systems (see, e.g., Thorstensen 2020; Pretorius et al. 2021 and references therein). As already mentioned, some IPs in this period range (e.g., V3037 Oph and IGR J19267+1325) may have been misclassified as LLIPs due to large interstellar extinction. However, there are IPs in this orbital period range that appear to be genuine LLIPs (e.g., DO Dra and V1460 Her), despite the expectations from considerations of secular accretion rate.
LLIPs are sufficiently optically faint to preclude the presence of high state discs. The optical brightness of HLIPs suggests the presence of high state discs, and certainly allows it, even though there are obvious factors that could limit the validity of any direct comparisons of properties of discs in non-magnetic CVs and IPs. The latter should have a central hole, so the total disc area is somewhat smaller than that in a non-magnetic system. On the other hand, irradiation of the partial disc and the accretion curtains should add optical light beyond the disc luminosity provided by the in-situ viscous heating, as evidenced by the presence of optical spin modulation. Interestingly, LLIPs with small Po / Ps ratios (such as EX Hya, Po / Ps = 1.4659) and large ratios (CTCV J20563014, 322) appear to have similar MG, despite the expected differences in the size of the central hole in their discs. Another interesting case is that of V2400 Oph. Even though it was originally established to be a discless IP (Buckley et al., 1995; Buckley et al., 1997), it is nevertheless an HLIP according to this analysis. Note also that recent X-ray observations have led Joshi et al. (2019) to reconsider the possible presence of a disc, or disc-like structures, in V2400 Oph, at least during certain epochs.
HLIPs, LLIPs, and long-period IPs also have distinct characteristics in their optical spectra. The continuum shows strong contributions of the mass donor in long-period IPs, and any disc contributions can only be determined after a careful analysis. Only the most prominent emission lines are obvious above the bright continuum. Of the 4 IPs shown in Figure 2 of Gänsicke et al. (2005), V2731 Oph (=1RXS J173021.5055933, Po=15.4 hr) is a good example of this. HLIPs generally show blue non-stellar continuum from the disc, similar to those of dwarf novae in outburst, on which prominent emission lines of Hydrogen Balmer series as well as HeII 4686 are superimposed. The strengths of these lines distinguishes HLIPs from non-magnetic CVs with bright discs. In Figure 2 of Gänsicke et al. (2005), V647 Aur (=RXS J063631.9+353537) and V418 Gem (=1RXS J070407.9+262501) are typical of this. Interestingly, the final panel of this figure (for V1323 Her=1RXS J180340.0+401214) shows a faint, flat continuum with strong emission lines (including Balmer jump in emission) that is a hallmark of low state discs. The only clue that this system may be magnetic is the relative prominence of the HeII 4686 line. In this respect, this spectrum of V1323 Her is similar to optical spectra of LLIPs. The fact that this system is among the lowest luminosity HLIP (DBI=0.572, no BAT detection, XMM-Newton luminosity of 8.01032 erg s-1) might be related to this.
In the following subsections, we review selected results on IPs in recent publications, obtained using time-domain observations. Our discussion is informed by the distinction between HLIPs and LLIPs.
3.2 Superhumps in IPs
Superhumps are defined as photometric variations at periods slightly different from the orbital period. Many are at periods slightly longer (positive superhumps), while some have periods that are slightly shorter (negative superhumps). The former is generally believed to be due to apsidal motion of elliptical discs (Whitehurst, 1988; Osaki, 2005), and the latter due to nodal precession of tilted discs (Wood et al., 2000; Thomas & Wood, 2015).
Positive superhumps were first observed during superoutbursts of SU UMa-type dwarf novae that are largely found below the period gap. The definition of this subclass is that they have superoutbursts and normal outbursts. Superoutbursts, in turn, are longer and brighter than normal outbursts, and are defined by the presence of superhumps (Osaki, 2005). When the outer radius of the disc grows beyond the 3:1 resonance radius, the disc becomes elliptical and starts to precess; when the outermost region of the elliptical disc is nearest the secondary, there is enhanced tidal stress, which results in increased disc brightness. Tidal truncation, however, limits the outer radius of the disc (Paczynski, 1977); since this is a function of the mass ratio (secondary mass divided by the white dwarf mass), superhumps are expected only for systems with certain values of . Early theoretical calculations suggested 0.25 as the precondition for superhumps (Whitehurst, 1988), requiring low mass secondaries and hence short orbital periods. Superhumps are also seen in novalike systems (non-magnetic CVs that are persistently bright, comparable to dwarf novae in outburst) and these are often referred to as permanent superhumpers.
Observationally, Patterson et al. (2005) found that confirmed superhumps in non-magnetic CVs are limited to systems with Po 3.5 hrs and smaller than 0.350.02. However, Retter et al. (2003) reported the detection of a 6.3 hr positive superhump (in addition to the negative superhump that is usually present) in the HLIP, TV Col. While this has not been confirmed in TESS data (Scaringi et al., 2022b; Bruch, 2022), the former reports the discovery of a 7.8 hr superhump period in EI UMa (Po=6.435 hr) instead. Thus, EI UMa now holds the record as CV with the longest orbital period for which positive superhumps have been detected, indirectly enhancing the credibility of the purported superhump detection for TV Col (Retter et al., 2003). Note that the search for transient positive superhumps in TV Col is a challenging task even using TESS data, given the persistent presence of the orbital period and the negative superhumps, particularly when the system brightness is changing on a comparable timescale.
In Figure 1, we used red symbols to indicate four IPs for which positive superhumps have been reported. Two of them, V455 And (Matsui et al., 2009) and CC Scl (Woudt et al., 2012), are systems below the period gap that have shown superoutbursts. Presumably, the discs in these LLIPs can reach the 3:1 resonance radius without exceeding the tidal truncation radius, so no special explanations are necessary. The other two are TV Col and EI UMa.
This is a surprising result, because superhumps are not expected according to the standard model in such long period systems. It is perhaps worth considering if this is related to the truncated nature of IP discs. It is also worth noting that superhumps in these HLIPs appear not to be persistent features of these systems.
3.3 Implications for the Low States of IPs
It is now apparent that low states of IPs are not as rare as previously thought (see Covington et al. 2022 and references therein). Those with known low states are noted in Table 1 and shown with an added plus symbol in Figure 1. It is also clear that low states are seen in HLIPs and LLIPs. However, not all low states are equal. Observers generally define low states in terms of relative photometry — for example, Covington et al. (2022) used “a sustained drop in flux of 0.5 mag” as their definition. What a given drop in optical brightness implies depends on the absolute magnitude in the normal state and the contribution of the secondary to it.
The accretion luminosity of an LLIP is modest even during the normal state. Therefore, when an LLIP goes into a low state, it can easily enter a state in which optical light is dominated by the component stars, with little or no contribution from accretion. For example, in DO Dra (MG=8.8 in Gaia EDR3), the M dwarf mass donor is detectable in the red part of the spectrum (Mukai et al., 1990), even in its normal state. The deepest part (2 mag in the V band) of its low state is interpreted by Covington et al. (2022) as due to cessation of accretion onto the white dwarf. This is corroborated by the non-detection in X-rays during a 55 ks NuSTAR observation (Shaw et al., 2020), and by a low-state TESS light curve in which only the orbital modulation (via the ellipsoidal modulation) was detectable (Hill et al., 2022). Similarly, accretion may have completely stopped in V1025 Cen at its lowest flux (Covington et al., 2022).
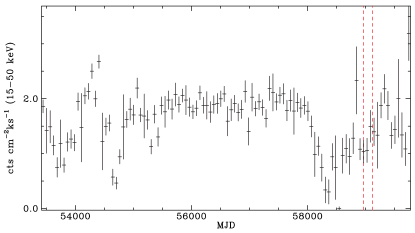
On the other hand, the observed low states of HLIPs are generally a move towards the LLIP level of optical brightness. For example, the low state of V1223 Sgr (Covington et al., 2022) was a drop of roughly 2 magnitudes to an absolute magnitude of 6.3 (or DBI0.6). The Swift BAT data on V1223 Sgr plotted using 60 day-bins (Figure 4; obtained from the Swift BAT transient monitor site555https://swift.gsfc.nasa.gov/results/transients/; Krimm et al. 2013) suggests accretion was on-going through much of the low state, with the hard X-ray fluxes dropping by a factor of 2–5 from the long-term average. We do note that there is one bin which is significantly lower. Similarly, the study of archival photographic plates by Garnavich & Szkody (1988) indicates a couple of epochs of non-detection in the optical. The upper limit is 3.8 mag below the typical high state magnitudes, suggestive of absolute magnitude 8.1. At these epochs, V1223 Sgr may have been comparable to LLIPs, or it may have been fainter.
In all, there does not appear to be a secure detection of an HLIP in which accretion has temporarily ceased. Moreover, there do not appear to be high time resolution time-series photometry, optical spectroscopy, or pointed X-ray observations of an HLIP in a deep enough low state to temporarily qualify as an LLIP (or fainter). What we do have are such observations during shallow low states in which the objects is still brighter than typical LLIPs (e.g., FO Aqr; see Kennedy et al. 2017; Littlefield et al. 2020). It presumably requires active accretion to keep the disc bright, either via in-situ viscous heating or via irradiation from accretion onto the white dwarf.
To recap, low states have been observed in both HLIPs and LLIPs. These low states presumably result from downward fluctuations in the mass transfer rate from the secondary. However, not all low states are equal, which should be kept in mind in interpreting the low state data, as well as in considering the physical origin of the mass transfer rate variability. In particular, we do not yet have contemporaneous observations of HLIPs in a deep low state in which accretion has ceased. Continued monitoring of HLIPs is required to see if they ever enter such deep low state and, if one does, to observe it in detail.
3.4 Implications for the Outbursts of IPs
In recent years, an increased attention has been paid to outbursting behaviour of IPs. We list the IPs with known outbursts in Table 1 based on the list provided in Hameury & Lasota (2017), supplemented with additional systems noted by Hameury et al. (2022), as well as noting papers on individual objects (V1025 Cen; Littlefield et al. 2022 and IGR J170144306; Shara et al. 2017). IPs with known outbursts are plotted using larger diamonds in Figure 1.
Dwarf novae are considered to be non-magnetic systems (i.e., any magnetic field the white dwarf might possess is not strong enough to influence the accretion flow) in which the mass transfer rate from the secondary to the disc is low. Dwarf nova outbursts are interpreted as due to thermal instability of the accretion discs (Lasota, 2001). In quiescence, the disc is in a cool, faint state and the disc mass gradually grows; when the surface density becomes sufficiently high, it transitions to a hot, bright state (outburst). The same basic mechanism can in principle operate in LLIPs with magnetically truncated discs, with similar or somewhat modified outburst properties (such as recurrence period and duration).
Indeed, of the 18 LLIPs as identified by DBI, 9 are known to have outbursts. Their outburst durations (see, e.g., Table 1 of Hameury & Lasota 2017) are generally longer than 1 day, and these outbursts can plausibly interpreted as to due to thermal instability of the disc, under the limited influence of the magnetic field (Hameury et al., 2022). Interestingly, there are hints that the size of the central hole (using the Po / Ps ratio as proxy) might influence the outburst duration and amplitude. For example, outbursts of EX Hya (Po / Ps = 1.4659) is a relatively short (2 day) and their amplitude modest (3.5 mag; Hellier et al. 1989). In contrast, the 2007 superoutburst of V455 And (Po / Ps = 71.9482) lasted well over 20 days and had an amplitude greater than 7 mag (Matsui et al., 2009). The only exception among LLIPs is the short, repeated bursts seen in V1025 Cen (Littlefield et al., 2022), which the authors interpreted in the framework of accretion gating model.
On the other extreme, GK Per exhibits 2 month-long outbursts (Evans et al., 2009). This is presumably a consequence of the large physical size of the disc in this system, which has an exceptionally long, 2-day orbital period. The outbursts seen in archival photographic plates in IGR J170144306 (Shara et al., 2017) may turn out to be similar.
HLIPs, on the other hand, are likely to have bright discs that are stable against dwarf nova outburst. It is true that the absolute magnitudes of HLIPs often appear fainter than those of dwarf novae at maximum (Figure 1), and hence their DBIs are on average lower than 1.0 (Figure 2). However, the critical value for stability is thought to be smaller than the maximum brightness of dwarf nova outbursts, which is confirmed by the standstills of Z Cam type dwarf novae roughly 0.7 mag below outburst peak (Lasota, 2001).
The outbursts that require a radical new interpretation therefore are the short events seen in HLIPs TV Col, EI UMa, V1223 Sgr, NY Lup, and FO Aqr (Scaringi et al., 2022b; Hameury et al., 2022). One such radical interpretation is the micronova model of Scaringi et al. (2022b, a), which proposes that local thermo-nuclear runaway (TNR) can happen on magnetic CVs, as opposed to the well-established phenomenon of classical nova eruptions (see Chomiuk et al. 2021 for a recent review), which is presumed to be a phenomenon over the entire surface of the accreting white dwarf. There are missing elements in the current literature of micronovae that need to be filled in, if this model is to be widely accepted. One is the process in which the energy of the local TNR is converted to visible light. Another is a quantitative assessment of whether the white dwarf magnetic field is strong enough to keep the plasma confined at near TNR conditions, analogously to what was done by Hameury et al. (1983) in the neutron star case.
Another interpretation is the magnetically gated accretion model, which has been applied both to the LLIP V1025 Cen (Littlefield et al., 2022) and to HLIP V1223 Sgr (Hameury et al., 2022). At the time when repeated short outbursts are seen, V1223 Sgr was in a shallow low state (Hameury et al., 2022) that likely implies that it had a bright partial disc. There is no quantitative exploration in the literature yet of how magnetically gated accretion can lead to enhanced optical emission sufficiently luminous to compete with the partial disc in HLIPs.
Observations suggests that the short outbursts of HLIPs and superhumps may be linked. Two HLIPs with positive superhumps are both systems known to have short outbursts. Furthermore, Retter et al. (2003) noted that the superhumps were observed right after the 2001 January 7 mini-outburst (their terminology) of TV Col, but not immediately before. In the case of EI UMa, Scaringi et al. (2022b) noted that the superhumps were observed before the bursts, but not after. We do not know yet if superhumps and short outbursts are causally connected, but we believe that this is a possibility worth exploring.
Note that, in SU UMa-type dwarf novae, superoutbursts are characterized by both the presence of superhumps and by the higher luminosities in comparison to normal outburst. In one model, the thermal-tidal instability (TTI; Osaki 1989), the tidal instability of an elliptical disc is the cause not only of the superhumps but also of the enhanced accretion luminosity, although in another, tidal interactions are merely a consequence of superoutbursts (Cannizzo et al., 2012), Regardless of the which of these interpretations is correct, enhanced luminosity and the presence of superhumps are physically linked in SU UMa type dwarf novae. Thus, the contemporaneous presence of superhumps and short outbursts in HLIPs TV Col and EI UMa is highly suggestive.
4 Conclusions
We have compiled MG of confirmed IPs, and plotted against their orbital period.
-
1.
IPs with orbital periods below 10 hrs are separated into an optically bright subclass (HLIPs), and an optically faint subclass (LLIPs). These subclasses are strongly correlated with the X-ray luminosity-based subclasses originally proposed by Pretorius & Mukai (2014).
-
2.
Low states in LLIPs often are significant events, some being consistent with a complete cessation of accretion. In contrast, low states in HLIPs are often modest fluctuation within the HLIP regime.
-
3.
Of all the outbursts in IPs, short outbursts in HLIPs are the most challenging to interpret. So are the transient superhumps observed in HLIPs TV Col and EI UMa. The contemporaneous detection of short outbursts and superhumps in these systems suggests the possibility that these two share a common physical origin. We propose that searches be conducted for transient positive superhumps in all HLIPs that have shown short outbursts.
Acknowledgments
We fondly remember our friend, mentor, and colleague, Brian Warner, and thank him for intellectual and personal guidance. While his passing leaves a huge hole in our field, his body of work will continue to inform and inspire us for many years to come. We also thank Dr. Ken Shen for stimulating conversations and for his careful reading of a draft version of this paper. We acknowledge with thanks the variable star observations from the AAVSO International Database contributed by observers worldwide and used in this research.
Data Availability
The Gaia data presented in this article are available at ESA Gaia archive (https://gea.esac.esa.int/archive/). The X-ray flux data presented in this article are available at the High Energy Astrophysics Science Archive Research Center (https://heasarc.gsfc.nasa.gov) and the Swift BAT 157-Month Hard X-ray Survey page (https://swift.gsfc.nasa.gov/results/bs157mon/). The Swift BAT light curve data are available at the Swift BAT Hard X-ray Transient Monitor page (https://swift.gsfc.nasa.gov/results/transients/).
References
- Bailer-Jones et al. (2021) Bailer-Jones C. A. L., Rybizki J., Fouesneau M., Demleitner M., Andrae R., 2021, AJ, 161, 147
- Bruch (2022) Bruch A., 2022, MNRAS, 514, 4718
- Buckley et al. (1995) Buckley D. A. H., Sekiguchi K., Motch C., O’Donoghue D., Chen A.-L., Schwarzenberg-Czerny A., Pietsch W., Harrop-Allin M. K., 1995, MNRAS, 275, 1028
- Buckley et al. (1997) Buckley D. A. H., Haberl F., Motch C., Pollard K., Schwarzenberg-Czerny A., Sekiguchi K., 1997, MNRAS, 287, 117
- Butler et al. (2009) Butler S. C., et al., 2009, ApJ, 698, 502
- Cannizzo et al. (2012) Cannizzo J. K., Smale A. P., Wood M. A., Still M. D., Howell S. B., 2012, ApJ, 747, 117
- Chomiuk et al. (2021) Chomiuk L., Metzger B. D., Shen K. J., 2021, ARA&A, 59
- Covington et al. (2022) Covington A. E., et al., 2022, ApJ, 928, 164
- Evans et al. (2009) Evans P. A., Beardmore A. P., Osborne J. P., Wynn G. A., 2009, MNRAS, 399, 1167
- Evans et al. (2020) Evans P. A., et al., 2020, ApJS, 247, 54
- Ezuka & Ishida (1999) Ezuka H., Ishida M., 1999, ApJS, 120, 277
- Gaia Collaboration et al. (2016) Gaia Collaboration et al., 2016, A&A, 595, A1
- Gaia Collaboration et al. (2021) Gaia Collaboration et al., 2021, A&A, 649, A1
- Gänsicke et al. (2005) Gänsicke B. T., et al., 2005, MNRAS, 361, 141
- Garnavich & Szkody (1988) Garnavich P., Szkody P., 1988, PASP, 100, 1522
- Hameury & Lasota (2017) Hameury J. M., Lasota J. P., 2017, A&A, 602, A102
- Hameury et al. (1983) Hameury J. M., Bonazzola S., Heyvaerts J., Lasota J. P., 1983, A&A, 128, 369
- Hameury et al. (2022) Hameury J. M., Lasota J. P., Shaw A. W., 2022, A&A, 664, A7
- Hellier (2001) Hellier C., 2001, Cataclysmic Variable Stars: How and Why They Vary. Praxis Publishing, Chichester, UK
- Hellier et al. (1989) Hellier C., Mason K. O., Smale A. P., Corbet R. H. D., O’Donoghue D., Barrett P. E., Warner B., 1989, MNRAS, 238, 1107
- Hill et al. (2022) Hill K. L., et al., 2022, AJ, 163, 246
- Joshi et al. (2019) Joshi A., Pandey J. C., Singh H. P., 2019, AJ, 158, 11
- Kennedy et al. (2017) Kennedy M. R., Garnavich P. M., Littlefield C., Callanan P., Mukai K., Aadland E., Kotze M. M., Kotze E. J., 2017, MNRAS, 469, 956
- Knigge et al. (2011) Knigge C., Baraffe I., Patterson J., 2011, ApJS, 194, 28
- Kochanek et al. (2017) Kochanek C. S., et al., 2017, PASP, 129, 104502
- Krimm et al. (2013) Krimm H. A., et al., 2013, ApJS, 209, 14
- Lasota (2001) Lasota J.-P., 2001, New Astron. Rev., 45, 449
- Littlefield et al. (2020) Littlefield C., et al., 2020, ApJ, 896, 116
- Littlefield et al. (2022) Littlefield C., Lasota J.-P., Hameury J.-M., Scaringi S., Garnavich P., Szkody P., Kennedy M., Leichty M., 2022, ApJ, 924, L8
- Matsui et al. (2009) Matsui R., et al., 2009, PASJ, 61, 1081
- Mukai (2017) Mukai K., 2017, PASP, 129, 062001
- Mukai et al. (1990) Mukai K., et al., 1990, MNRAS, 245, 385
- Mukai et al. (2003) Mukai K., Still M., Ringwald F. A., 2003, ApJ, 594, 428
- Oh et al. (2018) Oh K., et al., 2018, ApJS, 235, 4
- Osaki (1989) Osaki Y., 1989, PASJ, 41, 1005
- Osaki (2005) Osaki Y., 2005, Proceedings of the Japan Academy, Series B, 81, 291
- Paczynski (1977) Paczynski B., 1977, ApJ, 216, 822
- Patterson (1994) Patterson J., 1994, PASP, 106, 209
- Patterson (2011) Patterson J., 2011, MNRAS, 411, 2695
- Patterson et al. (2005) Patterson J., et al., 2005, PASP, 117, 1204
- Patterson et al. (2017) Patterson J., et al., 2017, MNRAS, 466, 581
- Pretorius & Mukai (2014) Pretorius M. L., Mukai K., 2014, MNRAS, 442, 2580
- Pretorius et al. (2021) Pretorius M. L., et al., 2021, MNRAS, 503, 3692
- Retter et al. (2003) Retter A., Hellier C., Augusteijn T., Naylor T., Bedding T. R., Bembrick C., McCormick J., Velthuis F., 2003, MNRAS, 340, 679
- Ricker et al. (2016) Ricker G. R., et al., 2016, in MacEwen H. A., Fazio G. G., Lystrup M., Batalha N., Siegler N., Tong E. C., eds, Society of Photo-Optical Instrumentation Engineers (SPIE) Conference Series Vol. 9904, Space Telescopes and Instrumentation 2016: Optical, Infrared, and Millimeter Wave. p. 99042B, doi:10.1117/12.2232071
- Riello et al. (2021) Riello M., et al., 2021, A&A, 649, A3
- Saxton et al. (2008) Saxton R. D., Read A. M., Esquej P., Freyberg M. J., Altieri B., Bermejo D., 2008, A&A, 480, 611
- Scaringi et al. (2022a) Scaringi S., Groot P. J., Knigge C., Lasota J. P., de Martino D., Cavecchi Y., Buckley D. A. H., Camisassa M. E., 2022a, MNRAS, 514, L11
- Scaringi et al. (2022b) Scaringi S., et al., 2022b, Nature, 604, 447
- Shappee et al. (2014) Shappee B. J., et al., 2014, ApJ, 788, 48
- Shara et al. (2017) Shara M. M., et al., 2017, Nature, 548, 558
- Shaw et al. (2020) Shaw A. W., et al., 2020, MNRAS, 498, 3457
- Spogli et al. (1998) Spogli C., Fiorucci M., Tosti G., 1998, A&AS, 130, 485
- Thomas & Wood (2015) Thomas D. M., Wood M. A., 2015, ApJ, 803, 55
- Thorstensen (2020) Thorstensen J. R., 2020, AJ, 160, 151
- Thorstensen & Halpern (2013) Thorstensen J. R., Halpern J., 2013, AJ, 146, 107
- Warner (1987) Warner B., 1987, MNRAS, 227, 23
- Webb et al. (2020) Webb N. A., et al., 2020, A&A, 641, A136
- Whitehurst (1988) Whitehurst R., 1988, MNRAS, 232, 35
- Wood et al. (2000) Wood M. A., Montgomery M. M., Simpson J. C., 2000, ApJ, 535, L39
- Woudt et al. (2012) Woudt P. A., et al., 2012, MNRAS, 427, 1004