Is Summary Useful or Not?
An Extrinsic Human Evaluation of Text Summaries on Downstream Tasks
Abstract.
Research on automated text summarization relies heavily on human and automatic evaluation. While recent work on human evaluation mainly adopted intrinsic evaluation methods, judging the generic quality of text summaries, e.g. informativeness and coherence, our work focuses on evaluating the usefulness of text summaries with extrinsic methods. We carefully design three different downstream tasks for extrinsic human evaluation of summaries, i.e., question answering, text classification and text similarity assessment. We carry out experiments using system rankings and user behavior data to evaluate the performance of different summarization models. We find summaries are particularly useful in tasks that rely on an overall judgment of the text, while being less effective for question answering tasks. The results show that summaries generated by fine-tuned models lead to higher consistency in usefulness across all three tasks, as rankings of fine-tuned summarization systems are close across downstream tasks according to the proposed extrinsic metrics. Summaries generated by models in the zero-shot setting, however, are found to be biased towards the text classification and similarity assessment tasks, due to its general and less detailed summary style.
We further evaluate the correlation of 14 intrinsic automatic metrics with human criteria and show that intrinsic automatic metrics perform well in evaluating the usefulness of summaries in the question-answering task, but are less effective in the other two tasks. This highlights the limitations of relying solely on intrinsic automatic metrics in evaluating the performance and usefulness of summaries.
1. Introduction
Automated text summarization is a valuable tool as it allows one to quickly understand the main points of a longer document, by condensing the source text into a more concise version that still conveys the main points. The recent decade has witnessed the rapid development of automated text summarization models. One major challenge for the application of text summarization is how to evaluate whether such summaries generated by models are actually fluent, accurate, and useful.
Text summary evaluation methods can be divided into two categories: using automatic evaluation metrics or human judgments. Automatic evaluation metrics make it possible to evaluate the quality of generated text summaries in a much cheaper and quicker way, and existing popular automatic metrics are intrinsic evaluation metrics as they usually compare generated summaries with reference summaries or source documents to reflect the generic quality of summaries. Since current intrinsic automatic evaluation metrics can sometimes lead to erroneous conclusions (He et al., 2022), however, there is still no perfect substitute for human annotation. Human evaluation is usually used to evaluate the performance of text summarization models more reliably, or used as an oracle to evaluate the reliability of automated evaluation metrics.
There are two types of human evaluation: intrinsic evaluation and extrinsic evaluation. While intrinsic evaluation of text summarization focuses on the requirements of the task per se, e.g. coherence, fluency, and informativeness (Fabbri et al., 2021; Bhandari et al., 2020), extrinsic evaluation, also known as task-based evaluation, assesses the usefulness or helpfulness of text summaries in other tasks (Dorr et al., 2005). It is more objective and spontaneous because it evaluates human performance in a realistic usage scenario and is less demanding on the annotators. (Gillick and Liu, 2010)
The prior works on extrinsic evaluation of summarization models have employed methods such as cross-comprehension tests (Kolluru and Gotoh, 2005), relevance judgment (Dorr et al., 2005), and question answering (Hirao et al., 2001). These studies are dated more than a decade ago. In recent years, neural summarization systems, especially those based on pre-trained language models have made great strides in intrinsic evaluation (Fabbri et al., 2021; Bhandari et al., 2020). However, to the best of our knowledge, no work has investigated the usefulness of these approaches from the perspective of extrinsic evaluation. Furthermore, these studies rely on a single method of extrinsic evaluation or are limited by the small scale of human experiments (Hovy and Lin, 1998). In light of these limitations, our work aims to propose a more comprehensive extrinsic evaluation method and conduct experiments on a larger scale, to systematically evaluate the usefulness of text summarization, including the summarization methods proposed recently. An attempt is also made to construct a trustworthy human-evaluated corpus, including subsets on three downstream tasks.
Based on the proposed evaluation method in this study, we want to investigate the following research questions:
-
•
How useful are text summaries compared to the source articles?
-
•
In which tasks are summaries more useful in general?
-
•
What kind of summaries are more useful than others?
-
•
Which intrinsic automatic metrics for text summarization correlate well with our human judgments?
The contributions of our work are summarized as follows:
-
•
We introduce an extrinsic evaluation framework for systematically assessing the usefulness of text summarization. We also present seven extrinsic metrics in three downstream tasks.
-
•
We annotate and construct a reliable human extrinsic evaluation dataset of 4,000 texts, including 400 source texts, 400 human summaries, and 3,200 summaries generated by eight different text summarization systems.
-
•
We analyze the usefulness of various types of text summaries and discover that they are more useful in the classification task and the similarity assessment task.
-
•
We re-evaluate 14 intrinsic automatic metrics through our proposed criteria and discover that most of them fail to reflect the extrinsic metrics in classification and similarity tasks.
The rest of this paper will be organized as follows: Section 2 introduces related work. Section 3 outlines the research methodology adopted in this study. Section 4 provides some preliminaries, including the datasets, summarization systems, and intrinsic automatic metrics utilized. The experimental setup is described in Section 5. The results of our analysis are presented in Section 6. Finally, significant conclusions are drawn in Section 7.
2. Related Work
2.1. Intrinsic Evaluation for Summarization
Past works that have assessed the quality of summaries through intrinsic evaluation methods can be classified into two main categories: intrinsic automatic metrics and intrinsic human evaluation. Early works evaluate summaries by computing the n-gram word overlap between reference summaries and generated summaries, such as BLEU (Papineni et al., 2002) and ROUGE (Lin, 2004), which have proven to be relatively effective over time. With the development of representation learning, researchers have proposed new intrinsic automatic metrics based on word embeddings, such as Greedy Matching (Rus and Lintean, 2012) and SMS (Clark et al., 2019), which compute the similarity of word embeddings between reference summaries and generated summaries. Additionally, automatic metrics based on question-answering (Scialom et al., 2019) and entailment classification (Kryscinski et al., 2020) have also been proposed. Human evaluation, on the other hand, is considered the gold standard for evaluating generated summaries. The Pyramid method (Nenkova and Passonneau, 2004) serves as a viable framework for human evaluation, which has been further improved into a crowdsourcing method (Shapira et al., 2019).
Previous research has also investigated the relationship between intrinsic automatic metrics and intrinsic human judgments in the field of text summarization. A common approach to conduct meta-evaluation is to have annotators score the quality of summaries by Pyramid method (Bhandari et al., 2020) or on multiple dimensions (Fabbri et al., 2021) such as coherence, consistency, relevance, and fluency, and compute the correlation coefficient between the output scores of automatic evaluation metrics and human judgments. Prior research has shown significant differences in the performance of experts and non-experts in scoring summaries (Gillick and Liu, 2010). Recent work has examined the consistency between intrinsic automatic metrics and human preferences for different types of summaries and found that intrinsic automatic metrics cannot reliably evaluate summaries generated by models in the zero-shot setting. In contrast, our work investigates the correlation between intrinsic automatic metrics and extrinsic human judgments (Goyal et al., 2022).
2.2. Extrinsic Evaluation for Summarization
Previous work has acknowledged the human’s subjectivity in evaluating summaries, and has attempted to alleviate this through the use of cross-comprehension tests (Kolluru and Gotoh, 2005). The usefulness of summaries has also been evaluated through a single extrinsic task, i.e. relevance judgment (Dorr et al., 2005) and question answering (Hirao et al., 2001). While some researchers have proposed a set of tasks to measure the information content of full text and summaries, including a Shannon Game, a Question Game, and a Classification Game, finding that different extrinsic evaluation methods rate summaries differently, the scale of the experiments was too small to draw statistically significant conclusions (Hovy and Lin, 1998). Our work designs three distinct extrinsic evaluation tasks with a larger scale of human judgments and evaluates the summaries generated by the recently proposed summarization approaches.
2.3. Summarization Models
Summarization models can be broadly categorized into two groups: extractive and abstractive. Extractive models directly identify and extract the most important sentences or words from the source text as the summary. Non-neural models, such as graph-based models, fuzzy logic-based models, and latent semantic analysis have been proposed and investigated (Mihalcea and Tarau, 2004; Erkan and Radev, 2004; Suanmali et al., 2009; Kyoomarsi et al., 2008; Ozsoy et al., 2011; Mashechkin et al., 2011). Additionally, researchers have also explored extractive summarization based on neural network models (Nallapati et al., 2017; Verma and Nidhi, 2017; Narayan et al., 2018; Liu, 2019). On the other hand, abstractive models generate a summary text that is not necessarily a direct extraction of the source text. In recent years, abstractive summarization models based on neural networks have been advancing and become dominant in the summarization field. A common paradigm is pre-training and fine-tuning (Liu and Lapata, 2019; Lewis et al., 2019; Zhang et al., 2020). Additionally, some prompt-based approaches have been proposed (Brown et al., 2020; Sanh et al., 2021), enabling summarization models to learn from specific task instructions.
3. Research Methodology
The purpose of this study is to provide a comprehensive assessment of the usefulness of summaries in real-world usage scenarios. Participants are asked to complete three tasks using source articles and summaries, and their performance is measured to determine the usefulness of summaries.
Measures of usefulness In our study, we consider a summary to be useful (or helpful) if it is able to facilitate users to complete a task. A useful summary should help users save time by being shorter than the source text, while also providing them with the important information they need to complete the task. Therefore, to assess the usefulness of the summaries, we decide to compare on two dimensions: time and correctness. Time refers to the amount of time it takes the participant to complete the task using either the source text or the summary. Correctness refers to the accuracy of the participant’s response and is measured using different metrics for each task. A web-based platform is developed and deployed for this study, to automatically record the completion time and submitted answers by participants for each task.
The three downstream tasks that we designed in this study are:
Question answering task: In this task, participants are asked to answer questions based on the information provided in the source text or the summary. To evaluate the participant’s accuracy, we use two commonly used evaluation metrics in QA systems to calculate the overlap between the answers submitted by the participant and the ground true answers. Additionally, we also propose a distinguished metric to reflect on the probability of the participants’ answer attempts. By evaluating their performance in the QA task, we are able to determine the amount of useful information contained in the summary.
Classification task: In this task, participants are asked to select one or more tags based on the article or summary they see. The accuracy of their choices is calculated as a way of determining whether different types of summaries are useful in helping people make an overall judgment about the article.
Similarity assessment task: Participants are presented with a pair of news articles or summaries in this task. They are asked to take into account various factors such as the topic, event field, writing style, tone, etc. of the two articles to make a comprehensive judgment, and then score the similarity of the two articles or summaries on a scale of 1 to 4. By calculating how similar their scores are to the ground truth scores, we can determine how useful the summaries are for similarity judgments.
4. Preliminaries
4.1. Datasets
We use three datasets for different downstream tasks respectively in our study:
CNN/DailyMail (Hermann et al., 2015; Nallapati et al., 2016) is a widely used benchmark for text summarization, which includes a collection of news articles and their corresponding reference summaries that are typically 3-4 sentences in length. This dataset is used for extrinsic evaluation on the question answering task.
New York Times Annotated Corpus (Sandhaus, 2008) contains a set of news articles along with human-written summaries. Each article is also associated with multiple tags or labels. This dataset is used for extrinsic evaluation on the text classification task.
The SemEval-2022 Task 8 dataset (Chen et al., 2022) is a multilingual collection of the URLs of news articles that have been paired and annotated for their similarity level. The dataset includes nearly 1,000 article pairs from 18 different languages. This dataset is used for extrinsic evaluation on the text similarity assessment task.
4.2. Representative Summarization Systems
We need to select a few publicly available systems to generate summaries on the three datasets and then studying the usefulness of the summaries. As neural abstractive summarization methods with pretraining have achieved great success in recent years, we mainly focus on these summarization models. A total of six representative neural models are chosen as the abstractive systems, including:
-
•
BART (Lewis et al., 2019): a sequence-to-sequence model trained as a denoising autoencoder, which is applicable to various natural language generation tasks. It is fine-tuned on CNN/DailyMail.
-
•
Pegasus (Zhang et al., 2020): a model pre-trained with self-supervised gap-sentence-generation objective designed for abstractive summarization. We use the version fine-tuned on CNN/DailyMail.
-
•
BRIO (Liu et al., 2022): a model with a new training paradigm that assigns candidate outputs probability mass according to their quality using contrastive learning. It is also fine-tuned on CNN/DailyMail.
-
•
T5 (Raffel et al., 2020): a text-to-text transfer learning framework that is pre-trained with several unsupervised and supervised objectives, including summarization.
-
•
T0 (Sanh et al., 2021): a prompt-based model, which is fine-tuned on standard summarization datasets including CNN/DailyMail.
- •
We also include two simple extractive systems for comparison:
-
•
Lead-n: Lead-3 is a simple but commonly used summarization baseline that selects the first three sentences of an article as the summary. we modify the Lead-3 setting and refer to it as the Lead-n model. Lead-n selects the first several sentences that are closest to the summary length we set.
-
•
Lexrank(Erkan and Radev, 2004): a graph-based text summarization model that calculates the importance of sentences by determining the cosine similarity between them, and the sentences with highest scores are selected as the summary.
4.3. Intrinsic Automatic Metrics
We employ a set of 14 automatic evaluation metrics to intrinsically assess the summaries. These metrics include n-gram overlap-based measures such as ROUGE-1, ROUGE-2, ROUGE-L (Lin, 2004), BLEU (Papineni et al., 2002), METEOR (Banerjee and Lavie, 2005), CIDEr (Vedantam et al., 2015) and CHRF (Popović, 2017). For metrics based on word embeddings, we report BERTScore (Zhang et al., 2019), MoverScore (Zhao et al., 2019), Rouge-we (Ng and Abrecht, 2015), Embedding average (Landauer and Dumais, 1997), Vector extrema (Forgues et al., 2014), Greedy matching (Rus and Lintean, 2012). Furthermore, we also include a model-based metric SummaQA (Scialom et al., 2019) in our evaluation. All scores are reported in the range of 0-1. These scores will be compared with our extrinsic human evaluation results.
5. Experimental Settings
In this section, we present the construction and annotation of three datasets for use and the design of our user study for extrinsic evaluation. Specifically, we focus on three downstream tasks: question answering (QA), text classification, and text similarity assessment. We then propose extrinsic metrics based on these tasks.
5.1. Data Preparation Process
Processing and annotating datasets. We reprocess and manually annotate three existing datasets for use in our user study. The datasets for the downstream tasks are constructed in the following steps.
For the QA task, we randomly select 100 pairs of source text and reference summary from the CNN/DailyMail test set. We then construct two datasets for the QA task, namely QA-ref and QA-source. For QA-ref, we formulate four questions and their corresponding answers for each reference summary. For QA-source, we read the longer source text, identify the important points within the news, and formulate four questions accordingly. For each question, we search for all corresponding content within the source text as the correct answer. In both datasets, a question may have multiple correct answers.
For the classification task, we randomly sample 100 news articles from the New York Times Annotated Corpus test set and obtain 19 tags. We analyze these tags and identify those that are vague in meaning and difficult to identify from the article, such as ’Front Page’, and those that were redundant and dependent on other tags, such as ’Travel’, ’Theater’, ’Dining and Wine’, and ’Movies’, which always appear alongside ’Art’. We remove these tags and retain a total of 11 tags, at least one for each news article.
For the similarity task, we utilize the Semeval2022 task8 dataset and construct a dataset for use consisting of 100 pairs of news articles, together with reference summaries and corresponding similarity scores through the following steps: First, we randomly crawl 300 pairs of news pages through the corresponding URLs and extract the title, description, and body parts of each article. The next step is data cleaning, where we remove pairs with empty or too short titles/descriptions/bodies and those whose descriptions are directly sourced from the beginning of the source article with incomplete sentences. Then, we splice headlines and descriptions to form summaries. After manual review, we finally retain 100 pairs of news articles for the similarity task, comprising 200 news articles.
Generating summaries of similar length. In order to eliminate any potential bias that may have resulted from variations in text length, we keep the length of summaries within a defined range. This range is determined based on the average length of the human summaries in each task. To achieve this, we employ a two-step process: First, we set a range for the number of tokens generated for abstractive models and a range for the number of sentences generated for extractive models, during the process of generating the summaries with the model. Secondly, all summaries are truncated to the established range. Figure 6a in the appendix shows the length of summaries in the three tasks.
5.2. Web-based Platform for Experiments
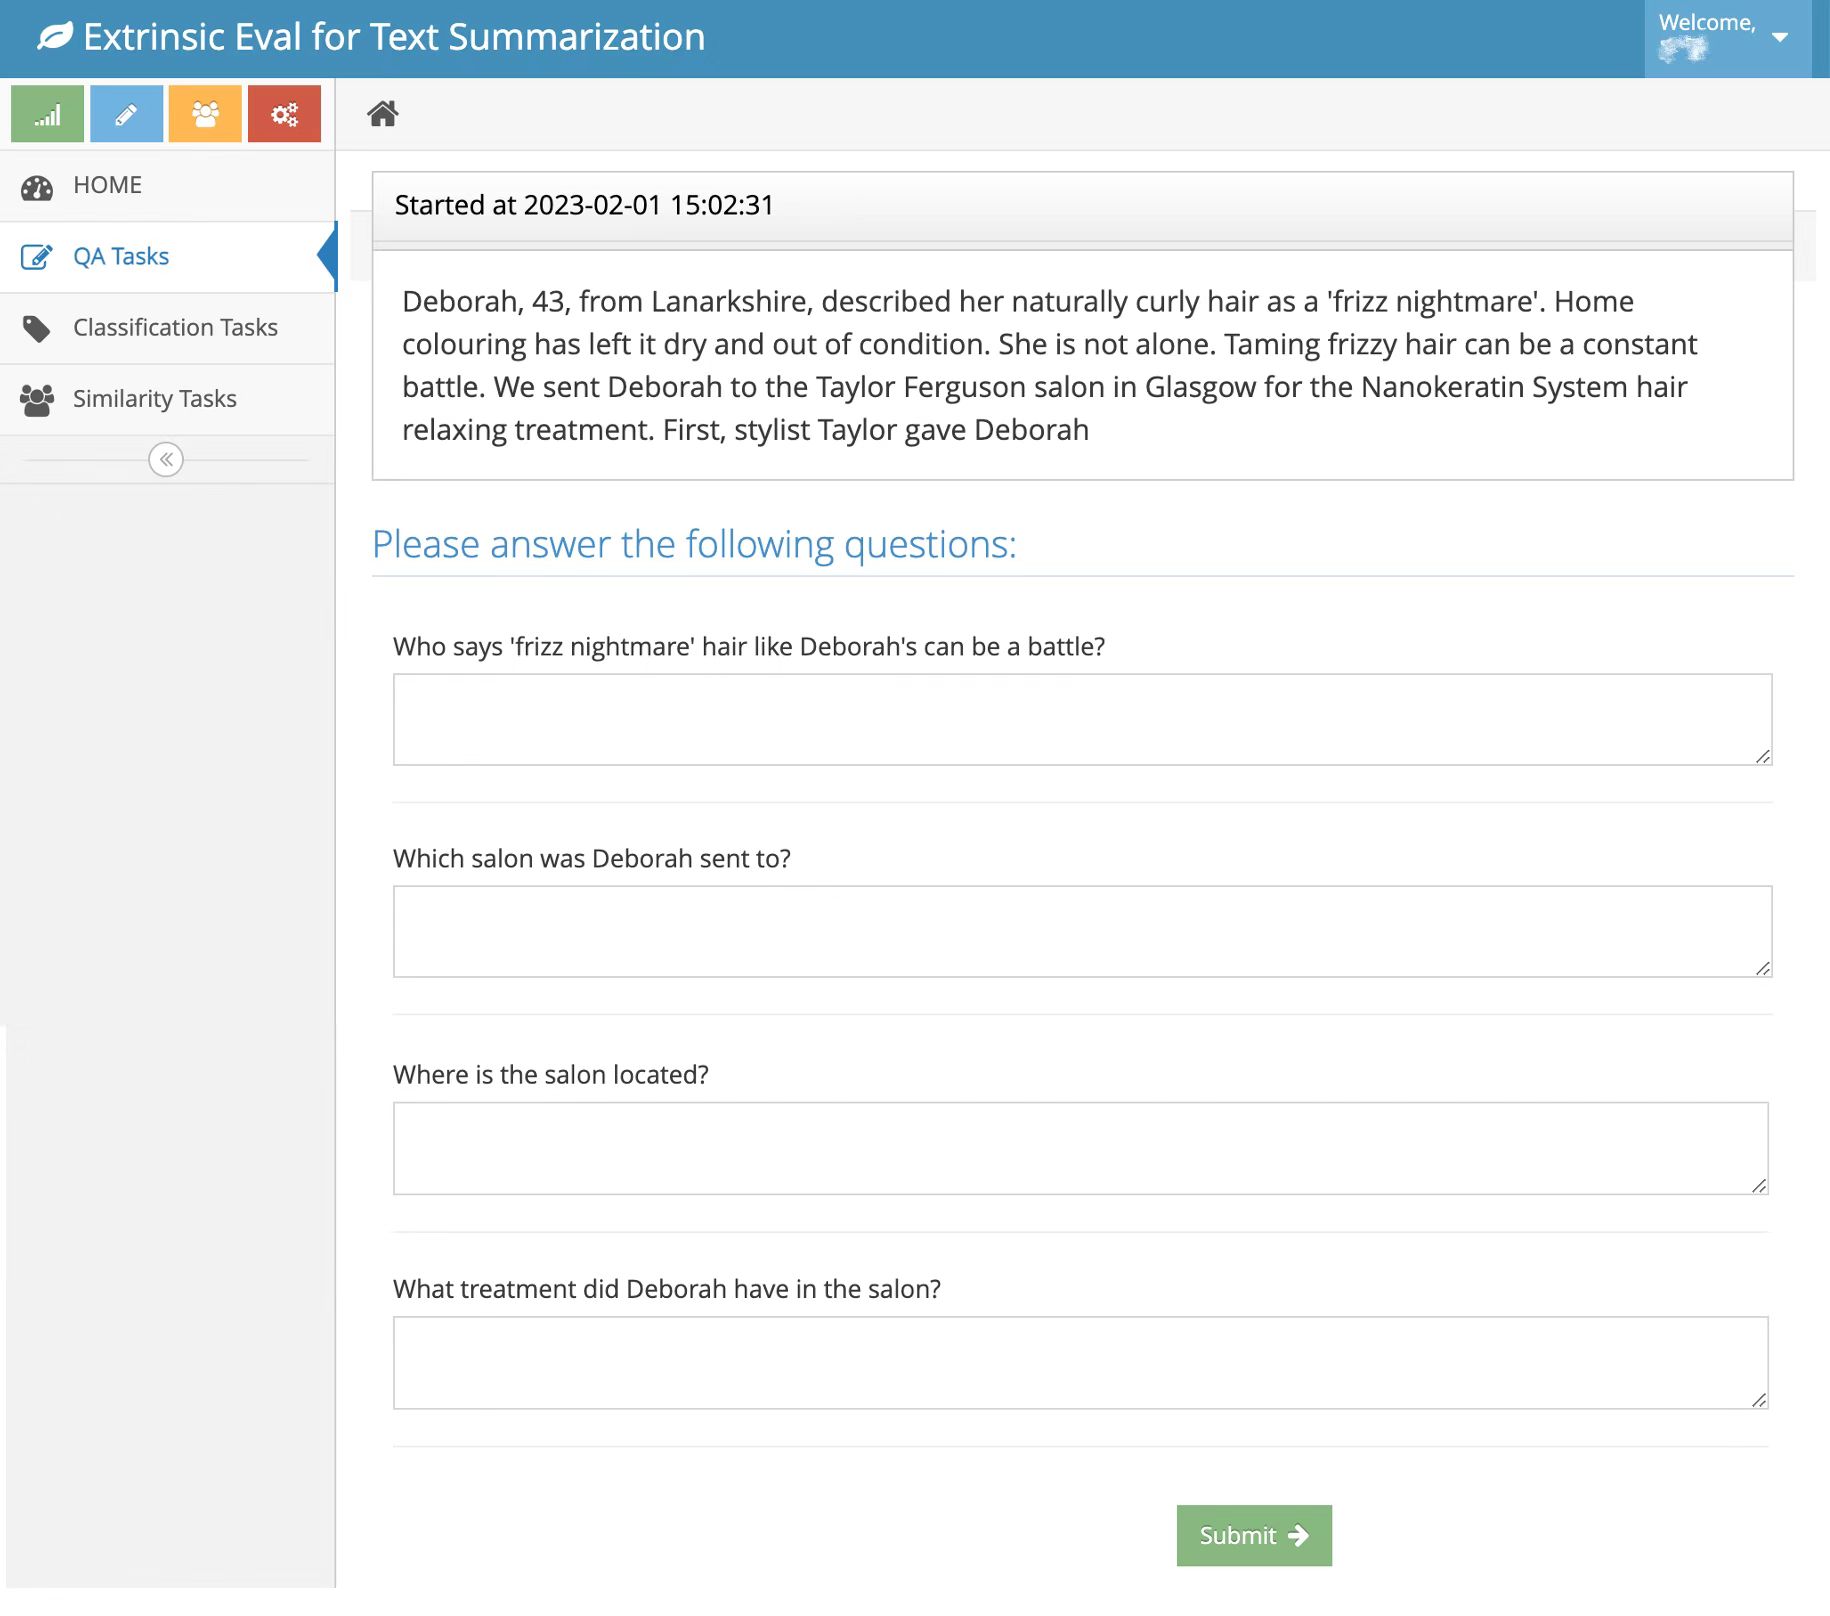
We implement a web-based platform (as shown in Figure 1) to facilitate users’ participation in the tasks and the acquisition of experiment data, which includes responses and completion time for each question. To guarantee impartiality, the platform is designed to prohibit the utilization of the copy-paste/search functionality. Furthermore, the website offers guidance information and exemplar answers to assist participants to fully understand the tasks.
5.3. Experimental Details
We initially recruit ten individuals to participate in the QA-ref, classification and similarity tasks. For the QA-source task, we conduct a separate recruitment process and select another ten individuals. The purpose of this design was to ensure that participants had no prior memory of the text or question content. By having different individuals perform each task, we aim to minimize the influence of previously seen summaries on their responses to the original text questions. In total, we collect 1,000 responses for each task, resulting in a dataset of 10,000 annotations.
To maintain the quality of annotations, all participants are recruited from the university campus, they are all graduate students aged between 22 and 26. All participants had the same native language and are proficient in English as their second language. They have obtained excellent scores in internationally recognized English exams, indicating their suitability for successfully completing the experimental tasks.
To ensure that the participants’ responses are only based on the content of the text currently being viewed and to minimize the influence of individual differences, a method for distributing the texts is devised. The following considerations are taken into account: 1) To prevent people from having an advantage due to prior exposure to a similar text, each person is allowed to see only one text (either source text or summary) from the same source. 2) To ensure fairness and remove the influence of individual differences, each person must be exposed to the same number of texts from each system, regardless of their proficiency level.
The distribution method is as follows: One source text is associated with nine summaries (including reference summary), resulting in ten texts (including source text) originating from the same source text.
First, all summaries are aligned with the source text, then different systems are arranged in the following order: [Source, Human, BART, Pegasus, Lexrank, Lead-n, BRIO, T5, T0, GPT3]. After that, all texts are numbered, with text_id (0-999) as their unique identifier. Therefore, the hundreds place indicates the system corresponding to the text, and the tens place and the individual place indicate the corresponding source text.
The texts are assigned to different participants according to the system it belongs to and the corresponding source text. Each participant is assigned to a user_id and the correspondence between texts and participants is established by the following formula:
5.4. Proposed Extrinsic Metrics
Based on the three downstream tasks, we propose the following extrinsic metrics to evaluate the usefulness of the summaries.
For the QA task, let denote the participant’s answer to the -th question of -th article. All the correct answers to a question are ordered and denote the -th key answer to the -th question of -th article. represents the number of summaries of each system, which equals 100, and represents the number of questions for each article, which equals 4 in this case, and the three metrics are calculated as follows.
-
•
Answerable measures the proportion of questions that can be answered according to the text.
-
•
Exact Match Ratio (EM), which counts the overall accuracy rate of the answers. EM of each system is calculated as:
-
•
F1 is a looser measure of the average overlap between the prediction and ground truth answer. When calculating F1, both and are tokenized into sets of words. F1 is calculated as
| system | QA (ref-based) | QA (source-based) | Classification | Similarity | ||||||||||
|---|---|---|---|---|---|---|---|---|---|---|---|---|---|---|
| answerable | EM | F1 | time(seconds) | answerable | EM | F1 | time(seconds) | EM | F1 | time(seconds) | MSE | time(seconds) | ||
| source | 0.8550 | 0.3225 | 0.5077 | 280.04 | 0.8875 | 0.5050 | 0.6796 | 211.64 | 0.8827 | 0.8951 | 72.97 | 0.9136 | 0.6184 | 37.74 |
| reference | 0.8875 | 0.5400 | 0.7535 | 93.94 | 0.5375 | 0.2725 | 0.3746 | 83.3 | 0.9127 | 0.9156 | 34.37 | 0.7736 | 0.7060 | 19.92 |
| bart | 0.4975 | 0.2400 | 0.3240 | 108.37 | 0.4900 | 0.2325 | 0.3197 | 83.05 | 0.8964 | 0.9015 | 25.43 | 0.9803 | 0.6085 | 21.94 |
| pegasus | 0.5475 | 0.2100 | 0.3222 | 112.55 | 0.5125 | 0.2825 | 0.3662 | 89.66 | 0.8900 | 0.8942 | 29.88 | 0.9836 | 0.6014 | 23.93 |
| lexrank | 0.3625 | 0.0900 | 0.1631 | 111.78 | 0.3775 | 0.1500 | 0.2291 | 92.01 | 0.9000 | 0.9017 | 29.88 | 1.2403 | 0.5323 | 23.77 |
| Lead-n | 0.4175 | 0.1600 | 0.2483 | 110.78 | 0.4775 | 0.2475 | 0.3342 | 84.33 | 0.8773 | 0.8792 | 31.29 | 1.4336 | 0.4536 | 23.42 |
| BRIO | 0.5825 | 0.2350 | 0.3598 | 104.21 | 0.5425 | 0.3075 | 0.4040 | 90.15 | 0.9000 | 0.9036 | 25.9 | 0.7569 | 0.6998 | 21.07 |
| t5 | 0.4400 | 0.1600 | 0.2416 | 106.07 | 0.4375 | 0.2075 | 0.2861 | 86.57 | 0.8791 | 0.8814 | 34.86 | 1.3736 | 0.4699 | 20.17 |
| t0 | 0.5350 | 0.1875 | 0.3003 | 107.21 | 0.5100 | 0.2600 | 0.3530 | 98.6 | 0.8864 | 0.8889 | 28.57 | 0.7669 | 0.7087 | 20.96 |
| gpt3 | 0.4200 | 0.1575 | 0.2338 | 100.02 | 0.4500 | 0.1975 | 0.2855 | 83.74 | 0.9036 | 0.9068 | 29.11 | 0.8469 | 0.6741 | 20.66 |
For the classification task, we use EM and F1, two metrics that are commonly used in multiclass classification tasks.
For the similarity task, we use the following metrics:
-
•
Mean Squared Error (MSE), which indicates the extent to which the participant’s answer deviates from the standard answer.
-
•
Spearman’s , a measure of the correlation between the participant’s judgment and the true similarity. It can only be used for system-level analysis because it cannot be calculated using separate texts.
6. Results and analysis
6.1. Analyzing Our Extrinsic Metrics
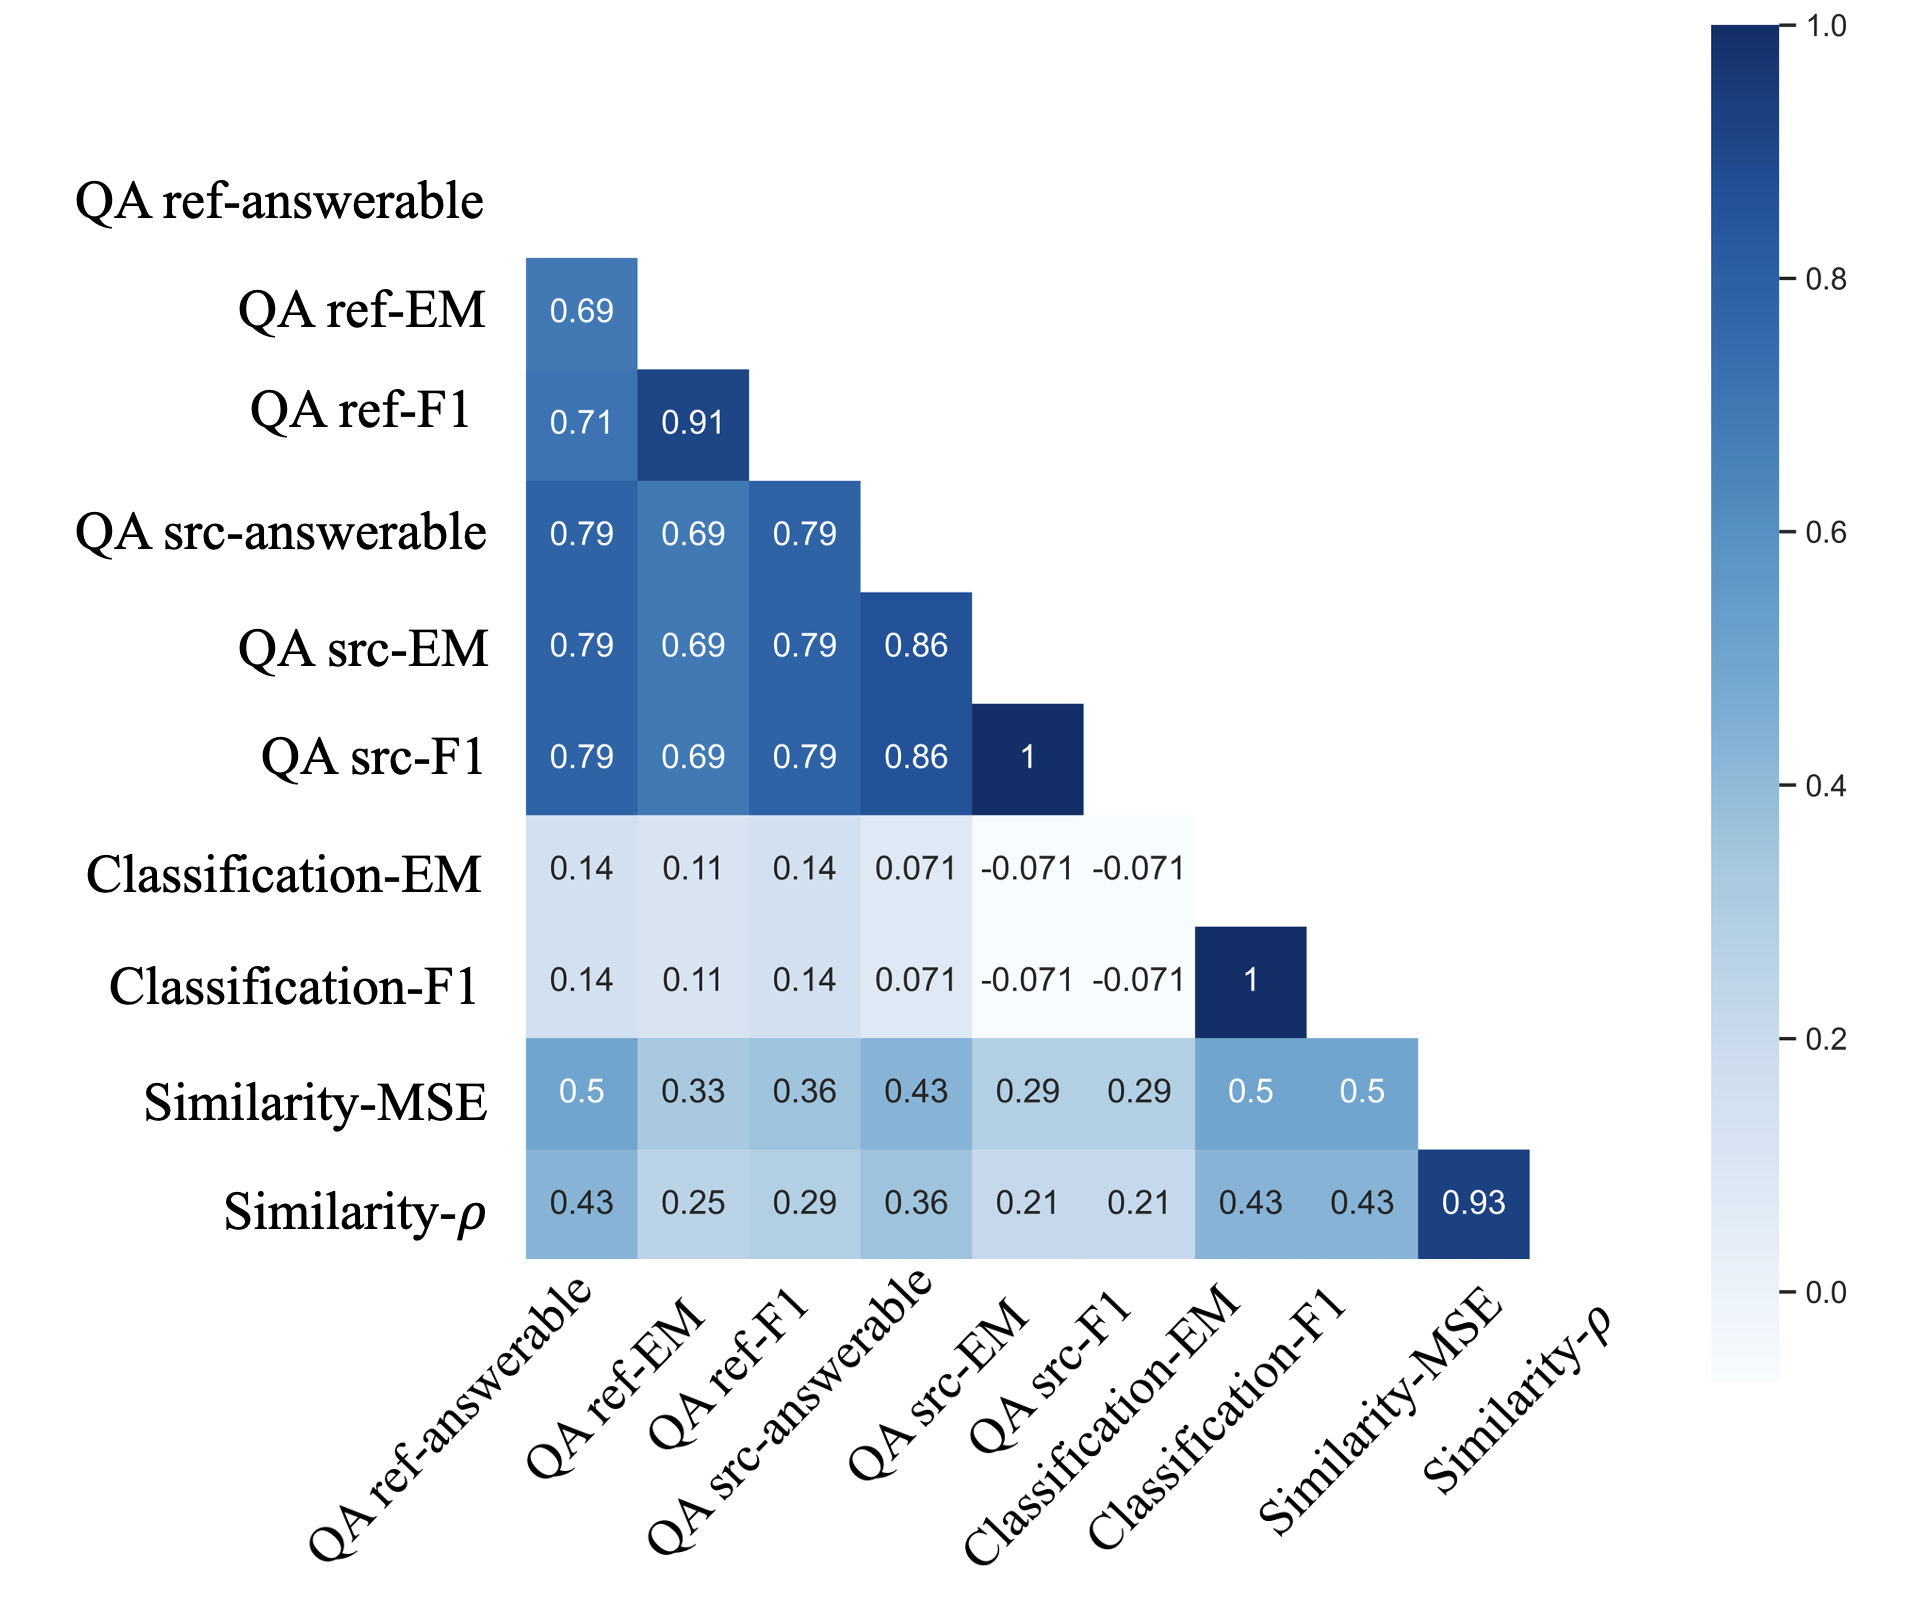
In this section, we study the relationship between our proposed extrinsic metrics. We compute system-level correlations of all the extrinsic metrics (as shown in Figure 2).
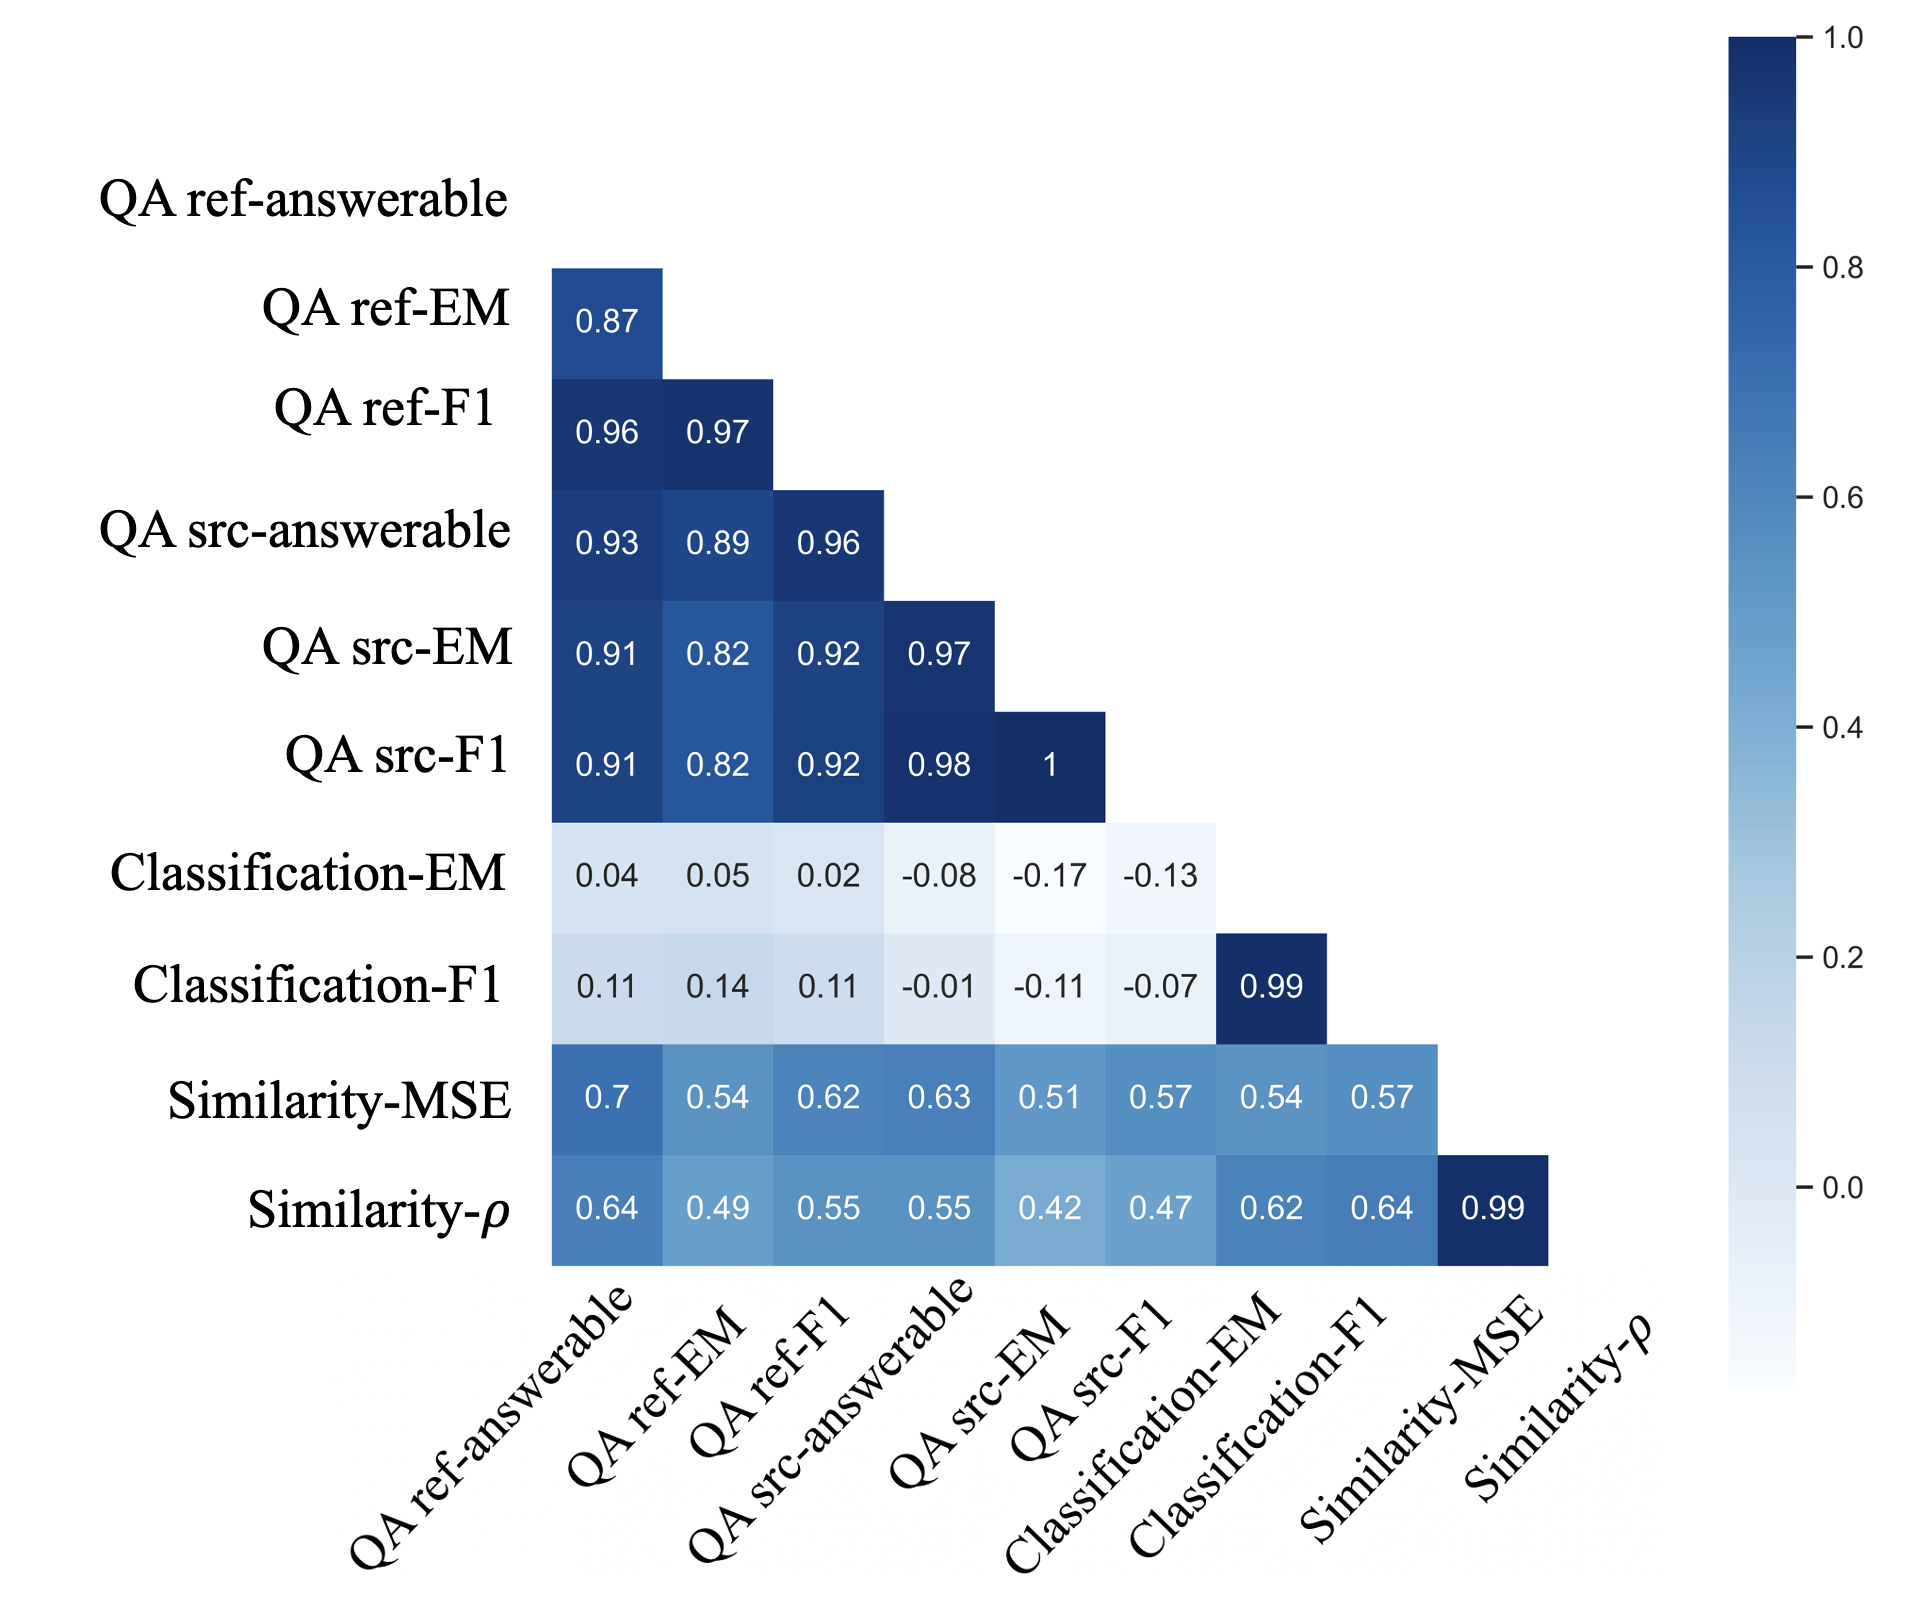
According to the Pearson’s r, extrinsic metrics of the same downstream task are highly correlated, ranging from 0.8 to 1. QA-ref and QA-source are highly correlated at system level, with Pearson’s r above 0.8 and Kendall’s above 0.69. This suggests that there is little difference in the relative performance of the systems on QA-ref and QA-source, although they differ in the way the dataset is constructed. Comparing the metrics of the different downstream tasks, we find that the QA task and the classification task are poorly correlated, with Pearson’s r ranging from -0.2 to 0.2. Whereas the similarity task is moderately correlated with both the other two tasks, with Pearson’s r ranging from 0.4 to 0.7. Overall, moderate to weak correlations illustrate that our experiment involves three tasks of different perspectives to measure the usefulness of the summary.
6.2. Evaluating Usefulness of Summaries
In this section, we compare the performance of different summarization systems by means of the proposed extrinsic evaluation method (as shown in Table 1) and try to answer some questions regarding the usefulness of summaries.
| QA (ref-based) | QA (source-based) | |||||||||||||||
|---|---|---|---|---|---|---|---|---|---|---|---|---|---|---|---|---|
| Answerable | EM | F1 | Time(seconds) | Answerable | EM | F1 | Time(seconds) | |||||||||
| Source | 0.86 | 0.32 | 0.51 | 280 | 0.89 | 0.51 | 0.7 | 212 | ||||||||
| Reference Summaries | 0.89 | +4% | 0.54 | +67% | 0.75 | +48% | 94 | -66% | 0.54 | -39% | 0.27 | -46% | 0.4 | -45% | 88 | -58% |
| All Summaries | 0.52 | -39% | 0.22 | -32% | 0.33 | -36% | 106 | -62% | 0.52 | -41% | 0.24 | -53% | 0.3 | -52% | 83 | -61% |
| Classification | Similarity | ||||||||||||
|---|---|---|---|---|---|---|---|---|---|---|---|---|---|
| EM | F1 | Time(seconds) | MSE | Spearman’s | Time(seconds) | ||||||||
| Source | 0.88 | 0.90 | 73 | 0.91 | 0.6 | 38 | |||||||
| Reference Summaries | 0.91 | +3% | 0.92 | +2% | 34 | -53% | 0.77 | -15% | 0.7 | +14% | 20 | -47% | |
| All Summaries | 0.89 | +1% | 0.90 | - | 30 | -59% | 1.02 | +11% | 0.6 | - | 22 | -42% | |
How useful are text summaries compared to source articles?
Results from three downstream tasks demonstrate that the use of summaries significantly reduces the time required for task completion. Specifically, compared to the source articles, the average time participants spent using summaries to complete QA tasks drops by 61-62% (as shown in Table 2). Similar results can also be observed in the classification and similarity tasks, with the time-saving percentages of 59% and 42%, respectively (as shown in Table 3).
We also find that summaries are particularly useful in classification and similarity tasks. In the QA task, source texts outperform summaries on average, while in the classification and similarity tasks, participants spend less time as well as perform better with summaries. This may be due to the fact that making an overall judgment about the text, such as classification or similarity assessment, does not require as much information as answering specific questions. As a result, the excess information in the long source text may not aid in decision-making and even interfere with human judgments. This is supported by observed people’s tendencies in the classification task, where they tend to assign more tags to longer source articles, potentially leading to a higher recall but lower precision in comparison to the human summaries.
Difference between QA-ref and QA-source In the QA-source task, where questions and answers are constructed from the source text, source articles excel in all three metrics (answerable, EM, and F1). In the QA-ref task, where questions and answers are constructed from the reference summary, although the answerable metric is similar for source articles and reference summaries, in terms of the other two metrics, i.e. EM and F1, reference summaries are approximately 50% better than the source text. This is because the information in the reference summary is only a subset of the source text. Therefore in some cases, although people find some questions in QA-ref answerable by looking at the source text, their answers may be counted as incorrect because they do not appear in the reference summary (even though they may be correct according to the source text).
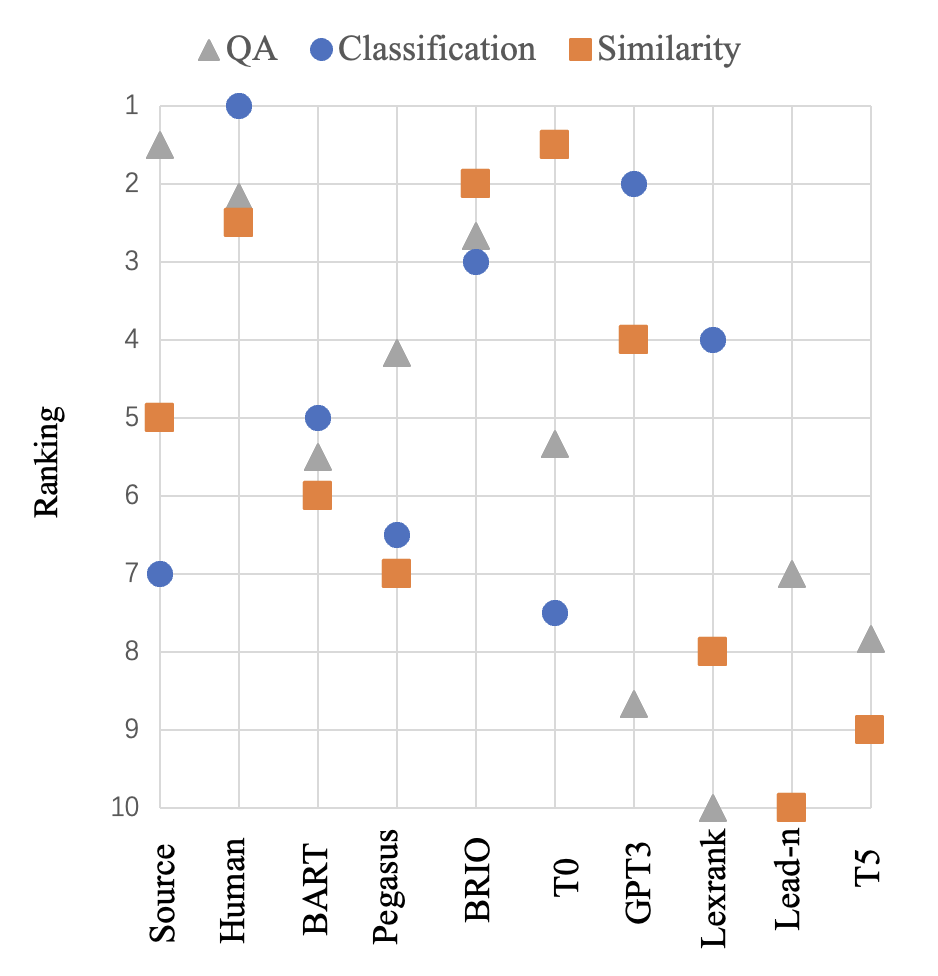
What kind of summaries are more useful? We divide all the automated summaries into three categories based on the model used to generate them: fine-tuned, prompt-based, and simple extractive. A question we want to know is, how stable or consistent is the usefulness level of summaries across different downstream tasks? By analyzing rankings of the source text and summaries in the three tasks, as is shown in Figure 3, we find that: The summaries generated by fine-tuned models have higher consistency in usefulness across different tasks, such as those generated by BART, Pegasus, and BRIO, with a stable ranking similar to that of the human summaries. This suggests that summaries generated by fine-tuned models are insensitive to differences between tasks.The summaries generated by simple extractive models and models in the zero-shot setting exhibit a varying ranking across tasks. For example, both zero-shot GPT3 summaries and simple extractive Lexrank summaries show high or above average rankings in the classification task, medium rankings in the similarity task, and very low rankings in the QA task.
| Source text: | |||||||||
|
|||||||||
| GPT3 summary: | |||||||||
|
|||||||||
| BRIO summary: | |||||||||
|
|||||||||
| T0 summary: | |||||||||
|
|||||||||
| Lexrank summary: | |||||||||
|
| QA (ref-based) | QA (source-based) | Classification | Similarity | |||||||||||||||||
|---|---|---|---|---|---|---|---|---|---|---|---|---|---|---|---|---|---|---|---|---|
| answerable | EM | F1 | answerable | EM | F1 | EM | F1 | MSE | ||||||||||||
| r | r | r | r | r | r | r | r | r | r | |||||||||||
| ROUGE-1 | 0.95** | 0.71* | 0.94** | 0.76** | 0.98** | 0.86** | 0.95** | 0.79** | 0.89** | 0.64* | 0.91** | 0.64* | 0.51 | 0.50 | 0.56 | 0.50 | 0.48 | 0.43 | 0.40 | 0.36 |
| ROUGE-2 | 0.97** | 0.79** | 0.94** | 0.91** | 0.98** | 0.93** | 0.92** | 0.71* | 0.89** | 0.71* | 0.89** | 0.71* | 0.23 | 0.21 | 0.29 | 0.21 | 0.18 | 0.29 | 0.10 | 0.36 |
| ROUGE-L | 0.99** | 0.93** | 0.93** | 0.76** | 0.97** | 0.79** | 0.91** | 0.71* | 0.87** | 0.71* | 0.87** | 0.71* | 0.33 | 0.43 | 0.40 | 0.43 | 0.29 | 0.29 | 0.22 | 0.36 |
| BLEU | 0.89** | 0.64* | 0.88** | 0.84** | 0.92** | 0.93** | 0.85** | 0.71* | 0.83* | 0.71* | 0.83* | 0.71* | 0.21 | 0.21 | 0.28 | 0.21 | -0.01 | 0.14 | -0.08 | 0.21 |
| METEOR | 0.93** | 0.64* | 0.88** | 0.84** | 0.94** | 0.79** | 0.91** | 0.86** | 0.87** | 0.71* | 0.89** | 0.71* | 0.49 | 0.50 | 0.54 | 0.50 | 0.31 | 0.36 | 0.24 | 0.29 |
| CHRF | 0.95** | 0.64* | 0.90** | 0.84** | 0.96** | 0.93** | 0.91** | 0.71* | 0.88** | 0.71* | 0.89** | 0.71* | 0.48 | 0.50 | 0.52 | 0.50 | 0.31 | 0.29 | 0.23 | 0.36 |
| CIDEe | 0.75* | 0.50 | 0.83** | 0.69* | 0.85** | 0.79** | 0.82* | 0.71* | 0.82* | 0.57 | 0.83* | 0.57 | 0.12 | 0.00 | 0.20 | 0.00 | -0.03 | 0.07 | -0.09 | 0.00 |
| BERTScore | 0.94** | 0.71* | 0.87** | 0.62* | 0.93** | 0.71* | 0.89** | 0.93** | 0.85** | 0.79** | 0.86** | 0.79** | 0.54 | 0.43 | 0.59 | 0.43 | 0.54 | 0.43 | 0.48 | 0.36 |
| MOVERScore | 0.97** | 0.79** | 0.93** | 0.69* | 0.97** | 0.79** | 0.93** | 0.86** | 0.87** | 0.71* | 0.88** | 0.71* | 0.55 | 0.50 | 0.60 | 0.50 | 0.46 | 0.43 | 0.39 | 0.36 |
| ROUGE-we | 0.95** | 0.71* | 0.94** | 0.76** | 0.98** | 0.86** | 0.95** | 0.79** | 0.90** | 0.64* | 0.91** | 0.64* | 0.50 | 0.50 | 0.55 | 0.50 | 0.45 | 0.43 | 0.38 | 0.36 |
| EmbeddingAverage | 0.79* | 0.50 | 0.82* | 0.69* | 0.86** | 0.79** | 0.87** | 0.71* | 0.85** | 0.57 | 0.86** | 0.57 | 0.71* | 0.57 | 0.75 | 0.57 | 0.56 | 0.50 | 0.51 | 0.43 |
| VectorExtrema | 0.80* | 0.57 | 0.80* | 0.76** | 0.86** | 0.86** | 0.82* | 0.64* | 0.84** | 0.64* | 0.84** | 0.64* | 0.37 | 0.21 | 0.42 | 0.21 | 0.40 | 0.36 | 0.33 | 0.29 |
| GreedyMatching | 0.89** | 0.64* | 0.80* | 0.69* | 0.88** | 0.79** | 0.85** | 0.71* | 0.85** | 0.71* | 0.86** | 0.71* | 0.60 | 0.50 | 0.64 | 0.50 | 0.43 | 0.50 | 0.36 | 0.43 |
| SummaQA | 0.87** | 0.57 | 0.85** | 0.62* | 0.91** | 0.71* | 0.93** | 0.79** | 0.87** | 0.64* | 0.89** | 0.64* | 0.24 | 0.21 | 0.30 | 0.21 | 0.43 | 0.43 | 0.35 | 0.36 |
We also identify differences in the style of the summaries generated by the different models and a case study in Table 4 illustrates this point. The Summaries generated by fine-tuned models tend to be more informative and specific, including more factual details such as times, places, and numbers. 111It’s important to note that this observation is only based on the summaries fine-tuned on the CNN/DailyMail dataset. Fine-tuning on other datasets may produce different results and therefore cannot be generalized as all summaries generated by fine-tuned models. When referring to summaries generated by fine-tuned models, it should only be understood as those fine-tuned on the CNN/DailyMail dataset.Due to this trait, summaries generated by fine-tuned models are found to be more useful for detail-oriented QA tasks, compared to their counterparts. The top six in all systems except the source text and reference summary are fine-tuned models, including task-specific fine-tuned T0 system. Summaries generated by models in the zero-shot setting are more abstractive and general than that of fine-tuned models, and therefore they are found to be more suitable for tasks that require overall judgment, such as classification and similarity tasks. As is shown in Figure 3, zero-shot GPT3 summaries rank second in the classification task but only second to last in the QA task.
Compared to them, simple extractive summaries are more coarse-grained and less useful. According to the case study, they contain relatively less important information in a limited space. These two models were developed in the early years of natural language processing, and after nearly two decades of advancements in the field, their usefulness has been surpassed by more recent models.
6.3. Evaluating Intrinsic Automatic Metrics
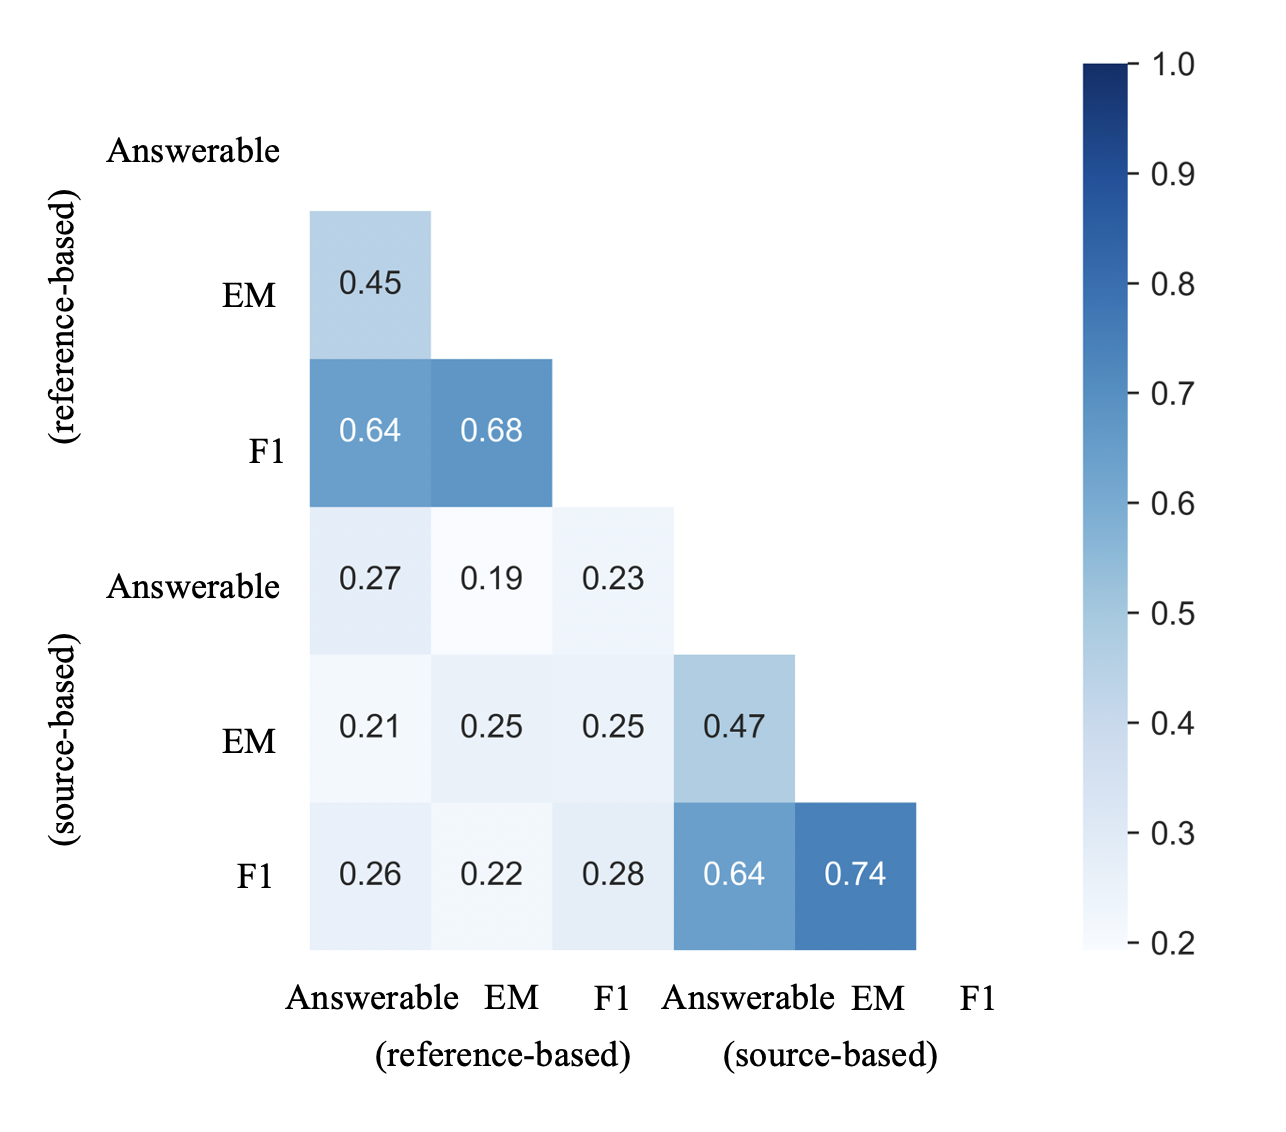
We perform a meta-evaluation using Pearson’s r and Kendall’s to compare various intrinsic automatic metrics with our extrinsic metrics. Summary-level correlation (shown in Figure 4) is shown to be much lower than system-level correlation (shown in Table 5).
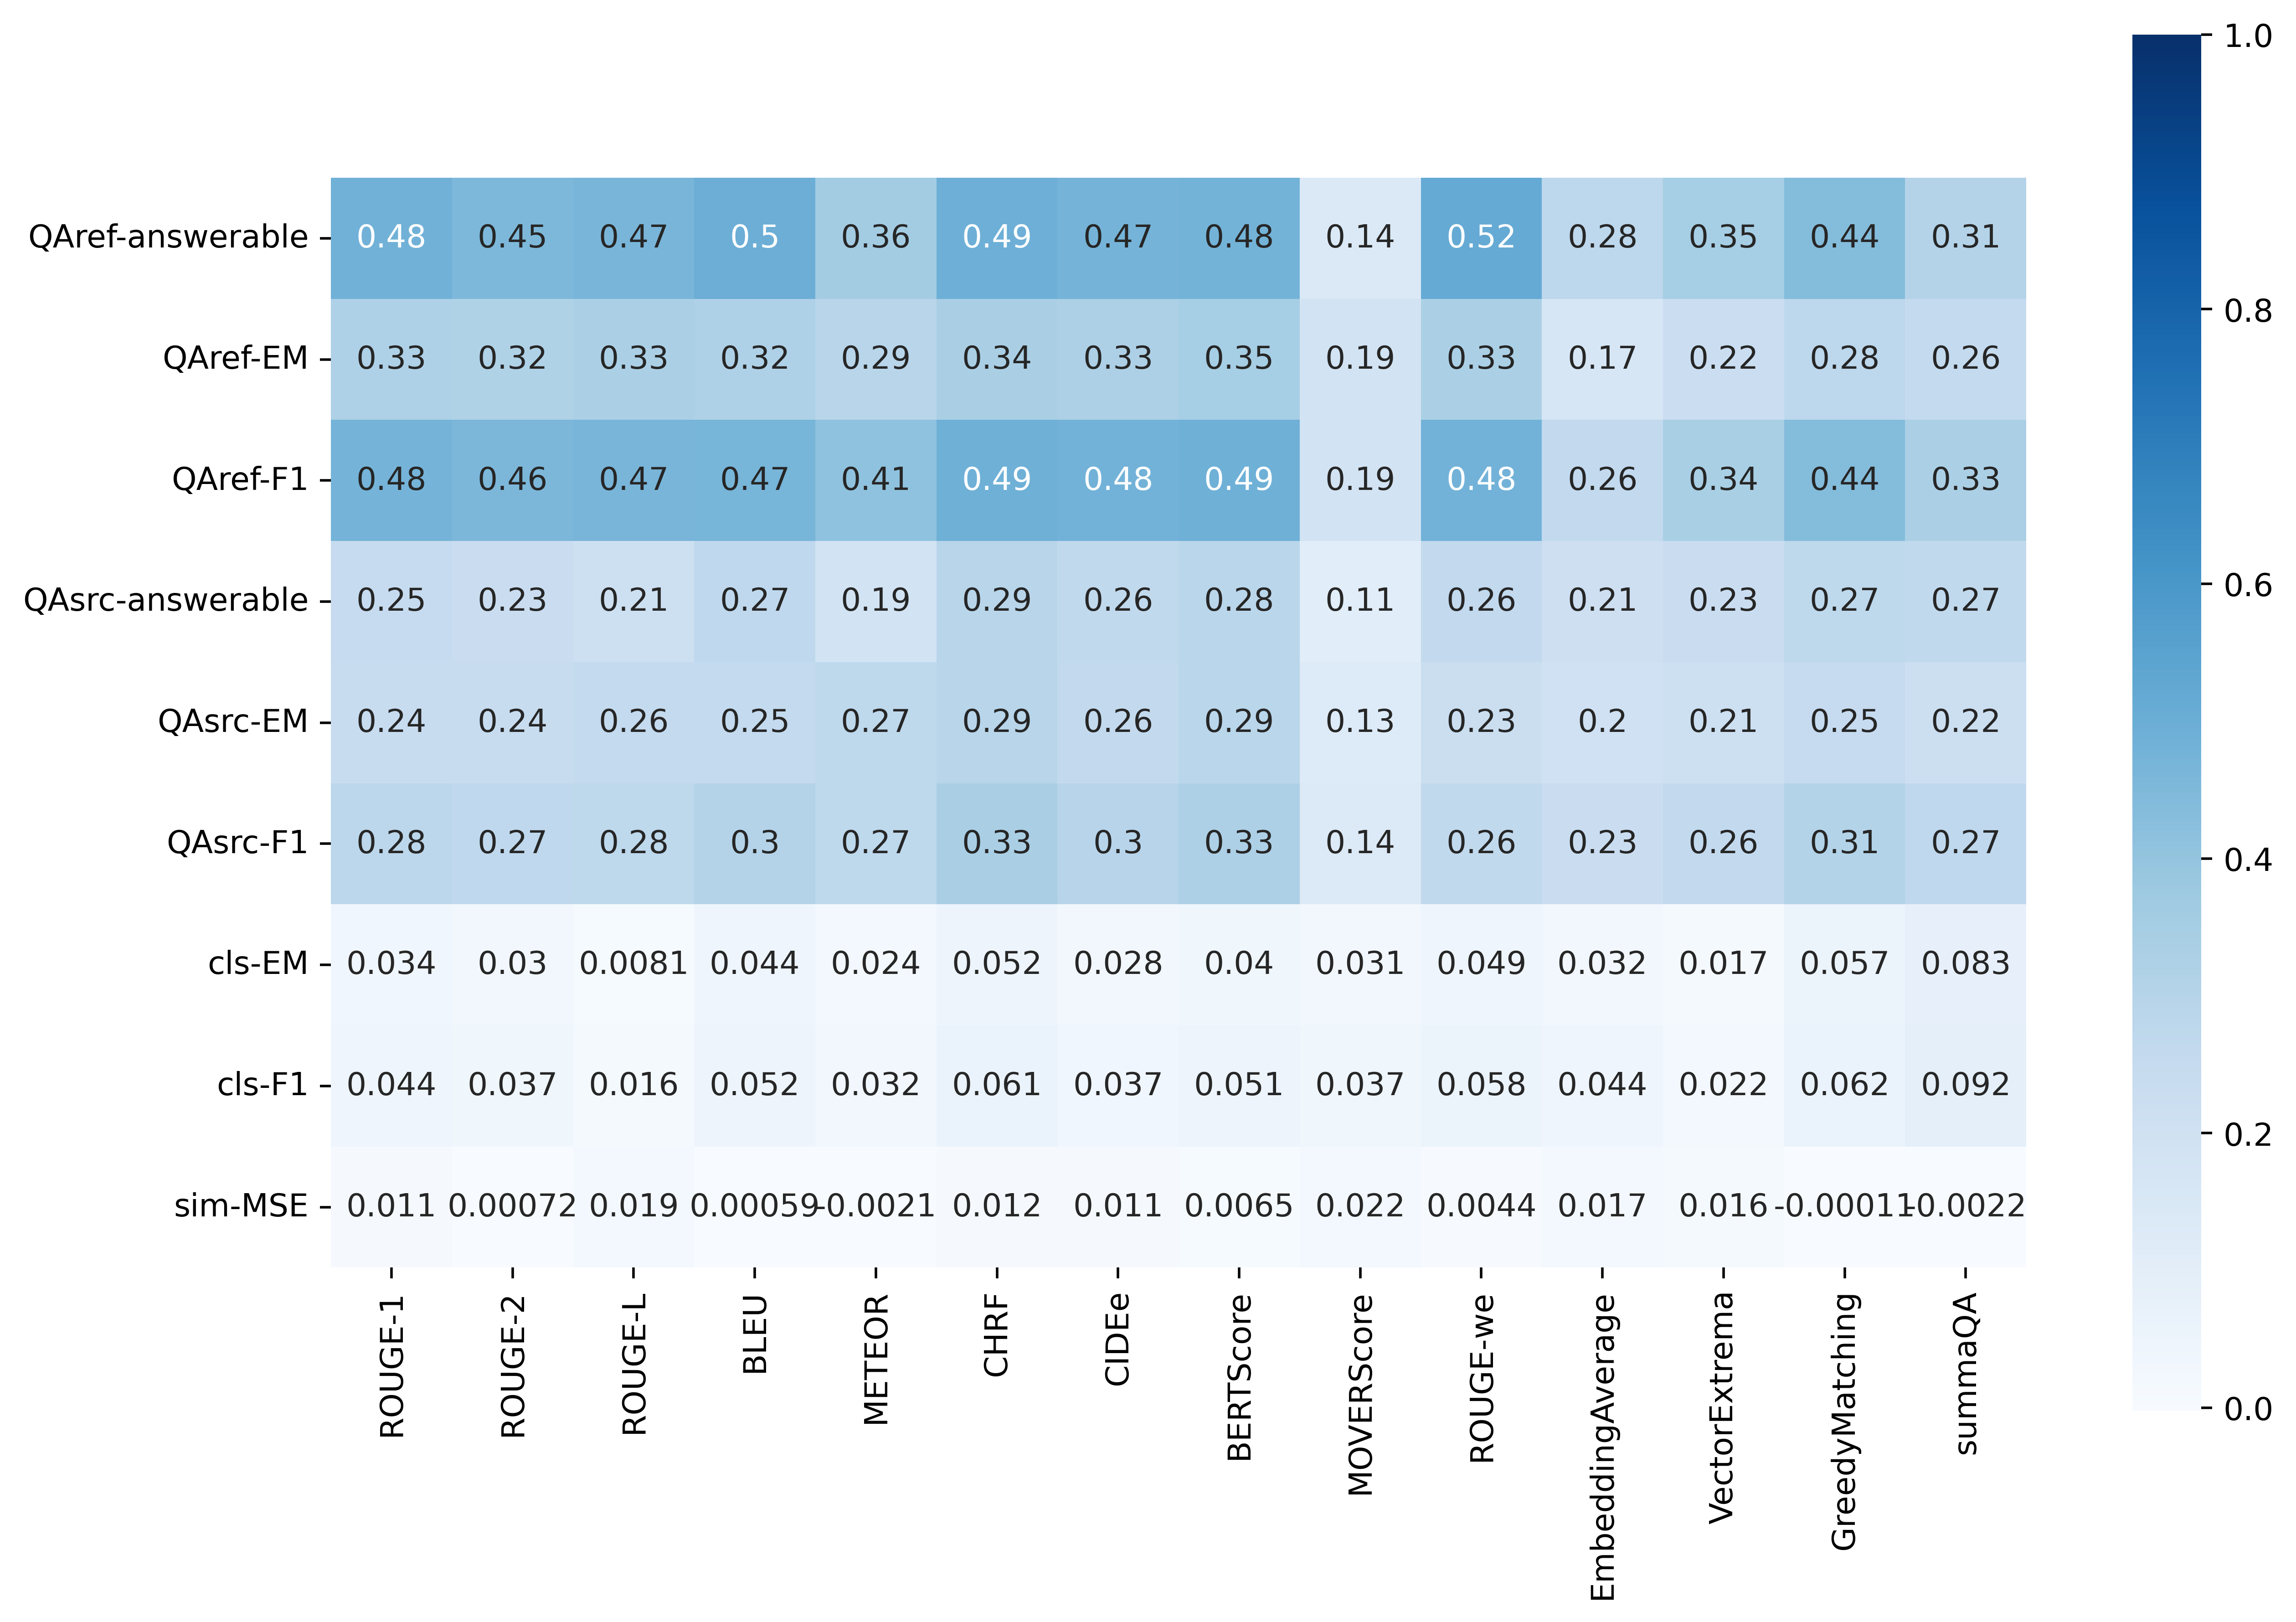
Our analysis reveals that there is a high correlation between extrinsic metrics in the QA task and intrinsic automatic metrics, with Pearson’s r values ranging between 0.7 and 1. Additionally, we find that there is little difference between the performance of different intrinsic automatic metrics, indicating that they are able to evaluate the QA task relatively well.
On the other hand, we observe that extrinsic metrics in classification and similarity tasks have low to moderate correlation with most intrinsic automatic metrics. The Embedding Average metric is found to be strongly correlated with the extrinsic metrics for the classification task (statistically significant at p ¡0.01) and show a moderate correlation for the similarity task. Other word embedding-based metrics such as Greedy Matching, Rouge-we, BERTScore and MOVERScore also show moderate correlation with extrinsic metrics in classification and similarity tasks.
In terms of the best and worst intrinsic automatic metrics, we find that no single metric consistently performs the best across all tasks. However, two intrinsic automatic metrics that are closest to the extrinsic metrics are Rouge-1 (better in the QA task) and Embedding Average (better in the similarity and classification tasks). On the other hand, CIDEr is found to be least correlated with the extrinsic metrics, and show little relevance for the similarity and classification tasks.
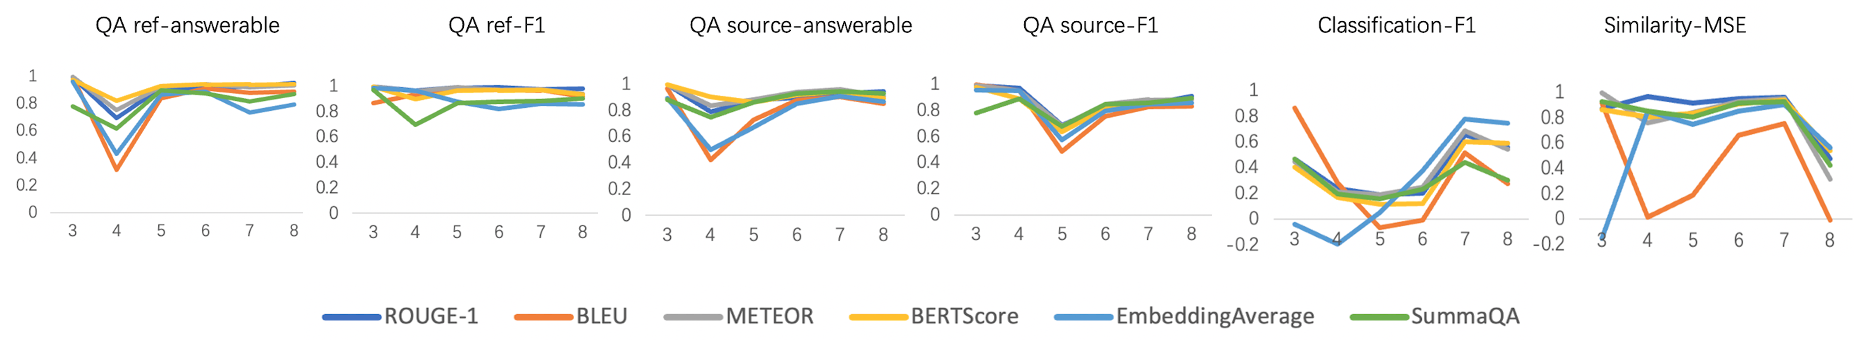
We further evaluate the reliability of intrinsic automatic metrics in quantifying differences between systems with competitive performance,i.e., top- system analysis. As illustrated in Figure 5, systems are ranked based on different extrinsic metrics. We observe that for the QA-ref answerable metric and QA-source F1 and answerable metrics, the correlation between automatic and extrinsic metrics decreases slightly as the number of systems increases from 3, then increases when the number of systems reaches 5. A similar trend is also observed in the plot of the F1 indicator for the classification task, but with more noticeable fluctuations. However, we find a significant decline in the correlation between extrinsic and intrinsic automatic metrics of the similarity task as increased, which suggests that intrinsic automatic metrics should not be used to compare systems with substantial differences in usefulness in this task. While the correlation between the QA-ref answerable metric and intrinsic automatic metrics remains stable at a high level even as changed, we find that most intrinsic automatic metrics may not consistently and reliably quantify differences of usefulness between systems.
7. Conclusions
In this work, we conduct a user study for extrinsic evaluation of the usefulness of text summaries in different downstream tasks. Our key findings are as follows:
-
(1)
The usefulness of summaries is demonstrated through the dual factors of time-saving and performance. While summaries notably decrease task completion time, they may also lead to a decrease in task performance in some cases. However, the overall benefit of summaries is still apparent when considering the balance between time saved and reduction in accuracy.
-
(2)
Summaries are particularly useful for classification and similarity tasks while being less effective for question answering tasks. This is because classification and similarity tasks rely on overall judgments of the text and do not require as much detailed information as question answering.
-
(3)
Summaries generated by fine-tuned models exhibit consistent utility across various tasks, as they are insensitive to task differences and have a stable ranking that resembles human summaries. Conversely, zero-shot and simple extractive summaries demonstrate varying rankings across tasks.
-
(4)
Summaries generated by fine-tuned models tend to perform better on QA tasks, while summaries generated by models in the zero-shot setting are more suitable for classification and similarity tasks. This is due to the fact that summaries generated by fine-tuned models are extractive and specific, including details such as times, places, and numbers, while summaries generated by models in the zero-shot setting are more general.
-
(5)
Intrinsic automatic metrics are suitable for assessing usefulness of summaries in QA tasks, but their utility may be limited when it comes to tasks where people are required to make an overall judgment about the text, such as classification and similarity tasks.
Appendix A Length of summaries from different systems
The length of the summary can affect the information contained in the text. Therefore, in order to ensure fairness in comparing summaries across different systems, we set a range for the number of words in the generated summary based on the length of the reference summary, so that as shown in figure 6a, the summaries of all systems fall within a similar length interval.
(
a) Question answering task
![[Uncaptioned image]](/html/2305.15044/assets/figures/qa_len.png)
b) Classification task
![[Uncaptioned image]](/html/2305.15044/assets/figures/cls_len.png)
) Similarity assessment task
![[Uncaptioned image]](/html/2305.15044/assets/figures/sim_len.png)
(
c
Appendix B Correlation between extrinsic metrics
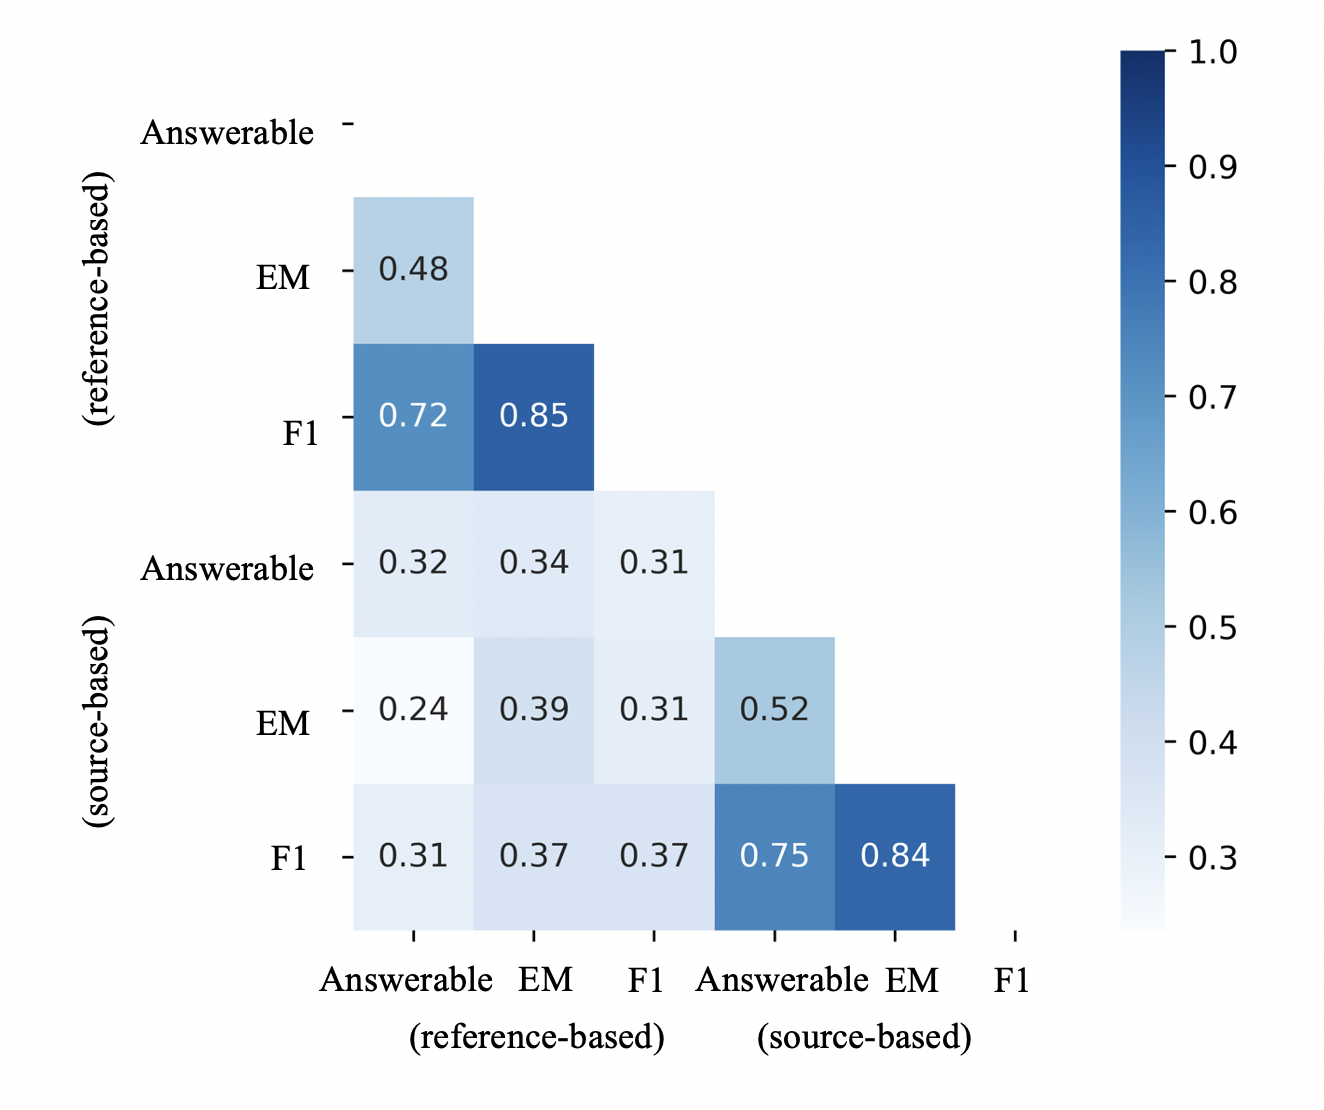
Here we report summary-level correlations between proposed extrinsic metrics with Kendall’s and Pearson’s r (shown in Figure 8) and summary-level correlations between proposed extrinsic metrics with Pearson’s r (shown in Figure 7).
References
- (1)
- Banerjee and Lavie (2005) Satanjeev Banerjee and Alon Lavie. 2005. METEOR: An automatic metric for MT evaluation with improved correlation with human judgments. In Proceedings of the acl workshop on intrinsic and extrinsic evaluation measures for machine translation and/or summarization. 65–72.
- Bhandari et al. (2020) Manik Bhandari, Pranav Gour, Atabak Ashfaq, Pengfei Liu, and Graham Neubig. 2020. Re-evaluating evaluation in text summarization. arXiv preprint arXiv:2010.07100 (2020).
- Brown et al. (2020) Tom Brown, Benjamin Mann, Nick Ryder, Melanie Subbiah, Jared D Kaplan, Prafulla Dhariwal, Arvind Neelakantan, Pranav Shyam, Girish Sastry, Amanda Askell, et al. 2020. Language models are few-shot learners. Advances in neural information processing systems 33 (2020), 1877–1901.
- Chen et al. (2022) Xi Chen, Ali Zeynali, Chico Camargo, Fabian Flöck, Devin Gaffney, Przemyslaw Grabowicz, Scott Hale, David Jurgens, and Mattia Samory. 2022. SemEval-2022 Task 8: Multilingual news article similarity. In Proceedings of the 16th International Workshop on Semantic Evaluation (SemEval-2022). Association for Computational Linguistics, Seattle, United States, 1094–1106. https://doi.org/10.18653/v1/2022.semeval-1.155
- Clark et al. (2019) Elizabeth Clark, Asli Celikyilmaz, and Noah A Smith. 2019. Sentence mover’s similarity: Automatic evaluation for multi-sentence texts. In Proceedings of the 57th Annual Meeting of the Association for Computational Linguistics. 2748–2760.
- Dorr et al. (2005) Bonnie Dorr, Christof Monz, Richard Schwartz, and David Zajic. 2005. A methodology for extrinsic evaluation of text summarization: does ROUGE correlate?. In Proceedings of the ACL Workshop on Intrinsic and Extrinsic Evaluation Measures for Machine Translation and/or Summarization. 1–8.
- Erkan and Radev (2004) Günes Erkan and Dragomir R Radev. 2004. Lexrank: Graph-based lexical centrality as salience in text summarization. Journal of artificial intelligence research 22 (2004), 457–479.
- Fabbri et al. (2021) Alexander R Fabbri, Wojciech Kryściński, Bryan McCann, Caiming Xiong, Richard Socher, and Dragomir Radev. 2021. Summeval: Re-evaluating summarization evaluation. Transactions of the Association for Computational Linguistics 9 (2021), 391–409.
- Forgues et al. (2014) Gabriel Forgues, Joelle Pineau, Jean-Marie Larchevêque, and Réal Tremblay. 2014. Bootstrapping dialog systems with word embeddings. In Nips, modern machine learning and natural language processing workshop, Vol. 2. 168.
- Gillick and Liu (2010) Dan Gillick and Yang Liu. 2010. Non-expert evaluation of summarization systems is risky. In Proceedings of the NAACL HLT 2010 Workshop on Creating Speech and Language Data with Amazon’s Mechanical Turk. 148–151.
- Goyal et al. (2022) Tanya Goyal, Junyi Jessy Li, and Greg Durrett. 2022. News summarization and evaluation in the era of gpt-3. arXiv preprint arXiv:2209.12356 (2022).
- He et al. (2022) Tianxing He, Jingyu Zhang, Tianle Wang, Sachin Kumar, Kyunghyun Cho, James Glass, and Yulia Tsvetkov. 2022. On the Blind Spots of Model-Based Evaluation Metrics for Text Generation. arXiv preprint arXiv:2212.10020 (2022).
- Hermann et al. (2015) Karl Moritz Hermann, Tomas Kocisky, Edward Grefenstette, Lasse Espeholt, Will Kay, Mustafa Suleyman, and Phil Blunsom. 2015. Teaching machines to read and comprehend. Advances in neural information processing systems 28 (2015).
- Hirao et al. (2001) Tsutomu Hirao, Yutaka Sasaki, and Hideki Isozaki. 2001. An extrinsic evaluation for question-biased text summarization on QA tasks. In Proc. of the NAACL 2001 Workshop on Automatic Summarization. 61–68.
- Hovy and Lin (1998) Eduard Hovy and Chin-Yew Lin. 1998. Automated text summarization and the SUMMARIST system. Technical Report. UNIVERSITY OF SOUTHERN CALIFORNIA MARINA DEL REY INFORMATION SCIENCES INST.
- Kolluru and Gotoh (2005) BalaKrishna Kolluru and Yoshihiko Gotoh. 2005. On the Subjectivity of Human Authored Summaries. In Proceedings of the ACL Workshop on Intrinsic and Extrinsic Evaluation Measures for Machine Translation and/or Summarization. 9–16.
- Kryscinski et al. (2020) Wojciech Kryscinski, Bryan McCann, Caiming Xiong, and Richard Socher. 2020. Evaluating the Factual Consistency of Abstractive Text Summarization. In Proceedings of the 2020 Conference on Empirical Methods in Natural Language Processing (EMNLP). Association for Computational Linguistics, Online, 9332–9346. https://doi.org/10.18653/v1/2020.emnlp-main.750
- Kyoomarsi et al. (2008) Farshad Kyoomarsi, Hamid Khosravi, Esfandiar Eslami, Pooya Khosravyan Dehkordy, and Asghar Tajoddin. 2008. Optimizing text summarization based on fuzzy logic. In Seventh IEEE/ACIS International Conference on Computer and Information Science (icis 2008). IEEE, 347–352.
- Landauer and Dumais (1997) Thomas K Landauer and Susan T Dumais. 1997. A solution to Plato’s problem: The latent semantic analysis theory of acquisition, induction, and representation of knowledge. Psychological review 104, 2 (1997), 211.
- Lewis et al. (2019) Mike Lewis, Yinhan Liu, Naman Goyal, Marjan Ghazvininejad, Abdelrahman Mohamed, Omer Levy, Ves Stoyanov, and Luke Zettlemoyer. 2019. Bart: Denoising sequence-to-sequence pre-training for natural language generation, translation, and comprehension. arXiv preprint arXiv:1910.13461 (2019).
- Lin (2004) Chin-Yew Lin. 2004. Rouge: A package for automatic evaluation of summaries. In Text summarization branches out. 74–81.
- Liu (2019) Yang Liu. 2019. Fine-tune BERT for extractive summarization. arXiv preprint arXiv:1903.10318 (2019).
- Liu and Lapata (2019) Yang Liu and Mirella Lapata. 2019. Text Summarization with Pretrained Encoders. In Proceedings of the 2019 Conference on Empirical Methods in Natural Language Processing and the 9th International Joint Conference on Natural Language Processing (EMNLP-IJCNLP). Association for Computational Linguistics, Hong Kong, China, 3730–3740. https://doi.org/10.18653/v1/D19-1387
- Liu et al. (2022) Yixin Liu, Pengfei Liu, Dragomir Radev, and Graham Neubig. 2022. BRIO: Bringing order to abstractive summarization. arXiv preprint arXiv:2203.16804 (2022).
- Mashechkin et al. (2011) Igor V Mashechkin, MI Petrovskiy, DS Popov, and Dmitry V Tsarev. 2011. Automatic text summarization using latent semantic analysis. Programming and Computer Software 37 (2011), 299–305.
- Mihalcea and Tarau (2004) Rada Mihalcea and Paul Tarau. 2004. Textrank: Bringing order into text. In Proceedings of the 2004 conference on empirical methods in natural language processing. 404–411.
- Nallapati et al. (2017) Ramesh Nallapati, Feifei Zhai, and Bowen Zhou. 2017. Summarunner: A recurrent neural network based sequence model for extractive summarization of documents. In Proceedings of the AAAI conference on artificial intelligence, Vol. 31.
- Nallapati et al. (2016) Ramesh Nallapati, Bowen Zhou, Caglar Gulcehre, Bing Xiang, et al. 2016. Abstractive text summarization using sequence-to-sequence rnns and beyond. arXiv preprint arXiv:1602.06023 (2016).
- Narayan et al. (2018) Shashi Narayan, Shay B Cohen, and Mirella Lapata. 2018. Ranking sentences for extractive summarization with reinforcement learning. arXiv preprint arXiv:1802.08636 (2018).
- Nenkova and Passonneau (2004) Ani Nenkova and Rebecca J Passonneau. 2004. Evaluating content selection in summarization: The pyramid method. In Proceedings of the human language technology conference of the north american chapter of the association for computational linguistics: Hlt-naacl 2004. 145–152.
- Ng and Abrecht (2015) Jun-Ping Ng and Viktoria Abrecht. 2015. Better summarization evaluation with word embeddings for ROUGE. arXiv preprint arXiv:1508.06034 (2015).
- Ouyang et al. (2022) Long Ouyang, Jeff Wu, Xu Jiang, Diogo Almeida, Carroll L. Wainwright, Pamela Mishkin, Chong Zhang, Sandhini Agarwal, Katarina Slama, Alex Ray, John Schulman, Jacob Hilton, Fraser Kelton, Luke Miller, Maddie Simens, Amanda Askell, Peter Welinder, Paul Christiano, Jan Leike, and Ryan Lowe. 2022. Training language models to follow instructions with human feedback. (2022).
- Ozsoy et al. (2011) Makbule Gulcin Ozsoy, Ferda Nur Alpaslan, and Ilyas Cicekli. 2011. Text summarization using latent semantic analysis. Journal of Information Science 37, 4 (2011), 405–417.
- Papineni et al. (2002) Kishore Papineni, Salim Roukos, Todd Ward, and Wei-Jing Zhu. 2002. Bleu: a method for automatic evaluation of machine translation. In Proceedings of the 40th annual meeting of the Association for Computational Linguistics. 311–318.
- Popović (2017) Maja Popović. 2017. chrF++: words helping character n-grams. In Proceedings of the Second Conference on Machine Translation. Association for Computational Linguistics, Copenhagen, Denmark, 612–618. https://doi.org/10.18653/v1/W17-4770
- Raffel et al. (2020) Colin Raffel, Noam Shazeer, Adam Roberts, Katherine Lee, Sharan Narang, Michael Matena, Yanqi Zhou, Wei Li, and Peter J Liu. 2020. Exploring the limits of transfer learning with a unified text-to-text transformer. The Journal of Machine Learning Research 21, 1 (2020), 5485–5551.
- Rus and Lintean (2012) Vasile Rus and Mihai Lintean. 2012. A Comparison of Greedy and Optimal Assessment of Natural Language Student Input Using Word-to-Word Similarity Metrics. In Proceedings of the Seventh Workshop on Building Educational Applications Using NLP. Association for Computational Linguistics, Montréal, Canada, 157–162. https://aclanthology.org/W12-2018
- Sandhaus (2008) Evan Sandhaus. 2008. The New York Times Annotated Corpus. (2008). https://doi.org/10.35111/77ba-9x74
- Sanh et al. (2021) Victor Sanh, Albert Webson, Colin Raffel, Stephen H Bach, Lintang Sutawika, Zaid Alyafeai, Antoine Chaffin, Arnaud Stiegler, Teven Le Scao, Arun Raja, et al. 2021. Multitask prompted training enables zero-shot task generalization. arXiv preprint arXiv:2110.08207 (2021).
- Scialom et al. (2019) Thomas Scialom, Sylvain Lamprier, Benjamin Piwowarski, and Jacopo Staiano. 2019. Answers unite! unsupervised metrics for reinforced summarization models. arXiv preprint arXiv:1909.01610 (2019).
- Shapira et al. (2019) Ori Shapira, David Gabay, Yang Gao, Hadar Ronen, Ramakanth Pasunuru, Mohit Bansal, Yael Amsterdamer, and Ido Dagan. 2019. Crowdsourcing lightweight pyramids for manual summary evaluation. arXiv preprint arXiv:1904.05929 (2019).
- Suanmali et al. (2009) Ladda Suanmali, Mohammed Salem Binwahlan, and Naomie Salim. 2009. Sentence features fusion for text summarization using fuzzy logic. In 2009 Ninth International Conference on Hybrid Intelligent Systems, Vol. 1. IEEE, 142–146.
- Vedantam et al. (2015) Ramakrishna Vedantam, C Lawrence Zitnick, and Devi Parikh. 2015. Cider: Consensus-based image description evaluation. In Proceedings of the IEEE conference on computer vision and pattern recognition. 4566–4575.
- Verma and Nidhi (2017) Sukriti Verma and Vagisha Nidhi. 2017. Extractive summarization using deep learning. arXiv preprint arXiv:1708.04439 (2017).
- Zhang et al. (2020) Jingqing Zhang, Yao Zhao, Mohammad Saleh, and Peter Liu. 2020. Pegasus: Pre-training with extracted gap-sentences for abstractive summarization. In International Conference on Machine Learning. PMLR, 11328–11339.
- Zhang et al. (2019) Tianyi Zhang, Varsha Kishore, Felix Wu, Kilian Q Weinberger, and Yoav Artzi. 2019. Bertscore: Evaluating text generation with bert. arXiv preprint arXiv:1904.09675 (2019).
- Zhao et al. (2019) Wei Zhao, Maxime Peyrard, Fei Liu, Yang Gao, Christian M Meyer, and Steffen Eger. 2019. MoverScore: Text generation evaluating with contextualized embeddings and earth mover distance. arXiv preprint arXiv:1909.02622 (2019).