Detecting Multidimensional Political Incivility on Social Media
Abstract
The rise of social media has been argued to intensify uncivil and hostile online political discourse. Yet, to date, there is a lack of clarity on what incivility means in the political sphere. In this work, we utilize a multidimensional perspective of political incivility, developed in the fields of political science and communication, that differentiates between impoliteness and political intolerance. We present state-of-the-art incivility detection results using a large dataset of 13K political tweets, collected and annotated per this distinction. Applying political incivility detection at large-scale, we observe that political incivility demonstrates a highly skewed distribution over users, and examine social factors that correlate with incivility at subpopulation and user-level. Finally, we propose an approach for modeling social context information about the tweet author alongside the tweet content, showing that this leads to improved performance on the task of political incivility detection. We believe that this latter result holds promise for socially-informed text processing in general.111The dataset is available at Hugging Face, and additional supplementary materials can be accessed here.
1 Introduction
A civil discourse between political groups is considered a fundamental condition for a thriving and healthy democracy Gutmann and Thompson (2009). Sadly, the rise of social media has been argued to intensify disrespectful and hostile online political discourse Coe et al. (2014); Frimer et al. (2023). According to researchers, there are multiple negative consequences of this phenomenon to democracy: it fosters polarization between rival political groups, decreases trust in political institutions, and may disengage citizens from being politically involved Muddiman et al. (2020); Skytte (2021); Van’t Riet and Van Stekelenburg (2022).
Considering these concerns, scholars have attempted to quantify uncivil political discourse in discussion groups and social media platforms ElSherief et al. (2018); Davidson et al. (2020); Theocharis et al. (2020); Frimer et al. (2023). These efforts offer however a coarse definition of incivility. Political communication researchers rather view political incivility as a multidimensional concept Muddiman (2017); Rossini (2020). The first dimension is personal-level incivility (impoliteness), pertaining to a violation of interpersonal norms. Impolite speech may contain foul language, harsh tone, name-calling, vulgarity, and aspersion towards other discussion partners or their ideas (e.g., “are you really so stupid that you would defund this program?”). The second dimension of public-level incivility (intolerance) refers to violations of norms related to the democratic process, such as pluralism and deliberation. It refers to exclusionary speech, silencing social and political groups and denying their rights Rossini (2020) (e.g., “Hillary and the dems ARE enemies, foreign AND domestic”). Considering these separate dimensions is crucial when detecting incivility on digital platforms since they carry different democratic implications. In fact, political impoliteness may sometimes lead to positive outcomes, such as increasing citizens’ interest in heated debates and opinion justification Papacharissi (2004); Rossini (2020).
This work makes several contributions to the study of political incivility on social networks. First, we address political incivility detection at fine-grained resolution. We constructed a dataset of 13K political tweets from the U.S. context for this purpose, which we labeled via crowdsourcing. The data collection process involved diverse sampling strategies, aiming at capturing sufficient examples of both incivility types while avoiding lexical biases. We make this resource available to the research community. We then finetuned state-of-the-art transformer-based language models on the task of multi-label incivility detection. Due to the size and diversity of our dataset, we achieve state-of-the-art results both within- and across-datasets. Our experiments illustrate the differences and performance gaps in identifying impolite speech, which is typically explicit, and political intolerance, which often requires social and semantic understanding.
A second contribution is our focus not only on individual tweets to study political incivility but also on the user level. Applying political incivility detection at large scale, we examine the prevalence of incivility among more than 200K random American users who posted political content on Twitter. Shifting the focus to the user level allows us to answer important research questions: (i) Are there differences in incivility levels between subpopulations of interest–Democrats vs. Republicans, or across states? (ii) Are some individual users more inclined than others to using impolite and intolerant language in political discussions on social media? (iii) Can relevant user representations be effectively modeled as context, so as to perform author-informed detection of political incivility? Our investigation of these questions leads to a formulation of social text processing, where textual contents and social information about the text author (based on his social network) are modeled jointly in identifying political incivility. We show that such an approach can lead to substantial performance gains, both in terms of precision and recall.
2 Related work
To the best of our knowledge, this work is the first to implement a multidimensional perspective for political incivility detection and evaluation at scale. Notably, public-level political incivility (intolerance) is a broad concept. While there exists ample related research on the detection of hate speech, an exclusionary speech against social minorities Fortuna and Nunes (2018), relatively few research works sought to generally detect, characterize and quantify uncivil online discourse in the context of a politically polarized climate. Several previous works aimed at detecting political incivility in online platforms, however these works have either considered impoliteness and intolerance as a unified concept Theocharis et al. (2016, 2020), or focused only on one of these dimensions Davidson et al. (2020); ElSherief et al. (2018); Shvets et al. (2021). This conceptual and methodological fuzziness ignores the different democratic outcomes of each of these dimensions. Whereas insults and foul language (impoliteness) may be considered acceptable in polarized environments and heated political debates Rains et al. (2017), expressions that refuse to recognize the legitimacy of a rival group or consider it morally inferior (intolerance) are far less acceptable Van Prooijen and Krouwel (2019).
Our exploration of political incivility at user level, and the modeling of text alongside the social encoding of its author, form another important contribution of this work.
3 A dataset of fine-grained political incivility
This section describes our steps of data collection and annotation in constructing a labeled dataset of multidimensional political incivility.
3.1 Data sampling strategy
Even though incivility is not rare, the inspection of random tweets would yield a low ratio of relevant examples at high annotation cost. We exploit multiple network- and content-based cues, aiming to obtain a diverse sample of relevant tweets while avoiding lexical and other biases Wiegand et al. (2019).
Obtaining political tweets. First, we retrieved a large pool of tweets which we expected to include fervent political language. Concretely, we referred to several lists of social media accounts in the political domain that are disputable or biased, including: accounts that are known to distribute fake news Grinberg et al. (2019), the accounts of members of the U.S. Congress who are considered ideologically extreme Lewis et al. (2019),222https://voteview.com/data and news accounts that are considered to be politically biased to a large extent Wojcieszak et al. (2023). We selected the 20 most biased accounts per category, of either conservative or liberal orientation, based on bias scores provided by those sources.333The fake news category includes only 9 accounts of each orientation. We then identified users in our pool who follow at least two of the specified biased accounts, maintaining a balance between users of conservative and liberal orientation. Retrieving the (200) most recent tweets posted by the sampled users, using Twitter API as of December 2021, yielded 885K tweets authored by 15.8K users. Finally, applying a dedicated classifier (Sec. 3.2), we identified 82K of those tweets as political. Annotating 300 random tweets of this pool by a graduate student of Communication indicated on precision of 0.91 (i.e., 273 of the 300 tweets were confirmed to be political).
Sampling tweets for annotation. Aiming to further focus on political tweets that were likely demonstrate incivility, we again applied several sampling guidelines. The selected tweets were then subject to manual annotation by crowd workers (Sec. 3.3). First, similar to previous works Theocharis et al. (2020); Hede et al. (2021), we utilized the pretrained Jigsaw Perspective tool444https://www.perspectiveapi.com/ to identify toxic language. Specifically, we considered tweets that received relatively high scores on the categories of ‘abusive language and slurs’, ‘inflammatory comments’ and ‘attacks on the author’. Roughly 1.9K tweets were sampled in this fashion, where the human annotators labeled 43.3% and 9.9% of them as impolite and intolerant, respectively. In addition, following the insights inferred by Ribiero et al (2018) with respect to hateful tweets, we favored the sampling of tweets by user accounts that were new, being created up to two months prior to sampling date, or highly active, having posted more than one tweet a day on average since the account creation date. Annotating 2.0K tweets selected based on these criteria yielded proportions of 25.9% and 7.5% of impolite and intolerant tweets, respectively. Finally, we sampled 4K tweets from the pool of political tweets uniformly at random, where this yielded lower ratios of relevant labeled examples: 12.9% impolite and 3.2% intolerant tweets.555More precisely, we attempted sampling 2K tweets of those based on additional network cues rather than randomly, however this resulted with similar identified incivility rates.
Active sampling. Overall, the annotation of 7.9K political tweets sampled as described above yielded 2.3K examples labeled as impoliteness (28.9%) and 0.8K examples labeled as political intolerance (9.8%) (this includes 2.8% of the tweets that were labeled as both categories). In order to obtain more examples of political intolerance, we employed a classifier of intolerance detection trained using these labeled examples Tong and Koller (2001). In several consequent batches, we sampled 5.2K tweets which the classifier identified as intolerant. Overall, the ratio of identified impoliteness in those tweets was similar (22.5%), where the observed ratio of intolerance has tripled (29.5%) (2.1% labeled as both categories). The final dataset statistics are detailed in Table 2. Importantly, we allocated all of the labeled examples obtained via active sampling to the training set in our main classification experiments in order to avoid evaluation bias.
3.2 Identifying political tweets
As we study incivility in political contexts, it is first required to identify topical relevance. Topic detection is a well-studied task, for which excellent performance can be achieved given a sufficient number of labeled examples using models such as BERT Devlin et al. (2019). To obtain labeled examples, we referred to an existing dataset of political tweets collected by Barberá et al. (2015), randomly sampling 12.5K tweets across different political topics,666Topic titles: ‘2012 presidential campaign’, ‘2013 government shutdown’, ‘Budget’ and ‘Marriage equality’, ‘the Boston Marathon bombing’, ‘Newtown school shooting,’ and ‘use of chemical weapons during the Syrian civil war’. and further sampled 3.5K political posts from another public dataset of political social media posts.777www.kaggle.com/datasets/crowdflower/political-social-media-posts. We considered random Twitter tweets by U.S. users as counter non-political examples, constructing a balanced dataset of 32K political and non-political tweets overall. While this labeling strategy is noisy, contrasting topical tweets with random examples should support effective learning, as confirmed by our results.
We fine-tuned a BERT-base uncased model using its public implementation and standard training practices, minimizing the Cross-Entropy loss function. Evaluation of political tweet detection on held-out examples (20%) indicated on high precision and recall scores of 0.97. Aiming at maintaining high precision in detecting political tweets, also in data shift conditions, we set a high threshold (0.96) over the classifier’s confidence. As reported before, the precision of the classifier was assessed at 0.91 on our pool of candidate tweets.
3.3 Crowdsource labeling
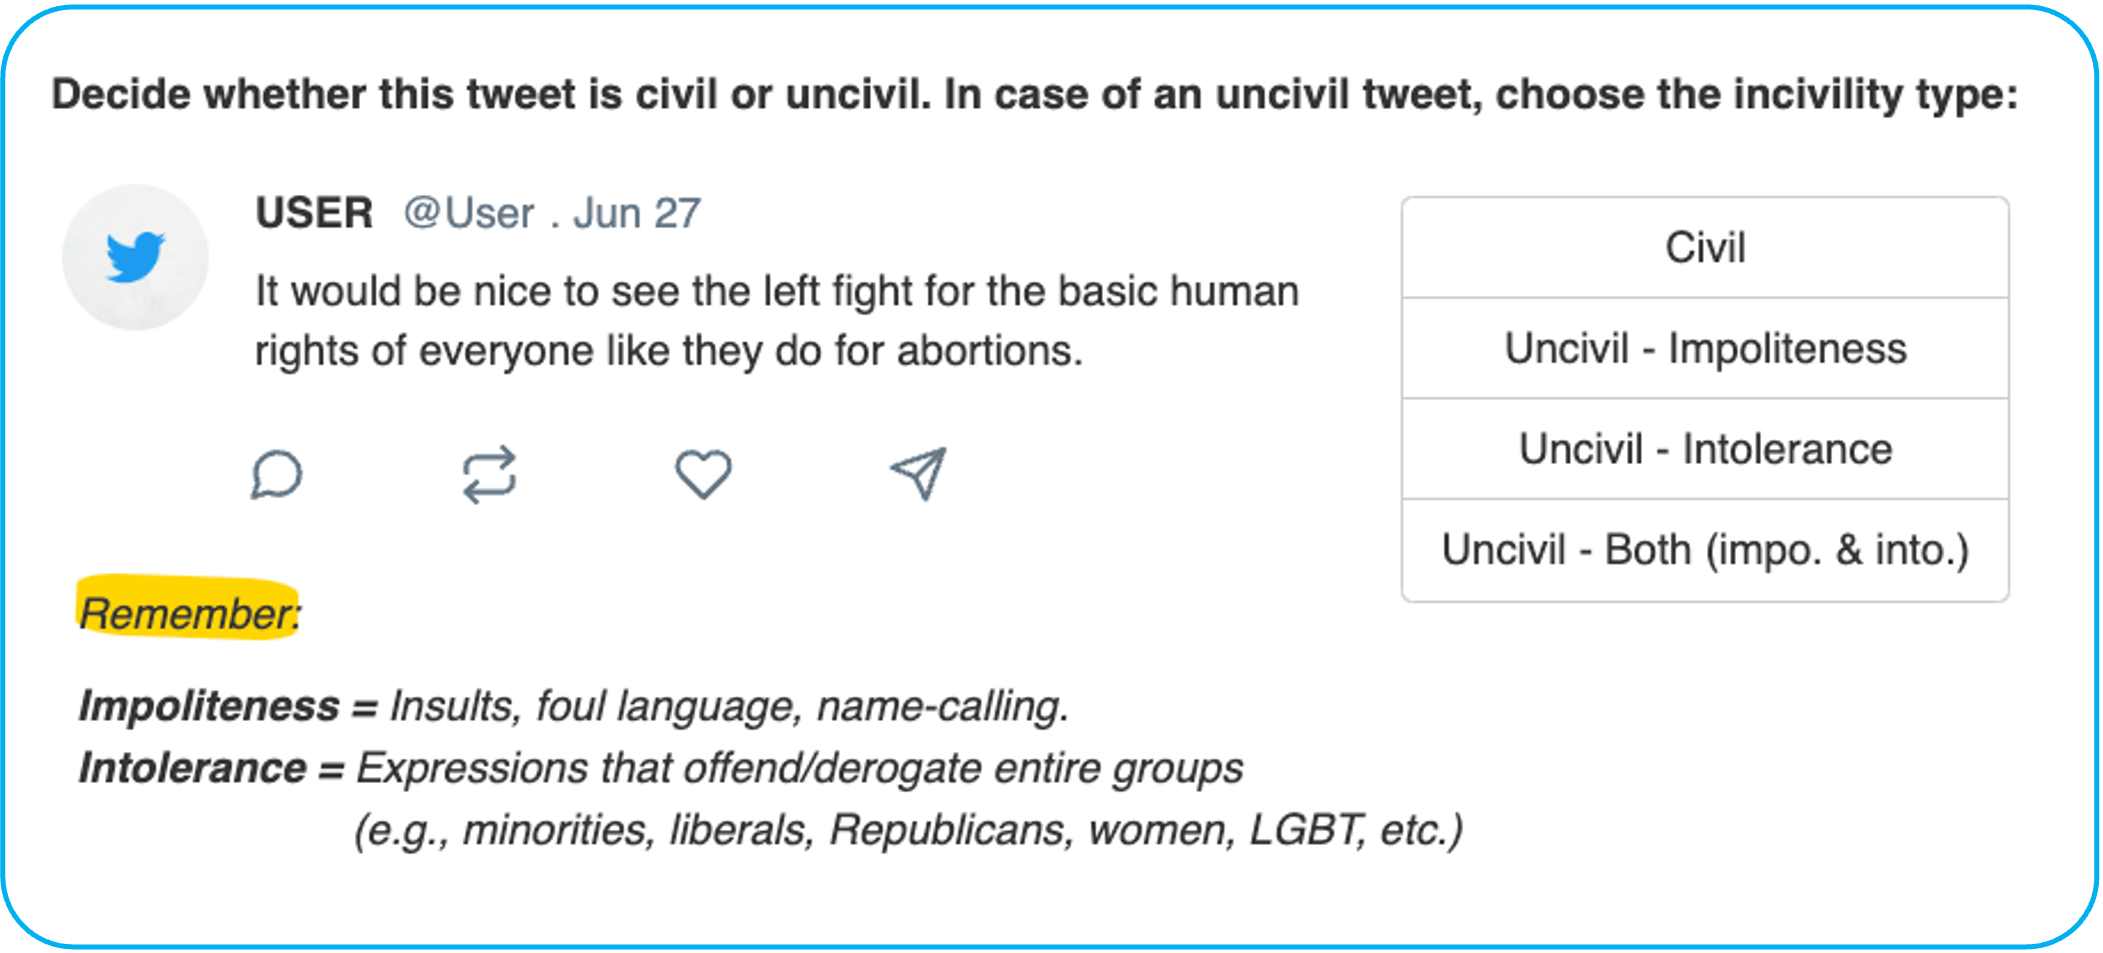
We employed non-expert workers on the Amazon Mechanical Turk platform888www.mturk.com/ to obtain human judgements regarding political incivility. Given each selected tweet, several independent workers were asked to determine whether it was impolite, intolerant, both, or neither.999The category of ‘both’ was specified in order to raise annotator awareness of this possibility. Table 1 includes examples which we presented to the workers of each class. These examples were accompanied with a codebook containing explanations regarding the guidelines for annotating the tweets. Figure 1 shows the annotation interface that workers were presented to workers for labeling the tweets.
| IMPOLITE: “All hell has broken loose under the leadership of the senile old man. I don’t believe a damn word from this dumb son of a bitches.”; “That’s what they are protesting, you rank imbecile. People like you need a damn good kicking.” |
|---|
| INTOLERANT: “Hillary and the dems ARE enemies, foreign AND domestic”; “If you agree with democrats in congress, you are an anti-American commie” |
| NEUTRAL: “How long do Republicans believe you can keep pushing this line? You never intended to secure the border”; “There are 400,000,000 guns in the United States, you’re going to have to stop the criminals not the guns” |
Crucially, the task of assessing political incivility in general, and differentiating between impoliteness and intolerance in particular, involves fine semantics and critical thinking. We therefore took several measures to assure high quality of the annotations. First, we restricted the task to highly qualified workers (who had previously completed at least 100 HITs with approval rate higher than 98%). We also required the assigned workers be residents of the U.S., to assure that they were fluent in English and familiar with U.S. politics. Relevant candidate workers were further asked to undergo a training and qualification phase. Each candidate worker was asked to label six carefully selected tweets, where in case of a mistake, they received feedback with an explanation about the correct label. Whoever labeled a majority of the tweets correctly got qualified to work on our task. Finally, we included control questions (two out of 15 tweets in each micro-task, also referred to as a HIT) that we expected the workers to do well on. In case that the worker failed to label the control tweets correctly, we discarded the annotations, and banned those workers from further working on our task. We paid the workers an hourly fee of 17.5 USD on average, which exceeds the U.S. minimum wage standards, where fair pay is known to positively affect annotation quality Ye et al. (2017). Overall, our final cohort included 125 workers, who annotated up to 2,000 tweets per week, over a period of 3 months.
3.4 Dataset statistics
Each tweet was labeled by 3-5 annotators, where we assigned the final labels using majority voting. Overall, our dataset includes 13.1K labeled tweets. As detailed in Table 2, a large proportion of the labeled examples (42.3%) corresponds to political incivility, including 3.6k tweets labeled as impolite, and 2.3K as intolerant. In comparison, existing related datasets are smaller, use binary annotations, and include substantially fewer incivility examples.
| Dataset | Size | Uncivil | Impol./Intol. |
|---|---|---|---|
| Ours | 13.1K | 42.3% | 27.2 / 17.7% |
| Davidson et al. | 1.0K | 10.4% | - |
| Rheault et al. (USA) | 5,0K | 15.4% | - |
| Rheault et al. (CAN) | 5.0K | 10.6% | - |
| Theocharis et al. | 4.0K | 17.4% | - |
To measure inter-annotator agreement, we consider the labels assigned to individual tweets by random worker pairs. Our assessment indicated on Fleiss’ kappa agreement score of 0.57, reflecting moderate–nearing substantial–agreement, in judging the coarse notion of incivility. Considering our fine-grained annotation scheme, we obtained a substantial agreement score of 0.63 on the category of impoliteness, and moderate score of 0.54 on political intolerance in distinguishing between the target class and the other labels. This suggests that intolerance is more subjective and subtle compared to impoliteness.
We further assessed the quality of the crowdsourced labels against the judgement of a domain expert, who is one of the authors, per 300 random tweets drawn from our dataset. Assessing the workers’ performance against the expert’s labels in classification terms Snow et al. (2008) yielded F1 scores of 0.74 and 0.75 on impolite and intolerant speech, respectively. Considering only the subset of the examples on which the workers showed high agreement (a majority of more than 70%) resulted in substantially higher annotator F1 score of 0.85 on the impoliteness category. Yet, annotator performance on the intolerance class remained similar (F1 of 0.74). Again, this suggests that the notion of political intolerance is more subtle compared with impoliteness. In general, while political incivility may be perceived differently depending on the background and beliefs of the reader Oprea and Magdy (2020), it is unrealistic to expect that a machine learning approach would outperform human judgement.
4 Multidimensional incivility detection
Next, we train and evaluate the extent to which neural models can detect political incivility as perceived by humans. We perform multi-label classification, detecting impoliteness and intolerance as orthogonal dimensions, as well as experiment with coarse prediction of political incivility.
4.1 Experimental setup
We consider the popular transformer-based pre-trained language models of BERT Devlin et al. (2019), RoBERTa Liu et al. (2019) and DeBERTa He et al. (2021). The latter models have been trained on significantly more text data compared to BERT, and introduced enhancements to its training procedure, cost function, and word attention mechanism. We found that the larger architectures of these models yielded minor improvements, and therefore report our results using the base configurations of BERT and RoBERTa models, which include 110M and 125M parameters, and DeBERTa-v3 which is a slightly larger model, including 140M parameters. In addition, we experiment with specialized language models, including HateBERT, a BERT model that has been re-trained for abusive language detection using a large-scale corpus of offensive, abusive, and hateful Reddit comments Caselli et al. (2021), and HateXplain, a model of BERT that has been finetuned on the classification of hateful and offensive Twitter and Gab posts Mathew et al. (2021). All models were applied using their public implementation.101010https://huggingface.co/ In all cases, we finetune the models using our labeled examples Devlin et al. (2019). We split our dataset into fixed stratified train (70%), validation (10%) and test (20%) sets, optimizing the parameters of each model on the validation examples. Considering the class imbalance, we found it beneficial to employ a weighted cross-entropy loss function, setting example weights according to inverse class frequency, so as to increase the penalty on classification errors on the target minority class.
4.2 Classification results
| Impolite | Intolerant | ||||||||
|---|---|---|---|---|---|---|---|---|---|
| Classifier | AUC | P | R | F1 | AUC | P | R | F1 | Macro-F1 |
| BERT | 0.857 | 0.635 | 0.713 | 0.671 | 0.848 | 0.530 | 0.644 | 0.581 | 0.626 |
| RoBERTa | 0.874 | 0.642 | 0.744 | 0.689 | 0.859 | 0.501 | 0.728 | 0.593 | 0.641 |
| DeBERTa | 0.861 | 0.687 | 0.707 | 0.697 | 0.845 | 0.558 | 0.626 | 0.590 | 0.643 |
| HateBert | 0.865 | 0.701 | 0.661 | 0.680 | 0.835 | 0.515 | 0.639 | 0.571 | 0.625 |
| HateXplain | 0.820 | 0.567 | 0.688 | 0.622 | 0.756 | 0.374 | 0.537 | 0.441 | 0.531 |
| Classifier | P | R | F1 | Mac.-F1 | AUC |
|---|---|---|---|---|---|
| BERT | 0.752 | 0.692 | 0.721 | 0.766 | 0.849 |
| RoBERTa | 0.765 | 0.707 | 0.735 | 0.777 | 0.864 |
| DeBERTa | 0.754 | 0.739 | 0.746 | 0.782 | 0.865 |
| HateBert | 0.755 | 0.719 | 0.737 | 0.777 | 0.857 |
| HateXplain | 0.773 | 0.532 | 0.630 | 0.713 | 0.811 |
| Classifier | P | R | F1 | Mac.-F1 | AUC |
|---|---|---|---|---|---|
| Theocharis | 0.73 | 0.61 | 0.665 | 0.800 | - |
| Ours | 0.542 | 0.847 | 0.661 | 0.782 | 0.848 |
| Davidson | - | - | - | 0.802 | - |
| Ours | 0.692 | 0.779 | 0.733 | 0.850 | 0.869 |
| Rheault (U) | - | - | - | 0.738 | 0.763 |
| Ours | 0.549 | 0.841 | 0.665 | 0.792 | 0.858 |
| Rheault (C) | - | - | - | 0.763 | 0.766 |
| Ours | 0.545 | 0.820 | 0.655 | 0.801 | 0.869 |
Table 3 details the results of the finetuned models on the test set in terms of ROC AUC, precision, recall and F1 with respect to each class, as well as Macro-F1 average over the two incivility types. We observe that all models achieve substantially lower performance in detecting intolerant as opposed to impolite speech, where the best F1 results obtained per these classes are 0.59 and 0.70, respectively. In line with the observed human agreement rates, this indicates that the automatic detection of political intolerance is a more challenging task.
The results of our binary classification experiments, considering political incivility as a unified concept, are given in Table 4. As shown, coarse incivility prediction yields substantially higher results, reaching F1 of 0.78. In both setups, the best-performing classifiers are DeBERTa and RoBERTa. Henceforth, we consider RoBERTa as our classifier of choice, given its lower computational cost.
To gauge the generality of our model and dataset, we also performed cross-dataset experiments. Table 4 includes the results of applying our binary model of political incivility detection to other existing datasets (Table 2), alongside the results previously reported per those datasets.111111Our evaluation applies to randomly selected examples, except for a test set provided by Davidson et al. (2020). As shown, our model gives best performance in almost all cases, showing high generalization across data distributions. We consider this as indication for high diversity of our dataset.
Impoliteness vs. intolerance detection.
| Impolite: fuck, help, stupid, damn, obnoxious, fed, joke, ass, goddamn, shit, coward, crap, unreal, love, neoliberal, king, mentality, anarchist, fuel, publishing, bad, wow, back, bastard, communists, forgive, idiot, dumb |
| Intolerant: republican(s), democrat(s), leftists, GOP, democratic, catholics, speech, liberal, dem(s), socialist(s), conservatives, liberals, progressive(s), left, communist(s), party, right, racist, fascists, terrorists, nationalist(s) |
We applied Shapley analysis to our training set Lundberg and Lee (2017)121212https://github.com/slundberg/shap to identify unigrams predictive of political impoliteness and intolerance. As shown in Table 6, impolite speech is characterised by derogatory words. Most of the listed words carry negative meaning in an unequivocal way, being offensive in any context, e.g., ‘stupid’. In contrast, we observe that the word types associated with political intolerance often refer to a political camp, e.g., ‘republicans’, or ‘liberals’. Unlike slur words, the sentiment of such terms may depend on the context. In accordance, we found that impolite tweets were less susceptible to be classified as neutral compared with intolerant tweets (26.7% vs. 44.0%). This suggests that high-level semantic and contextual understanding is needed to detect intolerance.
Examining the classification errors, we indeed observed cases for which the model missed the presence of intolerance due to its implied manifestation; e.g., “you Republicans don’t even know how to keep the electricity on!”, or, the sarcastic “Don’t worry, the democrats are bringing in a billion illegal aliens to replace us with”. On the other hand, the model was sometimes misled by lexical cues, demonstrating the gap between lexical-level and semantic understanding; for instance, the tweet “Yes I have hope for your country. There are enough people who are sick of this.” was misclassified as impolite, possibly because of the idiom ‘sick of’. We further found some positive predictions of intolerance to be sensible while not being judged as such in the manual labeling process, demonstrating the subtlety or subjectivity of this task; e.g., “impeach Biden and his administration! Or charge them with treason”. Overall, these errors illustrate the challenge of semantic understanding for identifying political incivility. Ideally, relevant context information would be considered to improve the recognition of this phenomenon in general, and political intolerance in particular.
Impact of train set size.
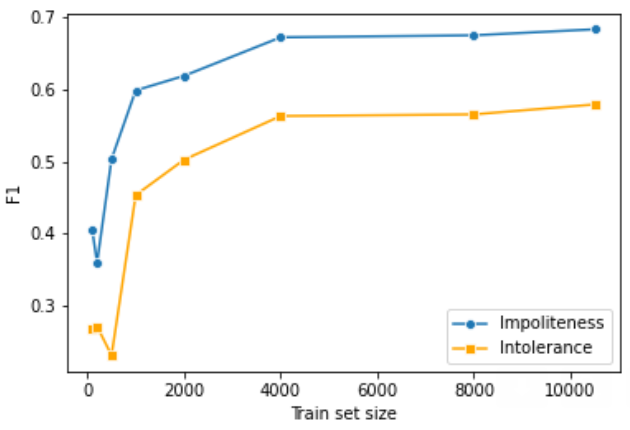
Figure 2 shows test F1 results while finetuning our classifiers using increasing stratified subsets of the train set. It is shown that impoliteness detection dominates intolerance detection results using as few as 1,000 training examples. Again, we attribute this to the greater semantic complexity involved in political intolerance detection. Overall, the improvement in test performance subsides beyond 4K of labeled examples. Further improvements may be obtained by substantially extending the dataset via methods such as text generation Wullach et al. (2021) or back translation Ibrahim et al. (2020). We leave this direction to future research.
5 From tweets to users: a large-scale evaluation
Next, we employ the learned models to identify, quantify and characterise political incivility at scale. In particular, we wish to explore whether certain users are more inclined to post politically uncivil content online, as well as to characterise such users.
To address these questions, we considered a very large corpus of tweets, associated with author information. Concretely, we sampled user identifiers using Twitter API between July-November 2022, who were verified as U.S. residents based on the location attribute of their profiles. For each user, we retrieved their (up to 200) most recent tweets. Removing retweets, non-English tweets, tweets that only included URLs, and tweets posted by overly active accounts suspected as bots,131313We removed accounts for which the tweet posting rate was higher than two standard deviations above the mean. resulted in a corpus of 16.3M tweets authored by 373K users. Applying our classifier of political content detection, we obtained 2.57M political tweets authored by 230K distinct users, henceforth, the corpus. Overall, 17.6% of the political tweets were identified as impolite, 13.3% as intolerant, and 2.5% as both categories, i.e., 28.4% uncivil tweets overall.
5.1 Political incivility across subpopulations
Using a corpus of political tweets that includes author information, one may investigate social factors that correlate with incivility. Below, we demonstrate this with respect to the social dimensions of political affiliation and state demographics.
Is incivility a matter of political affiliation?
To address this question, we gauged the prevalence of incivility among the two main political camps: Democratic (liberal) vs. Republican (conservative). In this work, we opted for a simple and intuitive metric as a proxy of political affiliation. Considering the accounts of 30 popular news outlets scored by political bias Jurkowitz et al. (2020), we identified users who followed two or more accounts included in this list, of homogeneous political orientation. Applying this criterion resulted in a sample of 54.5K users, out of which 83% were assumed to be Democrats, and 17% as Republicans. Our analysis showed minor differences between the two groups. The ratio of political impolite tweets was slightly higher within the Republican group (18.80% vs. 18.52%), whereas the ratio of politically intolerant tweets was higher among Democrats (9.06% vs. 8.88%), however neither of these differences was found to be statistically significant.
Do political incivility levels vary across states?
To analyse and compare political incivility across U.S. states, we attended user accounts that specified state information (full state name, or its abbreviation) in the location meta-data field. Overall, 186K users in the corpus met this condition. The largest number of users were affiliated with the states of New-York (23K), California (16K) and Texas (14K). The states with the least number of users were North Dakota (265), Wyoming (315), South Dakota (426), and Alaska (579). The median number of tweets per state was 2,216, providing a sufficient sample size for statistical analysis.
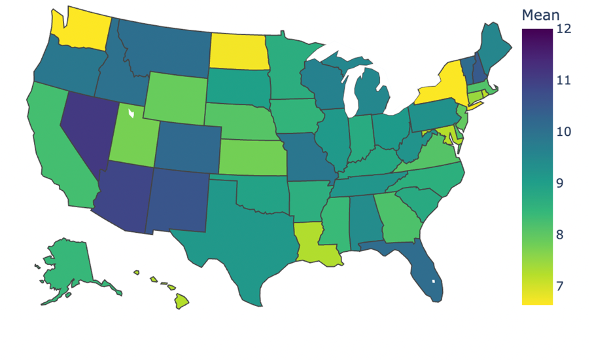
For each state, we computed the average user-level proportion of impolite or intolerant tweets. Figure 3 presents a heat map showcasing the average intolerance ratio across states. Similar trends were observed for impoliteness. As shown, some states demonstrate low incivility rates (e.g., WA and NY) whereas other exhibit high incivility rates (e.g., AZ and FL). Presumably, in ‘battleground states’, where the two camps are on par, there would be more hostility and toxicity in the political debate. To test this hypothesis, we compared the detected state-level average ratios of impolite and intolerant tweets against the differences between the percentage of votes for the Democratic and the Republican parties per state.141414https://www.cookpolitical.com/2020-national-popular-vote-tracker Applying Spearman’s correlation analysis confirmed our hypothesis, yielding correlation scores of -0.43 and -0.40, respectively, both found significant at p-value . In words, this result suggests that higher levels of political incivility in a particular state correspond to a closer contest between the two main political camps, manifested by a smaller difference in the vote percentage between the two parties.
5.2 Political incivility at user-level
Crucially, our results indicate that some users are more inclined to post uncivil content than others. The distribution of uncivil tweets in our corpus across users is highly skewed: as few as 7.3% of the users authored 50% of the uncivil posts in the corpus, and 20.6% of the users authored 80% of the uncivil posts. On the other hand, 43.7% of the users authored no uncivil post.
| % Impolite | % Intolerant | |
|---|---|---|
| # Followers | -0.109 | -0.038 |
| # Friends | -0.017 | 0.058 |
| Tweets per day | 0.068 | 0.091 |
| % political tweets | 0.237 | 0.498 |
To further explore the distribution of incivility across users, we contrast the ratio of impolite and intolerant political tweets per user and other metrics of interest. As reported in Table 7, users who post intolerant and impolite political content tend to post more tweets per day. They also tend to have less followers–possibly, popular users refrain from controversial political language. Very high correlation was found between the ratio of intolerant and impolite tweets per user and the proportion of political tweets posted by them (Spearman’s correlation scores of 0.50 and 0.24, respectively). That is, those users who discuss political topics more often, i.e., are more politically engaged, are more likely to use intolerant or impolite language.
A network perspective of user-level incivility.
Next, we wished to explore whether social network information was indicative of one’s tendency for using political uncivil language. In a controlled experiment, we sought differences between users who frequently post politically uncivil content and users who rarely do so. In our analysis, we considered a random sample of 1,000 user accounts from our corpus for which we identified a high ratio of incivility (above 50%) within their political posts. For each selected user, we identified a counter example–another user with a similar ratio of political tweets, and no indication of incivility. As a result, the proportion of political tweets per user in the two groups is similar (roughly 37%). But, while the ratio of incivility within the political tweets in the first group is high (roughly 34% impolite, 39% intolerant, and 66% uncivil overall), the prevalence of political incivility within the control group is practically zero, by design.
The users in both groups follow about the same number of accounts on average. Yet, we found differences in the types of accounts that each group tends to follow. To identify such accounts, we computed pointwise mutual information (PMI) scores as follows: , where denotes some account followed, is the joint probability that users of group follow account , and is the probability that any user, of either group, follow that account. High PMI scores indicate on strong correlation, whereas low (near zero) scores correspond to independent events.
Manually examining the accounts that characterize the users who post uncivil content, we found that many of them deliver a political message in their account description, e.g.: “celebrating Trump-free gov’t”, “#ResistFascism”,“#nonazis”, “NoGoZone for Democrats, Socialist, Globalist, and Godless AntiAmericans.”, or “#TrumpWonBidenCheated”. In contrast, the counter ‘political, yet civil’ group of users was found to distinctively follow political organizations, charitable foundations, as well as economical, scientific, and technological news sources and columnists. Overall, these exploratory results suggest the network profile of users encodes meaningful social context information that correlates with political incivility.
6 User-informed incivility detection
Having established that some users post political uncivil content more than others, and that there are meaningful network cues that characterise those users, we argue and show that the joint modeling of tweets and their authors can improve the performance of automated political incivility detection.
6.1 Approach
| Impolite | Intolerant | Uncivil | |||||||
|---|---|---|---|---|---|---|---|---|---|
| Evidence | P | R | F1 | P | R | F1 | P | R | F1 |
| tweet | 0.617 | 0.818 | 0.704 | 0.403 | 0.703 | 0.512 | 0.774 | 0.583 | 0.665 |
| tweet & user: all (encoding) | 0.628 | 0.800 | 0.704 | 0.403 | 0.710 | 0.514 | 0.778 | 0.647 | 0.707 |
| tweet & user: list-based (encoding) | 0.630 | 0.800 | 0.705 | 0.396 | 0.712 | 0.509 | 0.737 | 0.684 | 0.709 |
| tweet & user: sample-based (encoding) | 0.647 | 0.798 | 0.714 | 0.395 | 0.710 | 0.508 | 0.716 | 0.718 | 0.717 |
| tweet & user: high PMI (0.5) (encoding) | 0.608 | 0.831 | 0.702 | 0.407 | 0.721 | 0.520 | 0.778 | 0.615 | 0.687 |
| tweet & user: high PMI (1.0) (encoding) | 0.665 | 0.784 | 0.720 | 0.409 | 0.725 | 0.523 | 0.754 | 0.693 | 0.722 |
| tweet & user: high PMI (1.0) (sparse) | 0.657 | 0.771 | 0.710 | 0.420 | 0.639 | 0.507 | 0.730 | 0.693 | 0.713 |
User encoding.
One may represent users in terms of relevant accounts that they follow using sparse binary indications Lynn et al. (2019). Here, we rather exploit account embeddings, learned from a large sample of the Twitter network for this purpose Lotan and Minkov (2023). Given a sample of 2M U.S. Twitter users and the accounts that they follow, the embeddings of 200K popular Twitter accounts were learned, such that accounts which users tend to co-follow are placed close to each other in the embedding space. Consequently, the embeddings encode social and topical similarities. We project individual users onto the social embedding space by averaging the embeddings of accounts of interest that they follow.
A unified classification approach.
The semantic encoding of a given tweet and the social encoding of the tweet author are incompatible, yet we wish to combine them in performing political incivility detection. Our proposed approach consists of the following principles. We obtain the encoding of a given tweet output by the finetuned transformer-based RoBERTa model. We then concatenate this content encoding with the respective social user encoding of the tweet author. This multi-facet evidence is served into a dedicated multi-layer neural network, which we train, tune and test using our training, validation and test examples.
6.2 Experiments
To perform user-informed tweet classification, we obtained the list of accounts followed by each user in our dataset using Twitter API. At the time of network data collection, we were able to retrieve relevant information for 2,247 (out of 3,741) distinct users; some users may have been suspended, or quit the social network. This yielded a smaller dataset of 9,458 labeled tweets with available author network information. The distribution of labels remained similar to the original dataset (59.1% neutral, 26.0% impolite, 16.7% intolerant, and 2.0% labeled as both). In conducting user-informed tweet classification, we split this dataset into class-stratified sets, and further verified that there was no overlap between the authors of tweets in the test set and the examples used to train and tune the models.
In the experiments, we finetuned RoBERTa and extracted a 768-dimension CLS vector from the classifier as the tweet encoding. We obtained 100-dimension social embeddings of relevant accounts that each user followed, aggregating them into an averaged user encoding.151515https://github.com/nirlotan/SocialVec The concatenated tweet and author embeddings were fed into a fully connected neural network with a Sigmoid output unit. We learned models for detecting impoliteness and intolerance, as well as a binary notion of political incivility. In learning, we minimized a binary cross-entropy loss function, while tuning the hyper-parameters of the neural network, including the learning rate, optimizer, the number of hidden layers and their size. Considering the reduced dataset size, we performed tuning using cross-validation, and trained the final models using the full train set.
6.3 Results
Table 8 details our results on multidimensional and binary political incivility detection evaluated on the test set. The table includes the results using the tweet alone as baseline. We note that the reported performance is overall lower compared with our previous experiments–we attribute this to the reduced dataset size.
As detailed in the table, we report the results of user-informed incivility detection using several different user representation schemes. Concretely, we attempted representing the users in terms of all of the accounts that they follow (‘all’), or in terms of the following account subsets of interest:
–Accounts that are known to be politically biased according to external lists; see Sec. 3.1 (‘List-based’).
–Popular accounts followed by 1% or more of the users in our sample of 2K highly political users, who exhibit either high or low incivility; see Sec. 5.2 (‘Sample-based’).
–We further narrowed the previous sample-based subset to those accounts that are distinctive of high or low incivility, with absolute PMI scores greater than 0.5 or 1.0 (‘Sample-PMI’)
As shown, major improvement were achieved using all methods on binary incivility detection, reaching an impressive improvement of up to 5.7 absolute points in F1. Lower, yet substantial, improvements were also achieved on impoliteness and intolerance detection, reaching gains of up to 1.6 and 1.1 absolute points in F1, respectively. In all cases, the best results were obtained by focusing on network information that was found distinctive of political incivility in our analysis (sample-based, PMI 1.0). As expected, representing the user’s network information in terms of social embeddings is beneficial compared with a sparse representation of the same set of accounts (‘sparse’). Overall, we find these results to be highly encouraging, indicating that the social modeling of users provides meaningful contextual evidence that improves the decoding of the texts that they author.
7 Conclusion
This work framed political incivility detection as a multidimensional classification task, distinguishing between impolite and intolerant political discourse. We collected a large dataset of multidimensional political incivility, annotated via crowd sourcing, which we believe is diverse and representative of the challenges that automated political incivility detection must address. In particular, we observed high lexical ambiguity and a need for incorporating semantic and social cues in decoding political intolerance. In a large-scale study, we showcased various social factors correlated with political incivility that apply to subpopulations and individual users. Last, we leveraged relevant social network information, presenting substantial improvements in incivility detection by augmenting the textual evidence with social context information about the text author. We believe that this research direction holds promise for social text processing in general.
8 Limitations
While we targeted the detection of political intolerance as a broad concept, we observed that the tweets annotated as intolerant in our dataset often aim to undermine or silence specific partisan and political groups (e.g., ‘republicans’, ‘democrats’, or ‘liberals’). Other flavors of political intolerance, including expressions toward immigrants, ethnic minorities, or other social groups, may be underrepresented in the dataset. It is possible that our political content classifier contributed to this bias, or that political intolerance in its bipartisan context is inherently more prevalent in Twitter. In addition, our study applies to political incivility in the U.S., focusing on the Twitter network. While we believe that our model and insights are general to a large extent, they may be limited geographically, temporally, and across social media platforms.
Ethical considerations.
Despite analyzing incivility at user-level, we emphasize that political incivility is common, context-dependent, and should not be considered as a personal characteristic. This research was approved by our institutional review board. We release our code and dataset, adhering to Twitter terms, to promote future related research.
References
- Barberá et al. (2015) Pablo Barberá, John T Jost, Jonathan Nagler, Joshua A Tucker, and Richard Bonneau. 2015. Tweeting from left to right: Is online political communication more than an echo chamber? Psychological science, 26(10):1531–1542.
- Caselli et al. (2021) Tommaso Caselli, Valerio Basile, Jelena Mitrović, and Michael Granitzer. 2021. HateBERT: Retraining BERT for abusive language detection in English. In Proceedings of the 5th Workshop on Online Abuse and Harms (WOAH 2021), pages 17–25, Online. Association for Computational Linguistics.
- Coe et al. (2014) Kevin Coe, Kate Kenski, and Stephen A Rains. 2014. Online and uncivil? Patterns and determinants of incivility in newspaper website comments. Journal of communication, 64(4):658–679.
- Davidson et al. (2020) Sam Davidson, Qiusi Sun, and Magdalena Wojcieszak. 2020. Developing a new classifier for automated identification of incivility in social media. In Proceedings of the Fourth Workshop on Online Abuse and Harms, pages 95–101, Online. Association for Computational Linguistics.
- Devlin et al. (2019) Jacob Devlin, Ming-Wei Chang, Kenton Lee, and Kristina Toutanova. 2019. BERT: pre-training of deep bidirectional transformers for language understanding. In Proceedings of the 2019 Conference of the North American Chapter of the Association for Computational Linguistics: Human Language Technologies, NAACL-HLT.
- ElSherief et al. (2018) Mai ElSherief, Vivek Kulkarni, Dana Nguyen, William Yang Wang, and Elizabeth Belding. 2018. Hate lingo: A target-based linguistic analysis of hate speech in social media. Proceedings of the International AAAI Conference on Web and Social Media, 12(1).
- Fortuna and Nunes (2018) Paula Fortuna and Sérgio Nunes. 2018. A survey on automatic detection of hate speech in text. ACM Computing Surveys (CSUR), 51(4):1–30.
- Frimer et al. (2023) Jeremy A Frimer, Harinder Aujla, Matthew Feinberg, Linda J Skitka, Karl Aquino, Johannes C Eichstaedt, and Robb Willer. 2023. Incivility is rising among american politicians on Twitter. Social Psychological and Personality Science, 14(2):259–269.
- Grinberg et al. (2019) Nir Grinberg, Kenneth Joseph, Lisa Friedland, Briony Swire-Thompson, and David Lazer. 2019. Fake news on Twitter during the 2016 US presidential election. Science, 363(6425):374–378.
- Gutmann and Thompson (2009) Amy Gutmann and Dennis F Thompson. 2009. Democracy and disagreement. Harvard University Press.
- He et al. (2021) Pengcheng He, Xiaodong Liu, Jianfeng Gao, and Weizhu Chen. 2021. Deberta: Decoding-enhanced bert with disentangled attention. In 9th International Conference on Learning Representations (ICLR).
- Hede et al. (2021) Anushree Hede, Oshin Agarwal, Linda Lu, Diana C. Mutz, and Ani Nenkova. 2021. From toxicity in online comments to incivility in American news: Proceed with caution. In Proceedings of the Conference of the European Chapter of the Association for Computational Linguistics (EACL).
- Ibrahim et al. (2020) Mai Ibrahim, Marwan Torki, and Nagwa El-Makky. 2020. AlexU-BackTranslation-TL at SemEval-2020 task 12: Improving offensive language detection using data augmentation and transfer learning. In Proceedings of the Workshop on Semantic Evaluation.
- Jurkowitz et al. (2020) Mark Jurkowitz, Amy Mitchell, Elisa Shearer, and Mason Walker. 2020. Us media polarization and the 2020 election: A nation divided. Pew Research Center, 24.
- Lewis et al. (2019) Jeffrey B Lewis, Keith Poole, Howard Rosenthal, Adam Boche, Aaron Rudkin, and Luke Sonnet. 2019. Voteview: Congressional roll-call votes database. See https://voteview.com/.
- Liu et al. (2019) Yinhan Liu, Myle Ott, Naman Goyal, Jingfei Du, Mandar Joshi, Danqi Chen, Omer Levy, Mike Lewis, Luke Zettlemoyer, and Veselin Stoyanov. 2019. Roberta: A robustly optimized BERT pretraining approach. CoRR, abs/1907.11692.
- Lotan and Minkov (2023) Nir Lotan and Einat Minkov. 2023. Social world knowledge: Modeling and applications. Plos one, 18(7).
- Lundberg and Lee (2017) Scott M Lundberg and Su-In Lee. 2017. A Unified Approach to Interpreting Model Predictions. In Advances in Neural Information Processing Systems, volume 30. Curran Associates, Inc.
- Lynn et al. (2019) Veronica Lynn, Salvatore Giorgi, Niranjan Balasubramanian, and H. Andrew Schwartz. 2019. Tweet classification without the tweet: An empirical examination of user versus document attributes. In Proceedings of the Third Workshop on Natural Language Processing and Computational Social Science.
- Mathew et al. (2021) Binny Mathew, Punyajoy Saha, Seid Muhie Yimam, Chris Biemann, Pawan Goyal, and Animesh Mukherjee. 2021. Hatexplain: A benchmark dataset for explainable hate speech detection. In Proceedings of the AAAI Conference on Artificial Intelligence (AAAI).
- Muddiman (2017) Ashley Muddiman. 2017. Personal and public levels of political incivility. International Journal of Communication, 11:21.
- Muddiman et al. (2020) Ashley Muddiman, Jamie Pond-Cobb, and Jamie E. Matson. 2020. Negativity bias or backlash: Interaction with civil and uncivil online political news content. Communication Research, 47(6):815–837.
- Oprea and Magdy (2020) Silviu Oprea and Walid Magdy. 2020. iSarcasm: A dataset of intended sarcasm. In Proceedings of the 58th Annual Meeting of the Association for Computational Linguistics (ACL).
- Papacharissi (2004) Zizi Papacharissi. 2004. Democracy online: Civility, politeness, and the democratic potential of online political discussion groups. New Media & Society, 6(2):259–283.
- Rains et al. (2017) Stephen A Rains, Kate Kenski, Kevin Coe, and Jake Harwood. 2017. Incivility and political identity on the internet: Intergroup factors as predictors of incivility in discussions of news online. Journal of Computer-Mediated Communication, 22(4):163–178.
- Rheault et al. (2019) Ludovic Rheault, Erica Rayment, and Andreea Musulan. 2019. Politicians in the line of fire: Incivility and the treatment of women on social media. Research & Politics, 6(1).
- Ribeiro et al. (2018) Manoel Horta Ribeiro, Pedro H Calais, Yuri A Santos, Virgílio AF Almeida, and Wagner Meira Jr. 2018. Characterizing and detecting hateful users on Twitter. In International AAAI Conference on Web and Social Media (ICWSM).
- Rossini (2020) Patrícia Rossini. 2020. Beyond incivility: Understanding patterns of uncivil and intolerant discourse in online political talk. Communication Research.
- Shvets et al. (2021) Alexander Shvets, Paula Fortuna, Juan Soler, and Leo Wanner. 2021. Targets and aspects in social media hate speech. In Proceedings of the 5th Workshop on Online Abuse and Harms (WOAH 2021).
- Skytte (2021) Rasmus Skytte. 2021. Dimensions of elite partisan polarization: Disentangling the effects of incivility and issue polarization. British Journal of Political Science, 51(4):1457–1475.
- Snow et al. (2008) Rion Snow, Brendan O’connor, Dan Jurafsky, and Andrew Y Ng. 2008. Cheap and fast–but is it good? Evaluating non-expert annotations for natural language tasks. In Proceedings of the Conference on Empirical Methods in Natural Language Processing (EMNLP).
- Theocharis et al. (2016) Yannis Theocharis, Pablo Barberá, Zoltán Fazekas, Sebastian Popa, and Olivier Parnet. 2016. A bad workman blames his tweets: The consequences of citizens’ uncivil Twitter use when interacting with party candidates: Incivility in interactions with candidates on Twitter. Journal of Communication, 66.
- Theocharis et al. (2020) Yannis Theocharis, Pablo Barberá, Zoltán Fazekas, and Sebastian Adrian Popa. 2020. The dynamics of political incivility on Twitter. SAGE Open, 10(2).
- Tong and Koller (2001) Simon Tong and Daphne Koller. 2001. Support vector machine active learning with applications to text classification. Journal of machine learning research, 2(Nov):45–66.
- Van Prooijen and Krouwel (2019) Jan-Willem Van Prooijen and André PM Krouwel. 2019. Psychological features of extreme political ideologies. Current Directions in Psychological Science, 28(2):159–163.
- Van’t Riet and Van Stekelenburg (2022) Jonathan Van’t Riet and Aart Van Stekelenburg. 2022. The effects of political incivility on political trust and political participation: A meta-analysis of experimental research. Human Communication Research, 48(2):203–229.
- Wiegand et al. (2019) Michael Wiegand, Josef Ruppenhofer, and Thomas Kleinbauer. 2019. Detection of abusive language: The problem of biased datasets. In Proceedings of the Conference of the North American Chapter of the Association for Computational Linguistics: Human Language Technologies (NAACL-HLT).
- Wojcieszak et al. (2023) Magdalena Wojcieszak, Sjifra de Leeuw, Ericka Menchen-Trevino, Seungsu Lee, Ke M Huang-Isherwood, and Brian Weeks. 2023. No polarization from partisan news: Over-time evidence from trace data. The International Journal of Press/Politics, 28(3):601–626.
- Wullach et al. (2021) Tomer Wullach, Amir Adler, and Einat Minkov. 2021. Fight fire with fire: Fine-tuning hate detectors using large samples of generated hate speech. In Findings of the Association for Computational Linguistics: EMNLP.
- Ye et al. (2017) Teng Ye, Sangseok You, and Lionel Robert Jr. 2017. When does more money work? Examining the role of perceived fairness in pay on the performance quality of crowdworkers. In Proceedings of the International AAAI Conference on Web and Social Media (ICWSM).