Aligning Language Models to User Opinions
Abstract
An important aspect of developing LLMs that interact with humans is to align models’ behavior to their users. It is possible to prompt an LLM into behaving as a certain persona, especially a user group or ideological persona the model captured during its pertaining stage. But, how to best align an LLM with a specific user and not a demographic or ideological group remains an open question. Mining public opinion surveys (by PEW research), we find that the opinions of a user and their demographics and ideologies are not mutual predictors. We use this insight to align LLMs by modeling both user opinions as well as user demographics and ideology, achieving up to 7 points accuracy gains in predicting public opinions from survey questions across a broad set of topics111Project page: https://github.com/eujhwang/personalized-llms. In addition to the typical approach of prompting LLMs with demographics and ideology, we discover that utilizing the most relevant past opinions from individual users enables the model to predict user opinions more accurately.
1 Introduction
Personality is a defining feature of human beings, shaped by a complex interplay of demographic characteristics, moral principles, and social experiences Weil (1957); McLellan (1989). In turn, a person’s personality has a significant influence on their ability to make decisions Lauriola and Levin (2001); Busic-Sontic et al. (2017). Owing to the wide-scale adaptation of the large language models (LLMs) for assisting individuals in their decision-making process Jiang et al. (2021); Gao et al. (2023a), it becomes increasingly critical to ensure that these models are aligned with the unique personalities of their users.
With lower barriers to entry, several recent works focused on prompting LLMs with persona or role-based prompts such as Pretend you are a Democrat Deshpande et al. (2023); Santurkar et al. (2023). However, the extent to which these approaches align language models with users remains unclear due to the subjective nature of defining user personas. Users have nuanced opinions that can change over time and vary depending on context. While alignment with normalized user groups like religion or political inclination may be easier, LLMs continue to struggle to align with individual users or the long tail of user groups. Additionally, LLMs tend to form opinions based on their pretraining data, as well as feedback collected from crowd workers and model designers. As a result, they exhibit low steerability, even with user groups that have major representation Santurkar et al. (2023).
Aligning LLMs to individual and long-tail opinions has received less attention, while mostly focusing on aligning to user groups. In our analysis over PEW surveys, we found that people can share all of their demographic traits but still exhibit a large variance in their opinions, rendering the current group-based LLM alignment insufficient. This paper investigates the relationship between demographic traits and individual opinions in LLM alignment. Specifically, we seek to answer the following research question:
What do we need to align an LLM to a user: demographic traits, fine-grained opinions, or both?
The majority of the past work in NLP literature focused on aligning LLMs with normalized user groups Santurkar et al. (2023); Majumder et al. (2019); Salemi et al. (2023). In social science studies, however, it has been shown that all users are unique even if they belong to the same broader user group, and normalizing user groups is not a true representative of a user’s opinion Chu et al. (2023); Kim and Lee (2023). Inspired by these social science studies, we apply the insights to an empirical setting where we try to model individuals’ opinions based on their various persona information such as demographic traits, ideological inclinations, and past opinions.
In this paper, we give a thorough analysis of public survey responses in the OpinionQA dataset Santurkar et al. (2023) with respect to their demographics, ideology, and implicit opinions and present comprehensive experimental results using the GPT3 model with various combinations of inputs (i.e., demographic, ideology, user’s past opinions). Through our dataset analysis, we found that users’ opinions and demographics do not necessarily correlate with each other. Our experimental results show incorporating both user opinions, demographics, and ideology, results in significant gains of up to 7 points in QA accuracy for certain topics, and utilizing the most relevant past opinions helps the model to pinpoint the more accurate answers for the users.
2 Related work
Personalization
Past works that focused on modeling individual users were from the pre-LLMs era and mainly hail from the recommender systems literature Gao et al. (2023b); He et al. (2017); Li et al. (2021); Majumder et al. (2019). However, these systems were trained on domain-specific annotated datasets or using latent information about the users (e.g., modeling users based on their previously written reviews which generally contain sparse information about the user). The LLMs we use today have seen less content from the long tail of user groups during their pre-training phase, and there has been a lack of large-scale datasets of individual opinions until recently Santurkar et al. (2023). Thus it remains an open problem whether LLMs can be aligned effectively with individual user persona and how different user information (e.g., demographic traits vs. past opinions) influences how well an LLM can model individual’s opinions. For a comprehensive comparison among all previous work, see Table 1.
|
User-profile
explicitly observed |
Modeling
individuals |
Requires
no training |
|
|---|---|---|---|
| Personalized generation: OpinionQA Santurkar et al. (2023), RecipeGen Majumder et al. (2019), LAMP Salemi et al. (2023) | ✗ |
✗ or ✓
(mostly group) |
✗ or ✓ |
| Recommender Systems: ChatRec Gao et al. (2023b), Collaborative Filtering He et al. (2017), BotPlay Li et al. (2021) |
✗ or ✓
(mostly latent) |
✓ |
✗ or ✓
(mostly supervised) |
| Ours | ✓ | ✓ (+ group) | ✓ |
Role of demographics and ideology
There have been several studies investigating the correlation between ideological attitudes and psychological traits Zmigrod et al. (2021); Crockett and Wallendorf (2004); Chan and Palmeira (2021). Crockett and Wallendorf (2004) analyzed the role of political ideology in consumer behavior and found that normative political ideology is central to understanding shopping as a manifestation of social and political connections. Chan and Palmeira (2021) found that the cognitive decision-making strategies of individuals reflected their ideological attitudes. Differently in our work, we show that ideology is not the only important factor in predicting the user’s opinion using an LLM.
LLMs with retrieval-based approach
Extensive prior work has used retrievals from a text corpus to aid QA Madaan et al. (2022); Pan et al. (2019), or retrievals of prior QA pairs for nearest-neighbor QA Khandelwal et al. (2020). Madaan et al. (2022) uses a memory of user opinions to retrieve past relevant data points for the prompt. Khandelwal et al. (2020) extended a pre-trained language model (LM) with a k-nearest neighbors model and showed the effectiveness of the nearest neighbor search for language modeling. Our work builds upon those ideas. Differently from work on LLMs and user group level personalization, we show that LLMs can be tuned for individual users with their opinions.
| Guns | Auto | Gender | Sex. harass. | Biomed-food | Gender | 2050 US | Trust-Science | |
|---|---|---|---|---|---|---|---|---|
| Similar op. user pair | 45 | 13 | 30 | 12 | 11 | 37 | 23 | 21 |
| Similar op. & ideol. | 19 | 18 | 21 | 30 | 19 | 24 | 20 | 20 |
| Similar op. & diff. ideol. | 81 | 82 | 79 | 70 | 81 | 76 | 80 | 80 |
| Race | Misinfo. | Privacy | Family |
Econ.
Inequal. |
Global
Attitudes |
Politics | ||
| Similar op. user pair | 12 | 29 | 21 | 43 | 25 | 24 | 16 | |
| Similar op. & ideol. | 30 | 20 | 17 | 19 | 25 | 33 | 40 | |
| Similar op. & diff. ideol. | 70 | 80 | 83 | 81 | 75 | 67 | 60 |
3 What makes a persona?
We present a study on various components that makes a personality (in short, persona) of a user. We use the OpinionQA dataset, which contains 15 topics, and each topic contains an average of 100 questions and 5340 users Santurkar et al. (2023).
3.1 Demographics
The dataset records eight demographic information of a user: region, sex, age, education, race, citizen, marital status, and income. These are the markers of social experience that a user is most likely to go through. For example, the social experience can be determined by the region a user belongs, or their age determines whom they socialize with on a regular basis. However, this runs with the risk of stereotyping (i.e., an old individual is less likely to mix with younger people or they are conservative in thinking). We later show that demographic information is not enough to model an individual.
3.2 Ideology
Ideology is formed by an individual understanding of politics and economics. In our dataset, we have each subject’s political affiliation and inclinations toward well-known political ideologies (e.g., conservative, liberal). We use this information as an individual’s ideology.
3.3 Opinions
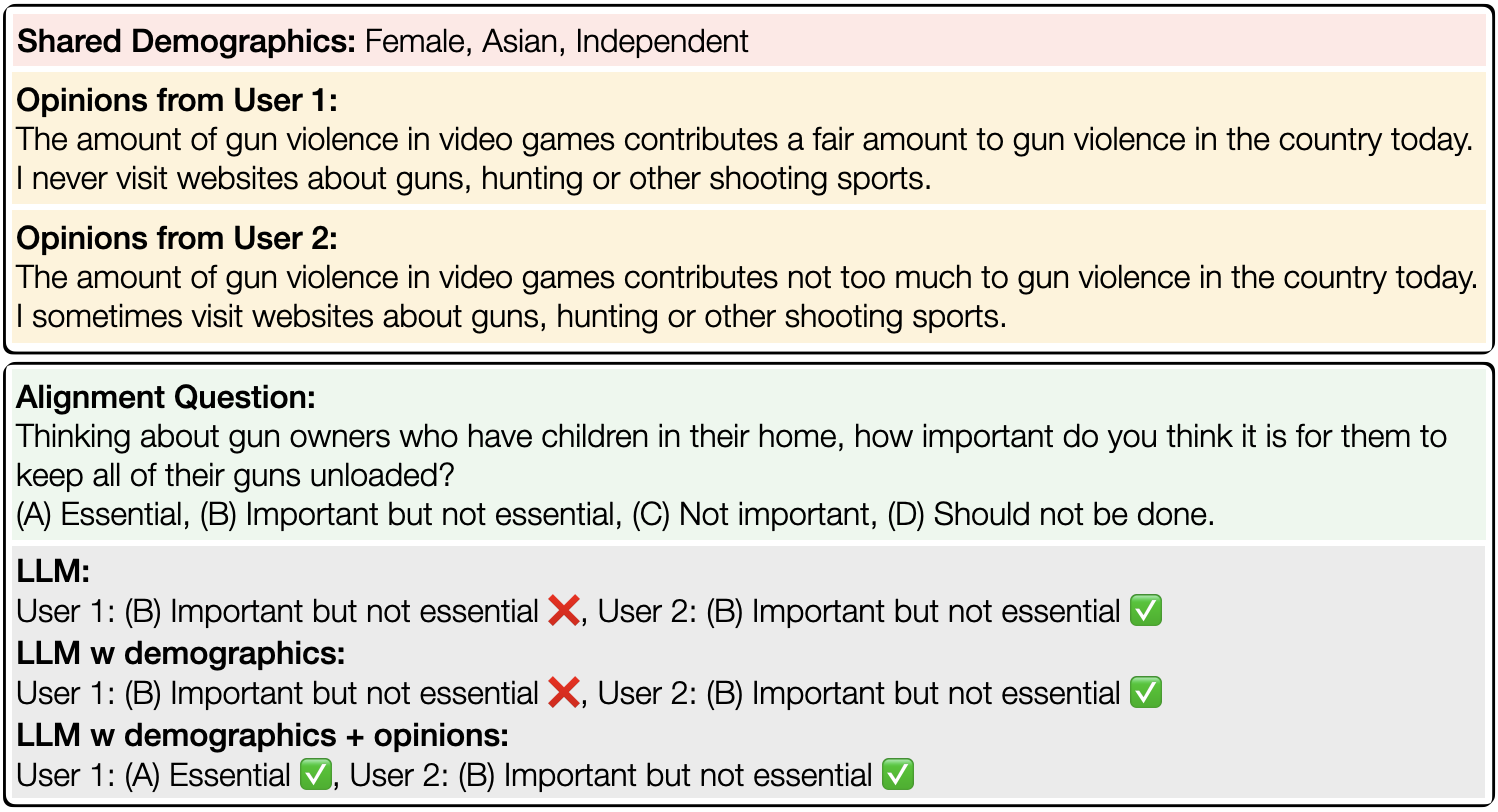
OpinionQA uses a well-established method of capturing human opinions from public opinion surveys. In these surveys, subjects are asked to answer subjective questions that reflect their unique opinions and what makes them different from other individuals. Figure 1 shows an example of opinions that a user provided during a survey.
3.4 Deriving insights from public surveys
We derive insights from the OpinionQA dataset, where we analyze the degree of agreement in user’s opinions where they same demographics and how this agreement varies across topics. This statistical analysis generates useful insights that we later use for our modeling approach. We also look for similar (dis)agreements in opinions when users have the same ideologies.
Opinions differ despite the same demographics
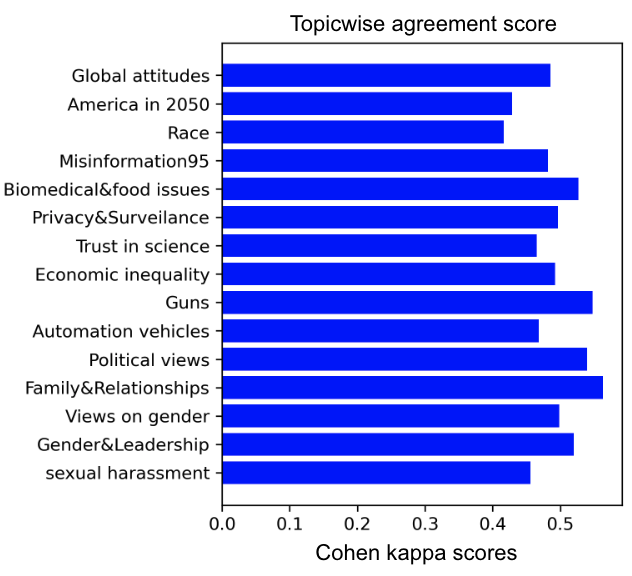
We first take all pairs of users sharing the same demographics and compare their opinions. To calculate the agreement score between users, we utilize Cohen’s kappa coefficient Cohen (1960), which ranges from to . Even though two users share the same demographics, agreement scores on the implicit opinions are gathered around 0.5 (Figure 2). This shows that solely relying on demographic information is not enough to personalize the model, and users’ implicit opinions can play a critical role in personalization.
Opinions differ across topics
In Figure 2, we also show the topic-wise agreement scores. On certain topics, including Family & Relationships and Guns, users exhibit relatively higher agreement scores. On the other hand, for some topics, including Race and America in 2050, users have lower agreement scores, indicating that certain topics may have larger variability in terms of user opinions. We later analyze if this variability appears in a model’s predictive performance when it is used to predict user opinions across different topics.
Opinions differ despite same ideology
To analyze the correlation between user opinions and their ideology, we extract user pairs that two users who answered at least more than 10 common questions and compare their opinions and political ideologies. Table 2 shows the percentage of user pairs sharing similar opinions, where 70% of opinions are matched between two users, and the percentages of the same ideologies and different ideologies within those user pairs. We observe that even though the users have similar opinions, around 80% of the user pairs have different ideologies. In contrast, we observe the percentage of sharing similar opinions among the users having similar ideologies is relatively higher than the percentage of sharing similar ideologies among the users having similar opinions in Appendix 6. This implies that while having similar opinions does not necessarily imply shared ideologies among users, the presence of similar ideologies may suggest that users are more likely to have similar opinions. We particularly notice this phenomenon on the Guns and Family topics, as highlighted in Table 2. While the percentage of user pairs with shared opinions is higher compared to other topics, the percentage of user pairs with differing ideologies within these pairs is notably higher than the percentage of user pairs with similar ideologies.
Based on the insights derived above, we incorporate them in our modeling approaches and analyze if these translate to the predictive performance of a model when used to predict user opinions as collected from the surveys.
4 Aligning LLMs with persona
In this section, we detail our task, possible modeling approaches, and evaluation protocols in Section 4.1 and discuss how to select the most relevant past opinions of a user in Section 4.2.
4.1 Setup
Task
We use LLMs to model a user; however, to concretely measure the performance, we use a simple question-answering (QA) setup. For our QA task, we use existing questions from the surveys and try to predict the choice from multiple-choice originally given to the subjects. We use a prompting-based zero-shot approach to perform the multiple-choice QA. We use text-davinci-003 as the LLM.
Modeling Approaches
We sample 100 users per topic. 20% of implicit questions belonging to the specific user are used as the user’s implicit persona, and the rest are used to test the model’s personalization ability. We have the following variants of our model where the model is gradually exposed to different levels of user information: demographic, ideological information, and user past opinions. Here is a rough sketch of what a prompt would contain for each modeling variation:
-
1.
no persona: this is a case where default LLM opinion is evaluated w.r.to the individual’s opinion Santurkar et al. (2023).
-
2.
ideology: here, we observe if ideological inclinations from the user help the model to align better to them Santurkar et al. (2023).
-
3.
ideology + demographics: here, we observe if both demographic information and ideological inclinations from the user help the model to align better with them Santurkar et al. (2023).
-
4.
ideology + opinions: we combine ideological inclinations and opinions and measure if these help the model to align better with an individual.
-
5.
demographic + ideology + opinions: here, we observe when we combine all possible personal information, i.e., demographic, ideology, and opinions, and measure if these help the model to align better with an individual. See Figure 3 for the complete prompt.
Evaluation Metric
For evaluation, we utilize two types of accuracy measures, overall accuracy and collapsed accuracy. For overall accuracy, we simply calculate the accuracy of the precited answer choice with respect to the gold answer choice from the dataset. We also present collapsed accuracy because most answer choices in the opinion QA dataset have around 3 to 4 classes. In cases where there are more than 4 classes, it is possible to further group the classes into superclasses without losing substantial finer information. For example, the following answer choices: [Very likely, Somewhat likely, Not too likely, Not at all likely], can be grouped into [Likely, Unlikely]. We consolidate such answer choices into two classes, referred to as collapsed accuracy, and present the results accordingly.
4.2 LLM as a person with ideologies, demographic, and opinions
| Model | Exact match | Collapsed match |
|---|---|---|
| no persona | 0.430.01 | 0.620.01 |
| demographic + ideology | 0.470.01 | 0.650.01 |
| demographic + ideology + all opinions | 0.510.01 | 0.690.01 |
| ideology + top-8 opinions | 0.530.01 | 0.690.01 |
| demographic + top-8 opinions | 0.530.01 | 0.690.01 |
| demographic + ideology + top-3 opinions | 0.530.01 | 0.690.01 |
| top-3 opinions | 0.510.01 | 0.670.01 |
| top-8 opinions | 0.520.01 | 0.680.01 |
| demographic + ideology + top-8 opinions | 0.540.01 | 0.700.01 |
Our main goal is to use different components of a user’s persona (demographics, ideology, opinions) to align an LLM with an individual. Specifically, by having two experiments, one with past opinions+ideology and the other with past opinions+ideology+demographics, we aim to analyze the role of demographics when predicting user responses. In addition, we hypothesize that giving users’ past opinions may offer useful insights into their perspective (followed from Table 2), and LLM can benefit from that information when predicting the future answer for the specific user. When adding the user’s past opinions, we compare the model with all opinions (maximum 16) to the model with top- opinions ( is a hyperparameter ). The top- opinions are obtained by comparing the embedding similarity between the user’s previous opinions and the question at hand, where we employ text-embedding-ada-002 to obtain the embeddings. We hypothesize that all opinions may incorporate some unrelated viewpoints to answer the question, and hence offering more pertinent opinions would enhance the model’s ability to accurately anticipate its future response for the user. Figure 3 shows a complete prompt where use all available past information of individuals to predict their future opinions. Other modeling approaches noted in Section 4.1 have ablated versions of this prompt according to their descriptions given (see Appendix A).
5 Results and Analysis
Here, we first analyze our model variants (Section 5.1) to validate hypotheses that we gather from analyzing the dataset (in Section 3.4). We also provide our model’s performance when we use a similar modeling setup to predict group-level opinions in Sections 5.2 and 5.3.
5.1 LLM for an individual
Here we discuss the results of using an LLM to model an individual in the light of the evaluation metrics described in Section 5.1.
Exact match vs. Collapsed match
The accuracy with the exact match and with the collapsed match in Table 3 and Table 4 shows a similar trend for the performance of our model variants. Especially with topic-wise collapsed accuracy in Table 4, the model variant that incorporates demographic information and user’s past opinions outperforms in most topics, exhibiting a more substantial margin compared to the variant that solely incorporates demographic information. This suggests that leveraging implicit opinions enables the model to align with the correct range of answer choices, even though it does not precisely predict the exact same answer as the user’s choice.
Overall Accuracy
Table 3 presents overall QA accuracy with exact match and collapsed match for answer choices. Adding demographic and ideology information outperforms the model without any persona, indicating that some questions might be highly correlated with the user’s demographics, and LLM is able to make a guess with the demographic information. Incorporating the user’s previous opinions, up to 16 in total, along with demographic information, substantially enhances the performance in both overall and collapsed accuracy. This implies that users’ past opinions are indeed important to make correct predictions.
Interestingly, utilizing the top- most relevant previous opinions does not yield a significant increase in collapsed accuracy. However, it does improve the exact match accuracy by up to 3 points when using both demographics and ideology along with the user’s previous opinions. This implies that having top-k most relevant past opinions can help the model pinpoint more accurate answers, and providing the user’s past opinions is already pushing the model to be in the correct range of the answer choices. We noticed that utilizing the top-3 opinions yields similar performance to using the top-8 opinions, indicating that a few of the most relevant opinions carry the most performance improvement of the model. Moreover, simply using the top 3 most relevant opinions performs on par with the model with user demographic, ideology, and user’s past 16 random opinions. This confirms again that utilizing the most relevant opinions as feedback is essential to get personalized answers from LLM. Lastly, providing additional demographic information with ideology slightly improves the model performance, implying that the demographic information may contribute valuable insights to the model to a certain degree.
| Accuracy with exact match | |||
|---|---|---|---|
| no-persona | demo. + ideo. | demo. + ideo.+ top8 op. | |
| Guns | 0.40 | 0.51 | 0.63 |
| Automation | 0.44 | 0.49 | 0.48 |
| Views on gender | 0.43 | 0.44 | 0.57 |
| Sexual harassment | 0.40 | 0.44 | 0.47 |
| Biomedical, food | 0.51 | 0.55 | 0.60 |
| Gender, Leadership | 0.50 | 0.45 | 0.59 |
| America in 2050 | 0.43 | 0.41 | 0.46 |
| Trust in science | 0.52 | 0.50 | 0.59 |
| Race | 0.38 | 0.42 | 0.51 |
| Misinformation | 0.48 | 0.48 | 0.54 |
| Privacy, Surveillance | 0.36 | 0.42 | 0.51 |
| Family, Relationships | 0.46 | 0.49 | 0.57 |
| Economic inequality | 0.38 | 0.47 | 0.55 |
| Global attitudes | 0.38 | 0.44 | 0.48 |
| Political views | 0.41 | 0.51 | 0.52 |
Topic-wise Accuracy
Table 4 demonstrates the model’s accuracy across different topics with various input sources, measured by exact match and collapsed match for answer choices. The model with demographic and implicit opinions particularly achieves higher scores on the Biomedical-food and Guns topics, implying that these two topics may lead the users to have similar opinions of each other. In contrast, the model exhibits slightly decreased performance when incorporating implicit opinions on topic Automation. This suggests that the LLM can make accurate predictions up to some extent based on user demographic and ideology information. However, incorporating implicit opinions, which may include viewpoints not aligned with users’ demographic or ideologies, can potentially confuse the model in its prediction process.
Common Errors
Figure 4 is one of the most common errors when adding implicit opinions confuses the model. While the model makes a correct guess based on the person’s demographic information for the question, after seeing implicit opinions having “does not describe me well" that are also contained in the question’s answer choices, the model got confused and makes an incorrect prediction.
Question:
How well, if at all, do the following words or phrases describe you? Supporter of the Black Lives Matter movement
Choices:
Describes me well
Does not describe me well
Refused
Opinions:
The words or phrases "supporter of rights for LGBT people" do not describe me well.
…
Demographics and Ideology:
Political party: Democrat,
Race: Black,
Religion: Protestant,
…
User-answer (expected): Describes me well
Demo.-ideology-opinions: Does not describe me well ✗
Demo.-ideology: Describes me well ✓
5.2 LLM with majority answer choices
Additionally, we also wanted to understand if similar performances can be achieved if we model an individual as a member of a (sub-)population, mirroring Santurkar et al. (2023). For this, we first merge our QA data points using a particular ideological group value (e.g., democrat) and obtain the answer choice that is chosen by most of the group members (i.e., a majority vote) and treat that answer as the gold answer for the question while calculating the accuracy Kim and Lee (2023).
We prompt our model to predict an answer given a question assuming the role of a group representative, i.e., a person having a majority vote answers belonging to a specific group. The prompt that we used for this experiment can be found in Appendix A.
We see that the LLM is good at predicting the answer given by the majority of the group member belonging to a certain ideology, suggesting that LLMs are good at modeling a representative individual of a sub-population (e.g., all democrats). The overall performance without ideology information is 0.549 (with exact answer choice match) and 0.659 (with collapsed answer choice match), as presented in Table 5. This also indicated that the default opinions from the LLMs are somewhat aligned with the majority opinions seen at a population level.
| Exact match | Collapsed match | |
|---|---|---|
| Majority answer | 0.549 | 0.659 |
| Independent | 0.546 | 0.674 |
| Democrat | 0.578 | 0.665 |
| Republican | 0.523 | 0.639 |
| Avg overall | 0.566 | 0.667 |
5.3 LLM as a person with an ideology
We continue the same exercise, but we add the ideological information to see if this additional information can help the LLM perform better to model a user belonging to a group that believes in a specific ideology (e.g., conservative). The prompt that we used for this experiment can be found in Appendix A. We find that the LLM is moderately good at modeling a user with group-level information to predict the group-level majority opinion. This indicates that the additional ideological information is not particularly helpful. The overall performance with ideology information is 0.566 (with exact answer choice match) and 0.667 (with collapsed answer choice match), as shown in Table 5. We see a similar trend in results for modeling an individual with their demographics and/or ideology and/or past opinions since an individual’s opinion does not align with the group’s majority opinion that the person belongs to.
6 Discussion and Conclusion
An aligned LLM offers the benefit to offer personalized perspectives that align with a user’s values, and cultural beliefs. However, there exist circumstances when LLMs can become an amplifier for unethical and biased views.
Ethical concerns
With an aligned LLM, users can select information that adheres to their system of beliefs and to amplify potentially biased and unethical views. Such an echo chamber Del Vicario et al. (2016) can eventually cause harm by reinforcing undesirable or polarized a user’s views.
A viable mitigation is to show user demography or ideology group answers in addition to the personalized answer (e.g., showing how an average Democrat with similar demographics would think on this topic and why). Further, past opinions can be used to ground an explanation (e.g., the current personalized answer is influenced by a user’s specific past opinion), thus offering an opportunity for the user to introspect their past opinions.
Extensions
Our work lays the foundation for a robust LLM alignment approach. By using memory-based personalization and recording interactions saved in a growing memory, the model can inform future instances of the most relevant past opinions. Further, the interaction between demographics and opinions can be made seamless with a simulated annealing method that increasingly relies on user opinions as the memory grows and backs off to the group level/demographics-based opinion.
Conclusion
This paper offers a new insight that aligning LLMs to users is best done by modeling user demographics, ideologies, and the most relevant past opinions. Large-scale experiments on PEW surveys present in the OpinionQA dataset show an approximately 7% absolute QA accuracy over strong demography-based baselines. We proactively offer suggestions to avoid personalized LLMs from becoming echo chambers. An exciting future direction is to continuously store user opinions and grow the memory of opinions.
Acknowledgements
We thank the members of the Aristo team at AI2 and Kurt Gray for their insightful feedback on this work. EH was funded, in part, by the Vector Institute for AI, Canada CIFAR AI Chairs program, an NSERC discovery grant, and a research gift from AI2. BPM was funded, in part, by an Adobe Research Fellowship.
References
- Busic-Sontic et al. (2017) Ante Busic-Sontic, Natalia V Czap, and Franz Fuerst. 2017. The role of personality traits in green decision-making. Journal of Economic Psychology, 62:313–328.
- Chan and Palmeira (2021) Eugene Y. Chan and Mauricio Palmeira. 2021. Political ideology moderates consumer response to brand crisis apologies for data breaches. Computers in Human Behavior, 121:106801.
- Chu et al. (2023) Eric Chu, Jacob Andreas, Stephen Ansolabehere, and Deb Roy. 2023. Language models trained on media diets can predict public opinion.
- Cohen (1960) Jacob Cohen. 1960. A coefficient of agreement for nominal scales. Educational and Psychological Measurement, 20:37 – 46.
- Crockett and Wallendorf (2004) David Crockett and Melanie Wallendorf. 2004. The role of normative political ideology in consumer behavior. Journal of Consumer Research, 31:511–528.
- Del Vicario et al. (2016) Michela Del Vicario, Gianna Vivaldo, Alessandro Bessi, Fabiana Zollo, Antonio Scala, Guido Caldarelli, and Walter Quattrociocchi. 2016. Echo chambers: Emotional contagion and group polarization on facebook. Scientific reports, 6(1):37825.
- Deshpande et al. (2023) Ameet Deshpande, Vishvak Murahari, Tanmay Rajpurohit, Ashwin Kalyan, and Karthik Narasimhan. 2023. Toxicity in chatgpt: Analyzing persona-assigned language models. arXiv preprint arXiv:2304.05335.
- Gao et al. (2023a) Yunfan Gao, Tao Sheng, Youlin Xiang, Yun Xiong, Haofen Wang, and Jiawei Zhang. 2023a. Chat-rec: Towards interactive and explainable llms-augmented recommender system. arXiv preprint arXiv:2303.14524.
- Gao et al. (2023b) Yunfan Gao, Tao Sheng, Youlin Xiang, Yun Xiong, Haofen Wang, and Jiawei Zhang. 2023b. Chat-rec: Towards interactive and explainable llms-augmented recommender system.
- He et al. (2017) Xiangnan He, Lizi Liao, Hanwang Zhang, Liqiang Nie, Xia Hu, and Tat-Seng Chua. 2017. Neural collaborative filtering.
- Jiang et al. (2021) Liwei Jiang, Jena D. Hwang, Chandra Bhagavatula, Ronan Le Bras, Maxwell Forbes, Jon Borchardt, Jenny Liang, Oren Etzioni, Maarten Sap, and Yejin Choi. 2021. Delphi: Towards machine ethics and norms. ArXiv, abs/2110.07574.
- Khandelwal et al. (2020) Urvashi Khandelwal, Omer Levy, Dan Jurafsky, Luke Zettlemoyer, and Mike Lewis. 2020. Generalization through memorization: Nearest neighbor language models. In International Conference on Learning Representations.
- Kim and Lee (2023) Junsol Kim and Byungkyu Lee. 2023. Ai-augmented surveys: Leveraging large language models for opinion prediction in nationally representative surveys.
- Lauriola and Levin (2001) Marco Lauriola and Irwin P Levin. 2001. Personality traits and risky decision-making in a controlled experimental task: An exploratory study. Personality and individual differences, 31(2):215–226.
- Li et al. (2021) Shuyang Li, Bodhisattwa Prasad Majumder, and Julian McAuley. 2021. Self-supervised bot play for conversational recommendation with justifications.
- Madaan et al. (2022) Aman Madaan, Niket Tandon, Peter Clark, and Yiming Yang. 2022. Memory-assisted prompt editing to improve GPT-3 after deployment. In Proceedings of the 2022 Conference on Empirical Methods in Natural Language Processing, pages 2833–2861, Abu Dhabi, United Arab Emirates. Association for Computational Linguistics.
- Majumder et al. (2019) Bodhisattwa Prasad Majumder, Shuyang Li, Jianmo Ni, and Julian McAuley. 2019. Generating personalized recipes from historical user preferences. In Proceedings of the 2019 Conference on Empirical Methods in Natural Language Processing and the 9th International Joint Conference on Natural Language Processing (EMNLP-IJCNLP), pages 5976–5982, Hong Kong, China. Association for Computational Linguistics.
- McLellan (1989) David McLellan. 1989. Simone Weil: utopian pessimist. Springer.
- Pan et al. (2019) Xiaoman Pan, Kai Sun, Dian Yu, Jianshu Chen, Heng Ji, Claire Cardie, and Dong Yu. 2019. Improving question answering with external knowledge. In Proceedings of the 2nd Workshop on Machine Reading for Question Answering, pages 27–37, Hong Kong, China. Association for Computational Linguistics.
- Salemi et al. (2023) Alireza Salemi, Sheshera Mysore, Michael Bendersky, and Hamed Zamani. 2023. Lamp: When large language models meet personalization.
- Santurkar et al. (2023) Shibani Santurkar, Esin Durmus, Faisal Ladhak, Cinoo Lee, Percy Liang, and Tatsunori Hashimoto. 2023. Whose opinions do language models reflect? ArXiv, abs/2303.17548.
- Weil (1957) Simone Weil. 1957. Écrits de Londres et dernières lettres. Gallimard.
- Zmigrod et al. (2021) Leor Zmigrod, Ian Eisenberg, Patrick Bissett, Trevor Robbins, and Russell Poldrack. 2021. The cognitive and perceptual correlates of ideological attitudes: A data-driven approach. Philosophical Transactions of the Royal Society B: Biological Sciences, 376:20200424.
Appendix A Prompt
We provide a comprehensive display of all prompts used in the models incorporating user demographics, ideology, and opinions, which were employed for individual-user level tests in Figure 5 and 6. Additionally, we present the prompts utilized for experiments conducted at the group-level tests in Figure 7 and 8.
A person has the following opinions on Guns.
Opinions:
1. The person used air guns, such as paintball, BB or pellet guns, sometimes when they were growing up.
2. The ease with which people can illegally obtain guns contributes a great deal to gun violence in the country today.
3. I attend gun shows sometimes.
4. I worry a little about having a personal health crisis.
5. People in my local community tend to look at most gun owners in a positive way.
6. Sport shooting, including target shooting and trap and skeet, was a reason why there were guns in my household when I was growing up.
7. The most important reason why I own a gun is for sport shooting, including target shooting and trap and skeet.
8. I sometimes visit websites about guns, hunting, or other shooting sports.
Based on the above list of opinions, which answer choice will this person select for the question:
Question: Thinking about gun owners who do not have children in their home how important do you think it is for them to: Take gun safety courses
Answer choices:
A.Essential
B.Important but not essential
C.Not important
D.Should not be done
E.Refused
Answer:
A person can be described as follows:
Age: 30-49
Citizenship: Yes
Region: South
Education: Postgraduate
Income: 100,000
Marital status: Never been married
Political ideology: Conservative
Political party: Republican
Race: White
Religion: Roman Catholic
Frequency of religious attendance: A few times a year
Gender: Male
Based on the demographic information, which answer choice will this person select for the question:
Question: Thinking about gun owners who do not have children in their home how important do you think it is for them to: Take gun safety courses
Answer choices:
A.Essential
B.Important but not essential
C.Not important
D.Should not be done
E.Refused
Answer:
Thinking of yourself as a [republican/independent/democrat], please select the right choice.
ques
Choice: ["choice1", "choice2", "choice3"]
Thinking of yourself as a person, please select the right choice.
ques
Choice: ["choice1", "choice2", "choice3"]
Appendix B Similar ideologies and different opinions
We show the percentage of user pairs having similar ideologies and the percentages of user pairs having similar opinions and different opinions within the user pairs sharing similar ideologies in Table 6.
| Topic | similar ideol. user pair (%) | similar ideol. & op. (%) | similar ideol.-diff. op. (%) |
|---|---|---|---|
| Guns | 16.05 | 52.67 | 47.33 |
| Automation | 15.99 | 15.26 | 84.74 |
| Views on gender | 16.26 | 39.58 | 60.42 |
| Sexual harassment | 16.95 | 22.14 | 77.86 |
| Biomedical, food | 15.69 | 13.44 | 86.56 |
| Gender, Leadership | 17.52 | 50.25 | 49.75 |
| America in 2050 | 15.34 | 30.21 | 69.79 |
| Trust in Science | 15.53 | 26.27 | 73.73 |
| Race | 16.32 | 21.05 | 78.95 |
| Misinformation | 16.22 | 34.83 | 65.17 |
| Privacy, Surveillance | 16.13 | 22.14 | 77.86 |
| Family, Relationships | 17.01 | 48.88 | 51.12 |
| Economic inequality | 16.24 | 39.25 | 60.75 |
| Global attitudes | 16.75 | 47.78 | 52.22 |
| Political views | 16.65 | 37.59 | 62.41 |