The State of the Art in Creating Visualization Corpora
for Automated Chart Analysis
Abstract
We present a state-of-the-art report on visualization corpora in automated chart analysis research. We survey 56 papers that created or used a visualization corpus as the input of their research techniques or systems. Based on a multi-level task taxonomy that identifies the goal, method, and outputs of automated chart analysis, we examine the property space of existing chart corpora along five dimensions: format, scope, collection method, annotations, and diversity. Through the survey, we summarize common patterns and practices of creating chart corpora, identify research gaps and opportunities, and discuss the desired properties of future benchmark corpora and the required tools to create them. {CCSXML} <ccs2012> <concept> <concept_id>10010147.10010257</concept_id> <concept_desc>Computing methodologies Machine learning</concept_desc> <concept_significance>500</concept_significance> </concept> <concept> <concept_id>10003120.10003145</concept_id> <concept_desc>Human-centered computing Visualization</concept_desc> <concept_significance>500</concept_significance> </concept> </ccs2012>
\ccsdesc[500]Computing methodologies Machine learning \ccsdesc[500]Human-centered computing Visualization
\printccsdesc1 Introduction
Recent advances in automated chart analysis techniques [LWW∗22, CWH∗21, BDM∗18, DD19, KAM∗18, PH17] seek to enable more effective retrieval, interpretation, creation, and transformation of data visualizations. Typically, these research efforts require a corpus of charts collected from the wild. Such corpora are essential for developing and evaluating chart analysis methods, and for providing real-world examples that end users can modify and repurpose.
There has been, however, little research on 1) the common practices for creating the corpora, 2) what constitutes a good chart corpus for various tasks and applications, and 3) the potential pitfalls and gaps in existing corpus-based research for automated chart analysis. Based on our preliminary observation, many relevant papers do not use corpora contributed by prior work; instead, they build their own corpora. There are many possible reasons for this: previous corpora are not publicly available [DSD∗20], the corpora are not of high quality [LLJ∗20], the corpora do not have the labels required for specific tasks, or the existing corpora do not contain visualizations representing the desired design space. The current state of corpora creation and usage seems ad hoc, making it difficult to compare chart analysis techniques, measure scientific progress, and identify unsolved research problems.
This survey aims to contribute a comprehensive understanding of the state of the art in creating corpora for automated chart analysis research. By “chart” we refer to two-dimensional statistical data graphics or infographics without 3D effects We collect 56 research papers from areas including AI, HCI, NLP, and Visualization that either contribute a new chart corpus, or a technique or system that takes charts in a corpus as inputs, or a model trained on a corpus. We first identify the automated chart analysis tasks along three dimensions: why (the goal), how (the method), and what (the outputs). We then extract five main properties of chart corpora used in these research works: chart format, corpus scope, collection method, annotations, and diversity. Along these task dimensions and corpus properties, we present results on the current patterns and practices of corpora creation and usage. Through the survey, we identify research gaps and opportunities in corpus-based automated chart analysis, recommend desired properties of new corpora to be created to support the research investigations, and discuss research ideas on tools and methods for creating the desired benchmark corpora.
1.1 Related Surveys
To the best of our knowledge, there is no comprehensive survey on the corpora used in automated chart analysis. Two surveys, AI4VIS [WWS∗21] and ML4VIS [WCWQ21], have reviewed current literature on AI-empowered and ML-based approaches for data visualization, respectively. However, both focus on categorizing tasks or techniques and do not discuss the impacts of corpora. Also, most works included in the two surveys are based on machine learning and neural networks; thus other heuristics-based approaches may be missing there.
The most relevant discussions were found in Deng et al. [DWS∗22] and Davila et al. [DSD∗20]. The former provides a general review of existing visualization corpora to motivate their goal of creating a new one, and the latter describes the different levels of automation observed in chart corpora creation; an in-depth analysis of corpus properties, however, is not included. This STAR will fill the gap by describing the property space of chart corpora in detail, identifying standard practices of creating corpora, establishing guidelines for the curation process, and suggesting research problems that can benefit from high-quality reusable corpora.
2 Survey Methods
In this section, we describe the search criteria and process, our coding process, and the analysis method.
2.1 Search Criteria and Process
We first started with the papers included in two recent surveys on artificial intelligence approaches [WWS∗21] and machine learning methods [WCWQ21] for data visualization. Both surveys cover publications from a variety of disciplines, such as Visualization, Human-Computer Interaction (HCI), Artificial Intelligence (AI), and Natural Language Processing (NLP). We chose these two surveys as our starting point to collect relevant papers that contribute or adopt chart corpora because (1) many works covered in these two surveys introduce techniques or systems to create, analyze, or reason about charts, thus requiring visualization corpora; and (2) the methods or models presented in these papers include classic ML techniques (such as random forest [BS16] and support vector machine [CV95]), modern neural networks (including graph neural networks [WPC∗20]), and heuristics-based algorithms, which impose varying requirements on the desired corpora. Starting from these two collections allows us to form an initial set of diverse chart corpora. Specifically, we set three criteria to filter papers in the two repositories based on the scope of this survey defined in the introduction:
-
1.
The primary contribution of the paper is either a chart corpus (e.g., Jobin et al. [JMJ19] and Kahou et al.[KAM∗18]), or a technique or system that takes the collected charts as inputs (e.g., Savva et al. [SKC∗11]), or a model trained on the collected charts (e.g., Cui et al. [CZW∗19]). We thus did not include papers like VizNet [HGH∗19] and the work by Haehn et al.[HTP18] because the former introduced a corpus of data tables, and the latter presented an empirical study instead of a system or technique.
-
2.
The corpus is described explicitly in the paper or supplementary materials. We used keywords including bitmap, svg, dataset, corpus, training, crawl, search to search for descriptions for a corpus within each paper. This criterion allows us to obtain first-hand accurate information from the authors about their corpora, the original descriptions of which would serve as the foundation of the subsequent coding and analysis processes.
-
3.
The corpus consists of 2-dimensional static charts or infographics. We exclude 3D visualizations such as scientific visualizations because generating and analyzing such visualizations lead to very different research problems and outputs [WWS∗21, XOW∗20]. Corpora containing scientific equations [LWH17], color ramps [SWS19] and hand-drawn sketches [MMG∗20] were also excluded.
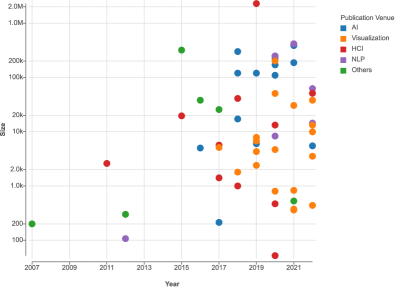
Following these three criteria, we obtained an initial set of 41 papers that introduce visualization corpora. We then applied one round of relation-search approach [ML17] (i.e., graph traversal over the citation and reference networks [HBL∗19]), to augment the initial paper set. During this process, the above three criteria were still enforced. To focus on the latest development in chart corpora and be consistent with the initial paper set’s year range, we did not include papers published before 2007. This procedure added 15 more papers, resulting in a final set of 56 chart corpora. In Figure 1, we show an overview of collected 56 corpora in terms of corpus size, publication venue, and year. It can be seen that recent corpora tend to have large sizes, and the three most frequent publication venues are Visualization, AI, and HCI.
We acknowledge that although the search criteria are clearly defined, our manual search has limitations. It is possible that some related papers are not included. However, unlike most state-of-the-art survey articles that discuss and analyze visualization techniques, our goal is to summarize current practices in creating corpora for automated chart analysis. Thus, instead of exhaustively finding all the qualified visualization corpora, a sufficiently diverse sample can allow us to perform a comprehensive analysis.
2.2 Coding and Analysis
Our analysis starts with investigating why and how the corpora are used in these papers. Specifically, we identify the research tasks presented in each paper, which dictate the curation of the corpus (e.g., what chart types and visual styles to collect and what kinds of labels or annotations are needed). For example, the primary goal of Revision [SKC∗11] was to perform chart type classification and chart redesign; it thus collected 10 types of single-view visualizations and required labels on chart type and text element position. The model or technique used in a paper also influences aspects of corpus curation such as the format of the input charts. For example, Li et al. [LWW∗22] proposed a two-thread neural network model which takes both the bitmap and SVG representations of a chart, and Data2Vis [DD19] used a sequence-to-sequence recurrent neural network model which takes a chart in the Vega-Lite specification representation. To this end, we follow the well-established what-why-how dimensions to categorize tasks introduced in the collected papers across three levels:
Why: the goal. This task level describes the purpose and applications of automated chart analysis.
How: the method. This task level describes the techniques or mechanisms to analyze a chart. Oftentimes multiple techniques are used in conjunction to achieve a goal.
What: the output. This task level describes the outputs of chart analysis methods. They can be at a holistic level (e.g., chart type), or at a finer granularity (e.g., elements such as axis and encodings).
We further identify five key properties of visualization corpora that are frequently included in the authors’ descriptions and are most important to the above three-level tasks:
-
•
Format refers to the file type of charts in a corpus, which includes bitmap graphics (.jpeg, .png), vector graphics (.svg), and programs (e.g., Vega-Lite specification).
-
•
Scope refers to the selection criteria and assumptions about the charts in a corpus. These are usually specified to constrain the research problem space.
-
•
Collection method specifies how a corpus was collected, which is influenced by both Format and Scope.
-
•
Annotations are labels associated with charts, serving as ground truth for automated chart analysis tasks.
-
•
Diversity measures how much the charts differ from one another within a corpus.
For each task level and each corpus property, we adopted a bottom-up coding approach. One author first performed the following two coding jobs: (1) categorizing and labeling the task levels and property dimensions, during which the corresponding taxonomies were built iteratively, and (2) recording chart corpus descriptions from surveyed papers for each corpus property. Labels for new-coming papers or corpora were verified to see if they fit into existing categories, and if not, both authors discussed together to verify again and establish an alternative task if needed. After this first round of paper and corpora coding, both authors examined the coding results; whenever conflicts of understanding arose, the two authors proceeded to discuss the cases until reaching a consensus for every paper and corpus. Our supplemental materials contain the details of our analysis, with quotes from the papers to demonstrate the validity of the coding.
Our final coding results are presented in Table 1, where the rows represent surveyed papers (corpora) grouped by their task goals, and the columns represent methods, outputs, and corpora properties. Section 3 includes the descriptions for the fine-grained categorizations of the task taxonomy and the corpus proprieties. The size and public link (if any) of each chart corpus are also included.
| Modern Neural Network | Classic machine learning | Heuristics-based Algorithm | Chart Component | Synthesized Description | Derived Property | Number of Chart Types | Vector Graphics | Bitmap Graphics | Visualization Program | Reusing and Transforming | Web Crawling | Manual Curation | Computer-Aided Generation | In-house Labeling | Crowdsourcing | Template-based Generation | Automatic Extraction | ||||
| Goal | Method | Output | Corpus | Size | Link | Scope | Format | Collection Method | Annotation Method | ||||||||||||
| Create a chart corpus | [BDM∗18] | 41K | \faExternalLink | 24 | |||||||||||||||||
| [MDT∗22] | 14K | \faExternalLink | 3 | ||||||||||||||||||
| [KAM∗18] | 120K | \faExternalLink | 3 | ||||||||||||||||||
| [MBT∗22] | 5.5K | \faExternalLink | 1 | ||||||||||||||||||
| [MKT22] | 3.5K | \faExternalLink | 1 | ||||||||||||||||||
| [CPL∗22] | 62K | \faExternalLink | 1 | ||||||||||||||||||
| [DWS∗22] | 38K | \faExternalLink | 34 | ||||||||||||||||||
| Generate chart designs automatically | [ZFF20] | 10K | 6 | ||||||||||||||||||
| [DD19] | 4.3K | 5 | |||||||||||||||||||
| [CZW∗19] | 800 | 1 | |||||||||||||||||||
| [HBL∗19] | 2.3M | \faExternalLink | 3 | ||||||||||||||||||
| Retrieve charts matching certain criteria | [CZL∗20] | 360 | – | ||||||||||||||||||
| [CCA15] | 319K | 3 | |||||||||||||||||||
| [HA19] | 7.9K | – | |||||||||||||||||||
| [LWW∗22] | 51K | 5 | |||||||||||||||||||
| [OKM20] | 4.7K | – | |||||||||||||||||||
| Modify an existing chart | [CWH∗21] | 438 | 1 | ||||||||||||||||||
| [PMH17] | 1.8K | 7 | |||||||||||||||||||
| [YZZ∗21] | 13K | 1 | |||||||||||||||||||
| [WTD∗20] | 374 | – | |||||||||||||||||||
| [QSC∗20] | 829 | 1 | |||||||||||||||||||
| [SKC∗11] | 2.6K | \faExternalLink | 10 | ||||||||||||||||||
| [CWW∗19] | 4.7K | 1 | |||||||||||||||||||
| [HWWL21] | 187K | 1 | |||||||||||||||||||
| Generate natural language descriptions | [KHA20] | 52 | 2 | ||||||||||||||||||
| [SGCV19] | 6K | 2 | |||||||||||||||||||
| [OH20] | 8.3K | \faExternalLink | 2 | ||||||||||||||||||
| [KPCK18] | 300K | \faExternalLink | 1 | ||||||||||||||||||
| [CZK∗19] | 110K | 3 | |||||||||||||||||||
| [RRDK19] | 120K | \faExternalLink | 3 | ||||||||||||||||||
| [CSG∗20] | 248K | 6 | |||||||||||||||||||
| [MGKK20] | 224K | \faExternalLink | 3 | ||||||||||||||||||
| [HGH21] | 417K | 1 | |||||||||||||||||||
| [SS20] | 248K | \faExternalLink | 1 | ||||||||||||||||||
| [DCM12] | 107 | 1 | |||||||||||||||||||
| Extract chart semantics | [AZG17] | 213 | 1 | ||||||||||||||||||
| [HT07] | 200 | 3 | |||||||||||||||||||
| [LLJ∗20] | 469 | 3 | |||||||||||||||||||
| [LLWL21] | 387K | \faExternalLink | 3 | ||||||||||||||||||
| [RSE∗21] | 528 | \faExternalLink | 1 | ||||||||||||||||||
| [JKS∗17] | 5.7K | 10 | |||||||||||||||||||
| [TLL∗16] | 5K | 5 | |||||||||||||||||||
| [CAM∗18] | 17K | 10 | |||||||||||||||||||
| [LWL∗20] | 13K | 1 | |||||||||||||||||||
| [LWL21] | 170K | 1 | |||||||||||||||||||
| [SDHL15] | 20K | 1 | |||||||||||||||||||
| [BKO∗17] | 1.4K | 3 | |||||||||||||||||||
| [KM18] | 1K | 1 | |||||||||||||||||||
| [ZZC∗21] | 3K | 1 | |||||||||||||||||||
| [PH17] | 5K | \faExternalLink | 4 | ||||||||||||||||||
| [CWG16] | 3.8K | 2 | |||||||||||||||||||
| [CRMY17] | 2.7K | 1 | |||||||||||||||||||
| [MTW∗18] | 51K | 1 | |||||||||||||||||||
| [GZB12] | 300 | 3 | |||||||||||||||||||
| [FWD∗19] | 6.7K | 1 | |||||||||||||||||||
| [CJP∗19] | 2.4K | 3 | |||||||||||||||||||
3 Tasks: Why, How, and What
Why: the goal. We went through the collected papers, unified their vocabularies about their research goals and tasks, and identified 6 categories for the goal dimension:
-
•
Create a chart corpus, which aims at introducing a benchmark chart collection for certain chart types or analysis tasks. For example, the Beagle corpus [BDM∗18] consists of SVG visualizations collected from five popular charting tools on the web; the LineCap corpus [MKT22] curated line charts with figure captioning; and the MapQA corpus [CPL∗22] introduced a question answering annotations specifically for choropleth maps.
-
•
Extract chart semantics, where “semantics” refers to information spanning a range of concepts, including low-level primitives like the mark type [LWL21] and attributes [PH17], the role of a mark group (e.g., axis, glyph), and high-level meta-information such as chart type [JKS∗17] or the underlying dataset [MTW∗18]. The extracted semantics are useful for various downstream applications.
-
•
Modify an existing chart, which transforms a chart for new contexts or needs. There are two kinds of modification: (1) reusing a chart where the underlying data is modified but the visual designs are maintained [CWW∗19, CWH∗21, QSC∗20], and (2) redesigning a chart where the visual mappings and styles are changed while the underlying data is untouched [PMH17, WTD∗20, SKC∗11]. Modifying a chart usually requires explicit extraction of certain chart semantics.
- •
- •
-
•
Generate natural language descriptions, where information in the charts is transformed into natural language forms for purposes such as enhanced accessibility - in many contexts, it is easier to consume and ask questions about a chart when the information is presented in a verbal or audio format [RRDK19, CZK∗19, OH20, DCM12, KAM∗18, CSG∗20].
How: the method. We have observed 3 categories of methods:
- •
-
•
Classic machine learning (ML) models. For example, to label collected chart images automatically, Battle et al. [BDM∗18] adopted random forest [BS16] to perform automatic chart type classification; Poco and Heer [PH17] used support vector machines (SVM) [CV95] to classify texts presented in a chart into their roles like axis label and legend title.
-
•
Heuristics-based algorithms, which usually are human-crafted rules designed for specific tasks. For example, Cui et al. [CWH∗21] abstracted six types of chart element update schemes with respect to the underlying data values and developed a chart reusing algorithm; Hoque and Agrawala [HA19] introduced a heuristic chart deconstructor to obtain visual styles and structures by utilizing the encoded data values encapsulated in D3 visualizations.
These methods can also be used in conjunction to finish multi-stage tasks. For example, to understand chart semantics, both Revision [SKC∗11] and ChartSense [JKS∗17] first used neural networks to classify the type of chart, and then applied mark-specific heuristics-based algorithms to extract the underlying data.
What: the output. We have identified the following outputs of automated chart analysis methods:
-
•
Chart components
- –
- –
- –
- –
- –
- –
- –
- –
- •
- •
Again, these outputs are not exclusive to each other, i.e., one task can output multiple components. For example, Revision and ChartSense output both chart type and source data.
We now take the REV [PH17] system as an example to illustrate how a chart corpus is created and used in practical applications based on the task taxonomies identified above. The goal of REV is to extract chart semantics. More specifically, it extracts visual encoding specifications for a given chart. To do this, Poco and Heer collected a corpus from three different sources. For each chart in the corpus, they annotated the chart (mark) type, and the bounding boxes, contents, and roles of the text elements. They then built an end-to-end pipeline to process the charts: OCR-based heuristics that output text localizations and contents; a multi-class support vector machine that outputs text roles; a convolutional neural network that outputs mark type classifications; and finally a set of heuristics that outputs data type, domain, range, and scale type for each axis. At each stage, the corresponding annotations in the corpus are used to evaluate the model performance and report the statistics.
4 Chart Format
Chart format refers to the file type of charts in a corpus, which includes bitmap graphics (.jpeg, .png) [SKC∗11, TLL∗16, JKS∗17, PH17, PMH17, DWS∗22], vector graphics (.svg) [HA14, HA17, BDM∗18, WTD∗20, LWW∗22], and programs (code snippets that generate charts) [DD19, ZFF20, KHA20].
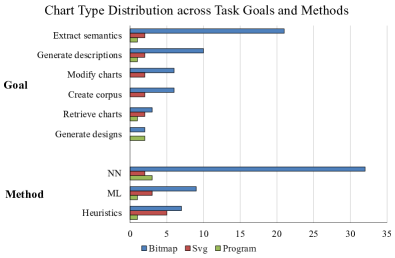
Out of the 56 papers we collected, used bitmap-graphics corpora, used vector-graphics corpora, and used program corpora. Five works mixed the usage of multiple chart formats: Poco and Heer [PH17] and Kim et al. [KHA20] used charts of all three formats, and Masry et al. [MDT∗22], Choudhury et al. [CWG16], and Li et al. [LWW∗22] used both the bitmap and vector graphics. The usage frequency of each type across different task purposes and methods is presented in Figure 2. In cases where multiple methods are used, the primary method performed on a corpus is decided following the order of NN, ML, then Heuristics.
As the least used format, programs were adopted in five works in our collection, and four out of them used the language Vega [SRHH15] or Vega-Lite [SMWH16] (which is in the JSON format): Poco and Heer [PH17] analyzed Vega’s scene graph to extract bounding boxes and role labels for texts automatically; from Vega-Lite Specifications, Kim et al. [KHA20] extracts encodings and underlying data table which are later used to develop question answering techniques; both ChartSeer [ZFF20] and Data2Vis [DD19] apply RNN [SVL14] to Vega-Lite specifications to retrieve next-step visualization recommendations during EDA and candidate charts based on given datasets, respectively. The remaining one, VizCommender [OKM20], measured similarity between pair-wise visualization specifications in online Tableau workbooks to recommend to the user similar visualizations or workbooks. It can be seen that these works either take advantage of abundant semantic-related information presented in the programs or regard the programs as texts and directly apply learning-based sequential models. Thus, the usage scenario of programs highly depends on their language-specific grammar and structures, limiting their generalizability to a broader range of charts and tasks. The remaining of this section will focus on the comparison between the bitmap and vector formats.
Availability of Chart Semantic Information. The bitmap graphics format only records the pixel information of a chart without providing directly-accessible semantic information ranging from low-level details (e.g., marks, roles of visual elements as well as visual encodings) to high-level information like graphical elements grouping, chart type and underlying dataset(s). The vector-based SVG format, on the other hand, is less lossy and embeds certain low-level semantic details in its XML structure, including visual elements types (e.g., text, line, rect, circle, path) and visual styles (e.g., stroke, fill, opacity, x, y, width, height, radius).
Researchers thus try to leverage the semantic information provided by the vector graphics format whenever available. For example, Poco and Heer [PH17] collected charts from the news website Quartz [Qua23] where the SVG format is available. They first extracted texts from the SVG files and then fed the charts into a GUI to obtain annotated bitmap images; in ChartQA [MDT∗22], whenever the SVG format is available, the authors extracted the bounding boxes of different graphical elements (e.g., x-axis labels) from the SVG files to train their data extraction models. Without access to SVG-format charts, one can only extract text elements as well as their bounding boxes through human annotations [QSC∗20, DWS∗22] or OCR-based techniques [HT07, LLJ∗20, LLWL21, MDT∗22, PMH17, KM18]. In some other works, the technique pipeline can be made more concise if the input images in the vector graphics format are available; e.g., the Revision system [SKC∗11] has an intermediate mark extraction step that applies heuristics to detect rectangle and circle marks in an input chart, which can be achieved by parsing the elements with rect and circle tags if its corresponding SVG image is available.
In some special cases, there exists additional high-level information embedded in vector graphics images. For example, SVG images generated by the D3 library [BOH11] embed the source data using the __data__ attributes of SVG elements. It is thus possible to directly access the source data and extract semantics more easily using decomposition, restyling, and retrieval algorithms [HA14, HA17, HA19]. These algorithms, however, work exclusively on D3 SVG charts, and cannot be applied to SVG charts generated using other tools or collected from other sources.
Despite the support to embed semantic information in the SVG format, the embedded semantics in vector graphics images from the wild is not always accurate or reliable. We identify three sources of noise and uncertainty:
-
•
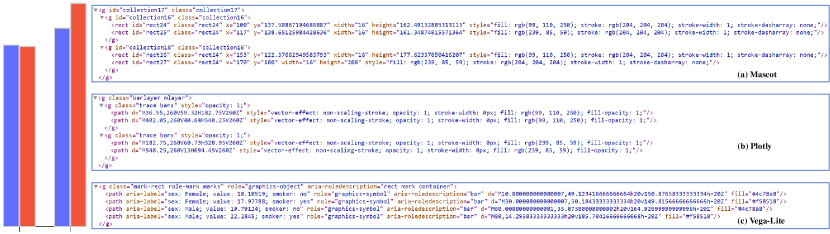
SVG element tags do not always accurately reflect the semantic mark type, i.e., the same mark type may be represented using different SVG elements. For instance, bar charts in the SVG format created with Mascot.js (previously known as Atlas.js [LCMZ21]) are composed of <rect> elements, while those created with Vega-Lite library [SMWH16] are using <path> elements (shown in Figure 3). Circle marks are also represented differently in these two tools. Thus, preprocessing is needed to detect the semantic mark type.
-
•
Inconsistent Grouping of SVG elements is observed across different visualization tools: the g element is often adopted to group SVG elements in diverse—sometimes random—ways [CWG16], and the grouping does not necessarily reflect the desired semantics. For example, grouped bar charts created with different tools have different grouping structures in their SVG format. In Figure 3, three grouped bar chart examples created with Mascot [LCMZ21], Plotly [Plo23], and Vega-Lite [SMWH16], respectively, are presented together with their corresponding SVG files. It can be seen that these three tools groups rectangles in different ways: Mascot groups rectangles sharing the same x-axis label under a element, Plotly groups rectangles sharing the same fill color, and Vega-Lite groups all rectangles together in one element.
Similarly, groupings for axe and legend elements are unpredictable as well: in some examples, axis labels are put into the same group, while in others, each label forms its own group with its corresponding tick mark. Poco and Heer [PH17] also reported that the title in an SVG chart could be composed of several texts specified as separate elements, requiring additional efforts to detect and merge them. Thus, to obtain the real semantic grouping for elements in a given SVG image, one cannot solely rely on the given SVG hierarchical structure; appropriate clustering or classification algorithms are needed.
-
•
An SVG scene graph sometimes contains noisy elements: to perform chart analysis tasks, one may need to first distinguish between visualization marks that form the main chart, and graphical objects that are not part of the main chart content like off-screen tooltips used for interaction, transparent background marks, and random watermarks drew as elements.
Note that these uncertainties and noises don’t exist in bitmap images: different representations and grouping of graphical marks, as well as invisible noisy elements presented in the SVG file will not influence the rendered bitmap image.
Compatibility with Different Models. One advantage of bitmap charts is that they are naturally compatible with modern convolutional neural networks (CNNs). Figure 2 shows NN is the most frequently used method on bitmap-based corpora, which indicates that the bitmap graphics format is usually the first choice for many end-to-end neural-network-based systems [TLL∗16, CAM∗18, LWL21, MBT∗22, MKT22, LWW∗22, FWD∗19, HWWL21, MTW∗18, CPL∗22, CZK∗19, RSE∗21]. In these cases, usually some additional preprocessing steps, such as image cropping & resizing [CJP∗19] and data augmentation [KM18, ZFF20], are needed. In contrast, SVG charts in their XML structure cannot be directly fed into CNNs.
However, SVG charts have been shown to have potential as inputs for graph neural networks (GNNs), since SVG elements are organized as trees that can be generalized as graphs. Li et al. [LWW∗22] performed feature engineering based on the embedded semantics from SVG charts, constructed SVG-based graphs, and ran GNN-based contrastive learning [SHVT20]. The output representations are combined with visual representations obtained from bitmap-based CNN learning to retrieve charts of similar visual appearance as well as structure. This work is a first step towards SVG-based graph learning, which remains an open direction. Besides, as we previously discussed, the availability of chart semantic information allows people to handcraft meaningful features, and then develop classic learning-based methods [BDM∗18, CWG16] or rule-based heuristics [CWH∗21, DCM12], to perform chart analysis tasks; this pipeline is more commonly observed in our collected papers than applying NN on SVGs as shown in Figure 2.
Interactivity Support. In addition to the embedded semantic information, the SVG format standard is developed for the web, and is designed to work well with with other web standards such as CSS (Cascading Style Sheets), DOM (Document Object Model), and JavaScript. SVG-based charts can thus be easily enhanced with interactive features, which can be beneficial in the following ways:
-
•
Corpus Creation: SVG charts make it easy to develop interactive annotation tools where people can collaborate with computers to make the labeling process less laborious [CWW∗19].
-
•
Interactive Interfaces: SVG charts as the input make the development of mixed-initiative pipelines [AGH99] easier; e.g., the Chartreuse system [CWH∗21] presents a PowerPoint add-in where users can select chart elements, review chart decomposition results, modify data items, and update the selected chart.
5 Scope: Chart Type and Design Variation
Scope refers to the assumptions or inclusion criteria about the properties of charts in a corpus. These are usually specified to constrain the research problem space to achieve feasible solutions (e.g., ChartReader [RSE∗21] requires the input to be bar charts). Based on our paper coding, the scope of a corpus is primarily defined through chart types. In addition, we have also identified additional assumptions on the extent of design variations within a chart type. In the following subsections, we summarize researchers’ common choices and practices along these two dimensions.
5.1 Chart Type
High-level chart typologies are commonly used to define the scope of a research problem (hence the scope of a corpus). For example, Gao et al. [GZB12] and Choi et al. [CJP∗19] extract chart semantics such as label positions, chart type and source data from three types of charts: bar, line, and pie; DVQA [KPCK18] and Chartreuse [CWH∗21] focus on reusing bar charts. Table 2 presents the frequency of each chart type used in our collected papers. Our analysis does not include [CZL∗20, WTD∗20, HA19, OKM20] because the first two only included visual layout and scale requirements, the third one works at a level of granularity finer than high-level chart typologies, and the last one didn’t reveal information regarding chart types.
| Chart Type | Frequency | Percentage |
|---|---|---|
| Bar | 38 | 73.07% |
| Line | 31 | 59.62% |
| Pie | 18 | 34.62% |
| Scatterplot | 16 | 30.77% |
| Infographics | 9 | 17.31% |
| Area | 9 | 17.31% |
| Map | 8 | 15.38% |
| Treemap | 4 | 7.69% |
| Boxplot | 4 | 7.69% |
| Heatmap | 3 | 5.77% |
| Table | 3 | 5.77% |
| Venn | 3 | 5.77% |
| Parallel Coordinate | 3 | 5.77% |
| Sunburst | 3 | 5.77% |
| Donut | 3 | 5.77% |
| Node-link Diagram | 3 | 5.77% |
| Radar | 2 | 3.85% |
| Matrix | 2 | 3.85% |
| Tick | 2 | 3.85% |
| Pareto | 2 | 3.85% |
From Table 2, we can see that among the many chart types observed, bar, line, pie charts, and scatterplots are the most frequent ones, which is consistent with the statistics from the Beagle dataset [BDM∗18] where line and bar charts dominate its collections and pie chart is less popular. The popularity of these chart types can be attributed to their effectiveness in visualizing numerical data [KPCK18], the ability to convey trends and relationships [RSE∗21] and to represent high-dimensional data in 2D [MTW∗18], as well as their simplicity and interpretability [BDM∗18]. Infographics, maps, and area charts, typically of specific usages, are less frequently included and appear in about of all the corpora, respectively. The other chart types, such as donut charts and tick plots, are rarely considered, potentially due to their relatively scarce presence on the web and increased visual structure complexity.
| Design Variation Type | Assumption | Relevant Corpora |
|---|---|---|
| composite arrangement | only multiple-view charts | [CZL∗20] |
| no multiple-view charts | [CAM∗18, WTD∗20, PH17, HGH21, LWL∗20] | |
| no layered charts | [JKS∗17, PH17, CJP∗19] | |
| mark and glyph | no abstract icons or symbols | [JKS∗17] |
| only proportion-related charts | [QSC∗20, CZW∗19] | |
| only timeline-related infographics | [CWW∗19] | |
| no handmade sketches | [JKS∗17, CAM∗18, SDHL15] | |
| no 3D effects | [SKC∗11, DWS∗22, CJP∗19] | |
| chart component | chart must have a legend | [PMH17, MKT22] |
| axes being at the left and bottom | [SKC∗11] | |
| coordinate space | in Cartesian coordinate space | [WTD∗20, PH17] |
The intrinsic nature and complexity of the task can also influence the number of chart types in a corpus. Figure 4 shows the distribution of the number of chart types by task purpose in jittered box plots, from which we can see most corpora contains fewer than 10 chart types. Unsurprisingly, create a chart corpus leads to the highest average number of chart types, since this task typically aims at a comprehensive and diverse chart collection. Two runner-ups following create a chart corpus are generate chart designs automatically, which oftentimes employs end-to-end learning-based models that don’t require type-specific handling (e.g., all four works, Zhao et al. [ZFF20], Dibia and Demiralp [DD19], Cui et al. [CZW∗19], and Hu et al. [HBL∗19], that belong to this task used neural networks as the pivot method), and retrieve charts matching certain criteria, which may not require a deep understanding of chart semantics (DiagramFlyer [CCA15] is a search engine for charts primarily based on label text in axes and legends). It is thus possible to handle more chart types in these works. Each of the other three purposes — extract chart semantics, modify an existing chart , and generate natural language descriptions — has a relatively small average number of chart types. These tasks usually require a more thorough chart deconstruction and understanding of the chart semantics; thus, involving too many chart types might make the research problem intractable [JKS∗17, LWL21]. For example, Chartreuse [CWH∗21] developed algorithmic heuristics to obtain element groupings, data-binding regimes, spatial layouts, and approximated underlying data from infographics bar charts; MapQA [CPL∗22] first adopted OCR techniques to extract text elements in a chart, then used neural networks to recover underlying data and synthesize possible answers to questions solely for choropleth maps.

In practice, we have also observed that different corpora were created for the same chart analysis task, due to different scopes. For example, Cui et al. [CWH∗21] collected their own infographics bar chart corpus instead of reusing the corpus from Chen et al. [CWW∗19], which focused on timeline infographics. Although their tasks are both modify an existing chart, their scopes diverge, requiring different corpora. This leads to challenges on the generalizability/scalability of presented techniques/systems.
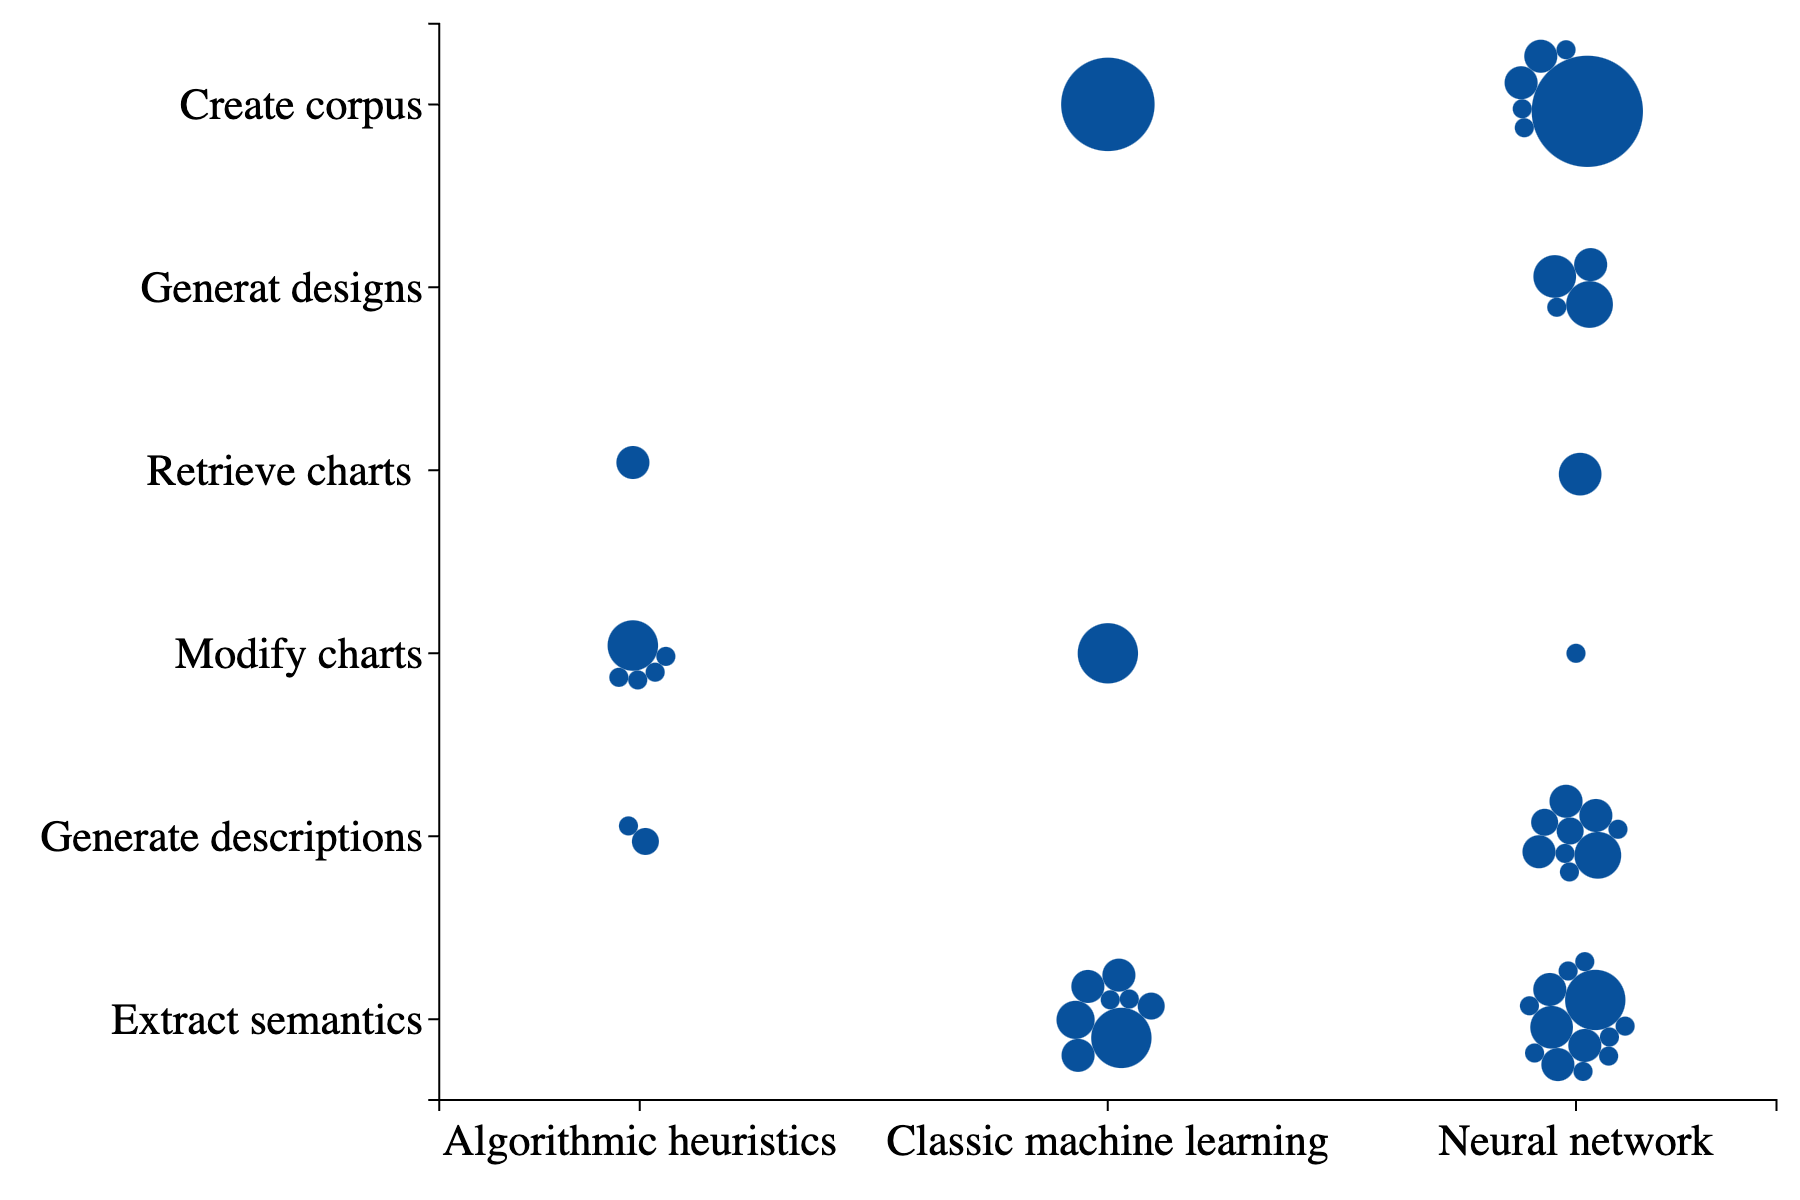
We also examine how the methods play a role in influencing the number of chart types in a corpus. Figure 5 shows a beeswarm chart presenting the clusters of chart corpora based on task goal and method, where each dot represents a corpus whose size encodes the number of chart types considered. It can be seen that the corpora used for neural networks or classic machine learning models tend to contain more chart types, which is possibly due to the higher representational capacities of the two methods compared to heuristics-based algorithms.
5.2 Design Variations
In addition to chart type, we have also observed scope definitions in terms of finer-grained design variations in some corpora. There can be different structural and stylistic variations within a chart type, and supporting all these variations is non-trivial. Examples of design variations include but are not limited to: composite arrangement (e.g., Chen et al. [CZL∗20] focus on decomposing and understanding multiple-view visualizations, and Poco and Heer [PH17] assume non-superimposed single-layer figures), and mark/glyph type (e.g., Chen et al. [CWW∗19] retarget timeline glyphs in infographics). We summarize scope definitions related to design variations in Table 3. Although the assumptions on design variations enforced on a corpus may not be explicitly described in some papers, these constraints are essential during the corpus curation process to filter out undesired charts and keep the research focus manageable [LLJ∗20].
6 Chart Collection Method
The collection method describes how the charts in a corpus were collected. The choice of method is determined by both the chart format and the corpus scope. During our coding process, we have observed four kinds of collection methods: reusing and transforming existing corpus [ZFF20, CZK∗19, BKO∗17, SS20], web crawling [CCA15, BDM∗18, HA19, HBL∗19, LWW∗22], manual curation [HT07, GZB12, DCM12, PMH17, CZW∗19, CJP∗19, QSC∗20], and computer-aided generation [SGCV19, CSG∗20, MGKK20, CRMY17]. In the following subsections, we describe these collection methods and summarize the common sources and tools people adopted during the curation process. Note that these four methods are not mutually exclusive: one can combine multiple methods to create a corpus. For example, ChartSense [JKS∗17] reused the Revision corpus [SKC∗11] and augmented it with more web-crawled images.
6.1 Reusing and Transforming Existing Corpus
Directly reusing existing chart corpora is straightforward and requires minimal effort. However, out of the 56 corpora described in our paper collection, 17 are publicly available (which is consistent with the observation from Davila et al. [DSD∗20] that “very few of the datasets have been made publicly available”), 9 were generated by modifying existing corpora, and only 4 corpora (FigureQA [KAM∗18], VIF [LWL∗20], SciCap [HGH21], REV [PH17]) were reused in subsequent works. This shows a lack of standard benchmark corpora in visualization research, as discussed in the introduction. Two kinds of transformations are applied to those 9 corpora that were built by modifying existing corpora:
-
•
Adding new charts to an existing corpus to make a larger one. For example, the corpora in [CWH∗21, ZFF20, JKS∗17, KM18] are created by augmenting corpora from [MBN∗21, DD19, SKC∗11, WCEC10], respectively. The motivation behind this augmentation is either simply increasing the corpus size [JKS∗17] or increasing the chart diversity [ZFF20]. The methods they used to obtain new charts include manual collection, web crawling, and computer-aided generation, which will be introduced in later subsections.
-
•
Adding new annotations to the same charts. For example, the corpora in [CZK∗19, SS20, HGH21] are created by adding new question-caption (QC) or question-answer (QA) annotations on the corpora from [KAM∗18, CSG∗20, CBOA19], respectively; Bylinksii et al. [BKO∗17] and Fu et al. [FWD∗19] built their corpora by annotating salience map and aesthetics score respectively on the MassVis dataset [BVB∗13].
6.2 Web Crawling
To quickly collect a large chart corpus, web crawling is a popular way to gather charts matching certain criteria from targeted sources automatically. We have observed the following commonly used websites that people add to their crawlers:
- 1.
- 2.
- 3.
- 4.
-
5.
Public platforms for sharing data analysis and reports, examples are Statista [Sta23] used in [OH20, MDT∗22], the Pew research [Pew23], Our World In Data (OWID) [Owi23], and Organisation for Economic Co-operation and Development (OECD) [Oec23] used in [MDT∗22], Kaiser Family Foundation (KFF) [Kff23] used in [CPL∗22], and Quartz [Qua23] used in [PH17].
Although web crawlers can gather a large number of charts, it is also mentioned that web crawling usually requires some manual post-examination to remove the repeated or unqualified charts [CWW∗19, PH17, CZL∗20, JKS∗17] from a typically large chart collection, which requires additional time. The variety of charts in terms of types and design variations cannot be guaranteed either.
6.3 Manual Curation
Due to the above-mentioned limitations of web crawling, when the quality and variation of chart design matters more than the size of a corpus, some works, e.g., Cui et al. [CZW∗19] and Chen et al. [CWW∗19], decided to collect charts manually without the help of (semi-)automated crawlers, so that they could inspect each chart candidate and decide if they would like to include it in the corpus. We identify three common kinds of sources where people find charts manually:
-
1.
Search engines in which people adopt keyword-based searches; candidates include Google Search [Goo23] used in [LLJ∗20, CAM∗18, QSC∗20, ZZC∗21], Bing Visual Search [Bin23] and Yahoo Image Search [Yah23] used in [ZZC∗21], Freepik [Fre23] and ShutterStock [Shu23] used in [LWL∗20], Flickr [Fli23] used in [SDHL15] (the latter three contain more infographics).
- 2.
- 3.
In both manual curation and web crawling, when the chart source are scholarly document repositories, necessary post-processing is needed to further extract charts from collected academic papers in the PDF format. The commonly used tools include PDFFigures [CD15, CD16] used in [AZG17, RSE∗21, PMH17, PH17, CWG16, HGH21, DWS∗22], PyMuPDF [Pym23] and PDF2HTML [Pdf23] used in [CZL∗20], and Diagram Extractor [CCA11] used in [CCA15].
Note that one can combine multiple sources to perform manual curation to increase corpus size and enhance diversity (we discuss chart diversity in detail in Section 8).
6.4 Computer-Aided Generation
Another method for preparing a chart corpus is computer-aided generation, i.e., using visualization software to generate charts based on real or synthetic datasets. Three questions need to be addressed when using this method: Where do the underlying datasets come from? Which charting tools to use? How to ensure a wide range of design variations and styles?
Underlying datasets. Two ways of preparing underlying datasets for plotting are observed: (1) using synthetic datasets generated by computers with various data types [SGCV19], random-distributed values [KPCK18, CAM∗18, CRMY17] or values from carefully-tuned distributions [KAM∗18, CPL∗22], and (2) using public data tables available from various online sources [CSG∗20, MGKK20, MTW∗18, CWW∗19], e.g., World Development Indicators [Wdi23], Historical daily prices and volumes of all U.S. stocks and ETFs [Sto23], and the PyDataset library [Pyd23].
Charting tools. The most popular charting tool in our collection is Matplotlib [Mat23] from python, which is used in 5 corpora [KPCK18, CSG∗20, ZZC∗21, CRMY17, MTW∗18]. Other tools include Vega-Lite [SMWH16, Veg23] used in [CAM∗18], Bokeh [Bok23] used in [KAM∗18], GeoPandas [Geo23] used in [CPL∗22] for map-based charts, and TimelineStoryteller [Tim23] used in [CWW∗19] for timeline-based infographics.
Enhancing design variety. Unlike manual curation and web crawling, to generate charts using computers, one has to enforce design variety when using charting tools. Two common practices have been observed: increasing the diversity of (1) underlying datasets and (2) visual styles. We detail this discussion in section 8.

Figure 6 shows the distribution of corpus size across different collection methods. The corpus from [HBL∗19] is not included since its corpus size is too big to make the figure readable; in cases where multiple collection methods were used, we choose the one accounting for the largest portion. It can be seen that, on average, web crawling and computer-aided generation lead to corpora of large sizes, and manual curation unsurprisingly results in small-size corpora.
7 Annotations
Annotations are labels associated with charts in a corpus, serving as ground truth for chart analysis tasks. In most cases, the sources where the charts are collected do not provide such labels. Also, as reported in Battle et al. [BDM∗18], there is a lack of consistent metadata across different websites, which makes automatic labeling hard. For example, Plotly [Plo23] and Chartblocks [Cha23] provide chart type information while Fusion Charts [Fus23], Graphiq [Gra23], and D3 [BOH11] do not. Thus, it is necessary to annotate collected charts to obtain consistent valid labels for a given task. In cases where the sources contain meta-information about the charts, the provided information is not always sufficient for the task. For example, the chart-type information provided by Plotly [Plo23] is not enough for tasks like modify an existing chart since this task usually requires knowing more low-level semantics.
In this section, we discuss two aspects of annotations: annotation types, which refer to the categories of labels needed for a variety of tasks, and annotation methods, which refer to the approaches people adopt to obtain the desired labels.
7.1 Annotation Types
| Annotation Type | Relevant Corpora |
|---|---|
| bounding box | for mark or glyph [LLJ∗20, LLWL21, LWL21, CRMY17, CSG∗20, QSC∗20, HWWL21], |
| for legend [LWL21, CSG∗20, MGKK20, HWWL21], for axes [MGKK20, CRMY17, HWWL21], for text [LWL21, ZZC∗21, PH17, CRMY17, SGCV19, CSG∗20, MGKK20, SKC∗11, HWWL21], for main chart area [LLWL21, DWS∗22, HWWL21], for chart sub-views [CZL∗20] | |
| chart type | [BDM∗18, JKS∗17, TLL∗16, CAM∗18, KM18, SKC∗11, CWG16, GZB12, DWS∗22, CJP∗19] |
| question-answer pair | [KHA20, MDT∗22, KPCK18, KAM∗18, MBT∗22, CSG∗20, CPL∗22, MGKK20] |
| question-caption pair | [CZK∗19, MKT22] |
| text role | [ZZC∗21, CWG16, PH17] |
| infographics element type | [LWL∗20, QSC∗20] |
| pairwise style similarity | [SDHL15, MTW∗18] |
| saliency map | [BKO∗17] |
| aesthetics ranking | [FWD∗19] |
In Table 4, we summarize typical annotation types observed in our analysis. It can be seen that bounding box annotation for chart elements is the most common one since knowing the positions of certain chart elements is necessary across most tasks. For example, Deng et al. [DWS∗22] annotated the bounding boxes of the main chart areas to record accurate visualization locations which serve as one of the output components; Huang et al. [HWWL21] annotated the bounding boxes of legends to develop an object detection model that predicts locations of legends in new charts; Poco and Heer [PH17] annotated bounding boxes of text elements to test their OCR-based technique for locating and extracting text content; Chen et al. [CZL∗20] annotated bounding boxes of sub-views to advance their chart composition and configuration analysis as well as to develop the recommendation system that retrieves charts with a similar layout; and Chaudhry et al. [CSG∗20] annotated bounding boxes for a variety of chart elements like axis labels, legend, and marks to train their Mask-RCNN network [HGDG17] for chart element detection and classification, which will later be utilized to develop question answering models. We can see that bounding box annotations are the foundation of many different tasks and models, even when element positions are not required in the final output.
Many corpora also include chart type annotations, with which people can perform chart type classification tasks [BDM∗18, DWS∗22]. Chart type annotations further allow deeper chart deconstruction and understanding. For example, Jung et al. [JKS∗17] first trained predictive models to classify charts, then extracted underlying source data per chart type; chart type classification is also a prerequisite in the Revision system [SKC∗11] for redesigning an existing chart.
Question-Answer (QA) pair annotation is also commonly seen due to the increasing popularity of chart question-answering systems [SGCV19, CSG∗20, DCM12, HGH21, CZK∗19]. Taking a single bar chart as an example, questions that can be asked generally have the following types: (1) structure-related [KPCK18], such as are the bars horizontal?, (2) data-related [KHA20], such as what is the label of the third bar?, and (3) relation-related [CPL∗22], such as what are the highest and lowest values?. A similar annotation type is Question-Caption (QC) pair, observed in chart captioning systems [CZK∗19, MKT22]. Both of them are only considered in the task of generate natural language descriptions, where answers to questions or captions to charts are outputs of the type synthesized descriptions shown in Section 3.
Some rarely-seen annotation types are observed in specific corpora for task needs: saliency map [BKO∗17], aesthetics ranking [FWD∗19], text orientation [SKC∗11], x-axis labels [OH20], infographics-specific attributes such as timeline-based representations, scales and layouts [CWW∗19], and color-text correspondence [PMH17].
7.2 Annotation Methods
We identify four kinds of methods for obtaining annotations:
-
•
In-house labeling: an in-person annotation process where a small group of people gathers together to annotate collected charts manually. This method is commonly used and usually works for datasets of relatively small sizes. Two issues need to be considered when performing in-house labeling:
-
1.
User interface for annotation. The choice of user interface depends on the complexity of the annotation type. For example, for relatively simple annotations like chart types [BDM∗18, CWG16], a graphical user interface may not be necessary. For annotations that require high accuracy or repeated manual operations (e.g., specifying bounding boxes for sub-views [CZL∗20], and the position, size, angular orientation, and content of text regions [SKC∗11]), a graphical user interface can facilitate the labeling process and improve the quality of annotations.
-
2.
Training procedure. To help annotators better understand the annotation types and tasks, select qualified annotators, and increase the annotation quality, training is typically required. For example, Deng et al. [DWS∗22] carried out a training session before the formal annotation process, which covered the details of annotation types and tasks; they later asked participants to finish a test based on the introduction and used the test results to identify eligible annotators.
In-house labeling can be impractical when the corpus size is large and the required annotation types are complex [LWL∗20]; alternative approaches shall be considered in those cases.
-
1.
-
•
Crowdsourcing: an online annotation process where workers from crowdsourcing platforms such as Amazon’s Mechanical Turk are recruited to annotate charts. This method usually is considered when the size of a chart corpus is large.
The two considerations described for in-house labeling also apply here: Crowdsourcing often involves a GUI for labeling and a training session to teach online workers the annotation tasks (e.g., Saleh et al. [SDHL15] included three examples in the introduction session to teach the workers the purpose of the experiment as well as the meaning of the annotation type - stylistic infographics similarity) and identify qualified workers [MKT22]. Besides, a formal post-examination is usually carried out by the organizers to remove invalid annotations, because the quality of annotations from online workers varies even if a training session is included. For example, Kim et al. [KHA20] manually reviewed the annotations and removed QA pairs that were not reasonable given the charts.
-
•
Template-based generation: annotations in the form of QA or QC pairs for given charts can be generated based on pre-defined templates. This approach is observed solely in corpora built for the purpose to reason about communicative information [SGCV19, KPCK18, CZK∗19, KAM∗18, CSG∗20, CPL∗22]. Compared to crowdsourcing, template-based QA/QC generation avoids high expenses, but in general lack rich linguistic variations [MDT∗22]. Some works alleviate this diversity issue by developing more sophisticated templates [CZK∗19, SS20], combining template-based generating with crowdsourcing [MGKK20], or adopting large-scale language models [MDT∗22]. Section 8 discusses more details on how to diversify such annotations.
-
•
Automatic extraction is applicable when the corpus is generated computationally or collected from Excel sheets. For example, the bounding boxes of chart elements in the corpora can be extracted using Matplotlib if the charts were generated using the same tool [ZZC∗21, CRMY17, MGKK20]; the bounding boxes and underlying data values can be extracted using meta-information of charts generated using Excel [LLWL21, LWL21, HWWL21]. When the tools and associated code that generated a corpus are not available, automatically extracting labels requires building chart-to-label models, but the extraction results may not be satisfying: e.g., Chen et al. [CZL∗20] developed a YOLOv3 object detection model [RF18] to segment a given chart into sub-views automatically. However, the model’s output performance metric was not accurate enough, forcing the authors to label the sub-views manually.
8 Chart Diversity
Diversity measures how much the visualizations differ from one another within a corpus. This integrative property depends on factors including chart format, scope, and collecting method. For example, Deng et al. [DWS∗22] demonstrated better diversity by showing a more balanced distribution over chart types compared to the MassVis dataset [BVB∗13]; Li et al. [LWW∗22] acknowledged source diversity as one limitation since their system was trained with SVG images crawled solely from Plotly [Plo23] and may not work well on visualizations created with other tools or from other sources. In general, diversity is an important property that could significantly influence the scalability, generalizability, and robustness of developed techniques or systems, and it is under-explored in the current literature compared to other properties. In this section, we summarize current practices to enhance diversity in chart corpora.
Diversify source websites. The most common and straightforward way to enhance diversity is to collect charts from multiple sources, varying source websites typically lead to greater chart design variations. This approach works for both manual curation and web crawling. For example, Wu et al. [WTD∗20] built a web crawler based on a D3 chart crawler [HA19], augmented the seeding pages with sources like Google Image Search [Goo23], and randomized the visiting queue of their crawler to avoid human bias and further increase diversity. In InfographicVQA [MBT∗22], the corpus contains infographics downloaded from thousands of different websites, with a variety of visual designs. It is thus more diverse than previous infographics corpora which were either specialized collections (e.g., the MassVis corpus [BVB∗13] focuses on the illustration of scientific procedures and statistical charts [MBT∗22]) or obtained from one single source.
Diversify chart topics. Besides adding more sources websites, collecting charts on various topics is another way to promote diversity since datasets and suitable visual designs vary by topic. In practice, there are mainly two ways to diversify chart topics:
-
1.
Including diverse topics in search keywords. For example, the chart corpus in Retrieve-Then-Adapt [QSC∗20] was created by combining a primary keyword, “infographic”, with numerous secondary keywords indicating 10 different topics (e.g., “education”, “health”, and “commerce”) to ensure diversity, and ended up containing 1000 infographic sheets with 100 under each topic.
-
2.
Adopting topic-enriched source websites, which means sampling charts from websites containing rich and diverse content topics. For example, Masry et al. [MDT∗22] used Statista [Sta23], a public platform that presents charts covering various topics such as economy, politics, and industry, as one of their collecting sources; the MassVis corpus reused in Bylinskii et al. [BKO∗17] included charts from several websites including WHO [Who23] and Wall Street Journal [Wal23] to span a diverse set of topics including public health, economy, and public policy.
Diversify chart creators. Some corpora sample from online image providers where charts are created by a larger community of content creators. This strategy leverages the variety of real-world users’ datasets and chart design preferences, thus promoting diversity. For example, Lu et al. [LWL∗20] collected charts from two providers, Shutterstock [Shu23] and Freepik [Fre23], because infographics from these sites are contributed by designers worldwide, and span a variety of design themes and styles; Li et al. [LWW∗22] and Hu et al. [HBL∗19] sampled user-created charts from Plotly [Plo23] and kept one chart per user.
Diversify scholarly document repositories. When targeting charts from scholarly documents for scientific purposes, enriching publication venues and increasing the year range are standard practices to increase diversity. For example, the VisImage corpus [DWS∗22] collected charts from 22-year VAST and InfoVis publications; the MV dataset [CZL∗20] is created using publications in IEEE VIS, EuroVis, and IEEE PacificVis from 2011–2019; Choudhury et al. [CWG16] chose papers in top 50 computer science conferences from 2004 to 2014. Some other strategies people use to sample scientific charts include: increasing publication fields (e.g., Poco et al. [PMH17] selected charts from five areas including visualization, human-computer interaction, computer vision, machine learning, and natural language processing to promote variety), and stratified sampling (Al-Zaidy et al.[AZG17] only sampled one chart per PDF file based on their observation that most charts from the same document have the same layout which hurts diversity).
For computer-aided generated chart corpora described in Section 6.4, diversity needs to be enforced during the computer-generating process. There are two ways to increase diversity in this setting: diversifying underlying datasets and diversifying style parameters.
Diversify underlying datasets. As stated in Section 6.4, people randomize data types and tune the underlying distributions of data attributes to generate a variety of synthetic datasets for plotting. It has also been observed that people enumerate combinations of data attributes to increase the number of plottable charts and diversify styles; e.g., Ma et al. [MTW∗18] used 757 datasets from the PyDataset library [Pyd23], and combined all possible pairs of columns in each of them to form a scatterplot, resulting in 50677 different scatterplots. To obtain diverse public datasets, people look for those with various topics, years, and cultures. For example, Methani et al. [MGKK20] considered online data sources such as World Bank Open Data [Wbo23] and Global Terrorism Database [Gtd23] which contain statistical data about a variety of factors including fertility rate and coal production across years and countries.
Diversify style parameters. Another typical and important practice in creating computer-generated chart corpora is diversifying style parameters in the codes. We summarize commonly considered style parameters in Table 5, including color, presence of grid lines, legend and axis location, legend and mark orientation, title location, and font size and family. Some other less frequently used parameters include label orientation [KPCK18], tick size and orientation [ZZC∗21], etc.
| Style Parameter | Relevant Corpora |
|---|---|
| fill color | [SGCV19, CAM∗18, KAM∗18, CSG∗20, MGKK20, ZZC∗21, CRMY17] |
| presence of grid lines | [KPCK18, CAM∗18, KAM∗18, CSG∗20, MGKK20, PH17, CRMY17, CWW∗19] |
| legend location | [KPCK18, KAM∗18, CSG∗20, MGKK20, ZZC∗21, PH17] |
| axis location | [PH17, CRMY17] |
| legend orientation | [KPCK18, KAM∗18] |
| mark orientation | [KPCK18, ZZC∗21, CWW∗19] |
| font family and size | [CSG∗20, MGKK20, ZZC∗21, PH17, CWW∗19] |
| title location | [CSG∗20, ZZC∗21, CRMY17] |
Diversify visual questions and captions. As we mentioned in Section 7.2, template-based QA or QC annotation generally is limited by poor linguistic variations, which hurts the generalizability of developed models to real-world human-raised questions. Thus, new techniques have been devised recently to alleviate this problem. For example, Chen et al. [CZK∗19] designed a large number of templates to achieve more than 200 possible variations with the same meaning for high-level captions; similarly, Singh and Shekhar [SS20] manually created 3 to 8 paraphrase variations of question templates to boost the diversity and naturalness of the questions significantly. Methani et al. [MGKK20] took a different approach to diversify QA templates: they first gathered a larger set of annotators to create questions based on 1400 charts, then manually analyzed the questions collected and synthesized 74 question templates, and finally hired in-house annotators to manually paraphrase the templates carefully to avoid unnaturalness; the final PlotQA dataset is much closer to the real-world challenge of reasoning over charts. More recently, Masry et al. [MDT∗22] abandoned templates and adopted T5 [RSR∗20], a large-scale language model that is trained on very large public data and was shown to learn general linguistic properties and variations [BMR∗20], to generate human-like questions with adequate lexical and syntactic variations automatically.
9 Challenges and Opportunities
Section 6.1 mentions that very few corpora are reused or transformed in subsequent works. As a result, it is difficult to evaluate and compare related analysis techniques and measure research progress. This leads to the question of whether we can build benchmark corpora for the same chart analysis tasks. In addition, are there gaps in the current literature that entail the need to create new types of corpora with new types of annotations? In this section, we reflect on these questions based on our survey in the previous 6 sections. We first identify under-explored problems and research opportunities in corpora-based automated chart analysis, then suggest approaches for building benchmark chart corpora to support these research efforts.
9.1 Under-explored Problems and Research Opportunities
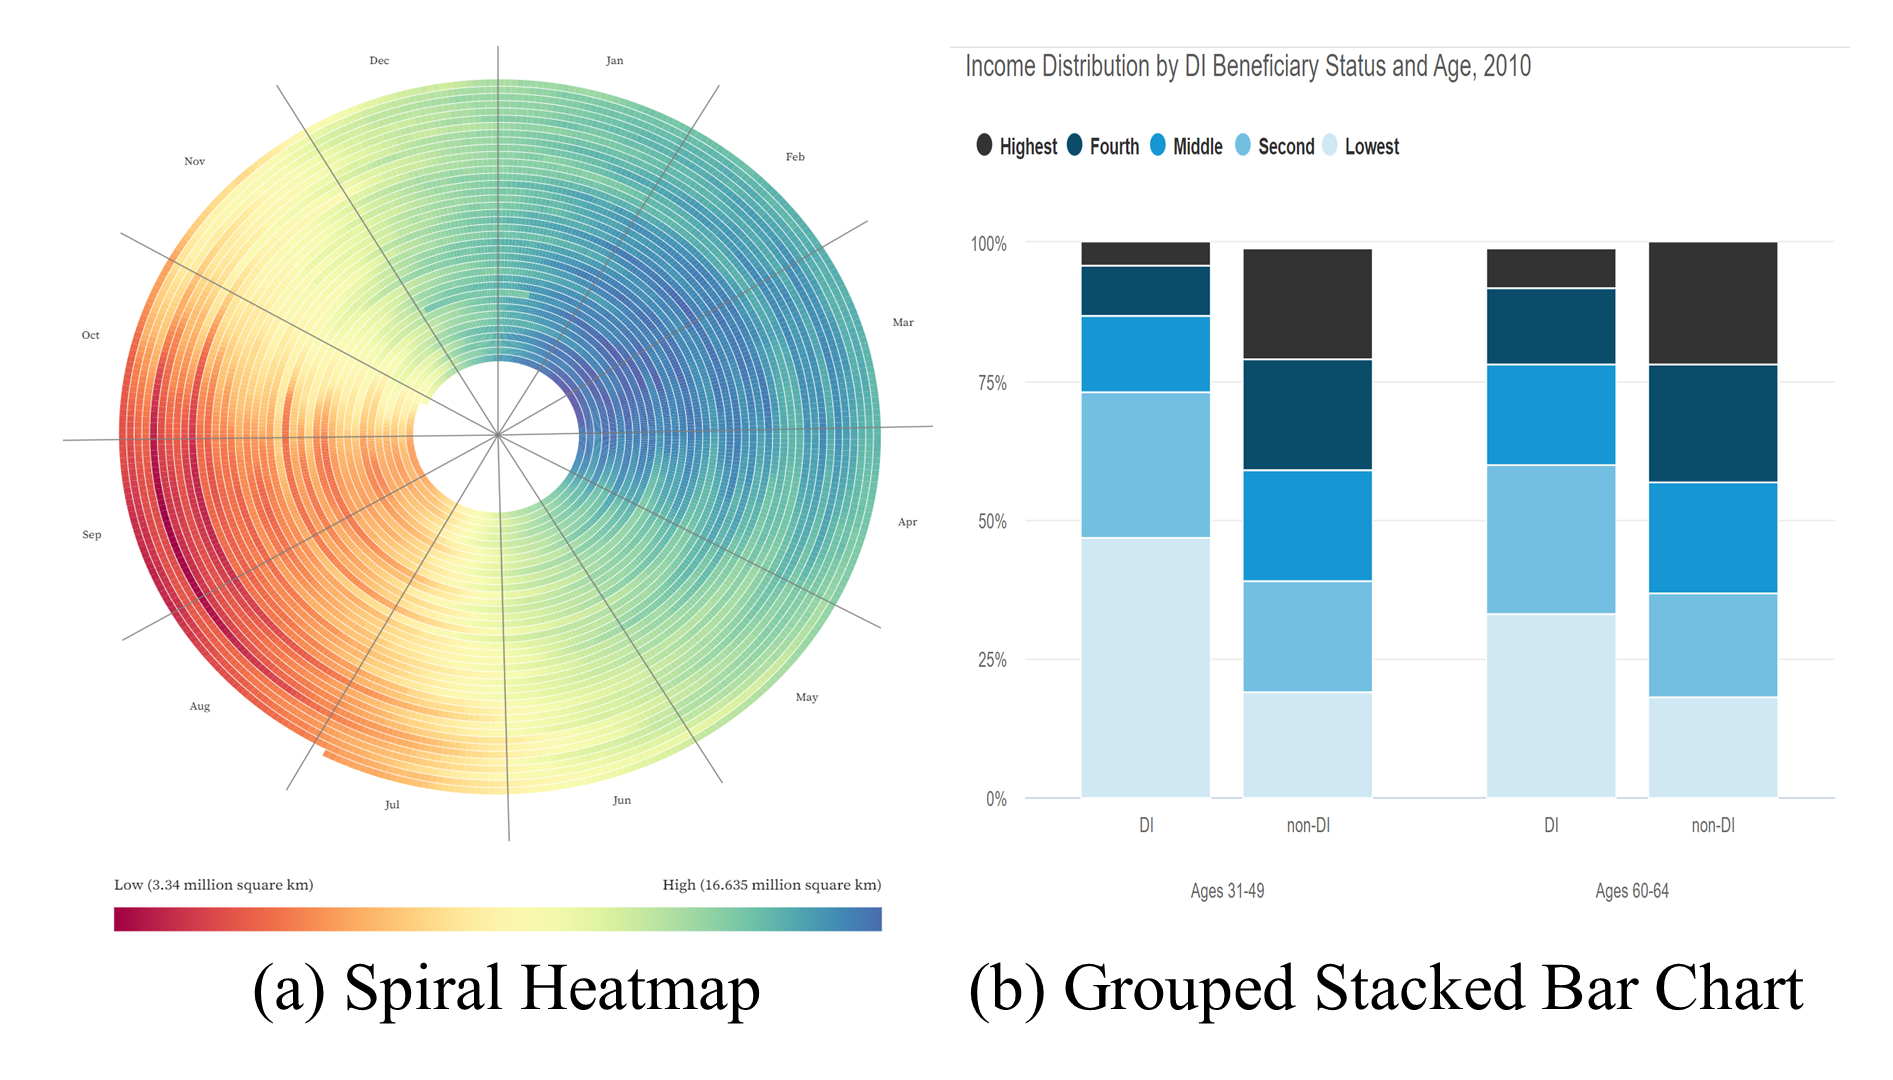
RO1: Beyond Chart Types. For semantics extraction tasks, chart type is often used as a high-level description to classify input charts. Automatically categorizing chart types can support downstream applications such as redesign and reuse [SKC∗11, BDM∗18, DWS∗22]. However, chart typologies used in the papers are sometimes not consistent. For example, histogram was listed as one of the chart types considered in Saleh et al.[SDHL15], while it was subsumed under the bar chart type in Li et al. [LWW∗22]. Also, the descriptive power of the concept of a chart type has its limitations. First, it is possible that a chart design may be classified into more than one chart type; for example, Figure 7(a) is both a spiral plot (focusing the layout) and a heatmap (focusing the colors), and Figure 7(b) can be described as a grouped bar chart or a stacked bar chart. In such cases, it is hard to decide on just one category.
Second, within one chart type, many design variations can exist. It is important for researchers to specify the exact scope of their work; for example, Chen et al. [CZK∗19] explicitly specified horizontal or vertical single bar charts as their scope, and Chaudhry et al. [CSG∗20] mentioned stacked/grouped/single bar charts as their scope. Many other papers [AZG17, LWL21], however, defined and used chart types casually, making it hard to measure a model’s exact capacity. The limited descriptive power and the lack of consistently defined chart typologies may have contributed to the difficulties of building benchmark corpora.
Instead of high-level chart typologies, feature tags can be a better way to describe a given chart — multiple tags can be used together to specify the mark types and visual designs. Taking Figure 7(b) as an example, tags we can assign to it include “bar”, “stacked”, and “grouped”, which span a more complete description compared to a vague chart category. We can further add “grid” to indicate the layout information, which in most cases is not included in chart typologies. Thus, one can use different levels of tags to represent multi-level semantics information presented in a chart, which is potentially more helpful for chart analysis tasks.
Taking a step further, we can think about how modern charting tools generate visualizations: they have long moved beyond chart types to adopt the Grammar of Graphics (GoG) paradigm [Wil12]; examples include Vega-Lite [SMWH16] that provides declarative specifications of grammar primitives, Charticulator [RLB18] that proposed a constraint-based chart layout framework to achieve bespoke designs, and Data Illustrator [LTW∗18] that incorporated data binding into direct manipulation of chart elements. It is worth considering how we can label and decompose charts into graphical primitives. Some works have started to develop techniques sharing this philosophy, e.g., the graphical element update taxonomy proposed in Chartreuse [CWH∗21]. More research needs to be investigated to make it generalizable to a broader range of charts and tasks.
RO2: Beyond Chart Similarity. Some works, e.g., Hu et al. [HBL∗19], Dibia and Demiralp [DD19], and Li et al. [LWW∗22], recommend or retrieve charts based on similarities in visual structure or style. Although similarity is an informative metric in many situations, some applications can require other types of derived chart properties. For example, when visualization creators are seeking design ideas, similarity may not be their primary desired criterion; instead, they prefer alternative or bespoke designs to broaden the scope of consideration [BLBL22].
Chart quality is another under-explored derived property. In our surveyed papers, only Fu et al. [FWD∗19] focused on chart quality, trying to rank charts regarding aesthetics or memorability scores automatically. Apart from aesthetics, we would like to point out that chart quality has other dimensions, such as effectiveness, i.e., to what extent a chart design is suitable for visualizing given datasets. In general, the automatic assessment of chart quality (including aesthetics and suitableness) remains an open research question.
RO3: Tool/Source-Agnostic Chart Analysis. Many works use a chart corpus with a narrow scope and low diversity, assuming that the charts belong to a specific type, created by specific tools or from specific sources. These works thus have listed generalizability as one of their limitations and acknowledge tool/source-agnostic chart analysis techniques or systems as an important problem to be addressed in future work. For example, some systems such as Qian et al. [QSC∗20] and Cui et al. [CZW∗19] rely on predefined templates to generate the final infographics, thus are not expected to scale well in terms of design variation [CWH∗21]; Obeid and Hoque [OH20] would like to create larger corpora that cover more diverse domains further to improve the generalizability of their chart summarizing model; the D3 search engine [HA19] includes supporting databases containing diverse chart collections, helping to discover differences regarding design patterns across a variety of sources in their future work; the chart retrieval technique in Li et al. [LWW∗22], which is built solely on charts form Plotly [Plo23] and required consistent usage and grouping of SVG elements, could fail to function well with charts from other tools like D3 [BOH11] and Data Illustrator [LTW∗18]. Thus, increasing the diversity of chart corpora to create tool/source-agnostic techniques for automated chart analysis is a consensus within this field, and remains a significant research problem.
RO4: Design Generation with More Diverse Corpus. Current research on automatic generation of chart design mostly relies on a chart corpus in the program format from a single charting tool (e.g., Zhao et al. [ZFF20] and Dibia and Demiralp [DD19]). This practice limits corpus diversity, which in turn potentially hurts the diversity of generated designs. Ample research opportunities are available when we include corpora in SVG or raster image formats as the basis for chart generation, which require novel techniques to synthesize visual structures and designs from various sources.
RO5: Systematic Methods to Measure Diversity. As discussed in Section 8, researchers are using a variety of empirical methods to enhance diversity in chart corpora. However, to date, there have been no metrics to quantify or measure diversity. There is a clear need for systematic methods to evaluate chart diversity within a corpus and compare diversity between corpora. Such methods can guide chart selection processes and enhance the rigor of automated chart analysis research.
RO6: Interactive and Animated Charts. Unlike online bitmap charts (.png, .jpeg), SVG-based charts are oftentimes interactive and animated [BDM∗18]. However, the logic for interactions and animations is currently specified using JavaScript in most cases rather than being part of the SVG specification that is extractable. In all the SVG-based corpora we surveyed, none has annotations regarding interactive or animated behaviors. The D3 search engine [HA19], for instance, discusses interaction support as a limitation and future work. How to automatically capture, represent, understand, and extract interactivity and animation remains under-explored and would potentially facilitate new research ideas.
9.2 Desired Properties of Benchmark Corpora
With the goal of building benchmark corpora and the open opportunities described in Section 9.1 in mind, we discuss the desired properties (DP) of benchmark corpora below.
DP1: Enhance Chart Diversity within a Corpus. Diversity in terms of chart source, employed charting tool, chart design, and visual style plays a vital role in the generalizability and robustness of chart analysis techniques. The standard practices presented in Section 8 can be applied to achieve this desired property.
In addition, we have found little effort in current practices to enhance diversity in terms of chart format. As we discussed in Section 4, both the bitmap and vector graphics formats have their unique pros and cons, e.g., parsing a vector-format chart might give more accurate results compared to extracting the same information from a bitmap image, while collecting qualified vector graphics might be more laborious and error-prone. In this sense, it is ideal that a benchmark corpus can include both formats for each chart and maintain a set of annotations (e.g., bounding boxes and mark types) that are applicable to both formats. Charts in the program format can also be considered, while it would be more difficult than merging bitmaps with vector graphics because program-format charts are text-based and their grammar varies according to the underlying languages.
A diverse corpus can provide a strong foundation for research investigations in RO2 (Beyond Chart Similarity), RO3 (Tool/Source-Agnostic Chart Analysis), RO4 (Design Generation with More Diverse Corpus), and RO5 (Quantifying Diversity).
DP2: Multi-level Fine-Grained Annotations. Most of the existing annotations are either at the chart level (e.g. chart type, source data) or about position information (e.g., mark bounding boxes). Only a few corpora contain finer-grained annotations at the component level like encodings and layout which require deeper extraction of semantics, and these corpora usually have a narrow scope and limited diversity. The lack of fine-grained annotations makes it difficult to reuse some large-scale and diverse corpora for new tasks. We expect a benchmark dataset to contain multi-level fine-grained annotations, which can support a variety of chart analysis tasks and may lead to novel research questions and application scenarios. Apart from the commonly seen annotation types described in Section 7.1, chart feature tags and effectiveness labels should also be considered. With a set of multi-level fine-grained annotations, it is easier to transform a benchmark corpus into a desired one by filtering specific annotation values; e.g., one can set the chart tags to the combination of “grouped” and “bar” to receive grouped bar charts in the corpus. With such annotations consistently applied across different collecting sources (DP1), it is also more straightforward to test the generalizability of developed techniques.
The task of generating natural language descriptions can also benefit from fine-grained annotations that establish correspondences between chart components such as marks and encodings with text elements such as tokens, phrases, and sentences [KHA14]. Such annotations can also enable automatic synchronization between chart and text components for applications beyond synthesizing descriptions, e.g., dynamic presentation of relevant charts for enhanced reading [BLE18], and automatic linking text and chart elements in dynamic layouts [SCBL21]. This thread of work is not included in this report because (1) their corpora mainly consist of storytelling articles and papers [LZK∗21] whose property space could be different, and (2) the consideration of document layout that is beyond the charts themselves [SCBL21]. Thus, we leave a more detailed analysis of these techniques as future work.
It is worth mentioning that there have been efforts to improve the quality of annotations in benchmark chart corpora. One example is the ICPR CHART-Infographics dataset [ICD23] used in the CDAR competition on raw data extraction and visual question answering. Each chart in the dataset has a corresponding JSON representation of annotations over chart type, text values and roles, axes and legend, underlying raw data, and QA pairs. Their annotation tool [Ann23] has also been released. This competition highlights the importance of benchmark corpora for developing and comparing models, and the community’s awareness of the need for such corpora with high-quality annotations. Still, further work is needed to create fine-grained corpora for different tasks and use cases.
A corpus with aforementioned multi-level annotations can support research efforts in RO1 (Beyond Chart Types), RO2 (Beyond Chart Similarity), RO4 (Design Generation with More Diverse Corpus), and RO5 (Quantifying Diversity).
DP3: Interactivity and Animation Understanding. Ideally, a benchmark corpus also contains meta-information or annotations about the interactive or animated behaviors in SVG charts. Two aspects of obtaining such data shall be researched: (1) the semantic abstractions or tags for describing interactivity and animation, and (2) the methods for capturing and understanding interactivity and animation. Some previous works have made efforts in these two aspects: Park et al. [PMK08] and Myers et al. [MPN∗08] examined how designers design and describe interactive behaviors, and Raji et al. [RDHH20] developed a system called Loom to capture and share interactive visualization in the Tableau application. More research needs to be investigated to help record the interactivity and animation information in a corpus, which can further support research efforts in RO1 (Beyond Chart Types) and RO6 (Interactive and Animated Charts).
9.3 Desired Tools for Creating Benchmark Corpora
In this section, we propose multiple desired tools (DT) that can facilitate the creation of benchmark corpora with properties described in DP1-DP3.
DT1: Smart web crawler. Given DP1 and DP3, we may need to collect interactive SVG images from a variety of sources where the composition structure of SVG charts on the web differ. There are some special cases where the web crawler needs to take additional care to collect a complete SVG file. For example, in the Plotly Gallery of bar charts111https://plotly.com/python/bar-charts/, there can be multiple SVG elements in the HTML for a single interactive SVG chart, one is for rendering the chart and the others are for interaction controls; also, the legend for an SVG chart is usually stored in a separate SVG element in the HTML. Thus, the following features would be useful: (1) automatic merging and filtering of SVG chart elements, (2) identifying and recording SVG elements for interaction and animation controls, and (3) necessary post-processing such as crop and resize for both vector graphics and bitmaps. Implementing such a smart web crawler that works for both interactive SVG charts and bitmaps is important to the corpus quality; otherwise, intensive labor would be expected to ensure the quality of SVG charts.
DT2: Tools to pre-process and clean up SVG. As discussed in Section 4, the embedded semantic information in SVG charts from the wild is not always accurate or reliable. Apart from the web crawler, we need tools to accurately extract SVG elements and unify them in a consistent format to achieve DP1, DP3 and prepare for DP2. The features of such tools include but are not limited to:
-
1.
Analyzing a given <path> element to identify its mark type (rectangle, circle, line, polygon, etc.).
-
2.
Filtering graphical elements that are not part of the chart semantics, such as watermarks and backgrounds.
-
3.
Merging separate text elements that belong to the same label or title together.
-
4.
Recording accurately the positions and the visual style attributes of every SVG element.
DT3: Mix-initiative annotating system. Obtaining high-quality annotations is generally expensive and time-consuming, especially for complex annotations (DP2) requiring careful examination over charts. To this end, dedicated research in human-AI collaboration for the annotation process is necessary. To achieve an effective mix-initiative labeling system, we need to consider for each annotation type, what steps can be automated by the computers and what steps shall be operated or examined by humans. Let’s take QA pair annotations as an example. Most current practices for annotating QA pairs are either through templates [CZK∗19, SS20] or employing annotators [MGKK20, KHA20]. Given the recent advances in large language models [FC20], it is possible that the annotation system first generates a set of questions and lets the annotator identify valid ones. After that, the system can utilize state-of-the-art QA techniques to propose answers to selected questions, whose tokens can be interactively edited by the annotator. During this collaboration, additional finer-grained annotations, such as references between texts (questions or answers) and chart components [KHA14] can be further introduced, adding more details (DP2). This kind of human-in-the-loop annotating process is expected to significantly reduce the cost of obtaining annotations and boost the research in automated chart analysis.
10 Conclusion
In this state-of-the-art report, we review 56 chart corpora created or used for automated chart analysis. Our analysis is based on a three-level task taxonomy (goal, method, output) and five corpus properties (format, scope, collection method, annotations, and diversity). We argue that there is a need to create benchmark corpora of higher diversity with multi-level finer-grained annotations for various chart analysis tasks. We identify new research opportunities in building tools for creating benchmark corpora, and discuss how such corpora can form the foundation for future advances in automated chart analysis research.
References
- [Acl23] ACL Anthology Repository, 2023. https://aclanthology.org/.
- [AGH99] Allen J. E., Guinn C. I., Horvtz E.: Mixed-initiative interaction. IEEE Intelligent Systems and their Applications 14, 5 (1999), 14–23. doi:10.1109/5254.796083.
- [Ann23] Chart Infographics - Tools for chart annotations, 2023. https://github.com/kdavila/ChartInfo_annotation_tools.
- [AZG17] Al-Zaidy R., Giles C.: A machine learning approach for semantic structuring of scientific charts in scholarly documents. In Proceedings of the AAAI Conference on Artificial Intelligence (2017), vol. 31, pp. 4644–4649. doi:https://doi.org/10.1609/aaai.v31i2.19088.
- [BDM∗18] Battle L., Duan P., Miranda Z., Mukusheva D., Chang R., Stonebraker M.: Beagle: Automated extraction and interpretation of visualizations from the web. In Proceedings of the 2018 CHI Conference on Human Factors in Computing Systems (2018), pp. 1–8. doi:10.1145/3173574.3174168.
- [Bin23] See it, search it | Bing Visual Search, 2023. https://www.bing.com/visualsearch.
- [BKO∗17] Bylinskii Z., Kim N. W., O’Donovan P., Alsheikh S., Madan S., Pfister H., Durand F., Russell B., Hertzmann A.: Learning visual importance for graphic designs and data visualizations. In Proceedings of the 30th Annual ACM symposium on user interface software and technology (2017), pp. 57–69. doi:10.1145/3126594.3126653.
- [BLBL22] Bako H. K., Liu X., Battle L., Liu Z.: Understanding how designers find and use data visualization examples. IEEE Transactions on Visualization and Computer Graphics 29, 1 (2022), 1048–1058. doi:10.1109/TVCG.2022.3209490.
- [BLE18] Badam S. K., Liu Z., Elmqvist N.: Elastic documents: Coupling text and tables through contextual visualizations for enhanced document reading. IEEE Transactions on Visualization and Computer Graphics 25, 1 (2018), 661–671. doi:10.1109/TVCG.2018.2865119.
- [BMR∗20] Brown T., Mann B., Ryder N., Subbiah M., Kaplan J. D., Dhariwal P., Neelakantan A., Shyam P., Sastry G., Askell A., Agarwal S., Herbert-Voss A., Krueger G., Henighan T., Child R., Ramesh A., Ziegler D., Wu J., Winter C., Hesse C., Chen M., Sigler E., Litwin M., Gray S., Chess B., Clark J., Berner C., McCandlish S., Radford A., Sutskever I., Amodei D.: Language models are few-shot learners. In Advances in Neural Information Processing Systems (2020), Larochelle H., Ranzato M., Hadsell R., Balcan M., Lin H., (Eds.), vol. 33, Curran Associates, Inc., pp. 1877–1901. URL: https://proceedings.neurips.cc/paper_files/paper/2020/file/1457c0d6bfcb4967418bfb8ac142f64a-Paper.pdf.
- [BOH11] Bostock M., Ogievetsky V., Heer J.: D3 data-driven documents. IEEE Transactions on Visualization and Computer Graphics 17, 12 (2011), 2301–2309. doi:10.1109/TVCG.2011.185.
- [Bok23] Bokeh, 2023. https://bokeh.org/.
- [BS16] Biau G., Scornet E.: A random forest guided tour. Test 25 (2016), 197–227. doi:10.1007/S11749-016-0481-7.
- [BVB∗13] Borkin M. A., Vo A. A., Bylinskii Z., Isola P., Sunkavalli S., Oliva A., Pfister H.: What makes a visualization memorable? IEEE Transactions on Visualization and Computer Graphics 19, 12 (2013), 2306–2315. doi:10.1109/TVCG.2013.234.
- [CAM∗18] Chagas P., Akiyama R., Meiguins A., Santos C., Saraiva F., Meiguins B., Morais J.: Evaluation of convolutional neural network architectures for chart image classification. In 2018 International Joint Conference on Neural Networks (IJCNN) (2018), IEEE, pp. 1–8. doi:10.1109/IJCNN.2018.8489315.
- [CBOA19] Clement C. B., Bierbaum M., O’Keeffe K. P., Alemi A. A.: On the use of arxiv as a dataset. arXiv preprint arXiv:1905.00075 (2019). doi:10.48550/arXiv.1905.00075.
- [CCA11] Chen S. Z., Cafarella M. J., Adar E.: Searching for statistical diagrams. Frontiers of Engineering, National Academy of Engineering (2011), 69–78.
- [CCA15] Chen Z., Cafarella M., Adar E.: Diagramflyer: A search engine for data-driven diagrams. In Proceedings of the 24th International Conference on World Wide Web (2015), pp. 183–186. doi:10.1145/2740908.2742831.
- [CD15] Clark C. A., Divvala S. K.: Looking Beyond Text: Extracting Figures, Tables and Captions from Computer Science Papers. In Scholarly Big Data: AI Perspectives, Challenges, and Ideas, Papers from the 2015 AAAI Workshop, Austin, Texas, USA, January, 2015 (2015), Caragea C., Giles C. L., Bhamidipati N. L., Caragea D., Gollapalli S. D., Kataria S., Liu H., Xia F., (Eds.), vol. WS-15-13 of AAAI Technical Report, AAAI Press. URL: http://aaai.org/ocs/index.php/WS/AAAIW15/paper/view/10092.
- [CD16] Clark C., Divvala S.: Pdffigures 2.0: Mining figures from research papers. In Proceedings of the 16th ACM/IEEE-CS on Joint Conference on Digital Libraries (2016), pp. 143–152. doi:10.1145/2910896.2910904.
- [Cha23] ChartBlocks: Online Chart Builder, 2023. https://www.chartblocks.io/.
- [Cit23] CiteSeerX, 2023. https://citeseerx.ist.psu.edu/.
- [CJP∗19] Choi J., Jung S., Park D. G., Choo J., Elmqvist N.: Visualizing for the non-visual: Enabling the visually impaired to use visualization. In Computer Graphics Forum (2019), vol. 38, Wiley Online Library, pp. 249–260. doi:10.1111/cgf.13686.
- [CPL∗22] Chang S., Palzer D., Li J., Fosler-Lussier E., Xiao N.: MapQA: A dataset for question answering on choropleth maps. In NeurIPS 2022 First Table Representation Workshop (2022). URL: https://openreview.net/forum?id=znKbVjeR0yI.
- [CRMY17] Cliche M., Rosenberg D., Madeka D., Yee C.: Scatteract: Automated extraction of data from scatter plots. In Machine Learning and Knowledge Discovery in Databases: European Conference, ECML PKDD 2017, Skopje, Macedonia, September 18–22, 2017, Proceedings, Part I 10 (2017), Springer, pp. 135–150. doi:10.1007/978-3-319-71249-9_9.
- [CSG∗20] Chaudhry R., Shekhar S., Gupta U., Maneriker P., Bansal P., Joshi A.: LEAF-QA: Locate, encode & attend for figure question answering. In Proceedings of the IEEE/CVF Winter Conference on Applications of Computer Vision (2020), pp. 3512–3521. doi:10.1109/WACV45572.2020.9093269.
- [CV95] Cortes C., Vapnik V.: Support-vector networks. Machine learning 20 (1995), 273–297. doi:10.1023/A:1022627411411.
- [CWG16] Choudhury S. R., Wang S., Giles C. L.: Scalable algorithms for scholarly figure mining and semantics. In Proceedings of the International Workshop on Semantic Big Data (2016), pp. 1–6. doi:10.1145/2928294.2928305.
- [CWH∗21] Cui W., Wang J., Huang H., Wang Y., Lin C.-Y., Zhang H., Zhang D.: A mixed-initiative approach to reusing infographic charts. IEEE Transactions on Visualization and Computer Graphics 28, 1 (2021), 173–183. doi:10.1109/TVCG.2021.3114856.
- [CWW∗19] Chen Z., Wang Y., Wang Q., Wang Y., Qu H.: Towards automated infographic design: Deep learning-based auto-extraction of extensible timeline. IEEE Transactions on Visualization and Computer Graphics 26, 1 (2019), 917–926. doi:10.1109/TVCG.2019.2934810.
- [CZK∗19] Chen C., Zhang R., Koh E., Kim S., Cohen S., Yu T., Rossi R., Bunescu R.: Figure captioning with reasoning and sequence-level training. arXiv preprint arXiv:1906.02850 (2019). doi:10.48550/arXiv.1906.02850.
- [CZL∗20] Chen X., Zeng W., Lin Y., Ai-Maneea H. M., Roberts J., Chang R.: Composition and configuration patterns in multiple-view visualizations. IEEE Transactions on Visualization and Computer Graphics 27, 2 (2020), 1514–1524. doi:10.1109/TVCG.2020.3030338.
- [CZW∗19] Cui W., Zhang X., Wang Y., Huang H., Chen B., Fang L., Zhang H., Lou J.-G., Zhang D.: Text-to-viz: Automatic generation of infographics from proportion-related natural language statements. IEEE Transactions on Visualization and Computer Graphics 26, 1 (2019), 906–916. doi:10.1109/TVCG.2019.2934785.
- [D3G23] D3 Gallery, 2023. https://observablehq.com/@d3/gallery.
- [Dbl23] DBLP: computer science bibliography, 2023. https://dblp.org/.
- [DCM12] Demir S., Carberry S., McCoy K. F.: Summarizing information graphics textually. Computational Linguistics 38, 3 (2012), 527–574. doi:10.1162/COLI_a_00091.
- [DD19] Dibia V., Demiralp Ç.: Data2vis: Automatic generation of data visualizations using sequence-to-sequence recurrent neural networks. IEEE Computer Graphics and Applications 39, 5 (2019), 33–46. doi:10.1109/MCG.2019.2924636.
- [DSD∗20] Davila K., Setlur S., Doermann D., Kota B. U., Govindaraju V.: Chart mining: A survey of methods for automated chart analysis. IEEE Transactions on Pattern Analysis and Machine Intelligence 43, 11 (2020), 3799–3819. doi:10.1109/TPAMI.2020.2992028.
- [DWS∗22] Deng D., Wu Y., Shu X., Wu J., Fu S., Cui W., Wu Y.: Visimages: A fine-grained expert-annotated visualization dataset. IEEE Transactions on Visualization & Computer Graphics, 01 (2022), 1–1. doi:10.1109/TVCG.2022.3155440.
- [FC20] Floridi L., Chiriatti M.: Gpt-3: Its nature, scope, limits, and consequences. Minds and Machines 30 (2020), 681–694. doi:10.1007/s11023-020-09548-1.
- [Fli23] Flickr: Find your inspiration., 2023. https://www.flickr.com/.
- [Fre23] Freepik: Free Vectors, Stock Photos & PSD Downloads, 2023. https://www.freepik.com/.
- [Fus23] FusionCharts: JavaScript charts for web & mobile, 2023. https://www.fusioncharts.com/.
- [FWD∗19] Fu X., Wang Y., Dong H., Cui W., Zhang H.: Visualization assessment: A machine learning approach. In 2019 IEEE Visualization Conference (VIS) (2019), IEEE, pp. 126–130. doi:10.1109/VISUAL.2019.8933570.
- [Geo23] GeoPandas, 2023. https://geopandas.org/en/stable/.
- [Goo23] Google Images, the most comprehensive image search on the web., 2023. https://images.google.com/.
- [Gra23] Graphiq, 2023. https://en.wikipedia.org/wiki/Graphiq.
- [Gro23a] 11 Charts about the Social Security Disability Insurance Program, 2023. https://www.urban.org/features/11-charts-about-social-security-disability-insurance-program.
- [Gro23b] Grouped Bar Chart Example From Plotly, 2023. https://plotly.com/python/bar-charts/.
- [Gtd23] Global Terrorism Database, 2023. https://www.kaggle.com/datasets/START-UMD/gtd.
- [GWK∗18] Gu J., Wang Z., Kuen J., Ma L., Shahroudy A., Shuai B., Liu T., Wang X., Wang G., Cai J., et al.: Recent advances in convolutional neural networks. Pattern Recognition 77 (2018), 354–377. doi:10.1016/J.PATCOG.2017.10.013.
- [GZB12] Gao J., Zhou Y., Barner K. E.: View: Visual information extraction widget for improving chart images accessibility. In 2012 19th IEEE International Conference on Image Processing (2012), IEEE, pp. 2865–2868. doi:10.1109/ICIP.2012.6467497.
- [HA14] Harper J., Agrawala M.: Deconstructing and restyling d3 visualizations. In Proceedings of the 27th annual ACM symposium on User interface software and technology (2014), pp. 253–262. doi:10.1145/2642918.2647411.
- [HA17] Harper J., Agrawala M.: Converting basic d3 charts into reusable style templates. IEEE Transactions on Visualization and Computer Graphics 24, 3 (2017), 1274–1286. doi:10.1109/TVCG.2017.2659744.
- [HA19] Hoque E., Agrawala M.: Searching the visual style and structure of d3 visualizations. IEEE Transactions on Visualization and Computer Graphics 26, 1 (2019), 1236–1245. doi:10.1109/TVCG.2019.2934431.
- [HBL∗19] Hu K., Bakker M. A., Li S., Kraska T., Hidalgo C.: Vizml: A machine learning approach to visualization recommendation. In Proceedings of the 2019 CHI Conference on Human Factors in Computing Systems (2019), pp. 1–12. doi:10.1145/3290605.3300358.
- [HGDG17] He K., Gkioxari G., Dollár P., Girshick R.: Mask R-CNN. In Proceedings of the IEEE International Conference on Computer Vision (2017), pp. 2961–2969. doi:10.1109/TPAMI.2018.2844175.
- [HGH∗19] Hu K., Gaikwad S., Hulsebos M., Bakker M. A., Zgraggen E., Hidalgo C., Kraska T., Li G., Satyanarayan A., Demiralp Ç.: Viznet: Towards a large-scale visualization learning and benchmarking repository. In Proceedings of the 2019 CHI Conference on Human Factors in Computing Systems (2019), pp. 1–12. doi:10.1145/3290605.3300892.
- [HGH21] Hsu T.-Y., Giles C. L., Huang T.-H.: SciCap: Generating captions for scientific figures. In Findings of the Association for Computational Linguistics: EMNLP 2021 (Punta Cana, Dominican Republic, Nov. 2021), Association for Computational Linguistics, pp. 3258–3264. URL: https://aclanthology.org/2021.findings-emnlp.277, doi:10.18653/v1/2021.findings-emnlp.277.
- [HT07] Huang W., Tan C. L.: A system for understanding imaged infographics and its applications. In Proceedings of the 2007 ACM symposium on Document engineering (2007), pp. 9–18. doi:10.1145/1284420.1284427.
- [HTP18] Haehn D., Tompkin J., Pfister H.: Evaluating ‘graphical perception’ with cnns. IEEE Transactions on Visualization and Computer Graphics 25, 1 (2018), 641–650. doi:10.1109/TVCG.2018.2865138.
- [HWWL21] Huang D., Wang J., Wang G., Lin C.-Y.: Visual style extraction from chart images for chart restyling. In 2020 25th International Conference on Pattern Recognition (ICPR) (2021), IEEE, pp. 7625–7632. doi:10.1109/ICPR48806.2021.9412153.
- [ICD23] CDAR 2023 Competition on Harvesting Answers and Raw Tables from Infographics (Chart-Infographics), 2023. https://chartinfo.github.io/.
- [IHK∗17] Isenberg P., Heimerl F., Koch S., Isenberg T., Xu P., Stolper C., Sedlmair M., Chen J., Möller T., Stasko J.: vispubdata.org: A metadata collection about IEEE visualization (VIS) publications. IEEE Transactions on Visualization and Computer Graphics 23, 9 (Sept. 2017), 2199–2206. URL: https://tobias.isenberg.cc/VideosAndDemos/Isenberg2017VMC, doi:10.1109/TVCG.2016.2615308.
- [JKS∗17] Jung D., Kim W., Song H., Hwang J.-i., Lee B., Kim B., Seo J.: Chartsense: Interactive data extraction from chart images. In Proceedings of the 2017 CHI Conference on Human Factors in Computing Systems (2017), pp. 6706–6717. doi:10.1145/3025453.3025957.
- [JMJ19] Jobin K., Mondal A., Jawahar C.: Docfigure: A dataset for scientific document figure classification. In 2019 International Conference on Document Analysis and Recognition Workshops (ICDARW) (2019), vol. 1, IEEE, pp. 74–79. doi:10.1109/ICDARW.2019.00018.
- [KAM∗18] Kahou S. E., Atkinson A., Michalski V., Ákos Kádár, Trischler A., Bengio Y.: FigureQA: An annotated figure dataset for visual reasoning, 2018. URL: https://openreview.net/forum?id=SyunbfbAb.
- [Kff23] Kaiser Family Foundation: Filling the need for trusted information on national health issues, 2023. https://www.kff.org/.
- [KHA14] Kong N., Hearst M. A., Agrawala M.: Extracting references between text and charts via crowdsourcing. In Proceedings of the SIGCHI conference on Human Factors in Computing Systems (2014), pp. 31–40. doi:10.1145/2556288.2557241.
- [KHA20] Kim D. H., Hoque E., Agrawala M.: Answering questions about charts and generating visual explanations. In Proceedings of the 2020 CHI Conference on Human Factors in Computing Systems (2020), pp. 1–13. doi:10.1145/3313831.3376467.
- [KM18] Kim E., McCoy K. F.: Multimodal deep learning using images and text for information graphic classification. In Proceedings of the 20th International ACM SIGACCESS Conference on Computers and Accessibility (2018), pp. 143–148. doi:10.1145/3234695.3236357.
- [KPCK18] Kafle K., Price B., Cohen S., Kanan C.: Dvqa: Understanding data visualizations via question answering. In Proceedings of the IEEE Conference on Computer Vision and Pattern Recognition (2018), pp. 5648–5656. doi:10.1109/CVPR.2018.00592.
- [KSL∗16] Kim N. W., Schweickart E., Liu Z., Dontcheva M., Li W., Popovic J., Pfister H.: Data-driven guides: Supporting expressive design for information graphics. IEEE Transactions on Visualization and Computer Graphics 23, 1 (2016), 491–500. doi:10.1109/TVCG.2016.2598620.
- [LCMZ21] Liu Z., Chen C., Morales F., Zhao Y.: Atlas: Grammar-based procedural generation of data visualizations. In 2021 IEEE Visualization Conference (VIS) (2021), IEEE, pp. 171–175. doi:10.1109/VIS49827.2021.9623315.
- [LLJ∗20] Lai C., Lin Z., Jiang R., Han Y., Liu C., Yuan X.: Automatic annotation synchronizing with textual description for visualization. In Proceedings of the 2020 CHI Conference on Human Factors in Computing Systems (2020), pp. 1–13. doi:10.1145/3313831.3376443.
- [LLWL21] Luo J., Li Z., Wang J., Lin C.-Y.: Chartocr: data extraction from charts images via a deep hybrid framework. In Proceedings of the IEEE/CVF Winter Conference on Applications of Computer Vision (2021), pp. 1917–1925. doi:10.1109/WACV48630.2021.00196.
- [LNS11] Liu Z., Navathe S. B., Stasko J. T.: Network-based visual analysis of tabular data. In 2011 IEEE Conference on Visual Analytics Science and Technology (VAST) (2011), IEEE, pp. 41–50. doi:10.1109/VAST.2011.6102440.
- [LNS14] Liu Z., Navathe S. B., Stasko J. T.: Ploceus: Modeling, visualizing, and analyzing tabular data as networks. Information Visualization 13, 1 (2014), 59–89. doi:10.1177/1473871613488591.
- [LTW∗18] Liu Z., Thompson J., Wilson A., Dontcheva M., Delorey J., Grigg S., Kerr B., Stasko J.: Data illustrator: Augmenting vector design tools with lazy data binding for expressive visualization authoring. In Proceedings of the 2018 CHI Conference on Human Factors in Computing Systems (2018), pp. 1–13. doi:10.1145/3173574.3173697].
- [LWH17] Lee P.-s., West J. D., Howe B.: Viziometrics: Analyzing visual information in the scientific literature. IEEE Transactions on Big Data 4, 1 (2017), 117–129. doi:10.1109/TBDATA.2017.2689038.
- [LWL∗20] Lu M., Wang C., Lanir J., Zhao N., Pfister H., Cohen-Or D., Huang H.: Exploring visual information flows in infographics. In Proceedings of the 2020 CHI Conference on Human Factors in Computing Systems (2020), pp. 1–12. doi:10.1145/3313831.3376263.
- [LWL21] Luo J., Wang J., Lin C.-Y.: Hybrid cascade point search network for high precision bar chart component detection. In 2020 25th International Conference on Pattern Recognition (ICPR) (2021), IEEE, pp. 6688–6695. doi:10.1109/ICPR48806.2021.9412144.
- [LWW∗22] Li H., Wang Y., Wu A., Wei H., Qu H.: Structure-aware visualization retrieval. In CHI Conference on Human Factors in Computing Systems (2022), pp. 1–14. doi:10.1145/3491102.3502048.
- [LZK∗21] Latif S., Zhou Z., Kim Y., Beck F., Kim N. W.: Kori: Interactive synthesis of text and charts in data documents. IEEE Transactions on Visualization and Computer Graphics 28, 1 (2021), 184–194.
- [Mat23] Matplotlib — Visualization with Python, 2023. https://matplotlib.org/.
- [MBN∗21] Madan S., Bylinskii Z., Nobre C., Tancik M., Recasens A., Zhong K., Alsheikh S., Oliva A., Durand F., Pfister H.: Parsing and summarizing infographics with synthetically trained icon detection. 2021 IEEE 14th Pacific Visualization Symposium (PacificVis) (2021), 31–40.
- [MBT∗22] Mathew M., Bagal V., Tito R., Karatzas D., Valveny E., Jawahar C.: Infographicvqa. In Proceedings of the IEEE/CVF Winter Conference on Applications of Computer Vision (2022), pp. 1697–1706. doi:10.1109/WACV51458.2022.00264.
- [MDT∗22] Masry A., Do X. L., Tan J. Q., Joty S., Hoque E.: ChartQA: A benchmark for question answering about charts with visual and logical reasoning. In Findings of the Association for Computational Linguistics: ACL 2022 (Dublin, Ireland, May 2022), Association for Computational Linguistics, pp. 2263–2279. URL: https://aclanthology.org/2022.findings-acl.177, doi:10.18653/v1/2022.findings-acl.177.
- [MGKK20] Methani N., Ganguly P., Khapra M. M., Kumar P.: Plotqa: Reasoning over scientific plots. In Proceedings of the IEEE/CVF Winter Conference on Applications of Computer Vision (2020), pp. 1527–1536. doi:10.1109/WACV45572.2020.9093523.
- [MKT22] Mahinpei A., Kostic Z., Tanner C.: Linecap: Line charts for data visualization captioning models. In 2022 IEEE Visualization and Visual Analytics (VIS) (2022), IEEE, pp. 35–39. doi:10.1109/VIS54862.2022.00016.
- [ML17] McNabb L., Laramee R. S.: Survey of surveys (sos)-mapping the landscape of survey papers in information visualization. In Computer Graphics Forum (2017), vol. 36, Wiley Online Library, pp. 589–617. doi:10.1111/cgf.13212.
- [MMG∗20] Ma R., Mei H., Guan H., Huang W., Zhang F., Xin C., Dai W., Wen X., Chen W.: Ladv: Deep learning assisted authoring of dashboard visualizations from images and sketches. IEEE Transactions on Visualization and Computer Graphics 27, 9 (2020), 3717–3732. doi:10.1109/TVCG.2020.2980227.
- [MPN∗08] Myers B., Park S. Y., Nakano Y., Mueller G., Ko A.: How designers design and program interactive behaviors. In 2008 IEEE Symposium on Visual Languages and Human-Centric Computing (2008), IEEE, pp. 177–184. doi:10.1109/VLHCC.2008.4639081.
- [MTW∗18] Ma Y., Tung A. K., Wang W., Gao X., Pan Z., Chen W.: Scatternet: A deep subjective similarity model for visual analysis of scatterplots. IEEE Transactions on Visualization and Computer Graphics 26, 3 (2018), 1562–1576. doi:10.1109/TVCG.2018.2875702.
- [Oec23] United States - OECD, 2023. https://www.oecd.org/unitedstates/.
- [OH20] Obeid J., Hoque E.: Chart-to-text: Generating natural language descriptions for charts by adapting the transformer model. In Proceedings of the 13th International Conference on Natural Language Generation (Dublin, Ireland, Dec. 2020), Association for Computational Linguistics, pp. 138–147. URL: https://aclanthology.org/2020.inlg-1.20.
- [OKM20] Oppermann M., Kincaid R., Munzner T.: Vizcommender: Computing text-based similarity in visualization repositories for content-based recommendations. IEEE Transactions on Visualization and Computer Graphics 27, 2 (2020), 495–505. doi:10.1109/TVCG.2020.3030387.
- [Owi23] Our World in Data, 2023. https://ourworldindata.org/.
- [Pdf23] PDFTOHTML conversion program, 2023. https://pdftohtml.sourceforge.net/.
- [Pew23] Pew Research Center, 2023. https://www.pewresearch.org/.
- [PH17] Poco J., Heer J.: Reverse-engineering visualizations: Recovering visual encodings from chart images. In Computer Graphics Forum (2017), vol. 36, Wiley Online Library, pp. 353–363. doi:10.1111/cgf.13193.
- [Plo23] Plotly: the front end for ML and data science models, 2023. https://plotly.com/.
- [PMH17] Poco J., Mayhua A., Heer J.: Extracting and retargeting color mappings from bitmap images of visualizations. IEEE Transactions on Visualization and Computer Graphics 24, 1 (2017), 637–646. doi:10.1109/TVCG.2017.2744320.
- [PMK08] Park S. Y., Myers B., Ko A. J.: Designers’ natural descriptions of interactive behaviors. In 2008 IEEE Symposium on Visual Languages and Human-Centric Computing (2008), IEEE, pp. 185–188. doi:10.1109/VLHCC.2008.4639082.
- [Pyd23] PyDataset, 2023. https://github.com/iamaziz/PyDataset.
- [Pym23] Introduction — PyMuPDF 1.21.1 documentation, 2023. https://pymupdf.readthedocs.io/en/latest/.
- [QSC∗20] Qian C., Sun S., Cui W., Lou J.-G., Zhang H., Zhang D.: Retrieve-then-adapt: Example-based automatic generation for proportion-related infographics. IEEE Transactions on Visualization and Computer Graphics 27, 2 (2020), 443–452. doi:10.1109/TVCG.2020.3030448.
- [Qua23] Quartz | Make business better., 2023. https://qz.com/.
- [RDHH20] Raji M., Duncan J., Hobson T., Huang J.: Dataless sharing of interactive visualization. IEEE Transactions on Visualization and Computer Graphics 27, 9 (2020), 3656–3669. doi:10.1109/tvcg.2020.2984708.
- [RF18] Redmon J., Farhadi A.: Yolov3: An incremental improvement. arXiv preprint arXiv:1804.02767 (2018). doi:10.48550/arXiv.1804.02767.
- [RLB18] Ren D., Lee B., Brehmer M.: Charticulator: Interactive construction of bespoke chart layouts. IEEE Transactions on Visualization and Computer Graphics 25, 1 (2018), 789–799. doi:10.1109/TVCG.2018.2865158.
- [RRDK19] Reddy R., Ramesh R., Deshpande A., Khapra M. M.: Figurenet: A deep learning model for question-answering on scientific plots. In 2019 International Joint Conference on Neural Networks (IJCNN) (2019), IEEE, pp. 1–8. doi:10.1109/IJCNN.2019.8851830.
- [RSE∗21] Rane C., Subramanya S. M., Endluri D. S., Wu J., Giles C. L.: Chartreader: Automatic parsing of bar-plots. In 2021 IEEE 22nd International Conference on Information Reuse and Integration for Data Science (IRI) (2021), IEEE, pp. 318–325. doi:10.1109/IRI51335.2021.00050.
- [RSR∗20] Raffel C., Shazeer N., Roberts A., Lee K., Narang S., Matena M., Zhou Y., Li W., Liu P. J.: Exploring the limits of transfer learning with a unified text-to-text transformer. Journal of Machine Learning Research 21, 140 (2020), 1–67. URL: http://jmlr.org/papers/v21/20-074.html.
- [SCBL21] Sultanum N., Chevalier F., Bylinskii Z., Liu Z.: Leveraging text-chart links to support authoring of data-driven articles with vizflow. In Proceedings of the 2021 CHI Conference on Human Factors in Computing Systems (2021), pp. 1–17. doi:10.1145/3411764.3445354.
- [SDHL15] Saleh B., Dontcheva M., Hertzmann A., Liu Z.: Learning style similarity for searching infographics. Proceedings of the 41st Graphics Interface Conference (2015), 59–64. doi:10.48550/arXiv.1505.01214.
- [Sem23] Semantic Scholar | AI-Powered Research Tool, 2023. https://www.semanticscholar.org/.
- [SGCV19] Sharma M., Gupta S., Chowdhury A., Vig L.: Chartnet: Visual reasoning over statistical charts using mac-networks. In 2019 International Joint Conference on Neural Networks (IJCNN) (2019), IEEE, pp. 1–7. doi:10.1109/IJCNN.2019.8852427.
- [Shu23] Shutterstock: Stock Images, Photos, Vectors, Video, and Music, 2023. https://www.shutterstock.com/.
- [SHVT20] Sun F.-Y., Hoffman J., Verma V., Tang J.: Infograph: Unsupervised and semi-supervised graph-level representation learning via mutual information maximization. In International Conference on Learning Representations (2020). URL: https://openreview.net/forum?id=r1lfF2NYvH.
- [SKC∗11] Savva M., Kong N., Chhajta A., Fei-Fei L., Agrawala M., Heer J.: Revision: Automated classification, analysis and redesign of chart images. In Proceedings of the 24th annual ACM symposium on User interface software and technology (2011), pp. 393–402. doi:10.1145/2047196.2047247.
- [SMWH16] Satyanarayan A., Moritz D., Wongsuphasawat K., Heer J.: Vega-lite: A grammar of interactive graphics. IEEE Transactions on Visualization and Computer Graphics 23, 1 (2016), 341–350. doi:10.1109/TVCG.2016.2599030.
- [Spi23] Spiral Heatmap - Northern hemisphere sea ice extent 1978 to 2017, 2023. https://www.adobe.com/products/illustrator.html.
- [SRHH15] Satyanarayan A., Russell R., Hoffswell J., Heer J.: Reactive vega: A streaming dataflow architecture for declarative interactive visualization. IEEE Transactions on Visualization and Computer Graphics 22, 1 (2015), 659–668. doi:10.1109/TVCG.2015.2467091.
- [SS20] Singh H., Shekhar S.: STL-CQA: Structure-based transformers with localization and encoding for chart question answering. In Proceedings of the 2020 Conference on Empirical Methods in Natural Language Processing (EMNLP) (2020), pp. 3275–3284. doi:10.18653/v1/2020.emnlp-main.264.
- [Sta23] Statista: Empowering people with data, 2023. https://www.statista.com/.
- [Sto23] Huge Stock Market Dataset, 2023. https://www.kaggle.com/datasets/borismarjanovic/price-volume-data-for-all-us-stocks-etfs.
- [SVL14] Sutskever I., Vinyals O., Le Q. V.: Sequence to sequence learning with neural networks. In Advances in Neural Information Processing Systems (2014), Ghahramani Z., Welling M., Cortes C., Lawrence N., Weinberger K., (Eds.), vol. 27, Curran Associates, Inc. URL: https://proceedings.neurips.cc/paper_files/paper/2014/file/a14ac55a4f27472c5d894ec1c3c743d2-Paper.pdf.
- [SWS19] Smart S., Wu K., Szafir D. A.: Color crafting: Automating the construction of designer quality color ramps. IEEE Transactions on Visualization and Computer Graphics 26, 1 (2019), 1215–1225. doi:10.1109/TVCG.2019.2934284.
- [Tab23] Gallery | Tableau Public, 2023. https://public-pantheon.tableau.com/en-us/s/gallery.
- [Tim23] Timeline Storyteller, 2023. https://timelinestoryteller.com/.
- [TLL∗16] Tang B., Liu X., Lei J., Song M., Tao D., Sun S., Dong F.: Deepchart: Combining deep convolutional networks and deep belief networks in chart classification. Signal Processing 124 (2016), 156–161. doi:10.1016/j.sigpro.2015.09.027.
- [TLLS20] Thompson J., Liu Z., Li W., Stasko J.: Understanding the design space and authoring paradigms for animated data graphics. In Computer Graphics Forum (2020), vol. 39, Wiley Online Library, pp. 207–218. doi:10.1111/cgf.13974.
- [TLS21] Thompson J. R., Liu Z., Stasko J.: Data animator: Authoring expressive animated data graphics. In Proceedings of the 2021 CHI Conference on Human Factors in Computing Systems (2021), pp. 1–18. doi:10.1145/3411764.3445747.
- [Veg23] Example Gallery | Vega-Lite, 2023. https://vega.github.io/vega-lite/examples/.
- [Wal23] The Wall Street Journal, 2023. https://www.wsj.com/.
- [Wbo23] World Bank Open Data, 2023. https://data.worldbank.org/.
- [WCEC10] Wu P., Carberry S., Elzer S., Chester D.: Recognizing the intended message of line graphs. In Diagrams (2010), Springer, pp. 220–234. doi:10.1007/978-3-642-14600-8_21.
- [WCWQ21] Wang Q., Chen Z., Wang Y., Qu H.: A survey on ml4vis: Applying machinelearning advances to data visualization. IEEE Transactions on Visualization and Computer Graphics (2021). doi:10.1109/TVCG.2021.3106142.
- [Wdi23] World Development Indicators | DataBank, 2023. https://databank.worldbank.org/source/world-development-indicators.
- [Who23] World Health Organization (WHO), 2023. https://www.who.int/.
- [Wil12] Wilkinson L.: The grammar of graphics. Springer, 2012. doi:10.1198/tech.2007.s456.
- [WPC∗20] Wu Z., Pan S., Chen F., Long G., Zhang C., Philip S. Y.: A comprehensive survey on graph neural networks. IEEE Transactions on Neural Networks and Learning Systems 32, 1 (2020), 4–24. doi:10.1109/TNNLS.2020.2978386.
- [WTD∗20] Wu A., Tong W., Dwyer T., Lee B., Isenberg P., Qu H.: Mobilevisfixer: Tailoring web visualizations for mobile phones leveraging an explainable reinforcement learning framework. IEEE Transactions on Visualization and Computer Graphics 27, 2 (2020), 464–474. doi:10.1109/TVCG.2020.3030423.
- [WWS∗21] Wu A., Wang Y., Shu X., Moritz D., Cui W., Zhang H., Zhang D., Qu H.: Ai4vis: Survey on artificial intelligence approaches for data visualization. IEEE Transactions on Visualization and Computer Graphics (2021). doi:10.1109/TVCG.2021.3099002.
- [XOW∗20] Xu K., Ottley A., Walchshofer C., Streit M., Chang R., Wenskovitch J.: Survey on the analysis of user interactions and visualization provenance. In Computer Graphics Forum (2020), vol. 39, Wiley Online Library, pp. 757–783. doi:10.1111/cgf.14035.
- [Yah23] Yahoo Image Search, 2023. https://images.search.yahoo.com/.
- [YZZ∗21] Yuan L.-P., Zhou Z., Zhao J., Guo Y., Du F., Qu H.: Infocolorizer: Interactive recommendation of color palettes for infographics. IEEE Transactions on Visualization and Computer Graphics 28, 12 (2021), 4252–4266. doi:10.1109/TVCG.2021.3085327.
- [ZFF20] Zhao J., Fan M., Feng M.: Chartseer: Interactive steering exploratory visual analysis with machine intelligence. IEEE Transactions on Visualization and Computer Graphics (2020). doi:10.1109/TVCG.2020.3018724.
- [ZZC∗21] Zhou F., Zhao Y., Chen W., Tan Y., Xu Y., Chen Y., Liu C., Zhao Y.: Reverse-engineering bar charts using neural networks. Journal of Visualization 24 (2021), 419–435. doi:10.1007/S12650-020-00702-6.
Short Biographies of Authors
Chen Chen
Chen Chen is a PhD student working with Professor Zhicheng Liu in the Human-Data Interaction Research Group affiliated with the Human-Computer Interaction Lab (HCIL) at University of Maryland, College Park. His research focuses on data visualization grammar, visualization understanding and reuse, and human-centered AI.
Zhicheng Liu
Zhicheng Liu is an assistant professor of computer science at the University of Maryland College Park (UMD). Before joining UMD, he was a research scientist at Adobe Inc. He directs the Human-Data Interaction research group, which is affiliated with the Human-Computer Interaction Lab at UMD. His past and current research focuses on data visualization grammar and frameworks [LCMZ21, LNS11, TLLS20], visualization design and authoring tools [LTW∗18, TLS21, KSL∗16, LNS14], and techniques to analyze, deconstruct, and reuse visualizations [SDHL15].