Present Address:]Physics Department, University of Tennessee, TN 37996, USA
Cross Section Measurement of the 82Kr(p,)83Rb Reaction in Inverse Kinematics
Abstract
The total cross section of the 82Kr(p,)83Rb reaction was measured for the first time at effective center-of-mass energies between 2.4 and 3.0 MeV, within the relevant Gamow window for the astrophysical process. The experiment took place at the National Superconducting Cyclotron Laboratory at Michigan State University using the ReA facility. A 82Kr beam was directed onto a hydrogen gas cell located at the center of the Summing NaI(Tl) (SuN) detector. The obtained spectra were analyzed using the -summing technique and the extracted cross section was compared to standard statistical model calculations using the non-smoker and talys codes. The comparison indicates that standard statistical model calculations tend to overproduce the cross section of the 82Kr(p,)83Rb reaction relative to the experimentally measured values. Furthermore, the experimental data was used to provide additional constraints on the nuclear level density and -ray strength function used in the statistical model calculations.
I Introduction
One of the most fundamental questions in nuclear astrophysics relates to understanding the mechanisms through which the elements are forged in the stars. For the vast majority of the elements heavier than iron, stellar nucleosynthesis is largely governed by the slow s- and rapid r- neutron capture processes [1, 2, 3], as well as possible contributions from the intermediate i process [4, 5]. However, a relatively small group of naturally occurring, neutron-deficient isotopes, located in the region between 74Se and 196Hg, the so called p nuclei, cannot be formed by the neutron capture processes [6]. These 30 stable nuclei are believed to be formed in the commonly called process from the “burning” of preexisting r- and s-process seeds in stellar environments of sufficiently high temperatures of GK, where a sequence of photodisintegration reactions can occur [7]. The astrophysical site where such temperature conditions are fulfilled has been a subject of controversy for more than 60 years and is currently believed to occur in the ONe layers of Type II supernovae [8, 9, 10], and/or in thermonuclear Type Ia supernovae [11].
In order to reproduce the p-nuclei abundances that are observed in nature, networks of nuclear reactions are simulated under appropriate astrophysical conditions. However, in addition to any astrophysical uncertainties, many nuclear uncertainties enter these network calculations, since there are almost 20 000 nuclear reactions on almost 2 000 nuclei that need to be taken into account [12]. The nuclear physics inputs required for these calculations consists mainly of reaction rates that need to be experimentally constrained [13]. For the case of the process, the dominant reactions are photodisintegration reactions. As mentioned in Ref. [14] it is often advantageous to measure the exothermic reverse reaction. This is because in an astrophysical environment, the ground state contribution to the photodisintegration reaction rate can be small compared to the full reaction rate. It should be noted that the majority of nuclei involved in the process are radioactive, and experimental data are almost non-existent. Therefore, the associated uncertainties in the predicted reaction rates tend to increase significantly when moving away from stability [13].
Despite the decades of considerable experimental effort [15, 16, 17, 18, 19, 20, 21], experimental cross sections of -process reactions are mostly unknown and the related reaction rates are based primarily on Hauser-Feshbach (HF) theoretical calculations [22]. In calculating reaction rates through HF theory, nuclear properties such as nuclear level densities (NLDs) and -ray strength functions (SFs) are used as input. Constraining nuclear input in the HF model remains a challenge and it is therefore crucial to provide new experimental cross sections relevant to the process. The present work contributes to this larger effort to constrain reaction theory by reporting on the first measurement of the 82Kr(p,)83Rb reaction cross section. The measurement took place at effective center-of-mass energies between 2.4 and 3.0 MeV, which are within the relevant Gamow window for the process which lies between 1.9 and 4.0 MeV.
II Experimental Details
The present measurements were carried out at the National Superconducting Cyclotron Laboratory at Michigan State University using the ReA reaccelerator facility [23] to accelerate a stable 82Kr27+ beam at energies of 3.1, 3.4 and 3.7 MeV/nucleon. The delivered beam impinged on a hydrogen gas-cell target and the rays produced by the reaction were detected by the Summing NaI(Tl) (SuN) detector. Details on the experimental setup are provided in Ref. [24], but are briefly summarized here.
The hydrogen gas-cell target, located in the center of the SuN detector, was made of plastic with 2-m thick molybdenum foils used as entrance and exit windows. The cell had a length of 4 cm and included a tantalum ring on the upstream side and tantalum foil lining the inner walls of the cell, to shield the plastic from the beam and reduce beam-induced background. The hydrogen gas inside the cell was kept at a pressure of 600 Torr.
The SuN detector is a 4 calorimeter with the shape of a inch barrel with a 1.8 inch diameter borehole along its axis. The barrel is segmented into 8 optically isolated NaI(Tl) crystals, each connected to three photomultiplier tubes (PMTs). A detailed description of the SuN detector and its data acquisition system can be found in Ref. [25]. By positioning the target at the center of SuN, the large angular coverage and high detection efficiency of the detector allowed for the application of the -summing technique [21, 25]. In this way, the spectra obtained by the individual segments provide sensitivity to the individual -ray transitions, whereas the full energy deposited in SuN provides sensitivity to the populated excitation energies. For this reason, three main spectra are used in SuN data analysis: sum of segments (SoS), total absorption spectra (TAS), and multiplicity. SoS corresponds to the energy detected in the individual segments, TAS to the full energy deposited in the detector, and multiplicity indicates how many segments of SuN recorded energy in each event.
In order to reduce cosmic-ray induced background and increase the sensitivity of the SuN detector, the Scintillating Cosmic Ray Eliminating ENsemble (SuNSCREEN) was positioned above SuN and was utilized as a veto detector [26]. SuNSCREEN is a plastic scintillator detector array comprised of nine bars, each with two PMTs, forming a roof-like arrangement above the SuN detector. To reduce the cosmic-ray induced background, a veto gate was applied to all events that recorded signals in both PMTs of a SuNSCREEN bar, and at least one segment of SuN.
III Analysis
The reaction cross section, , can be calculated as
| (1) |
where is the experimental yield, namely how many reactions of interest were measured, is the number of projectiles, is the areal target density, and is the detection efficiency. The number of projectiles was calculated from the current measured off of the beam pipe which was used as a Faraday cup, taking into account the beam charge state of 27+. The areal target density was calculated based on the size of the gas cell and the average recorded gas pressure during each measurement.
In order to avoid the assumption that all reactions take place at the center of the gas cell, the effective center-of-mass energy, , was calculated. corresponds to the beam energy in the target at which one-half of the yield for the full target thickness is obtained [27]. Assuming a linear decrease in cross section from the entrance of the target to the exit, the effective energy is calculated as:
| (2) |
where is the cross section at the entrance of the target for incident beam energy , is the energy loss within the target, and is the cross section at the exit of the target at . The values for and were obtained from non-smoker [28]. The ratio of was 1.6, 1.7 and 2.0 for initial beam energy 3.7, 3.4 and 3.1 MeV/nucleon respectively. The resulting was in agreement within error with the center-of-mass energy at the center of the gas cell .
In the following section, more details regarding the calculation of the ratio of the yield and the efficiency will be discussed.
III.1 The -summing technique
When a proton from the gas-target is captured by the 82Kr beam, it populates an excited state of 83Rb of energy , where is the beam energy in the center-of-mass system and MeV is the 82Kr(p,)83Rb reaction value. For the present experiment the excitation energy of 83Rb ranges from 8 to 9 MeV. The 83Rb compound nucleus can de-excite through many different possible -ray cascades. The emitted rays are recorded by SuN. By adding the energy of all rays originating from a single cascade, a “sum peak” is produced in the total -summed spectrum with energy equal to [25]. The integral of the sum peak corresponds to the experimental yield, . The efficiency of the sum peak depends not only on the energy , but also on the average -ray multiplicity of the cascade as discussed in Section III.3. Due to the experiment being conducted in inverse kinematics with a gas-target, the sum peak has a larger energy range than in forward kinematics measurements due to Doppler shift and energy straggling through the molybdenum foil and the hydrogen gas. For this reason a recently developed analysis technique was applied to this measurement. The technique was first demonstrated for the 84Kr(p,)85Rb cross section in Ref. [24].
III.2 Background subtraction
The background in this experiment can be attributed to two major contributors: cosmic-ray induced or room background and beam-induced background. The contribution of the cosmic-ray induced background is reduced with two ways: the SuNSCREEN veto and beam pulsing. More specifically, the events that were recorded by the two PMTs of one of SuNSCREEN’s scintillator bars in coincidence with a segment of SuN were rejected, as mentioned in Sec. II. In order to remove any background events that were not accounted for through the SuNSCREEN veto, the 82Kr beam was pulsed using the EBIT charge buncher [23]. The beam was delivered in 100 s pulses separated by 200 ms of dead time. Two data sets of 100 s were recorded for each beam pulse, one while beam was delivered, and one during the dead time to record room background that was subtracted from the final spectra.
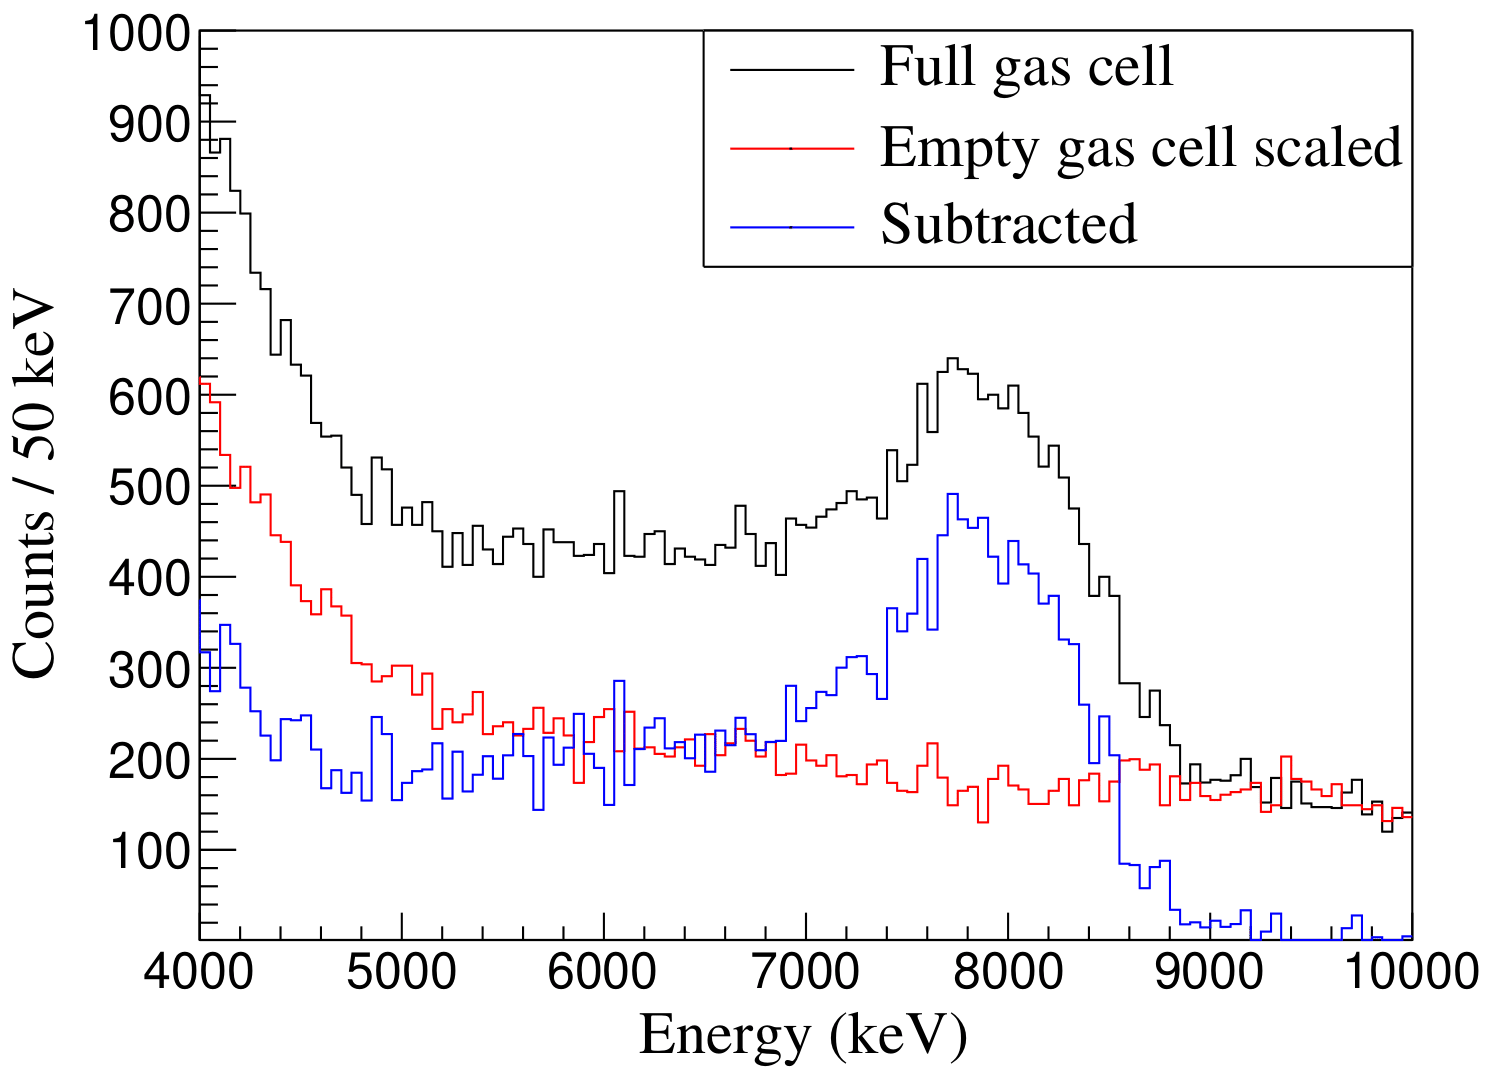
In order to account for beam-induced background, data was acquired with the cell full of hydrogen gas, and with the cell empty. The empty-cell data were normalized to the beam current, and subtracted from the full-cell data to obtain the final spectra.
Doppler-shift corrections were applied on a segment-by-segment basis as described in Ref. [29]. Through this correction the -ray energy detected by each segment is reconstructed based on the average velocity of the recoil nucleus, as well as the different detection angles. The fully background subtracted and Doppler-shift corrected sum peak at initial beam energy 3.7 MeV/nucleon is shown in Fig. 1.
III.3 Efficiency and Yield determination
The efficiency of the SuN detector was dependent on both the energy of the individual rays, as well as the multiplicity of the detected cascades [25]. Furthermore, the large width of the sum peak (due to the Doppler effect and energy straggling through the gas cell target) required the detection efficiency of this measurement to be calculated as a function of the contribution of each possible excitation energy of the 83Rb compound nucleus (CN). The value of the 82Kr(p,)83Rb reaction was sufficiently high for the excitation energy, , of the CN to be in the nuclear continuum region where statistical model calculations are valid. Hence, the contribution of each possible of the CN can be simulated in order to extract the energies of the rays involved in the de-excitation of the CN based on SuN’s multiplicity, SoS, and TAS. This analysis technique was developed and validated for 90Zr(p,)91Nb cross-section data and applied successfully for the measurement of the 84Kr(p,)85Rb cross section in Ref. [24].
For the simulation of the deexcitation of the 83Rb nucleus the rainier code [30] was implemented. Rainier is a Monte Carlo code that simulates the de-excitation of a compound nucleus using statistical nuclear properties. Within rainier, the user inputs the nuclear level structure of the nucleus under study. Namely, the low energy portion of the 83Rb level scheme was taken from Ref. [31] up to 1.8 MeV, where the level scheme was considered to be complete. The upper portion was constructed using a combination of the NLD described through the Constant Temperature (CT) model [32, 33] as well as the Back Shifted Fermi Gas (BSFG) model [34, 35]. The user also inputs the and of the entry state, as well as the SF model parameters for the subsequent de-excitation. For the SF a Generalized Lorentzian of the form of Kopecky and Uhl [36] was adopted.
The choice of the NLD and SF model significantly affects the rays that can be emitted through the de-excitation of a nuclear level in the continuum. Therefore, the rays shown in a simulated SoS are highly dependent on the choice of the NLD and SF that are input in rainier. For this reason, the initial parameters of the NLD and SF models were varied, in order to replicate the experimental SoS spectra obtained by the de-excitation of the 83Rb CN decay. The goal of this analysis was to identify suitable products of the NLD and SF, and not to constrain each one individually. The combinations that reproduced the SoS spectra are indicated by the green band shown in Fig. 2(a) along with the default parameters for SF and NLD through the CT and BSFG models. The default parameters for the NLD were obtained through Ref. [37], and for the SF through Ref. [38]. Figure 2(a) indicates that the default model parameters fail to reproduce the experimental data, thus demonstrating the need to vary these parameters. It is noteworthy to mention that within these parameter combinations are the CT model parameters by Hoffman et al. in Ref. [39], as well as a low-energy upbend on the M1 SF as parameterized by Guttormsen et al. in Ref. [40]. More detailed information on the choice of parameters is provided in Sec. V.
The rays obtained by the deexcitation of each contributing of the 83Rb CN through rainier were then input in Geant4 simulations [41], in order to account for the SuN detector’s response function. To extract the overall contribution of each into the sum peak, a minimization code was utilized. The code uses the simulated TAS, SoS and multiplicity outputs of Geant4 for each , as well as the experimental spectra gated on the sum peak. Then it calculates the contribution of each required to replicate the shape of the experimental data by fitting the simulated SoS, TAS and multiplicity spectra simultaneously. The minimization output for the three spectra is shown in Fig. 2.
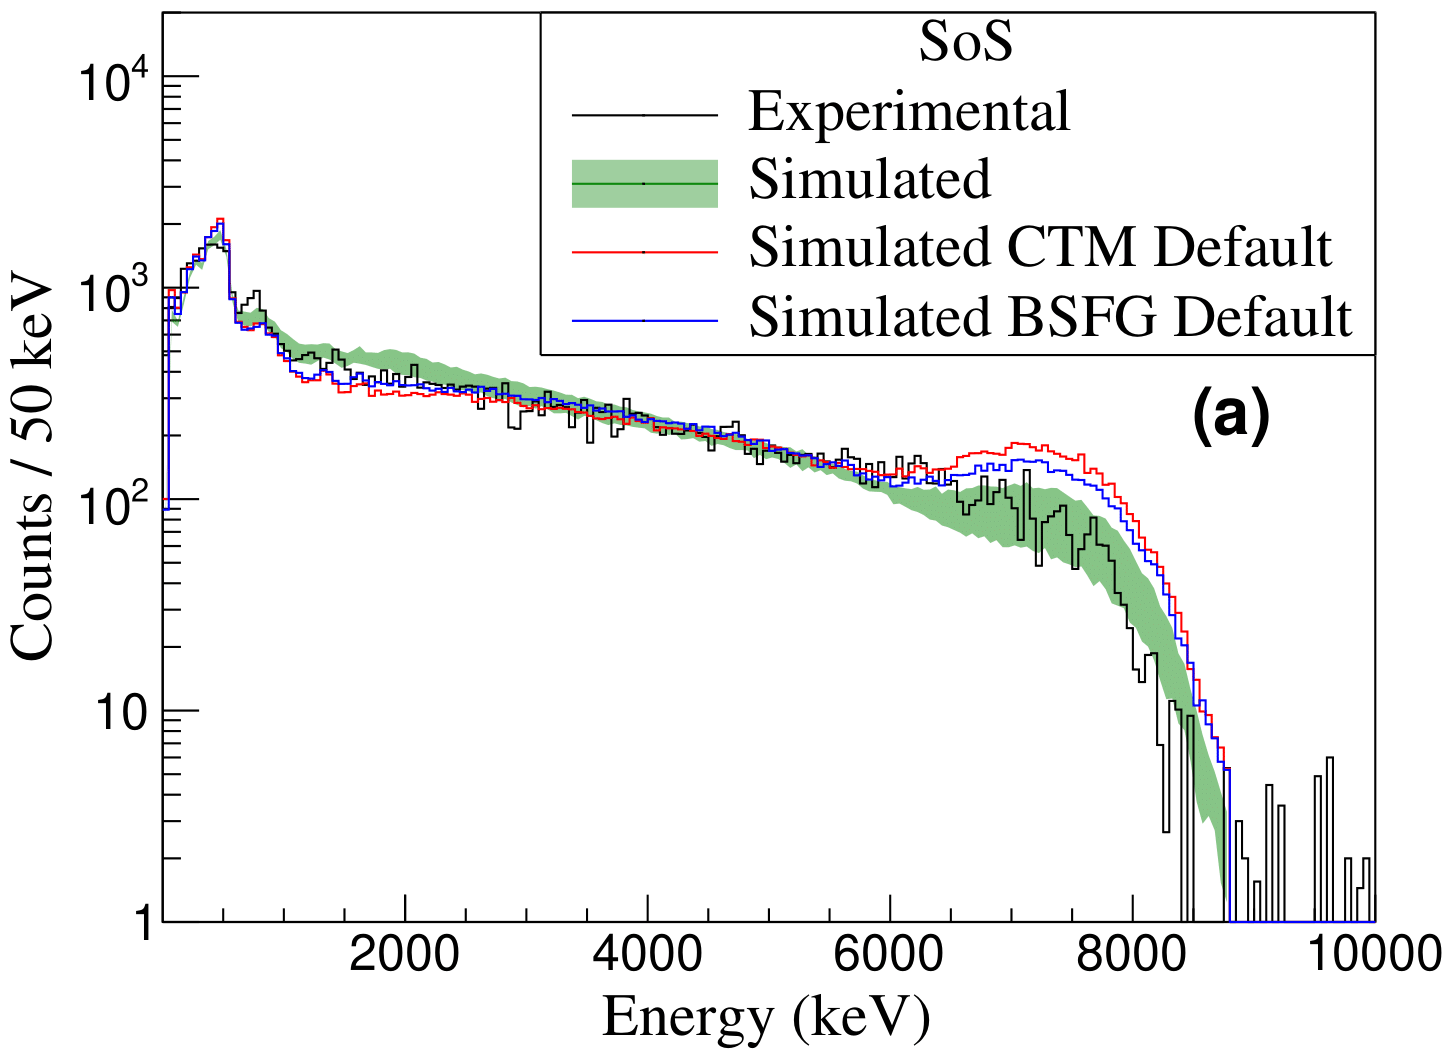
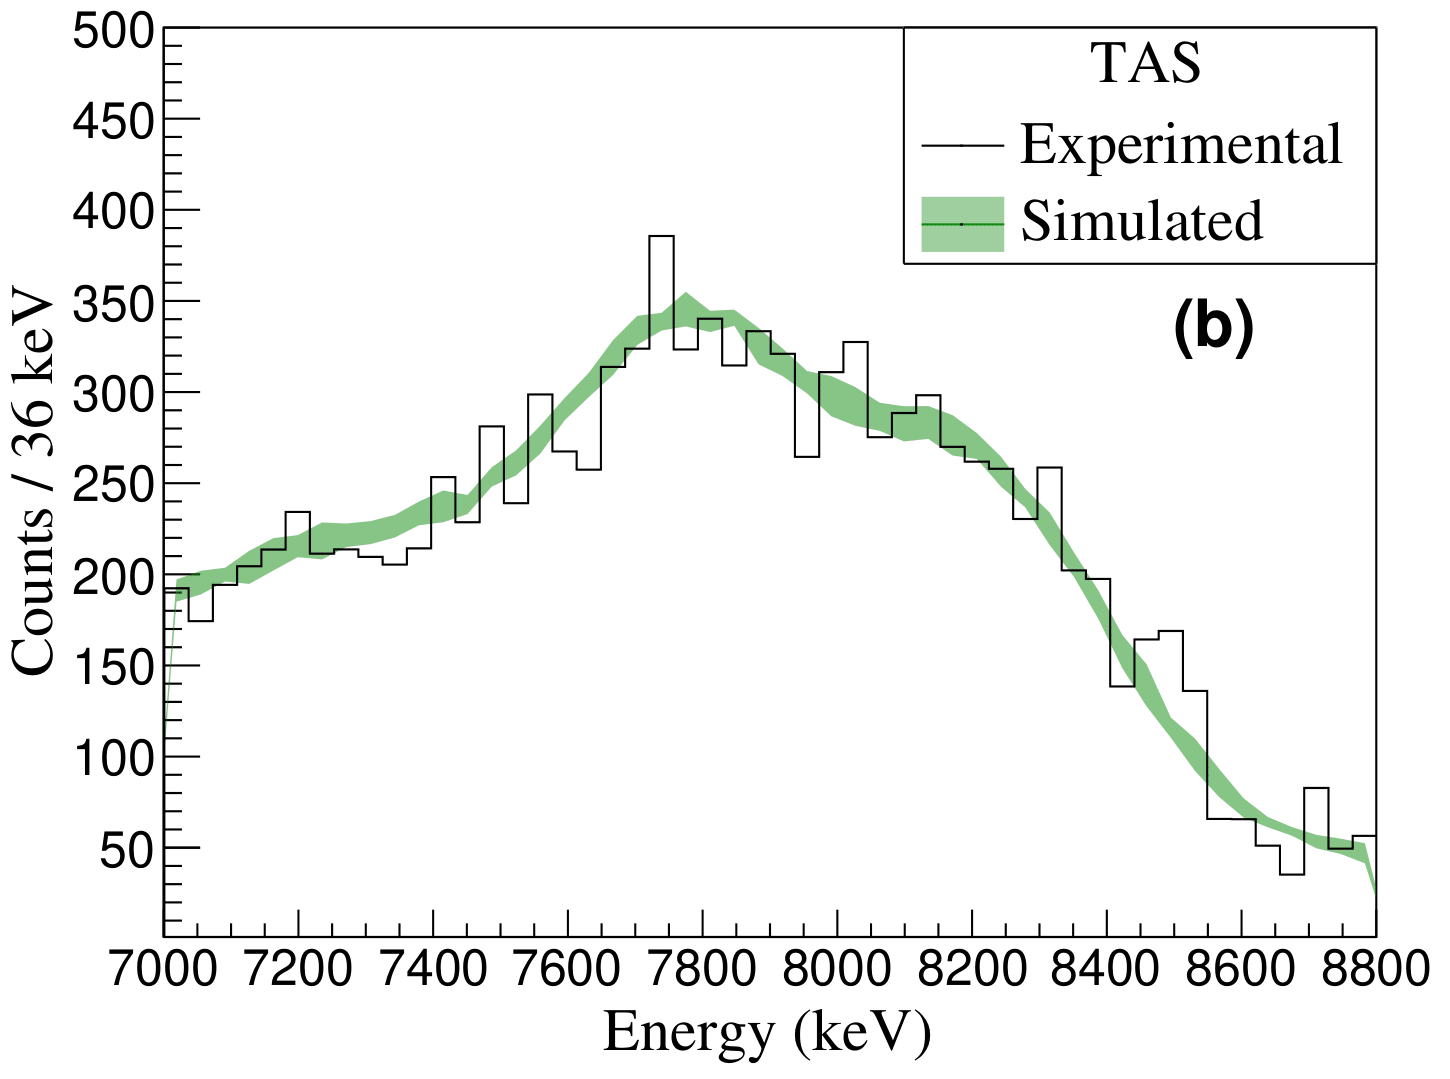
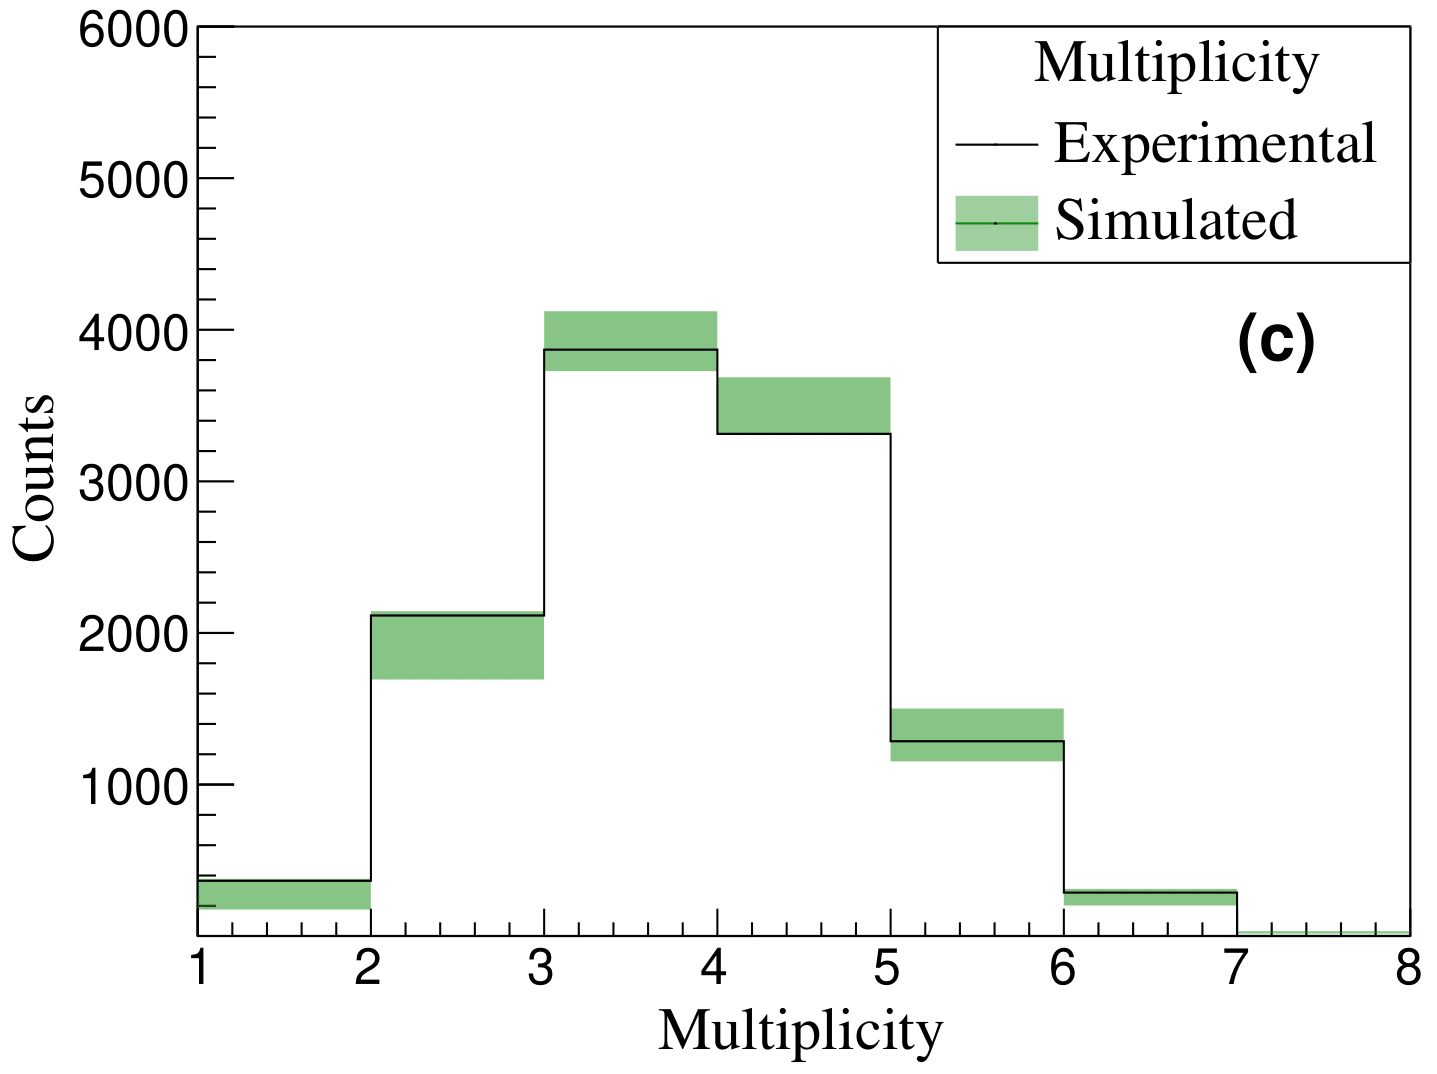
The ratio of the yield of the measurement, , over the detector’s efficiency, , corresponds to the total number of reactions that occurred. This ratio was obtained from the linear combination of the integrals of the simulated sum peak for each , weighted based on each energy’s contribution as extracted from the minimization output. The uncertainty of this ratio varied between 17% and 23% and is mostly attributed to the various parameters chosen for the NLD and SF models, as shown by the green bands in Fig. 2.
IV Results & Discussion
The cross section for the 82Kr(p,)83Rb reaction as calculated using Eq. (1) is presented in Table 1 and in Fig. 3. The first column of Table 1 represents the initial beam energy that was impinged on the Mo foil and the second column the effective energy, . The third column shows the total number of incident beam particles on target and the fourth column represents our efficiency in detecting rays from the de-excitation of the 83Rb compound nucleus. As discussed in Section III.3, the detection efficiency depends on the energy of the individual rays, as well as the multiplicity of the cascade, and is extracted through simulations from the ratio of the yield over the efficiency.
|
(MeV) |
|
|
(mb) | ||||||
|---|---|---|---|---|---|---|---|---|---|---|
| 3.7 | (2.15 0.11) | 51.6 5.6 | 1.63 0.40 | |||||||
| 3.4 | (2.05 0.10) | 51.3 5.7 | 0.72 0.16 | |||||||
| 3.1 | (2.07 0.10) | 52.6 6.0 | 0.23 0.04 |
The uncertainties in the presented cross section include: 5% for the beam-charge accumulation, 5% for the areal target density attributed to the measurement of the gas cell pressure, statistical uncertainty varying between 1% and 4%, with the latter value corresponding to the smaller energy. The overall uncertainty was between 19% and 24% as shown in Table 1. The largest contribution to this uncertainty comes from the ratio of the yield of the measurement over the detector’s efficiency, as described in Sec. III.3. The uncertainty in the effective energy is mainly attributed to the energy straggling of the 82Kr beam when passing through the Mo foil (2-3%) and hydrogen gas (1%). The asymmetric errors in the effective energy result from the asymmetric energy straggling distribution [42]. The uncertainty from the theoretical cross section input in the calculation of the effective energy as described in Ref. [27] does not exceed 15 keV (0.5%).
In Fig. 3 the measured cross section is compared to theoretical calculations using the non-smoker [28] code shown with the blue solid line and the talys 1.96 [43] code shown in the orange band. The orange talys band includes all the available NLD and E1 SF models in the code (so called “ldmodel” and “strength” options). The comparison indicates that standard statistical model calculations with the default models tend to overproduce the cross section of the 82Kr(p,)83Rb reaction relative to the experimentally measured values. The deviations of the reported data from the values predicted by the non-smoker code vary between 23% and 47% with the latter corresponding to the lowest beam energy.
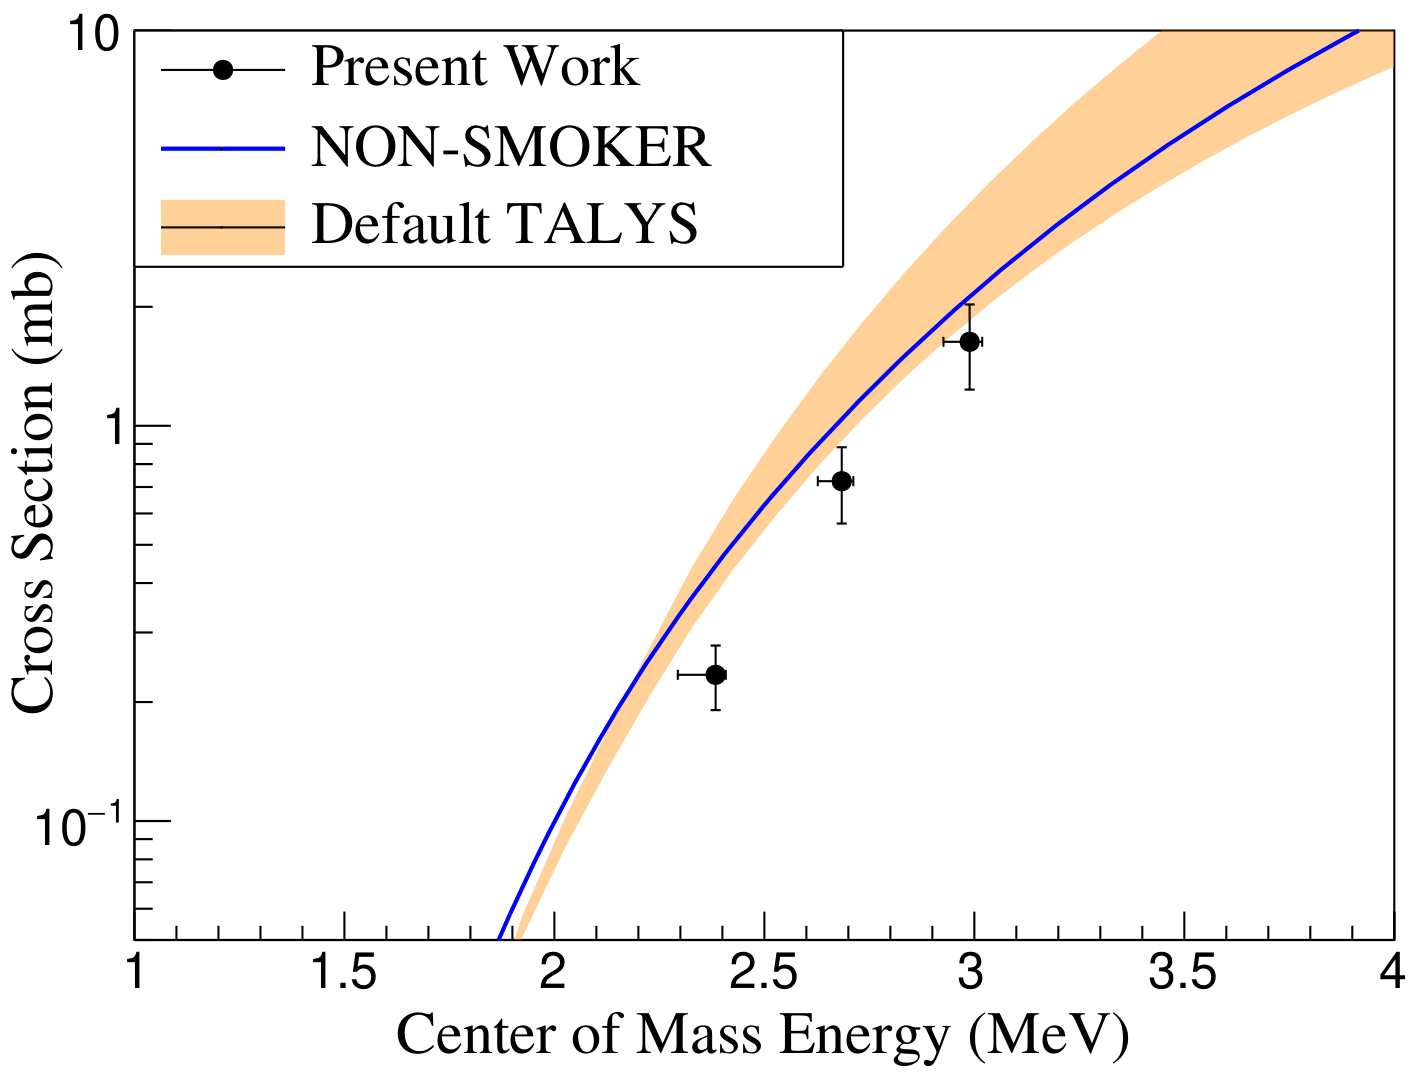
A similar behavior in the comparison between measured cross-section data and standard statistical model calculations has been observed in the recently published data from Lotay et al. [16] for the (p,) reaction on the neighboring 83Rb nucleus, as well as on the data published by Gyürky et al. [44] on various proton-rich Sr isotopes, using different experimental setups and techniques. In both cases the reported experimental cross section tends to be smaller than the values predicted by the HF theory.
This significant overproduction of the cross section by theoretical calculations motivated further investigation, as described in the following section.
V Theoretical Analysis
The comparison of the measured cross section with the theoretical calculations from talys shown in Fig. 3 indicates an overestimation of the evaluated cross section. However, these talys calculations were performed varying only the NLD and SF models for the default parameters chosen by the code.
As discussed in Section III.3, a choice of parameters for modeling the NLD and SF of the 83Rb nucleus was made. These parameters were chosen to replicate the experimental SoS spectra obtained by the de-excitation of the 83Rb CN decay and, therefore, should provide a better description of the cross section. In Table 2 a few of the chosen NLD and SF parameter combinations are provided, along with the default CT and BSFG parameters [37], for comparison.
| NLD Model |
|
Upbend in SF | |||||||
| CT default |
|
[37] | No | ||||||
| BSFG default |
|
[37] | No | ||||||
| 1. | CT |
|
No | ||||||
| 2. | CT |
|
[39] | No | |||||
| 3. | BSFG |
|
No | ||||||
| 4. | BSFG |
|
|
[40] | |||||
| 5. | BSFG |
|
|
||||||
The total NLD as a function of the excitation energy, , as described in the CT model [32, 33] is
| (3) |
where the temperature, , and are free parameters. The total NLD of the BSFG model [34, 35] is
| (4) |
where is the spin cut-off parameter, and and are free parameters that can be altered. Regarding the SF, for all of the combinations listed in Table 2, the E1 and M1 strength parameters were obtained through Ref. [31], and the E2 strength through Ref. [38]. In some occasions shown in Table 2, a low-energy upbend was implemented:
| (5) |
where and are a normalization and an energy-dependent factor for the low-energy upbend of the SF [38].
It is interesting to note that those combinations of NLD and SF which describe the SoS, TAS, and multiplicity spectra (green bands in Fig. 2) correspond to the upper range of the calculated 82Kr(p,)83Rb cross sections (see orange band in Fig. 3). As the new experimental data are located at the lower end of the orange band in Fig. 3, there seems to be some tension between a reasonable description of SoS, TAS, and multiplicity spectra on the one hand and the (p,) cross sections on the other hand. Obviously, this finding calls for a more detailed theoretical analysis.
In a schematic notation, the cross section of the 82Kr(p,)83Rb reaction in the statistical model is given by
| (6) |
with the transmissions into the channel ( = p, n, , , etc.), the -branching , and the width-fluctuation correction factor . At the low energies under experimental study, the only open channels are the proton and the channel. The neutron channel opens slightly above 5 MeV. The channel remains negligible at all energies under study because of the higher Coulomb barrier. The relevance of the different exit channels and the resulting sensitivities on the chosen input parameters of the statistical model will be discussed in the following paragraphs.
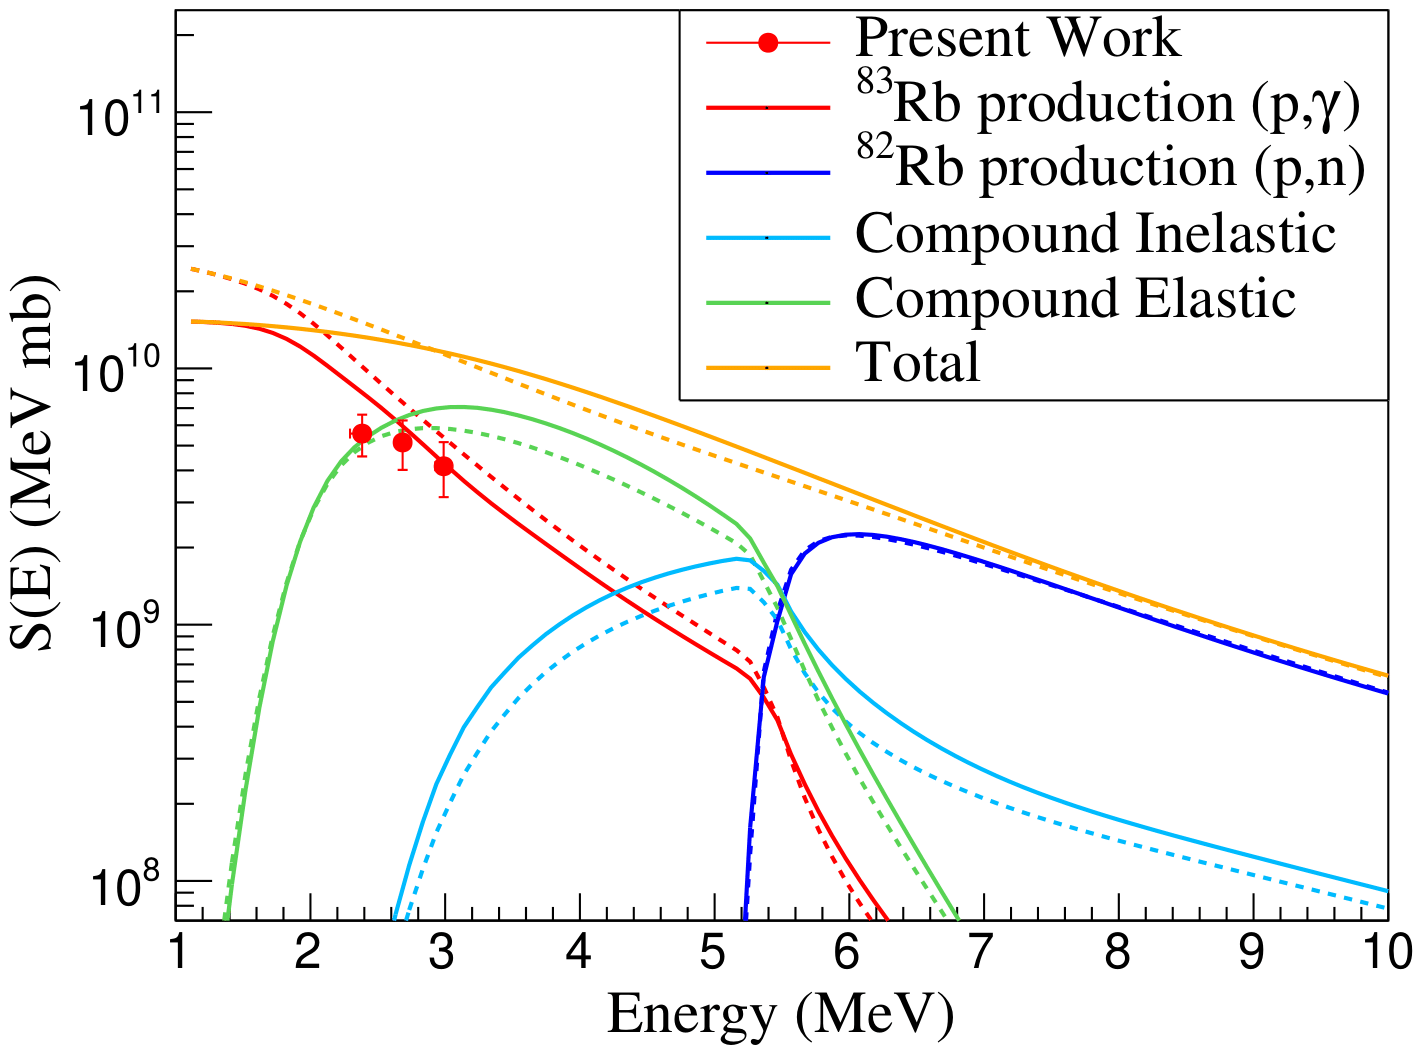
In such an analysis, it is useful to investigate, not just the channel of interest, but also additional reaction channels, to evaluate the competition between them. This also provides an intuitive understanding of the sensitivities of the calculated cross sections on the different ingredients of the statistical model. Figure 4 shows a decomposition of the total reaction cross section into the different exit channels. For better readability, the cross sections are converted to astrophysical S-factors. The combination of NLD and SF used in this plot is listed as No. 5 in Table 2. The dashed lines correspond to a standard calculation; the full lines use an optimized set of parameters (as discussed below). Already close above the opening of the neutron channel (slightly above 5 MeV), the neutron channel dominates, leading to a neutron branching and . In contrast, at the energies under experimental study, the situation is more complicated because the dominating channels of (p,) proton capture and (p,p) compound-elastic scattering show comparable strengths. Under these circumstances, Eq. (6) simplifies to
| (7) |
As the NLD and SF are constrained by the SoS, TAS, and multiplicity spectra in Fig. 2, the transmission is essentially fixed in Eq. (7), and consequently the calculated (p,) cross section remains sensitive only to the proton transmission in the entrance channel , i.e., the proton optical model potential (POMP), and the width-fluctuation correction (WFC) factor .
As the total reaction cross section depends only on the POMP, it is a simple task to determine the influence of the POMP. The different global POMPs in talys show only minor variations for the resulting and thus also on the (p,) capture cross section. Nevertheless, the energy dependence of the so-called “jlm-type” potentials (based on the work of Jeukenne, Lejeunne, and Mahaux [45, 46, 47, 48] with later modifications by Bauge et al. [49, 50]) shows slightly lower cross sections at the lowest energies, leading to a better agreement with the new experimental data.
The WFC takes into account that there are correlations between the incident and outgoing wave functions. These correlations typically enhance the compound-elastic channel and reduce the cross sections of the reaction channels. The WFC becomes most pronounced at low energies with only few open channels, whereas at higher energies and many open channels the relevance of the WFC becomes negligible. By default, talys applies a WFC using the formalism of Moldauer (so-called “widthmode 1”) [51, 52]. A much stronger WFC is obtained for the approach of Hofmann, Richert, Tepel, and Weidenmüller (HRTW approach, “widthmode 2”) [53, 54, 55], leading to significantly lower calculated (p,) cross sections, especially at low energies. Thus, the WFC using the simple HRTW approach shows much better agreement with the new experimental data, as can be seen from the green band in Fig. 5.
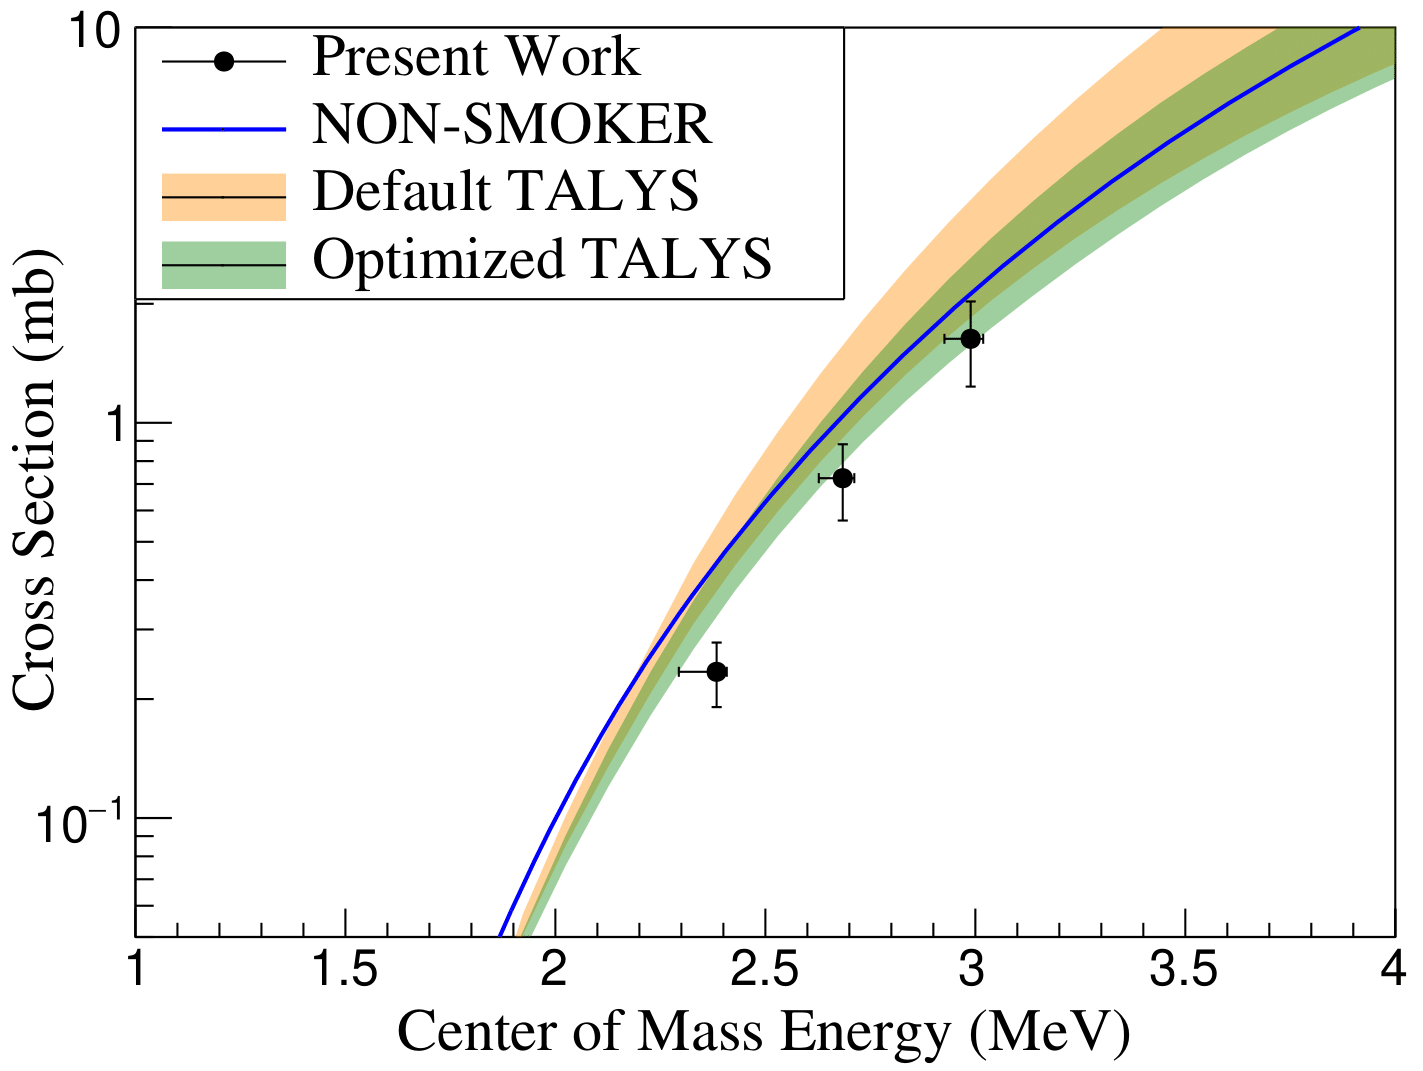
The above study shows that a consistent description of the 82Kr(p,)83Rb cross section and the SoS, TAS, and multiplicity spectra can be obtained using a careful choice of parameters in the statistical model. The following parameters have finally been adopted: The POMP was taken from Jeukenne, Lejeune, and Mahaux with the Bauge modification (so-called “jlmmode 3” in talys); the optical model potential was kept as default because it has practically no influence on the (p,) cross sections under study; the width fluctuation correction is based on the HRTW approach; good combinations of the NLD and the SF are listed in Table 2. The green band in Fig. 5 was created using this choice of parameters. The curves in Fig. 4 are obtained from combination No. 5 in Table 2.
As a final remark, the simultaneous analysis of SoS, TAS, and multiplicity spectra provides much stronger constraints on the statistical properties of the produced compound nucleus than a standard analysis of (p,) cross sections. The adopted technique can constrain the product of two of the most important ingredients to the statistical HF model, the NLD and SF.
VI Summary & Conclusions
The total cross section of the 82Kr(p,)83Rb reaction was measured in inverse kinematics using a stable 82Kr beam at effective energies between 2.4 and 3.0 MeV. The obtained spectra were analyzed using the -summing technique. The large width of the sum peak due to the Doppler effect and energy straggling through the gas-cell target required the detection efficiency of this measurement to be calculated as a function of the contribution of each possible excitation energy of the 83Rb CN. For this reason, a new analysis technique developed in Ref. [24] was applied. The extracted cross section was compared to standard HF statistical model calculations using the non-smoker and talys codes for default inputs of NLD and SF. The comparison indicates that standard statistical model calculations tend to overproduce the cross section of the 82Kr(p,)83Rb reaction relative to the experimentally measured values. A similar behavior has been observed for neighboring nuclei by Refs. [16, 44], thus motivating the authors’ further theoretical investigation on the choice of parameters in the statistical model. Choosing a special width fluctuation correction, a consistent description of the 82Kr(p,)83Rb cross section and the experimental spectra was obtained. The presented analysis technique can provide stronger constraints for the choice of the parameters for the statistical model calculations than a simple comparison to the cross section measurement.
ACKNOWLEDGMENTS
The authors would like to acknowledge the support of the ReA3 accelerator team with optimizing the beam delivery and setup.
This work was supported by the National Science Foundation under grants No. PHY 1613188 (Hope College), No. PHY 1102511 (NSCL), No. PHY 1913554 (Windows on the Universe: Nuclear Astrophysics at the NSCL), No. PHY 2209429 (Windows on the Universe: Nuclear Astrophysics at FRIB), No. PHY 1430152 (Joint Institute for Nuclear Astrophysics) and by NKFIH (K134197).
This material is based upon work supported by the U.S. Department of Energy, National Nuclear Security Administration through grant No. DOE-DENA0003906, award No. DE-NA0003180 (Nuclear Science and Security Consortium) as well as grant No. DE-FG0296ER40963 and No. DE-SC0020451 from the Department of Energy, Office of Science, Office of Nuclear Physics.
References
- Burbidge et al. [1957] E. M. Burbidge, G. R. Burbidge, W. A. Fowler, and F. Hoyle, Rev. Mod. Phys. 29, 547 (1957).
- Cowan et al. [2021] J. J. Cowan, C. Sneden, J. E. Lawler, A. Aprahamian, M. Wiescher, K. Langanke, G. Martínez-Pinedo, and F.-K. Thielemann, Rev. Mod. Phys. 93, 015002 (2021).
- Käppeler et al. [2011] F. Käppeler, R. Gallino, S. Bisterzo, and W. Aoki, Rev. Mod. Phys. 83, 157 (2011).
- Hampel et al. [2016] M. Hampel, R. J. Stancliffe, M. Lugaro, and B. S. Meyer, Astrophys. J. 831, 171 (2016), arXiv:1608.08634 [astro-ph.SR] .
- Cowan and Rose [1977] J. J. Cowan and W. K. Rose, Astrophys. J. 212, 149 (1977).
- Rauscher et al. [2016] T. Rauscher, N. Nishimura, R. Hirschi, G. Cescutti, A. S. J. Murphy, and A. Heger, Monthly Notices of the Royal Astronomical Society 463, 4153 (2016).
- Rauscher et al. [2013] T. Rauscher, N. Dauphas, I. Dillmann, C. Fröhlich, Z. Fülöp, and G. Gyürky, Reports on Progress in Physics 76, 066201 (2013).
- Prantzos et al. [1990] N. Prantzos, M. Hashimoto, M. Rayet, and M. Arnould, Astronomy and Astrophysics 238, 455 (1990).
- Woosley and Howard [1978] S. E. Woosley and W. M. Howard, The Astrophysical Journal Supplement Series 36, 285 (1978).
- Travaglio et al. [2011] C. Travaglio, F. K. Röpke, R. Gallino, and W. Hillebrandt, The Astrophysical Journal 739, 93 (2011).
- Nishimura et al. [2017] N. Nishimura, T. Rauscher, R. Hirschi, A. S. J. Murphy, G. Cescutti, and C. Travaglio, Monthly Notices of the Royal Astronomical Society 474, 3133 (2017).
- Arnould and Goriely [2003] M. Arnould and S. Goriely, Physics Reports 384, 1 (2003).
- Rapp et al. [2006] W. Rapp, J. Goerres, M. Wiescher, H. Schatz, and F. Kaeppeler, The Astrophysical Journal 653, 474 (2006).
- Rauscher [2020] T. Rauscher, Essentials of Nucleosynthesis and Theoretical Nuclear Astrophysics, 2514-3433 (IOP Publishing, 2020).
- Heim et al. [2022] F. Heim, M. Müller, P. Scholz, S. Wilden, and A. Zilges, EPJ Web Conf. 260, 11001 (2022).
- Lotay et al. [2021] G. Lotay, S. A. Gillespie, M. Williams, T. Rauscher, and et. al., Phys. Rev. Lett. 127, 112701 (2021).
- Cheng et al. [2021] H. Cheng, B.-H. Sun, L.-H. Zhu, M. Kusakabe, Y. Zheng, L.-C. He, T. Kajino, Z.-M. Niu, and et. al., The Astrophysical Journal 915, 78 (2021).
- Simon et al. [2019] A. Simon et al., J. Phys. Conf. Ser. 1308, 012020 (2019).
- Foteinou et al. [2018] V. Foteinou, S. Harissopulos, M. Axiotis, A. Lagoyannis, G. Provatas, A. Spyrou, G. Perdikakis, C. Zarkadas, and P. Demetriou, Phys. Rev. C 97, 035806 (2018).
- Gyürky et al. [2010] G. Gyürky, Z. Elekes, J. Farkas, Z. Fülöp, G. G. Kiss, E. Somorjai, T. Szücs, R. T. Güray, N. Özkan, C. Yalçin, and T. Rauscher, Journal of Physics: Conference Series 202, 012004 (2010).
- Spyrou et al. [2007] A. Spyrou, H.-W. Becker, A. Lagoyannis, S. Harissopulos, and C. Rolfs, Phys. Rev. C 76, 015802 (2007).
- Hauser and Feshbach [1952] W. Hauser and H. Feshbach, Phys. Rev. 87, 366 (1952).
- Lapierre et al. [2013] A. Lapierre, S. Schwarz, K. Kittimanapun, J. Rodriguez, C. Sumithrarachchi, and et. al., Nuclear Instruments and Methods in Physics Research Section B: Beam Interactions with Materials and Atoms 317, 399 (2013).
- Palmisano-Kyle et al. [2022] A. Palmisano-Kyle, A. Spyrou, P. A. DeYoung, A. Dombos, P. Gastis, O. Olivas-Gomez, C. Harris, S. Liddick, S. M. Lyons, J. Pereira, and et. al, Phys. Rev. C 105, 065804 (2022).
- Simon et al. [2013] A. Simon, S. Quinn, A. Spyrou, and et. al., Nuclear Instruments and Methods in Physics Research Section A: Accelerators, Spectrometers, Detectors and Associated Equipment 703, 16 (2013).
- Klopfer et al. [2015] E. Klopfer, J. Brett, P. A. DeYoung, A. C. Dombos, S. J. Quinn, A. Simon, and A. Spyrou, Nuclear Instruments and Methods in Physics Research A 788, 5 (2015).
- Rolfs et al. [1988] C. Rolfs, W. Rodney, and W. Rodney, Cauldrons in the Cosmos: Nuclear Astrophysics, Theoretical Astrophysics (University of Chicago Press, 1988).
- Rauscher and Thielemann [2001] T. Rauscher and F.-K. Thielemann, Atomic Data and Nuclear Data Tables 79, 47 (2001).
- Quinn et al. [2014] S. Quinn, A. Spyrou, A. Simon, and et. al., Nuclear Instruments and Methods in Physics Research Section A Accelerators Spectrometers Detectors and Associated Equipment 757, 62–66 (2014).
- Kirsch and Bernstein [2018] L. Kirsch and L. Bernstein, Nuclear Instruments and Methods in Physics Research Section A: Accelerators, Spectrometers, Detectors and Associated Equipment 892, 30 (2018).
- Capote et al. [2009] R. Capote, M. Herman, P. Obložinský, P. Young, S. Goriely, T. Belgya, A. Ignatyuk, A. Koning, S. Hilaire, V. Plujko, and et. al., Nuclear Data Sheets 110, 3107 (2009), special Issue on Nuclear Reaction Data.
- Gilbert and Cameron [1965] A. Gilbert and A. G. W. Cameron, Canadian Journal of Physics 43, 1446 (1965).
- Ericson [1959] T. Ericson, Nuclear Physics 11, 481 (1959).
- Dilg et al. [1973] W. Dilg, W. Schantl, H. Vonach, and M. Uhl, Nuclear Physics A 217, 269 (1973).
- Newton [1956] T. D. Newton, Canadian Journal of Physics 34, 804 (1956).
- Kopecky and Uhl [1990] J. Kopecky and M. Uhl, Phys. Rev. C 41, 1941 (1990).
- von Egidy and Bucurescu [2009] T. von Egidy and D. Bucurescu, Phys. Rev. C 80, 054310 (2009).
- Koning et al. [2021] A. Koning, S. Hilaire, and S. Goriely, TALYS–1.96 A Nuclear Reaction Program, User Manual (2021).
- Hoffman et al. [2004] R. Hoffman, F. Dietrich, R. Bauer, K. Kelley, and M. Mustafa, Neutron and Charged-Particle Induced Cross Sections for Radiochemistry in the Region of Bromine and Krypton, Tech. Rep. (Lawrence Livermore National Lab. (LLNL), Livermore, CA (United States, 2004).
- Guttormsen et al. [2005] M. Guttormsen, R. Chankova, U. Agvaanluvsan, and et. al., Phys. Rev. C 71, 044307 (2005).
- Agostinelli et al. [2003] S. Agostinelli, J. Allison, K. Amako, J. Apostolakis, H. Araujo, P. Arce, M. Asai, D. Axen, S. Banerjee, and G. B. et.al., Nuclear Instruments and Methods in Physics Research Section A: Accelerators, Spectrometers, Detectors and Associated Equipment 506, 250 (2003).
- Ziegler et al. [2010] J. F. Ziegler, M. Ziegler, and J. Biersack, Nuclear Instruments and Methods in Physics Research Section B: Beam Interactions with Materials and Atoms 268, 1818 (2010), 19th International Conference on Ion Beam Analysis.
- Koning et al. [2019] A. Koning, D. Rochman, J.-C. Sublet, N. Dzysiuk, M. Fleming, and S. van der Marck, Nuclear Data Sheets 155, 1 (2019), special Issue on Nuclear Reaction Data.
- Gyürky et al. [2001] G. Gyürky, E. Somorjai, Z. Fülöp, S. Harissopulos, P. Demetriou, and T. Rauscher, Phys. Rev. C 64, 065803 (2001).
- Jeukenne et al. [1974] J. P. Jeukenne, A. Lejeune, and C. Mahaux, Phys. Rev. C 10, 1391 (1974).
- Jeukenne et al. [1976] J. Jeukenne, A. Lejeune, and C. Mahaux, Physics Reports 25, 83 (1976).
- Jeukenne et al. [1977a] J. P. Jeukenne, A. Lejeune, and C. Mahaux, Phys. Rev. C 15, 10 (1977a).
- Jeukenne et al. [1977b] J.-P. Jeukenne, A. Lejeune, and C. Mahaux, Phys. Rev. C 16, 80 (1977b).
- Bauge et al. [1998] E. Bauge, J. P. Delaroche, and M. Girod, Phys. Rev. C 58, 1118 (1998).
- Bauge et al. [2001] E. Bauge, J. P. Delaroche, and M. Girod, Phys. Rev. C 63, 024607 (2001).
- Moldauer [1976] P. A. Moldauer, Phys. Rev. C 14, 764 (1976).
- Moldauer [1980] P. A. Moldauer, Nuclear Physics A 344, 185 (1980).
- Tepel et al. [1974] J. W. Tepel, H. M. Hofmann, and H. A. Weidenmüller, Physics Letters B 49, 1 (1974).
- Hofmann et al. [1975] H. M. Hofmann, J. Richert, J. W. Tepel, and H. A. Weidenmüller, Annals of Physics 90, 403 (1975).
- Hofmann et al. [1980] H. M. Hofmann, T. Mertelmeier, M. Herman, and J. W. Tepel, Zeitschrift für Physik A Atoms and Nuclei 297, 153 (1980).