GRB 201015A and the nature of low-luminosity soft gamma-ray bursts
Abstract
GRB 201015A is a peculiarly low luminosity, spectrally soft gamma-ray burst (GRB), with s (time interval of detection of 90% of photons from the GRB), and an associated supernova (likely to be type Ic or Ic-BL). GRB 201015A has an isotropic energy erg, and photon index (15–150 keV). It follows the Amati relation, a correlation between and spectral peak energy followed by long GRBs. It appears exceptionally soft based on , the hardness ratio of HR = , and low-, so we have compared it to other GRBs sharing these properties. These events can be explained by shock breakout, poorly collimated jets, and off-axis viewing. Follow-up observations of the afterglow taken in the X-ray, optical, and radio, reveal a surprisingly late flattening in the X-ray from s to s. We fit the data to closure relations describing the synchrotron emission, finding the electron spectral index to be , and evidence of late-time energy injection with coefficient . The jet half opening angle lower limit () is inferred from the non-detection of a jet break. The launch of SVOM and Einstein Probe in 2023, should enable detection of more low luminosity events like this, providing a fuller picture of the variety of GRBs.
keywords:
transients: gamma-ray burst – transients: supernova – gamma-ray burst: individual: GRB 201015A – gamma-ray burst: general1 Introduction
Several thousand gamma-ray bursts (GRBs) have been detected since their first identification more than 50 years ago Klebesadel et al. (1973). These bursts of gamma-rays are detected by satellites such as the Neil Gehrels Swift Observatory (Gehrels et al., 2004) or Fermi (Meegan et al., 2009). For the majority of these events, information is only available in the ray bands, typically in the range from tens of keV to a few MeV, providing both temporal and spectral information (Piran, 2005). On the basis of these data alone the population is highly varied, but the duration of the bursts is clearly bimodal, splitting the long and short GRBs at a boundary at s (Kouveliotou et al., 1993), where is the duration in which 90% of the photons from the GRB are detected (Koshut et al., 1995). The short GRB population typically has harder spectra, meaning there is a larger proportion of higher energy photons to lower-energy photons, compared to long GRBs (Zhang et al., 2016).
Intensive multi-wavelength observations of GRBs over the past 30 years have revealed that these two populations arise from distinct progenitors (e.g. Chevalier & Li, 1999; Levan et al., 2016). The long GRBs (LGRBs), lasting typically from a few seconds up to several minutes or longer, arise from star forming galaxies (Fruchter et al., 2006), and photometric and spectroscopic monitoring has revealed that they are created in the core-collapse of massive, rapidly spinning, likely low metallicity stars creating a supernova type I b/c counterpart to the GRB (Hjorth et al., 2003; Stanek et al., 2003; Levan, 2018). This event is also referred to as a collapsar. The first evidence of this origin of long GRBs came from the direct association of GRB980425 with SN1998bw, a peculiar type Ib/c SN (Galama et al., 1999).
In contrast, the short GRBs (SGRBs), lasting from few hundreds of ms up to 2 s (Kouveliotou et al., 1993), are found in galaxies of all ages, sometimes at large distances from their hosts (Fong et al., 2022). The identification of possible kilonovae (Tanvir et al., 2013; Troja et al., 2017; Lamb et al., 2019), powered by radioactive decays of r-process elements, and ultimately the near-simultaneous detection of a short GRB with the gravitational wave detected merger GW170817 secured their origin in the mergers of compact objects (Abbott et al., 2017). Although, short GRBs are almost always viewed on-axis, GRB 170817A was viewed at 36 degrees from the jet axis (Abbott et al., 2017), and GRB 150101B, was significantly under-luminous and later shown to be viewed off-axis by 13 degrees (Troja et al., 2018).
For both the collapsar or compact object merger scenarios, the central engine (an accreting black hole or neutron star) launches relativistic jets of material (e.g. Kluźniak & Ruderman, 1998; Lei et al., 2013; Lü et al., 2015). Gamma-rays are produced via either self-interactions of this material (Sari et al., 1999; Mészáros, 2002) or the dissipation of magnetic fields (Beniamini & van der Horst, 2017). As the jets plough into the circumstellar environment they are decelerated and shock fronts interact with the surrounding material, forming a broadband synchrotron ‘afterglow’ (Gao et al., 2013b; Iyyani et al., 2016).
There are suggestions of additional categorisations of GRBs, for example a separate “intermediate" duration population lasting 2 – 5 s (e.g. Mukherjee et al., 1998; Tunnicliffe & Levan, 2012), low-luminosity GRBs with luminosity erg s-1 (Liang et al., 2007; Virgili et al., 2008), or events which are “ultra-long" (Levan et al., 2014). However, the reality of these populations, and if they represent distinct physical processes remains unclear. We recognise that there is a lot of variation within the GRB population. They range in duration from milliseconds to hours, have spectral peaks ranging from the keV to MeV range, and isotropic energies ranging from – erg (Virgili et al., 2008; Levan et al., 2016). Some have very smooth light curves, others demonstrate pronounced variability (Zhang et al., 2016). It is therefore quite plausible that additional mechanisms are present within the observed populations (Nousek et al., 2006).
Indeed, it is striking that there are a small number of apparently long GRBs which do not exhibit supernova signatures, which are suggested to arise from mergers such as GRB211211A, which has an observed kilonova counterpart (Rastinejad et al., 2022). These SGRBs are detected as long GRBs based on their in the -ray band, but have multiple spikes with extended emission (EE-SGRBs) (e.g. Gehrels et al., 2006; Zhang et al., 2020a; Gompertz et al., 2022). There are also discoveries of short-duration GRBs with a core-collapse supernova association (e.g. Amati, 2021; Ahumada et al., 2021; Zhang et al., 2021). A re-analysis of the prompt GRB emission properties using a machine learning based approach is largely successful at splitting GRBs into the two merger and collapsar groups, however, some GRBs are incorrectly classified, and some fail to be robustly classified (Jespersen et al., 2020).
To understand the nature of GRBs therefore continues to require further observations, in particular of bursts which appear to defy ready classification within a single scheme, for example long-GRBs without associated supernovae or in older galaxies; GRBs which appear under or over-luminous, or bursts which touch on the extremes of duration, spectrum, variability or other key indicators.
Here we consider the case of GRB 201015A, a GRB close to the long-short GRB divide, exhibiting a short peak and extended emission morphology in the prompt emission light curve (Markwardt et al., 2020). Strikingly, it was also extremely spectrally soft, much softer than the majority of short, or even long-GRBs (Lien et al., 2016). The detection of a supernova confirms this GRB to have a collapsar progenitor (Rossi et al., 2021).
This GRB has been of interest due to the possible very high energy (VHE) detection at TeV energies (Blanch et al., 2020). The MAGIC collaboration reported a 3.5 sigma detection of the GRB 201015A in TeV energies beginning 33s after the trigger (Suda et al., 2021). This makes GRB 201015A the fifth burst to be detected in very high energy (VHE), giving possible further evidence of Synchrotron self-Compton (SSC) emission (Nava, 2018). This is the process of Synchrotron photons - produced from electrons accelerated in a magnetic field - scattering off electrons making them more energetic. The other GRBs detected in VHE by the MAGIC and H.E.S.S. collaborations are GRB 190114C, GRB 180720B, GRB 190829A, and GRB 201216C. This sample already includes a variety of both high and low prompt energy GRBs with GRB 190114C having erg and GRB 190829A having erg (Berti & Carosi, 2022). GRB 201015A adds another low luminosity GRB to the sample.
The afterglow observations in radio by the VLBI telescope as well as afterglow measurements in other wavebands have been studied. Giarratana et al. (2022) compares the GRB 201015A to other VHE bursts, and uses afterglow models to suggest this is an on-axis GRB expanding into a homogeneous ISM-like medium. In this paper, we look into the initial energetics of the burst, comparing the isotropic energy, , and spectral peak energy , to the Amati relation for long GRBs (Amati, 2006). We identify and compare a sample of similar bursts in terms of the soft prompt spectrum and low-luminosity and low-Epeak. We have also collated multi-wavelength information on the afterglow of GRB 201015A and related this to models to explain an observed break in the X-ray afterglow.
In Section 2, we present the data we have collected of the prompt and afterglow emission of GRB 201015A, and Section 3 goes through the fitting of models to the afterglow and SN, as well as predicting the duration of the X-ray plateau, and minimum jet opening angle. We then compare GRB 201015A to other spectrally soft GRBs in Section 4, and discuss our findings in Section 5, and provide conclusions in Section 6. The optical data is fairly extensive, so it is presented in the Appendices. The findings presented in this paper are quoted with 1-sigma confidence regions. A flat cosmology with , , km s-1 Mpc-1 has been assumed for this work. In this paper, we define the spectral index, , as and similarly for the temporal power-law relation . The equation describing the relation between the photon index, , and spectral index, , is: .
2 Observations
2.1 Discovery of GRB 201015A
Here we present the observations detailed in the public Gamma-ray Burst Coordinates Network (GCN). The Swift Burst Alert Telescope (BAT; Barthelmy et al., 2005) triggered on GRB 201015A at 22:50:13 UT (hereafter ) (D’Elia et al., 2020). The refined BAT analysis reveals the position of this source to be RA = 354.342, DEC = 53.393 (Markwardt et al., 2020). The BAT light curve shows a short initial spike of overlapping pulses that lasts for s, followed by a tail of extended emission that lasts until s, exhibiting a similar morphology to EE-GRBs (Norris et al., 2010). The prompt emission in the 15-350 keV range has a duration of s (Markwardt et al., 2020). The time-averaged BAT spectrum (from to s) is best fit by a power-law model with a photon index of (Markwardt et al., 2020).
The Fermi Gamma-ray Burst Monitor (GBM; Meegan et al., 2009) detected a weak, sub-threshold event with a duration of s (Fletcher et al., 2020). The spectrum is adequately fit by a Band function (Band et al., 1993) with a peak energy of keV, a fixed low-energy index of , and a high-energy index of . This model yields a 10-1000 keV fluence of erg cm-2 (Fletcher et al., 2020), resulting in erg.
Due to an observing constraint, Swift was unable to slew to GRB 201015A until T0+ minutes. Once on target, the X-ray Telescope (XRT; Burrows et al., 2005) detected a fading, uncatalogued X-ray source within the BAT error circle. The combined XRT-UVOT observations reveal a source at RA(J2000) = 23:37:16.43, Dec(J2000) = +53:24:57.5 with an uncertainty of 1.9 arcseconds (radius, 90 per cent containment) (Evans et al., 2020; Goad et al., 2007; Evans et al., 2009). The XRT (0.3 – 10 keV) afterglow light curve, between and days after the trigger, decays with a power-law index of , according to the live XRT GRB catalogue111https://www.swift.ac.uk/xrt_live_cat/01000452/ (Evans et al., 2009).
The MAGIC telescope’s 3.5 detection of the source came from almost 4 hours of observation starting at finding evidence of emission from GRB 201015A (Suda et al., 2021).
An optical transient coincident with the BAT error circle was first reported by MASTER (Lipunov et al., 2010) 88s after the trigger (Lipunov et al., 2020) and prior to the XRT detections. This was confirmed to be the afterglow by the Nordic Optical Telescope (NOT; Malesani et al., 2020) and the Gravitational-wave Optical Transient Observer (GOTO; Ackley et al., 2020). An uncatalogued host galaxy with magnitude was identified coincident with the GRB position, separated by 2.3” (Rastinejad et al., 2020; Rossi et al., 2021). Optical observations by GTC/OSIRIS started at hours providing a spectrum from 3700 to 7800 Å. A redshift of was calculated from [OIII], [OII], and H- emission lines identified above the continuum (de Ugarte Postigo et al., 2020).
Radio observations were taken by the VLA at a central frequency of 6 GHz 1.41 days after the trigger showing a flux density of mJy (Fong et al., 2020). Following this the e-Merlin telescope observed the transient at a central frequency of 1.5 GHz at 19 and 23 days after the trigger. The measured flux densities were Jy and Jy respectively (Rhodes et al., 2020). Both sources were found to be at a consistent position with the optical afterglow.
2.2 Gamma-rays
We downloaded the BAT spectral files from the Swift/BAT catalogue (Lien et al., 2016) to perform an independent analysis using xspec v12.11.1. The time-averaged total BAT spectrum is referred to as the BAT in this paper. We fit a singe power-law to the BAT spectrum with duration 10.32 s in the 15-150 keV energy bands using xspec, fitting with chi-squared statistics. The result is a photon index of with normalisation photons keV-1 cm-2 s-1 at 1 keV. The fit has a reduced chi-squared value of with degrees of freedom. The measured photon index is unusually soft, particularly in the BAT band. Lien et al. (2016) showed that the photon indices measured for single power law fits to BAT data of SGRBs are distributed around , and for LGRBs around . In fact, only three other GRBs in the sample of Lien et al. (2016) have measured photon indices with constrained confidence regions. These GRBs are: 050416A, 080520 and 140622A, and we have analysed them in this paper.
In order to compare the energetics of GRB 201015A to other GRBs, we calculate the spectral peak energy, , and isotropic equivalent energy, . The time-averaged BAT spectrum (with exposure time ) in the 15-150 keV band was used to fit both a cut-off power-law (cutoffpl) and Band function (grbm) (Band et al., 1993) using xspec to determine the spectral peak. For these two spectral models, it was difficult to constrain the 1 sigma confidence region on some of the parameters including the spectral break. Using an f-test to determine the best fit we found that the simple power-law described above provided a better fit for this GRB than a model with additional parameters.
A summary of the fitting can be found in the Table 1. After finding a suitable fit, the normalisation parameter was frozen, and the cflux component was added to the model to determine the flux.
| Spectrum | Model | Parameters | |
|---|---|---|---|
| BAT | power-law | 1.03 | |
| cts keV-1 cm-2 s-1 |
The intrinsic spectral peak energy is calculated using the characteristic energy , power-law index , and redshift , with the following formula.
| (1) |
For this GRB, however, we have not observed the spectral peak energy, so it is assumed to be below the lower-limit of the detector bandpass (15 keV), which is consistent with the result of keV from the Band function fit to the Fermi spectrum (Fletcher et al., 2020). Correcting for redshift results in keV.
The isotropic equivalent energy of the burst was calculated using:
| (2) |
where is the flux in the detector energy band, is the flux in 10 – 10,000 keV in the rest frame of the GRB, is the duration of the burst, is the luminosity distance, is the redshift. We find that erg for this burst. This is a low value for a GRB considering most GRBs fall in the range of ergs (Levan et al., 2016). The value is also lower than most GRBs which have a typical keV (Soderberg et al., 2004). Previously, events with keV were classified as X-ray flares (XRF) (Zhang et al., 2020c).
2.3 X-rays
The early time-averaged XRT spectrum ( to s) produced by the Swift Burst Analyser222https://www.swift.ac.uk/burst_analyser/ (Evans et al., 2010) using HEASoft v6.29 is well fitted within xspec (Arnaud, 1996) . We used a composite model comprised of a power-law tbabs (Wilms et al., 2000) ztbabs. This yields a photon index of and an intrinsic absorption column of cm-2 at the redshift of the GRB (), with normalisation photons keV-1 cm-2 s-1 at 1 keV (C-stat = 132.85 for 132 degrees of freedom). Fitting was performed using Cash statistics (Cash, 1979), and the Galactic absorption column was fixed to cm-2 (Willingale et al., 2013). We added a blackbody component to the model to check for thermal emission, but this model did not provide a fit as good as the simple power-law with absorption. The results of the best spectral fit are provided in Table 2.
| spectrum | model | parameters | C-stat | degrees of freedom |
|---|---|---|---|---|
| XRT | power-law tbabs ztbabs | 132.85 | 132 | |
| photons keV-1 cm-2 s-1 |
We triggered target of opportunity (ToO) observations with the Chandra X-ray Observatory under proposal ID 22400511 (PI: Gompertz). We obtained two epochs of observations with the ACIS-S instrument in Very Faint (VF) mode on the 24th and 29th of October. The exposure times were 35 ks and 45 ks, respectively. The afterglow is clearly detected in both epochs, with – keV count rates of cts/s days after trigger and cts/s days after trigger.
Data were analysed using xspec v12.11.1. In order to account for the possibility of a spectral change during the large gap in coverage between the early XRT data and our first Chandra observation, we performed a simultaneous spectral fit of the two Chandra epochs and the late Swift epoch. This is the same data processing method as used in Giarratana et al. (2022). The simultaneous spectral model is the same as for the early XRT data (i.e. power-law tbabs ztbabs), with absorption fixed to the previous values. Our best fit is , indicating that the spectrum has not changed significantly.
The full X-ray light curve is shown in Table 3. XRT data have been absorption corrected using the ratio of counts-to-flux unabsorbed over counts-to-flux observed reported in the time-averaged spectral fit on the UKSSDC. For the Chandra data, we extract the unabsorbed – keV fluxes using the xspec routine cflux and the model fit described previously. Fluxes are then converted to flux densities using (cf. Gehrels et al., 2008)
| (3) |
is the flux density energy (we set 1 keV). and are the lower and upper bounds of the flux bandpass, respectively.
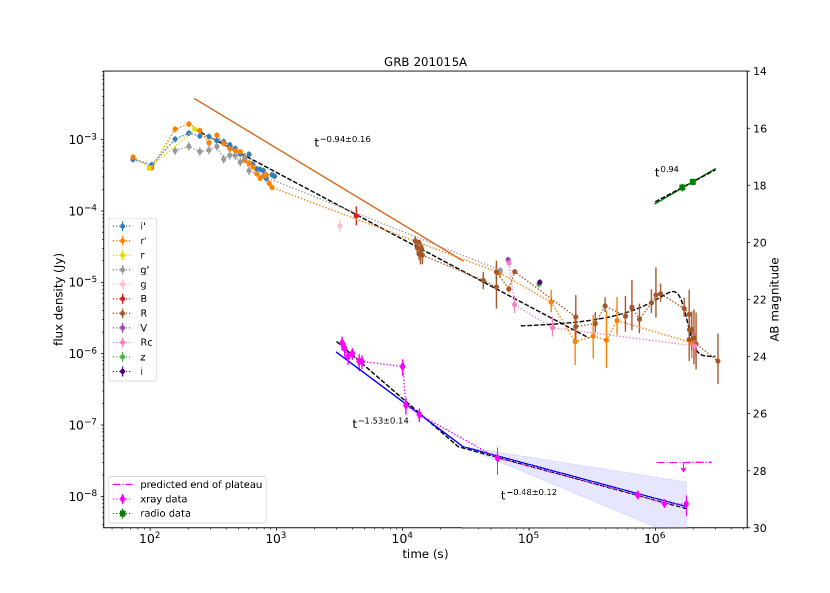
The resulting light curve is well fit ( with 10 degrees of freedom) with a broken power-law model with indices and either side of a break at s (Figure 1). This differs from the fitting of the X-ray data in Giarratana et al. (2022) where this data was approximated to a simple power-law. The broken-power law model for the X-ray afterglow implying a plateau phase affects the closure relation model which describes the synchrotron emission being observed. This long-lasting plateau at late-time is unexpected since it is ongoing until at least s, as Tang et al. (2019) found the plateau end time falls between s for 50% of GRBs with a plateau in the X-ray. We consider the causes for this plateau in Section 3.1 by analysing the closure relations that best fit this afterglow.
| Mean Time | Exposure (s) | Flux Density | Telescope |
|---|---|---|---|
| since trigger (s) | at 1 keV (Jy) | ||
| 3315.92 | 167.99 | XRT | |
| 3478.46 | 193.06 | XRT | |
| 3695.51 | 250.73 | XRT | |
| 3995.15 | 335.97 | XRT | |
| 4529.49 | 271.96 | XRT | |
| 4758.91 | 300.88 | XRT | |
| 9997.85 | 260.76 | XRT | |
| 10627.34 | 882.58 | XRT | |
| 13568.17 | 11036.42 | XRT | |
| 56362.31 | 1795.23 | XRT | |
| 66939.88 | 1384.03 | XRT | |
| 725760.00 | 28800.00 | ACIS | |
| 1179360.00 | 43200.00 | ACIS | |
| 1760376.71 | 322497.18 | XRT |
2.4 Optical
The GOTO telescope Steeghs et al. (2022) began observations of the target 51 mins after the trigger with 490s exposures using the wide L-band filter (400-700 nm). The source was identified and photometrically calibrated in the following manner. A first pass at source detection is made using SExtractor (Bertin & Arnouts, 1996) to identify source positions and preliminary instrumental magnitudes. From the catalog positions, an initial astrometric solution is generated usingastrometry.net (Lang et al., 2010). This solution is further refined if necessary by cross-matching the solved positions against the ATLAS-REFCAT2 (Tonry et al., 2018) astrometric catalog. Any further refinements to the SIP (Simple Imaging Polynomial) distortion parameters of the WCS (World Coordinate System) solution is completed using a custom package333https://github.com/GOTO-OBS/goto-astromtools. Using cross-calibration against the same ATLAS-REFCAT2 catalog and using magnitude zeropoints calibrated against the AAVSO Photometric All-Sky Survey (APASS) survey444http://www.aavso.org/apass, an equivalent APASS -band magnitude of the optical afterglow was found to be .
We triggered target of opportunity (ToO) observations with the Liverpool Telescope (LT; Steele et al., 2004) under program PL20B21 (PI: Gompertz). We obtained four epochs of observations with the IO:O instrument using the and filters (Fukugita et al., 1996), beginning on the night of the 16th of October (1 day after trigger). The individual images are aligned using spalipy555https://pypi.org/project/spalipy/ and stacked. Photometry is performed with sep666https://sep.readthedocs.io/en/v1.0.x/index.html (Bertin & Arnouts, 1996; Barbary, 2016). Magnitudes are extracted with a 3 pixel aperture radius, which minimises the confidence interval while avoiding unwanted light from the complicated field. Photometric zero points were computed using nearby field stars in the Pan-STARRS catalog (Chambers et al., 2016).
The optical data collected from all the GCNs is shown in the Appendices. These data were then corrected for extinction based on the position of the afterglow and the waveband of the observation using the IRSA Galactic Dust Reddening and Extinction tool777https://irsa.ipac.caltech.edu/applications/DUST/. The magnitudes from the various filters were converted to AB magnitudes and flux density (Jy) using the zero points from Frei & Gunn (1994).
We fit a broken power-law to the afterglow light curve up to s. We find that the peak is at s which is the deceleration time. After the peak, the power-law decays at . The data after 1 day are fit to the analytic supernova model from (Bazin et al., 2011) described in Section 3.2.
Limited spectral information was available from this data, but we used the simultaneous observations in g’, r’, and i’ bands by the NUTTela-TAO Burst Simultaneous Three-Channel Imager (BSTI) instrument, to infer the spectral index over the time period s. We fit a power-law to the extinction corrected magnitudes against central wavelength of the filters for each epoch with multiple filter observations. We then calculate the average spectral index with weighting of resulting in average spectral index of in the early optical data.
2.5 Radio
In Table 4, we have tabulated the radio (1.5 GHz) observations by e-Merlin taken on 3rd and 7th November 2020 presented in the GCN notices (Rhodes et al., 2020). We fit a simple power-law to the flux densities to determine the decay of the radio light curve: . Suitable errors could not be provided for this fit due to the lack of observations.
| Time (s) | Flux density (Jy) | Frequency | Telescope |
|---|---|---|---|
| e-Merlin | |||
| e-Merlin |
3 Analysis
3.1 Closure Relations
The relations between the spectral index and the temporal index based on the synchrotron external shock model, are termed the closure relations (Sari et al., 1998; Zhang & Mészáros, 2004). As the GRB ejecta jet propagates forward, it collides with the circumburst medium creating forward and reverse shock waves, resulting in further shocks. This relation arises from the synchrotron radiation emitted by the accelerated electrons in the magnetic field. The afterglow is described as The electron spectral index determines the parameters of the closure relation.
We use the temporal and spectral indices described in Section 2, which are summarised below and in Table 3.1, to compare the observational data to the theoretical framework. The X-ray light curve is best described by a broken power-law with and . The break indicating the start of the plateau phase is at s. The spectral index of the first phase is , and for the second phase. The optical light curve after the peak at s has a decay of and the spectral index is measured to be from s. We could not get spectral information after the time because there were no simultaneous observations with different filters as provided by the NUTTelA-TAO BSTI for the early time data. The temporal index after the break could not be determined due to the supernova. The radio provides late time information in a different waveband after demonstrating a temporal index of . The light curve is shown in Figure 1. The closure relations (CR) can provide a diagnostic for the surprising late-time rebrightening in the X-ray.
To find the electron spectral index , we calculated it independently using the and values for the optical and X-ray observations before the break time , and found the average for the scenario where the results are consistent with each other. We considered the wind to ISM transition as a possible explanation for the steep-to-shallow transition such as the case with GRB 140423A (Li et al., 2020). However this failed to converge in consistent values of . The best case scenario was relativistic, isotropic, self-similar deceleration phase for in ISM, in the slow cooling regime, with .
To explain the afterglow after the break, we needed to introduce energy injection. The shallowing of the light curve can be explained by the process of continuous energy injection from the central engine, possibly an accreting supra-massive neutron star, or magnetar or black hole (Chen et al., 2017; Li et al., 2018). The luminosity of this central engine is given by (Zhang & Mészáros, 2001)
| (4) |
where is the time at which the self-similar solution forms and the external shocks begin to decelerate, and is the energy injection parameter (Zhang & Mészáros, 2001; Li et al., 2018). Evidence of the injection would be present in the afterglow when . Values of are typical for GRBs expected to have energy injection from a magnetar or black hole (Li et al., 2018). Another possibility is the energy injection from slower shells of ejecta catching up to the initial decelerating shock wave (Zhang et al., 2006). In this scenario, the energy injection is described as where is the Lorentz factor, and is the shell model energy injection parameter. We calculated the value of from the energy injection equation in Gao et al. (2013a):
| (5) |
using the measured value of and the value of found above. The shallowing of the light-curve in the X-ray can be explained by energy injection parameter . The 1-sigma confidence range of relates to . This range is denoted by the blue shaded region in Figure 1 along with the slopes for each of the light curves from the CR. The spectral and temporal indices given by the described CR are given in Table 3.1
| Temporal index | Spectral index | ||||
| Temporal phase | Frequency | CR model | Observed | CR model | Observed |
| No energy injection ( s) | X-ray () | 1.32 | 1.21 | ||
| optical () | 1.07 | 0.71 | |||
| Energy injection ( s) | X-ray () | 0.48 | 1.21 | ||
| optical () | 0.04 | - | 0.71 | - | |
| radio () | -1.13 | -0.33 | - | ||
3.2 Supernova
| SN model parameters | (s) | (s) | (s) | ||
|---|---|---|---|---|---|
| fitting results |
The optical observations later than 1 day show evidence of a supernova. The following analytic supernova model used in Taddia et al. (2015) and Bazin et al. (2011) was fit to the data:
| (6) |
where is the flux density, is the time, and are normalisation constants, and , and are related to the time of the peak of the supernova:
| (7) |
The result of the fitting is given in Table 6 with 1 sigma errors, and presented in the light curve in Figure 1. Based on the , and values, the peak of the supernova is at s = days. The definition for the rise time given in Taddia et al. (2015) is where is the average between the last non-detection of the supernova and the first detection point. Since we have observed the GRB and all times are given relative to the trigger time, by definition , and . The observed rise time of the SN converted to the rest frame of the GRB is days. Based on the results from Taddia et al. (2015), this is within the 50th percentile for SNe Ic and within the 11th percentile for SNe Ic-BL. Taddia et al. (2015) shows that SNe Ib or IIb have rise times , making this SN more consistent with type Ic and Ic-BL.
The peak luminosity of the SN from our fits was Jy, or mag, assuming a luminosity distance Mpc, we have an absolute magnitude of mag. Lyman et al. (2014) show that the bolometric correction for Type I core-collapse supernovae to –band (approximate rest-frame of our observed –band) around peak is close to zero (typically from to mag), and so our –band peak luminosity can be approximated to bolometric. Peak bolometric magnitudes range from approximately to mag for Type Ic-BL SNe (Lyman et al., 2016; Prentice et al., 2019). Although this indicates the SN associated with GRB 201015A was somewhat luminous in comparison, other luminous examples of GRB-SNe exist such as SN2011kl (Kann et al., 2016) and SN2012bz (Schulze et al., 2014) and are more comparable with peak luminosities mag and mag respectively. SN2011kl is spectrally more similar to a super-luminous SN (SLSN) than other GRB-SNe, and it is associated with a ultra-long GRB (111209A) Greiner et al. (2015). Whereas SN2012bz is the counterpart of GRB 120422A, a relatively low luminosity GRB with a s and erg Schulze et al. (2014), and hence quite comparable to GRB 201015A. Given our large statistical uncertainty on the peak, and an additional bolometric correction systematic uncertainty, we cannot analyse the luminosity of the SN associated with GRB 201015A beyond these general statements.
3.3 Dainotti Relation
The canonical X-ray afterglow of GRBs contains a plateau phase where the decay constant increases, which is typically linked to energy injection (Nousek et al., 2006). In the afterglow of GRB 201015A, the energy injection phase is seen to last surprisingly long and there is no visible end time. The 3D Dainotti relation links the end time of the plateau phase in the afterglow (), with the end of plateau X-ray luminosity (), and with the luminosity of the brightest second of the GRB prompt emission () (Dainotti et al., 2017). Since we do not know where the end of the plateau phase is, the separate 2D relations given in Dainotti et al. (2015) were used in order to get a prediction of and test if this afterglow violates the Dainotti relation. Combining the following equations from Dainotti et al. (2015):
| (8) |
| (9) |
gives:
| (10) |
where , , , . The peak luminosity, erg s-1, was found from the peak 1 second spectrum of the prompt emission of GRB 201015A, created using the automated HEASoft batgrbproduct processing. Using Equation 10, we find s. This result is represented in Figure 1 by the position of the pink arrow, and the 1 sigma confidence region is indicated by the dash-dotted pink horizontal line.
The position of the predicted end time of the plateau falls closely with the last XRT observation. This long-lasting, and late shallow plateau phase could be a normal feature of a burst with a low assuming these bursts follow the Dainotti relation, however we have not observed many late plateaux.
3.4 Jet opening angle
The observation of a jet break - a shallow-to-steep transition in the light curve - is a useful feature which the majority of GRB observations do not have (Racusin et al., 2009). Based on the estimated end time for the X-ray plateau, we estimate the lower limit for the jet half opening angle, . Here we assume the jet break time is s days, as this is the time of the last measurement in the X-ray band. The start time of the energy injection is estimated as s days based on the broken power-law fit to the X-ray light curve. Since we are finding the lower limit for , we approximate the circumburst density to be taking the lower value from the range of – cm-3 for long GRBs given in Panaitescu & Kumar (2002). The energy injection parameter has been converted from the q-value to the s-value for the shell model using the conversion equation for the ISM shock model in Zhang et al. (2006):
| (11) |
giving for . The initial isotropic kinetic energy of the burst is given by:
| (12) |
hence erg if we take to be approximately . To calculate the total kinetic energy we use the following equation:
| (13) |
providing the final isotropic kinetic energy erg. Finally, using the equation for half jet opening angle in Fong et al. (2014):
| (14) |
shows that . This value of is consistent with the population of long GRBs which have a range of , although it is greater than the mean of (Fong et al., 2014). We have treated this as a uniform jet, but other jet structures and components (e.g. cocoon) may provide different results Lamb et al. (2021b).
Assuming the half jet opening angle, , we can estimate the energy emitted in gamma-rays from the prompt emission of this GRB. The is corrected by the beaming factor (Peng et al., 2005):
| (15) |
giving erg.
4 Comparison to the spectrally soft population
Only three GRBs in the third Swift-BAT catalogue (Lien et al., 2016) have a prompt emission spectrum with photon indices : 050416A, 080520 and 140622A. From this sample, 140622A is the only GRB thought to have a merger progenitor, based on the duration s, although this characterisation as a short GRB is uncertain based on its unusually soft spectrum (Sakamoto et al., 2014). Machine learning analysis of the prompt emission also categorises it as a short GRB (Jespersen et al., 2020). The others have been classified as long GRBs based on their being greater than 2 seconds and having a soft spectrum, however without the observation of a supernova or kilonova counterpart, these classifications cannot be confirmed.
We fit the BAT spectra from the third Swift-BAT catalogue (Lien et al., 2016), and XRT time-averaged spectra from the Swift Burst Analyser 888https://www.swift.ac.uk/burst_analyser/ (Evans et al., 2010) to a simple power law model to find the photon indices. We find that the photon indices for both the BAT and XRT bands are similar for each of the GRBs: and . The values of each of the photon indices can be found on Table 7.
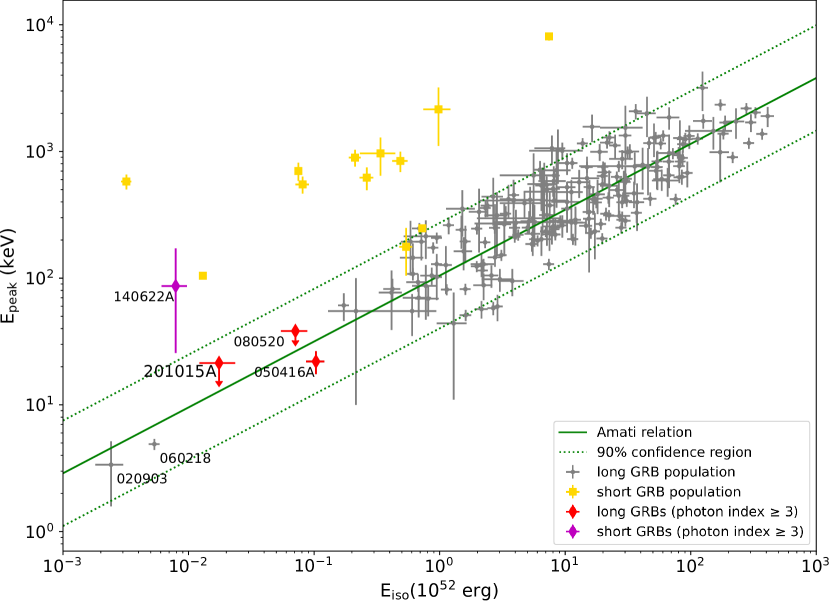
The Amati relation provides a correlation between and of the time-averaged prompt spectrum of long GRBs (Amati et al., 2002). In order to check the and of this sample of GRBs relative to the Amati relation, we have selected the best fitting model from a simple power-law, cut-off power-law, and Band function fit to the BAT spectra. The method used is as described in Section 2.2 for GRB 201015A, where the equation for the spectral peak energy (Equation 1) uses the low-energy spectral index () in the case of the Band function. The values calculated for GRB 201015A and the other 3 GRBs in this sample were plotted onto an Amati plot (Figure 2) with a large sample of long GRBs with well measured redshift and spectral parameters (Amati, 2006), as well as a few Swift short GRBs for comparison (D’Avanzo et al., 2014). We have an upper limit for in the case of GRB 201015A and GRB 080520 because the cut-off power-law or Band function could not be adequately fit to their spectra using xspec. The lower-limit for the bandpass of the BAT detector (15 keV) was considered the upper limit for the break, and then converted to the rest frame of the GRB using the redshifts of the GRBs. Figure 2 clearly indicates that these bursts along with 2 others (060218, and 020903) are outliers in terms of their low- and low- compared to the rest of the population, but they still fit the Amati relation. The findings for these low- and low- events are shown in Table 7. We find that this population is of low-redshift with 5 out of 6 GRBs having a redshift of . Most of the GRBs have short timescales s, apart from the GRB 060218 calculated by Campana et al. (2006).
| GRB | Redshift | (s) | ( erg) | (keV) | BAT photon index | XRT spectra photon index |
|---|---|---|---|---|---|---|
| 201015A | 0.426 | |||||
| 140622A | 0.959 | |||||
| 080520 | 1.55 | |||||
| 060218 | 0.033 | 999(Campana et al., 2006) | ||||
| 050416A | 0.6535 | |||||
| 020903 | 0.25 | - | - |
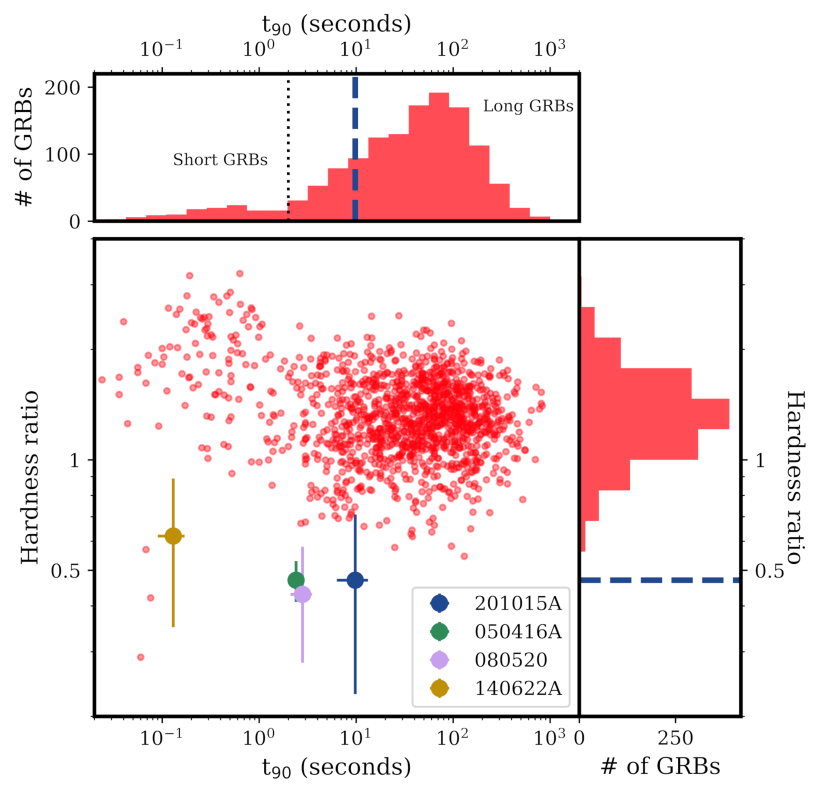
We have used the data from the Swift BAT catalogue (Lien et al., 2016) to plot these GRBs on a plot of against hardness ratio (HR). To find HR, we have used the simple power law fit for all the GRBs in the sample to calculate the ratio of the fluence in the 50 – 100 keV band to the 25 – 50 keV band. For GRB 190326A, there was no error provided for the fluence or the fit parameters. Figure 3 shows the scatter plot of the and HR values, with histograms of both distributions. By fitting a gaussian curve to the HR distribution, we find that the HR for GRB 201015A is 3.4 sigma from the mean and the GRB 140622A HR of 0.62 is 2.5 sigma from the mean. In Table 8, we have tabulated a list of soft GRBs with HR and s, with information on the classification of the GRBs and their redshift found from GCN circulars. The sample of soft GRBs are a mix of mergers and collapsars, with shorter durations than the the general population of short and long GRBs respectively. These GRBs are also found at lower redshifts than most detected GRBs, since only 10% of GRBs have (Le & Mehta, 2017).
.
| GRB | (s) | HR | classification | redshift |
|---|---|---|---|---|
| 050416A | long | 0.6535 | ||
| 080520 | long | 1.545 | ||
| 090417A | short | 0.088 | ||
| 140622A | short | 0.959 | ||
| 150101A | short | - | ||
| 180718A | short | - | ||
| 190326A | N/A | short | - | |
| 201015A | long | 0.426 |
.
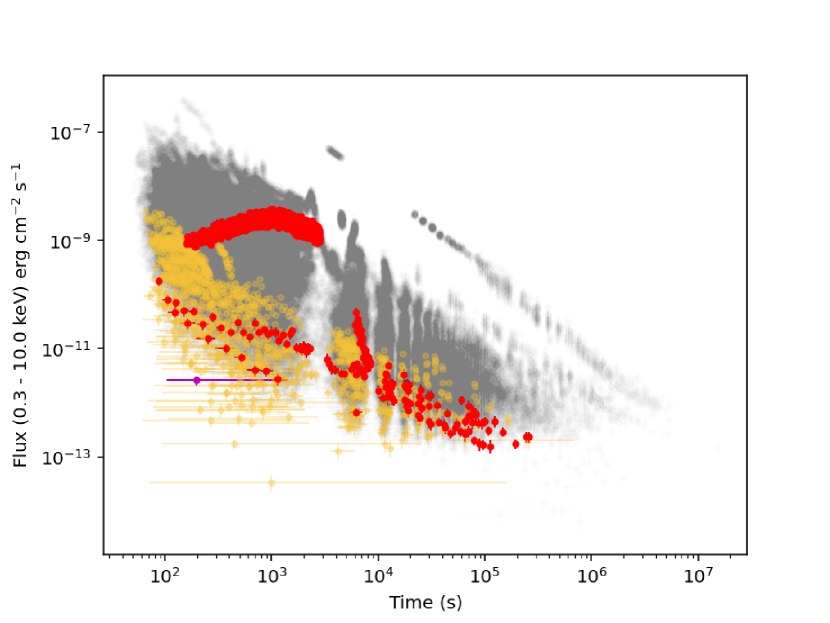
The sample of low-luminosity soft GRBs detected by Swift do not seem to show any similarity in their morphology in the prompt emission light curves. To compare their X-ray afterglows, we have plotted their afterglow light curves in Figure 4 showing the flux in the 0.3–10.0 keV band, along with all Swift GRBs followed up by XRT. This plot was created using the swifttools API101010https://www.swift.ac.uk/API (Evans et al., 2007). The median light curve of short GRBs (yellow) is lower than that of long GRBs (grey) as shown in Margutti et al. (2013). This figure shows that the low- and low- long GRBs (red) typically have X-ray afterglows with lower flux than the median of the population of long GRBs, and are more in line with the short GRB median light curve. The short GRB 140822A (purple) only has one data point, which is also lower in flux than the median for short GRBs, however this is not enough data to draw conclusions. The outlier in the low- and low- long GRBs is 060218 which is more luminous in the 0.3–10.0 keV range than the other GRBs in red up to s after which it joins the others. This emission has been attributed to the prompt emission of the GRB rather than the afterglow since it has s (Campana et al., 2006).
GRB 060218 has a remarkably low redshift of , but is the outlier in terms of the . The duration of the burst is unclear based on the batgrbproduct automated analysis111111https://gcn.gsfc.nasa.gov/notices_s/191157/BA, but Campana et al. (2006) has determined s for this burst. It is believed to be off-axis by a few degrees based on the inner fast variability being attributed to a precessing jet (Fargion, 2006). This GRB was associated with supernova SN 2006aj based on the continuum spectrum of the optical transient detected by VLT (N. Masetti et al., 2006). The underluminous nature of this burst and the detection of a thermal component in the X-ray is interpreted as a mildly relativistic jet causing a shock breakout into dense circumstellar material (Campana et al., 2006; Nakar, 2015). An alternative model suggests a low-luminosity, low Lorentz factor jet () with a low-mass circumstellar envelope, and extinction due to dust (Irwin & Chevalier, 2016). GRB 100316D is an analogous burst to GRB 060218 with a low in the range of 10 – 42 keV (90% confidence range) and an estimated erg (Starling et al., 2011). Unlike these GRBs, the spectrum of GRB 201015A is not well fitted with a blackbody, making it unlikely to have a thermal component.
XRF 020903, a transient detected in the 2 – 5 keV band by the WXM instrument on HETE observing in the 2 – 30 keV range (Ricker et al., 2002), was categorised as an X-ray Flash (XRF) due to its extremely low of (Soderberg et al., 2004). The event coincided with a SN confirmed by the rebrightening in the optical at 24 days and spectroscopic follow up of the optical transient (Soderberg et al., 2002). Urata et al. (2015) studied the afterglow light curve discovering the achromatic rebrightening hence the off-axis viewing. Therefore this event is considered to be an off-axis orphan GRB, for which the narrow collimated relativistic jet is not seen, but the wider afterglow signal can still be detected. This is expected to be observed for GRBs with (Urata et al., 2015). Furthermore, spectroscopic observations into the host galaxy of XRF 020903 with ALMA identified similar properties to GRB host galaxies, supporting the origin of this event to be the same as long GRBs (Chen et al., 2021).
5 Discussion
5.1 Classification
It is not immediately clear from the high energy prompt emission observations alone whether GRB 201015A belongs in the long or short GRB category. The BAT s is consistent with a long burst, whereas the sub-threshold detection by Fermi GBM provides 1.024 s as an estimate of the duration. This emphasises the uncertainty in the measured duration of the bursts based on the detector bandpass, and how this can lead to incorrect categorisation based on . The Swift BAT bandpass is 15–150 keV (Gehrels et al., 2004), whereas Fermi has a larger effective energy range of 8 keV–40 MeV (Yu et al., 2016).
The upper limit of and value of for GRB 201015A are consistent with the ‘Amati relation’ for LGRBs (Amati et al., 2002; Amati, 2006; Minaev & Pozanenko, 2020a). However, the short pulse and extended tail morphology is more in line with a short or extended emission (EE; Norris & Bonnell, 2006; Norris et al., 2010) GRB. The measured erg is under-luminous for an LGRB; the log mean is erg in the GBM-selected sample of Gompertz et al. (2018). It is, however, more consistent with an SGRB. Mean is erg in the complete sample of SGRBs with redshift (Gompertz et al., 2020). To check for consistency, we compared our independent fitting results against estimates from other sources such as GCNs, e.g. (Minaev & Pozanenko, 2020b) for the estimate of erg for GRB 201015A. D’Avanzo et al. (2014) and Minaev & Pozanenko (2020a) show the similar correlation for SGRBs lies just above the Amati relation for LGRBs and some SGRBs may fall closer to the LGRB relation and vice versa so this relation is not a reliable method to determine the classification of a GRB. However, the 4 bursts plotted on Figure 2 in colour do lie in their respective regions of the and correlations, showing this relation holds in the low energy range. Given the ambiguity in the distinction of , HR, and for LGRBs and SGRBs, future GRBs will be difficult to classify without a supernova or kilonova counterpart to confirm their origin.
5.2 Low-luminosity soft bursts
The relative difficulty of finding bursts with low luminosity, and low spectral peak energy and their afterglows results in bursts like these going undetected by instruments designed to trigger for GRBs with high keV energies. Off-axis events for which the prompt emission may not be visible but the afterglow signal could be, might not trigger detectors and therefore have no follow up to find the afterglow other wavebands. Future missions such as SVOM and Einstein Probe will be better equipped to detect bursts in this parameter space. Einstein Probe will launch in 2023 with the intention to discover energetic transients and variable objects in the X-ray band of 0.5 – 4 keV with a large field of view: (Yuan et al., 2015). SVOM is also set to launch in 2023, searching for low-energy bursts in the 4 – 250 keV range using the Eclairs instrument with field of view, and the MXT instrument providing data in the 0.2 – 10 keV energy band (Bernardini et al., 2021). THESEUS is a potential future mission with the goal of finding high-redshift GRBs up to , possibly broadening our sample of soft GRBs at higher redshifts (Amati et al., 2021). Another proposed mission, Gamow Explorer, would trigger JWST and ground based telescopes for follow-up of LGRBs at for spectroscopic and multi-wavelength data (White, 2020).
The population of GRBs exhibiting low and low , are found in a scarcely populated region of the Amati plot (Figure 2). The low luminosity could be a result of lower intrinsic energy release from these bursts, or a choked jet due to circumburst material ejected from the supernova. Alternatively these values could be explained by an off-axis viewing angle such as with the famous GRB 170817A (Lamb et al., 2020) or more recently GRB 190829A (Sato et al., 2021). XRF 020903 also shows evidence of off-axis viewing based on the achromatic rebrightening and is considered an off-axis orphan afterglow (Urata et al., 2015). The off-axis model should reduce the flux, but not affect the photon index of the GRB. It does however lower the characteristic frequency making the overall spectrum softer, and can make the observed photon index softer if the characteristic frequency is shifted across the observational energy band (Lamb et al., 2021a). For GRB 201015A, we cannot find evidence of achromatic rebrightening so the jet is not considered to be off-axis.In the case of GRB 060218, it is considered to be a result of a shock breakout into a dense circumburst environment by Campana et al. (2006); Nakar (2015), but interpretted as a lower Lorentz factor jet by Irwin & Chevalier (2016) which makes the outflow more opaque to the gamma-rays. The shock breakout model should not affect the photon index of the prompt emission of the GRB, so this provides an explanation of why this GRB has , a more typical value compared to (Irwin & Chevalier, 2016).GRB 060218 is thought to be off-axis by a few degrees, with the precession of the jet resulting in rebrightening and variation in the optical and radio afterglows observed (Fargion, 2006). For GRB 201015A there is no evidence of a shock breakout based on the spectral fitting, and it is difficult to determine whether there is rebrightening in the optical at the same time as the X-ray rebrightening due to the SN, indicating the most likely scenario is that of an intrinsically low luminosity jet. The relatively large half jet opening angle estimated to be suggested it is a poorly collimated jet. We find that there are various scenarios which make GRBs appear to have low-, and for all these GRBs, follow-up observations are required to understand the nature of what is causing the lower luminosity.
5.3 Follow up observations
Based on the closure relations found to best fit the temporal and spectral indices measured for GRB 201015, we find that the energy injection scenario is the most plausible for explaining the X-ray light curve. GRB 130603B was also found to have energy injection characterised by , but the radio data does not fit the energy injection model leading to the magnetar spin-down scenario being the best explanation (Fong et al., 2014). Treating the shallowing of GRB 201015A as a normal GRB X-ray afterglow plateau, which is a phase linked to energy injection (Bernardini et al., 2012), shows that it does not violate the Dianotti relation even though it is a very late plateau (Dainotti et al., 2015). It is difficult to explain the origin of this central engine activity and some relate this phase to slightly off-axis viewing (Beniamini et al., 2020). The closure relation described in Section 3.1 fits the afterglow very well, this is partially due to the energy injection coefficient chosen to match the X-ray data after the beginning of the plateau, but this also fits remarkably well with the radio observations, supporting the scenario of ongoing central activity at late-time from this GRB. The earlier phase of X-ray data seems to lie above the prediction from the closure relation which could be an indication of flares from central engine activity as commonly seen in some Swift GRBs (Zhang et al., 2006).
The TeV emission detected from GRBs is considered independent to the prompt emission as it is most likely produced by inverse Compton of the afterglow (Zhang et al., 2020b), therefore we cannot explain the VHE emission with the models proposed for the low energy soft GRBs. More observations of GRBs in VHE are required for further study with comparisons of the afterglows, and prompt emission of VHE GRBs.
We have attempted to account for the variation in observations in the different optical bands using the zero points of the filters (Frei & Gunn, 1994), after adjusting for galactic extinction and absorption based on assumed models for the wavelengths (Schlafly & Finkbeiner, 2011), but it is difficult to account for host galaxy reddening because the extinction curve is unknown. This can also affect the measured optical spectral index we have used to infer the closure relations for this GRB.
Due to the ambiguous prompt emission, the follow-up observations in the optical showing evidence of a SN were necessary to identifying the classification of this burst. This GRB highlights the importance of follow-up missions in categorising GRBs and studying their jets and environments.
6 Conclusions
GRB 201015A is an interesting long GRB for many reasons. It is the fifth burst to have a candidate VHE detection, and is the burst with the lowest prompt energy out of this group. It has a surprisingly low-luminosity for a GRB with isotropic energy erg, and erg based on the predicted opening angle of the jet . Relating to the low , the spectral peak energy is keV, and follows the Amati relation trend for long GRBs. The burst’s prompt emission spectrum is unusually soft with a photon index of . The hardness ratio of this GRB is 0.47 which is 3.4 sigma lower than the mean for Swift bursts.
We have compared GRB 201015A to others which are similarly spectrally soft ( and HR ) from the Swift BAT catalogue. We find that the bursts with are generally short-duration long GRBs which lie in the low-, low- region of the Amati plot. The sample with HR introduces more short GRBs to our selection of soft GRBs. Both the short and long GRBs in this category tend to have a lower duration than the majority of the general short and long GRB populations, and the majority are of low redshift (all except GRB 080520 have ). Looking into the other GRBs in this parameter space shows that they have a range of explanations for their lower luminosity compared to the general population of GRBs. This includes off-axis viewing, shock-breakout into a denser envelope, or an intrinsically less energetic jet. The last scenario is what we have found to be the most likely for GRB 201015A due to lack of evidence for the other cases.
The afterglow of GRB 201015A was an important part of this study, since the detection of a SN in the optical bands confirmed the classification of this burst as a long GRB, and the X-ray data showed a peculiar steep-to-shallow transition at a late-time ( s). The temporal and spectral indices found from the X-ray, optical and some radio observations were used to match with closure relations given in Gao et al. (2013a). The best fitting closure relations were for the relativistic, isotropic, self-similar deceleration phase for the regime in the ISM (Table 13 in Gao et al. 2013a), and electron spectral index . We have also matched the plateau phase to energy injection with after s. The observed plateau phase of this X-ray afterglow was tested against the expected end time of the plateau from the Dainotti relations, and found to be s which is around the last observation in the X-ray. This shows that this GRB does not violate the Dainotti relation (Dainotti et al., 2015). We have then used the predicted to constrain the lower limit of the jet half opening angle . The SN associated with this GRB has a rise time days, consistent with type Ic and Ic-BL (Taddia et al., 2015).
With future missions such as SVOM and Einstein Probe searching in lower energy gamma-rays, and X-rays we will find more bursts like GRB 201015A with higher field-of-view and more sensitive instruments (Yuan et al., 2015; Bernardini et al., 2021). This will help us build a greater data set for statistical analysis of the soft GRB population. Follow-up observations of the afterglow in multiple wavelengths are also required to confirm classification of the GRB, and determine properties of the jet and environment.
Acknowledgements
M.P., P.O., and G.P.L acknowledge the support by the UKRI Science and Technology Facilities Council (STFC). B.G. and M.N. are supported by the European Research Council (ERC) under the European Union’s Horizon 2020 research and innovation programme (grant agreement No. 948381). M.N. acknowledges a fellowship from the Alan Turing Institute. RPB acknowledges support from the ERC under 550 the European Union’s Horizon 2020 research and innovation programme (grant agreement No. 551 715051; Spiders).
This work makes use of data supplied by the UK Swift Science Data Centre at the University of Leicester and the Neil Gehrels Swift Observatory. This research has made use of data obtained from the Chandra Data Archive and software provided by the Chandra X-ray Center (CXC) in the application packages CIAO and Sherpa.
This work is based in part on observations taken by The Liverpool Telescope. The Liverpool Telescope is operated on the island of La Palma by Liverpool John Moores University in the Spanish Observatorio del Roque de los Muchachos of the Instituto de Astrofisica de Canarias with financial support from the UK Science and Technology Facilities Council. The Gravitational-wave Optical Transient Observer (GOTO) project acknowledges the support of the Monash-Warwick Alliance; University of Warwick; Monash University; University of Sheffield; University of Leicester; Armagh Observatory & Planetarium; the National Astronomical Research Institute of Thailand (NARIT); Instituto de Astrofísica de Canarias (IAC); University of Portsmouth; University of Turku, and the UK Science and Technology Facilities Council (STFC, grant numbers ST/T007184/1, ST/T003103/1).
Data Availability
The data underlying this article will be shared on reasonable request to the corresponding author.
References
- Abbott et al. (2017) Abbott B. P., et al., 2017, The Astrophysical Journal, 848, L13
- Ackley et al. (2020) Ackley K., et al., 2020, GRB Coordinates Network, 28639, 1
- Ahumada et al. (2021) Ahumada T., et al., 2021, Nature Astronomy, 5, 917
- Amati (2006) Amati L., 2006, MNRAS, 372, 233
- Amati (2021) Amati L., 2021, Nature Astronomy, 5, 877
- Amati et al. (2002) Amati L., et al., 2002, A&A, 390, 81
- Amati et al. (2021) Amati L., et al., 2021, Experimental Astronomy, 52, 183
- Arnaud (1996) Arnaud K. A., 1996, in Jacoby G. H., Barnes J., eds, Astronomical Society of the Pacific Conference Series Vol. 101, Astronomical Data Analysis Software and Systems V. p. 17
- Band et al. (1993) Band D., et al., 1993, ApJ, 413, 281
- Barbary (2016) Barbary K., 2016, The Journal of Open Source Software, 1, 58
- Barthelmy et al. (2005) Barthelmy S. D., et al., 2005, Space Sci. Rev., 120, 143
- Bazin et al. (2011) Bazin G., et al., 2011, A&A, 534, A43
- Beniamini & van der Horst (2017) Beniamini P., van der Horst A. J., 2017, MNRAS, 472, 3161
- Beniamini et al. (2020) Beniamini P., Duque R., Daigne F., Mochkovitch R., 2020, MNRAS, 492, 2847
- Bernardini et al. (2012) Bernardini M. G., Margutti R., Mao J., Zaninoni E., Chincarini G., 2012, A&A, 539, A3
- Bernardini et al. (2021) Bernardini M. G., Cordier B., Wei J., 2021, Galaxies, 9
- Berti & Carosi (2022) Berti A., Carosi A., 2022, Galaxies, 10
- Bertin & Arnouts (1996) Bertin E., Arnouts S., 1996, A&AS, 117, 393
- Blanch et al. (2020) Blanch O., et al., 2020, GRB Coordinates Network, 28659, 1
- Burrows et al. (2005) Burrows D. N., et al., 2005, Science, 309, 1833
- Campana et al. (2006) Campana S., et al., 2006, Nature, 442, 1008
- Cash (1979) Cash W., 1979, ApJ, 228, 939
- Chambers et al. (2016) Chambers K. C., et al., 2016, arXiv e-prints, p. arXiv:1612.05560
- Chen et al. (2017) Chen W., Xie W., Lei W.-H., Zou Y.-C., Lü H.-J., Liang E.-W., Gao H., Wang D.-X., 2017, ApJ, 849, 119
- Chen et al. (2021) Chen J.-C., Urata Y., Huang K., 2021, The Astrophysical Journal, 915, 46
- Chevalier & Li (1999) Chevalier R. A., Li Z.-Y., 1999, ApJ, 520, L29
- D’Avanzo et al. (2014) D’Avanzo P., et al., 2014, Monthly Notices of the Royal Astronomical Society, 442, 2342
- D’Elia et al. (2020) D’Elia V., et al., 2020, GRB Coordinates Network, 28632, 1
- Dainotti et al. (2015) Dainotti M., Petrosian V., Willingale R., O’Brien P., Ostrowski M., Nagataki S., 2015, Monthly Notices of the Royal Astronomical Society, 451, 3898
- Dainotti et al. (2017) Dainotti M. G., Hernandez X., Postnikov S., Nagataki S., O’brien P., Willingale R., Striegel S., 2017, ApJ, 848, 88
- Evans et al. (2007) Evans P. A., et al., 2007, A&A, 469, 379
- Evans et al. (2009) Evans P. A., et al., 2009, MNRAS, 397, 1177
- Evans et al. (2010) Evans P. A., et al., 2010, A&A, 519, A102
- Evans et al. (2020) Evans P. A., Goad M. R., Osborne J. P., Beardmore A. P., Swift-XRT Team. 2020, GRB Coordinates Network, 28647, 1
- Fargion (2006) Fargion D., 2006, GRB Coordinates Network, 4819
- Fletcher et al. (2020) Fletcher C., Veres P., Fermi-GBM Team 2020, GRB Coordinates Network, 28663, 1
- Fong et al. (2014) Fong W., et al., 2014, ApJ, 780, 118
- Fong et al. (2020) Fong W., Schroeder G., Rastinejad J., Hajela A., 2020, GRB Coordinates Network, 28688, 1
- Fong et al. (2022) Fong W.-f., et al., 2022, arXiv e-prints, p. arXiv:2206.01763
- Frei & Gunn (1994) Frei Z., Gunn J. E., 1994, AJ, 108, 1476
- Fruchter et al. (2006) Fruchter A. S., et al., 2006, Nature, 441, 463
- Fukugita et al. (1996) Fukugita M., Ichikawa T., Gunn J. E., Doi M., Shimasaku K., Schneider D. P., 1996, AJ, 111, 1748
- Galama et al. (1999) Galama T. J., et al., 1999, A&AS, 138, 465
- Gao et al. (2013a) Gao H., Lei W.-H., Zou Y.-C., Wu X.-F., Zhang B., 2013a, New Astron. Rev., 57, 141
- Gao et al. (2013b) Gao H., Ding X., Wu X.-F., Zhang B., Dai Z.-G., 2013b, ApJ, 771, 86
- Gehrels et al. (2004) Gehrels N., et al., 2004, ApJ, 611, 1005
- Gehrels et al. (2006) Gehrels N., et al., 2006, Nature, 444, 1044
- Gehrels et al. (2008) Gehrels N., et al., 2008, ApJ, 689, 1161
- Giarratana et al. (2022) Giarratana S., et al., 2022, arXiv preprint arXiv:2205.12750
- Goad et al. (2007) Goad M. R., et al., 2007, A&A, 476, 1401
- Gompertz et al. (2018) Gompertz B. P., Fruchter A. S., Pe’er A., 2018, ApJ, 866, 162
- Gompertz et al. (2020) Gompertz B. P., Levan A. J., Tanvir N. R., 2020, ApJ, 895, 58
- Gompertz et al. (2022) Gompertz B. P., et al., 2022, arXiv e-prints, p. arXiv:2205.05008
- Greiner et al. (2015) Greiner J., et al., 2015, Nature, 523, 189
- Hjorth et al. (2003) Hjorth J., et al., 2003, Nature, 423, 847
- Irwin & Chevalier (2016) Irwin C. M., Chevalier R. A., 2016, Monthly Notices of the Royal Astronomical Society, 460, 1680
- Iyyani et al. (2016) Iyyani S., Ryde F., Burgess J. M., Pe’er A., Bégué D., 2016, MNRAS, 456, 2157
- Jespersen et al. (2020) Jespersen C. K., Severin J. B., Steinhardt C. L., Vinther J., Fynbo J. P. U., Selsing J., Watson D., 2020, The Astrophysical Journal, 896, L20
- Kann et al. (2016) Kann D. A., et al., 2016, preprint, (arXiv:1606.06791)
- Klebesadel et al. (1973) Klebesadel R. W., Strong I. B., Olson R. A., 1973, ApJ, 182, L85
- Kluźniak & Ruderman (1998) Kluźniak W., Ruderman M., 1998, The Astrophysical Journal, 505, L113
- Koshut et al. (1995) Koshut T. M., Paciesas W. S., Kouveliotou C., van Paradijs J., Pendleton G. N., Fishman G. J., Meegan C. A., 1995, in American Astronomical Society Meeting Abstracts #186. p. 53.01
- Kouveliotou et al. (1993) Kouveliotou C., Meegan C. A., Fishman G. J., Bhat N. P., Briggs M. S., Koshut T. M., Paciesas W. S., Pendleton G. N., 1993, ApJ, 413, L101
- Lamb et al. (2019) Lamb G. P., et al., 2019, ApJ, 883, 48
- Lamb et al. (2020) Lamb G. P., Levan A. J., Tanvir N. R., 2020, The Astrophysical Journal, 899, 105
- Lamb et al. (2021a) Lamb G. P., et al., 2021a, Universe, 7, 329
- Lamb et al. (2021b) Lamb G. P., Kann D. A., Fernández J. J., Mandel I., Levan A. J., Tanvir N. R., 2021b, Monthly Notices of the Royal Astronomical Society, 506, 4163
- Lang et al. (2010) Lang D., Hogg D. W., Mierle K., Blanton M., Roweis S., 2010, AJ, 139, 1782
- Le & Mehta (2017) Le T., Mehta V., 2017, The Astrophysical Journal, 837, 17
- Lei et al. (2013) Lei W.-H., Zhang B., Liang E.-W., 2013, ApJ, 765, 125
- Levan (2018) Levan A., 2018, in 2514-3433, Gamma-Ray Bursts. IOP Publishing, pp 5–1 to 5–18, doi:10.1088/2514-3433/aae164ch5, https://dx.doi.org/10.1088/2514-3433/aae164ch5
- Levan et al. (2014) Levan A. J., et al., 2014, ApJ, 781, 13
- Levan et al. (2016) Levan A., Crowther P., de Grijs R., Langer N., Xu D., Yoon S.-C., 2016, Space Sci. Rev., 202, 33
- Li et al. (2018) Li L., Wu X.-F., Lei W.-H., Dai Z.-G., Liang E.-W., Ryde F., 2018, The Astrophysical Journal Supplement Series, 236, 26
- Li et al. (2020) Li L., et al., 2020, The Astrophysical Journal, 900, 176
- Liang et al. (2007) Liang E., Zhang B., Virgili F., Dai Z. G., 2007, The Astrophysical Journal, 662, 1111
- Lien et al. (2016) Lien A., et al., 2016, ApJ, 829, 7
- Lipunov et al. (2010) Lipunov V., et al., 2010, Advances in Astronomy, 2010, 349171
- Lipunov et al. (2020) Lipunov V., et al., 2020, GRB Coordinates Network, 28633, 1
- Lü et al. (2015) Lü H.-J., Zhang B., Lei W.-H., Li Y., Lasky P. D., 2015, preprint, 1501.02589
- Lyman et al. (2014) Lyman J. D., Bersier D., James P. A., 2014, Monthly Notices of the Royal Astronomical Society, 437, 3848
- Lyman et al. (2016) Lyman J. D., Bersier D., James P. A., Mazzali P. A., Eldridge J. J., Fraser M., Pian E., 2016, Monthly Notices of the Royal Astronomical Society, 457, 328
- Malesani et al. (2020) Malesani D. B., de Ugarte Postigo A., Pursimo T., 2020, GRB Coordinates Network, 28637, 1
- Margutti et al. (2013) Margutti R., et al., 2013, MNRAS, 428, 729
- Markwardt et al. (2020) Markwardt C. B., et al., 2020, GRB Coordinates Network, 28658, 1
- Meegan et al. (2009) Meegan C., et al., 2009, ApJ, 702, 791
- Mészáros (2002) Mészáros P., 2002, ARA&A, 40, 137
- Minaev & Pozanenko (2020a) Minaev P. Y., Pozanenko A. S., 2020a, MNRAS, 492, 1919
- Minaev & Pozanenko (2020b) Minaev P., Pozanenko A., 2020b, GRB Coordinates Network, 28668, 1
- Mukherjee et al. (1998) Mukherjee S., Feigelson E. D., Jogesh Babu G., Murtagh F., Fraley C., Raftery A., 1998, ApJ, 508, 314
- N. Masetti et al. (2006) N. Masetti E. P., Pian E., Patat F., 2006, GRB Coordinates Network, 4803
- Nakar (2015) Nakar E., 2015, ApJ, 807, 172
- Nava (2018) Nava L., 2018, International Journal of Modern Physics D, 27, 1842003
- Norris & Bonnell (2006) Norris J. P., Bonnell J. T., 2006, ApJ, 643, 266
- Norris et al. (2010) Norris J. P., Gehrels N., Scargle J. D., 2010, ApJ, 717, 411
- Nousek et al. (2006) Nousek J. A., et al., 2006, ApJ, 642, 389
- Panaitescu & Kumar (2002) Panaitescu A., Kumar P., 2002, ApJ, 571, 779
- Peng et al. (2005) Peng F., Königl A., Granot J., 2005, The Astrophysical Journal, 626, 966
- Piran (2005) Piran T., 2005, Rev. Mod. Phys., 76, 1143
- Prentice et al. (2019) Prentice S. J., et al., 2019, Monthly Notices of the Royal Astronomical Society, 485, 1559
- Racusin et al. (2009) Racusin J. L., et al., 2009, ApJ, 698, 43
- Rastinejad et al. (2020) Rastinejad J., Paterson K., Kilpatrick C. D., Fong W., 2020, GRB Coordinates Network, 28676, 1
- Rastinejad et al. (2022) Rastinejad J. C., et al., 2022, arXiv e-prints, p. arXiv:2204.10864
- Rhodes et al. (2020) Rhodes L., Fender R., Bray J., Williams D. R. A., 2020, GRB Coordinates Network, 28945, 1
- Ricker et al. (2002) Ricker G., Atteia J.-L., Kawai N., Lamb D., Woosley S., 2002, GRB Coordinates Network, 1530
- Rossi et al. (2021) Rossi A., Benetti S., Palazzi E., D’Avanzo P., D’Elia V., De Pasquale M., CIBO Collaboration 2021, GRB Coordinates Network, 29306, 1
- Sakamoto et al. (2014) Sakamoto T., et al., 2014, GRB Coordinates Network, 16438
- Sari et al. (1998) Sari R., Piran T., Narayan R., 1998, ApJ, 497, L17
- Sari et al. (1999) Sari R., Piran T., Halpern J. P., 1999, ApJ, 519, L17
- Sato et al. (2021) Sato Y., Obayashi K., Yamazaki R., Murase K., Ohira Y., 2021, Monthly Notices of the Royal Astronomical Society, 504, 5647
- Schlafly & Finkbeiner (2011) Schlafly E. F., Finkbeiner D. P., 2011, ApJ, 737, 103
- Schulze et al. (2014) Schulze S., et al., 2014, A&A, 566, A102
- Soderberg et al. (2002) Soderberg A., Price P., Fox D., Kulkarni S., Djorgovski S., Berger E., Harrison F., Yost S., 2002, GRB Coordinates Network, 1554
- Soderberg et al. (2004) Soderberg A. M., et al., 2004, The Astrophysical Journal, 606, 994
- Stanek et al. (2003) Stanek K. Z., et al., 2003, ApJ, 591, L17
- Starling et al. (2011) Starling R. L. C., et al., 2011, Monthly Notices of the Royal Astronomical Society, 411, 2792
- Steeghs et al. (2022) Steeghs D., et al., 2022, MNRAS, 511, 2405
- Steele et al. (2004) Steele I. A., et al., 2004, in Oschmann Jacobus M. J., ed., Society of Photo-Optical Instrumentation Engineers (SPIE) Conference Series Vol. 5489, Ground-based Telescopes. pp 679–692, doi:10.1117/12.551456
- Suda et al. (2021) Suda Y., et al., 2021, in Proceedings of the 37th International Cosmic Ray Conference—PoS (ICRC2021), Berlin, Germany.
- Taddia et al. (2015) Taddia F., et al., 2015, A&A, 574, A60
- Tang et al. (2019) Tang C.-H., Huang Y.-F., Geng J.-J., Zhang Z.-B., 2019, The Astrophysical Journal Supplement Series, 245, 1
- Tanvir et al. (2013) Tanvir N. R., Levan A. J., Fruchter A. S., Hjorth J., Hounsell R. A., Wiersema K., Tunnicliffe R. L., 2013, Nature, 500, 547
- Tonry et al. (2018) Tonry J. L., et al., 2018, ApJ, 867, 105
- Troja et al. (2017) Troja E., et al., 2017, Nature, 551, 71
- Troja et al. (2018) Troja E., et al., 2018, Nature Communications, 9, 4089
- Tunnicliffe & Levan (2012) Tunnicliffe R. L., Levan A., 2012, in Roming P., Kawai N., Pian E., eds, Proceedings IAU Symposium Vol. 279, Death of Massive Stars: Supernovae and Gamma-Ray Bursts. pp 415–416, doi:10.1017/S1743921312013610
- Urata et al. (2015) Urata Y., Huang K., Yamazaki R., Sakamoto T., 2015, ApJ, 806, 222
- Virgili et al. (2008) Virgili F. J., Liang E.-W., Zhang B., 2008, Monthly Notices of the Royal Astronomical Society, 392, 91
- White (2020) White N. E., 2020, in Gamma-ray Bursts in the Gravitational Wave Era 2019. pp 51–53 (arXiv:2003.01592)
- Willingale et al. (2013) Willingale R., Starling R. L. C., Beardmore A. P., Tanvir N. R., O’Brien P. T., 2013, MNRAS, 431, 394
- Wilms et al. (2000) Wilms J., Allen A., McCray R., 2000, ApJ, 542, 914
- Yu et al. (2016) Yu H.-F., et al., 2016, A&A, 588, A135
- Yuan et al. (2015) Yuan W., et al., 2015, arXiv e-prints, p. arXiv:1506.07735
- Zhang & Mészáros (2001) Zhang B., Mészáros P., 2001, ApJ, 552, L35
- Zhang & Mészáros (2004) Zhang B., Mészáros P., 2004, International Journal of Modern Physics A, 19, 2385
- Zhang et al. (2006) Zhang B., Fan Y. Z., Dyks J., Kobayashi S., Mészáros P., Burrows D. N., Nousek J. A., Gehrels N., 2006, ApJ, 642, 354
- Zhang et al. (2016) Zhang B., Lü H.-J., Liang E.-W., 2016, Space Science Reviews, 202
- Zhang et al. (2020a) Zhang X.-L., Zhang C.-T., Li X.-J., Su F.-F., Dong X.-F., Chang H.-Y., Zhang Z.-B., 2020a, Research in Astronomy and Astrophysics, 20, 201
- Zhang et al. (2020b) Zhang H., Christie I. M., Petropoulou M., Rueda-Becerril J. M., Giannios D., 2020b, Monthly Notices of the Royal Astronomical Society, 496, 974
- Zhang et al. (2020c) Zhang Z. B., Jiang M., Zhang Y., Zhang K., Li X. J., Zhang Q., 2020c, The Astrophysical Journal, 902, 40
- Zhang et al. (2021) Zhang B.-B., et al., 2021, Nature Astronomy, 5, 911
- de Ugarte Postigo et al. (2020) de Ugarte Postigo A., Kann D. A., Blazek M., Agui Fernandez J. F., Thoene C., Gomez Velarde G., 2020, GRB Coordinates Network, 28649, 1
7 Appendices
The optical afterglow and supernova observations plotted in Figure 1 are given in Table S1 of the Supplementary material, and a sample of the table is shown below.These data were used for the power-law / broken power-law, and SN model fitting. The results from the fitting were used to determine the spectral and temporal indices, deceleration time of the afterglow, and SN peak time and luminosity.
The optical afterglow and supernova observations plotted in Figure 1 are given in Table 9. These data were used for the power-law/ broken power-law, and SN model fitting. The results from the fitting were used to determine the spectral and temporal indices, deceleration time of the afterglow, and SN peak time and luminosity.
| time(s) | observed magnitude | err low | err high | filter | telescope | GCN |
|---|---|---|---|---|---|---|
| 73.2 | 17.67 | 0.1 | 0.1 | i’ | NUTTelA-TAO/BSTI | 28674 |
| 73.2 | 17.79 | 0.1 | 0.1 | r’ | NUTTelA-TAO/BSTI | 28674 |
| 98.0 | 18.34 | 0.08 | 0.08 | r | NEXT-0.6m | 28653 |
| 103.2 | 17.86 | 0.1 | 0.1 | i’ | NUTTelA-TAO/BSTI | 28674 |
| 103.2 | 18.16 | 0.1 | 0.1 | r’ | NUTTelA-TAO/BSTI | 28674 |
| 157.6 | 16.96 | 0.1 | 0.1 | i’ | NUTTelA-TAO/BSTI | 28674 |
| 157.6 | 17.91 | 0.15 | 0.15 | g’ | NUTTelA-TAO/BSTI | 28674 |
| 157.6 | 16.81 | 0.1 | 0.1 | r’ | NUTTelA-TAO/BSTI | 28674 |
| 202.6 | 16.75 | 0.1 | 0.1 | i’ | NUTTelA-TAO/BSTI | 28674 |
| 202.6 | 17.76 | 0.15 | 0.15 | g’ | NUTTelA-TAO/ BSTI | 28674 |