J0332-3557: A comprehensive metallicity analysis of a gravitationally lensed galaxy
Abstract
We provide one of the most comprehensive metallicity studies at by analyzing the UV/optical HST photometry, and rest-frame VLT-FORS2 ultraviolet and VLT-XSHOOTER optical spectra of J0332-3557, a gravitationally lensed galaxy magnified by a factor of . With a 5 detection of the auroral O III] 1666 line, we are able to derive a direct gas metallicity estimate for our target. We find , which is compatible with an increasing of both the gas fraction and the outflow metal loading factor from to . J0332 is the most metal-rich individual galaxy at for which the C/O ratio has been measured. We derive a low log(C/O)= , which suggests that J0332 is in the early stages of ISM carbon enrichment driven mostly by massive stars. The low C/O also indicates that J0332 is characterized by a low star formation efficiency, higher yields of oxygen and longer burst duration. We find that the is as low as . The main drivers of the low are the higher gas metallicity and the low C/O. J0332 is characterized by one diffuse and two more compact regions 1 kpc in size. We find that the carbon emission mostly originates in the compact knots.
tablenum \restoresymbolSIXtablenum \turnoffeditone
1 Introduction
Galaxies at the peak of the cosmic star formation history (; Madau & Dickinson 2014) are very useful to infer how star formation processes occur and develop inside galaxies. However, although the development of colour selection criteria (Steidel et al. 1996) has increased the number of galaxies discovered at redshift –10, at these high galaxies are faint ( at ; Steidel et al. 1999; Reddy et al. 2008) and the S/N needed to perform detailed spectroscopic studies is difficult to achieve. A way to overcome these difficulties is to study high redshift gravitationally lensed galaxies, where the magnification produced by the lensing provides high S/N spectra which can be analyzed in greater detail. Since the duration and efficiency of the star formation depend on the availability of gas (regulated by outflows and inflows), and its ability to collapse and form stars, understanding the mechanisms that regulate star formation and evolution relies on our ability to measure the physical properties of a galaxy ISM and the stellar populations. Rest-frame UV and optical wavelengths are particularly useful to gain insights into the physical properties of high-redshift galaxies.
The ultraviolet continuum and photospheric absorption features can be used to derive the "stellar metallicity" (), i.e., the abundance of metals in the atmospheres of stars. Stellar metallicities are usually inferred from the UV/optical stellar continuum and have been elusive so far, due to its faintness in high-redshift sources. Only recently, has been measured at earlier epochs using stacks of Keck Barionic Structure Survey (KBSS) and The MOSFIRE Deep Evolution Field (MOSDEF) survey spectra (Steidel et al. 2016, Theios et al. 2019, Topping et al. 2020a), stacked galaxies from the VANDELS survey at (Cullen et al. 2019, Calabrò et al. 2021) and the zCOSMOS-deep survey at (Kashino et al. 2022). These studies have shown that increases by a factor from to the present day, for a given stellar mass.
Nebular emission lines can be used to infer the "gas-phase metallicity" (), i.e., the oxygen abundance in the ionized gas surrounding young stars. The most robust way to measure is the direct method, which adopts temperature dependent ratios between auroral lines (e.g., [O III] 1666) and strong lines (e.g., [O III] 5007). Unfortunately, auroral lines are very weak and difficult to observe at low S/N, espcially at high metallicities. The current sample of galaxies with detected auroral lines is as small as galaxies within the redshift range (e.g., Yuan & Kewley 2009; Christensen et al. 2012a, b; Stark et al. 2014; Bayliss et al. 2014; James et al. 2014; Berg et al. 2018; Gburek et al. 2019; Sanders et al. 2020).
An alternative method to derive relies on the use of strong optical emission lines that have been calibrated with direct metallicity measurements or photoionization models. However, since strong emission lines depend on other quantities as well as metallicity, these calibrations are usually difficult and challenging. Literature works on the gas metallicity have shown that the gas phase-mass metallicity relation evolves in a similar way as the stellar-mass metallicity (e.g., Cullen et al. 2021).
Another way to infer how the star formation develops in galaxies is by means of the relative abundances of carbon and oxygen, which are produced by stars of different masses and on different timescales. Oxygen is only synthesized by massive stars () and released into the ISM by core-collapse supernova events on short timescales, while carbon can be produced by any star with mass and released into the ISM during the AGB phase on longer timescales. Therefore, the C/O value builds up as stars of different mass leave the main sequence and informs us on the evolutionary stage of a galaxy (e.g., Mattsson 2010, see also the review by Romano 2022). The scatter of C/O at any given is also related to galaxy evolutionary properties. Berg et al. (2019) found that the C/O ratio depends on the star formation efficiency, the amount of oxygen released into the ISM by supernovae Type II, and the duration of the star formation episodes.
The doublet formed by the forbidden [C III] and the semi-forbidden C III] transitions (C III] 1906,9 hereafter) is also a proxy of the galaxy’s physical and evolutionary properties. The main dependence of is on . In fact, both observations and models have shown that peaks at = , and decreases both below (where the metallicity is too low) and above (where the carbon cooling is very efficient) this threshold (e.g., Leitherer et al. 2011, Rigby et al. 2015, Nakajima et al. 2018). Besides the metallicity, also increases for increasing ionization parameter, decreasing age of the current ionizing stellar population, increasing optical depth, decreasing C/O abundances, and increasing sSFR of a galaxy (Rigby et al. 2015, Jaskot & Ravindranath 2016, Ravindranath et al. 2020). However, not all galaxies fit in this simple picture. For example, the nearby galaxy I Zw 18 (Aloisi et al. 2001, 2007, Rigby et al. 2015) is characterized by a low although being metal poor, vigorously star forming, and characterized by a highly ionized ISM.
In this paper, we analyze the rest-frame UV and optical spectra of FOR J0332-3557 (J0332 hereafter), a gravitationally lensed galaxy at , previously studied by Cabanac et al. (2008). Exploiting UV and optical absorption and emission features, we perform one of the most comprehensive metallicity analyses of a galaxy at this redshift. Using UV and optical spectra, we infer the metallicity of the stellar populations and of the ISM, comparing and contrasting them with those of other galaxies at different redshifts. Thanks to a detection of the auroral line, we are able to provide a direct measurement of the gas metallicity of J0332. Using the UV oxygen line and C III] 1906,9, we investigate the chemical enrichment history of J0332 by means of the relative carbon/oxygen abundance. We also perform a spatially resolved chemical enrichment analysis of J0332, on spatial scales.
The paper is organized as follows: in Section 2 we describe the imaging (HST - Section 2.1) and spectroscopic data (FORS2 in Section 2.2.1 and XSHOOTER in Section 2.2.2) this work is based on; in Section 3 we describe the lens model; in Section 4 we present the results obtained from the SED fitting of HST images; in Section 5 we focus on UV absorption features, describing the kinematics of the ISM and its chemical composition; in Section 6 we derive the stellar metallicity of J0332; in Section 7 we illustrate the properties of the ionized interstellar medium, such as the gas metallicity through the direct method (Section 7.4); in Section 8 we compare the gas and stellar metallicity of J0332; in Section 9, we investigate the relative abundance of carbon and oxygen in J0332; in Section 10 we discuss the carbon emission in terms of its equivalent width and dependencies on physical and evolutionary properties; in Section 11 we show the spatially resolved study performed on the equivalent width of the C III] 1906,9 line on spatial scales of 1 kpc; and we outline our conclusions in Section 12. Throughout this paper, we adopt a flat Planck 18 cosmology (Planck Collaboration et al. 2020), with = 0.31 and H0 = 67.7 km s-1 Mpc-1. The adopted solar metallicity scale is that of Asplund et al. (2021), where log(O/H) = 8.69 (corresponding to ) for instances related to the ISM metallicity. However, when we derive the stellar metallicity of J0332, a solar metallicity log(O/H) = 8.83 (corresponding to ) is adopted, since this is the one assumed by the Binary Population and Spectral Synthesis (BPASS) (Eldridge & Stanway 2016) used for the derivation. We assume (C/O).
2 Data
J0332-3557 (RA=53.24198, Dec=35.96458 (J2000), J0332 hereafter) is a gravitationally lensed galaxy, lensed by a foreground galaxy at . It is located in a sight line through the outskirts of the Fornax cluster, where the reddening of our Galaxy is E(B-V) = 0.02 (Schlegel et al. 1998). Its discovery was first reported by Cabanac et al. (2005, 2008), who performed a spectroscopic study of it by analyzing its VLT/FORS2 ultraviolet spectrum ( in the restframe). Their analysis was focused on the brightest portion of the arc caught by their slit (which was oriented N-S to include both the arc and the lensing galaxy) and on the study of Ly and metal absorption lines. Our study is based on both new, higher resolution VLT/FORS2 and XSHOOTER observations and therefore extends the analysis performed by Cabanac et al. (2008) (see Sections 2.2.1 and 2.2.2).
2.1 HST imaging
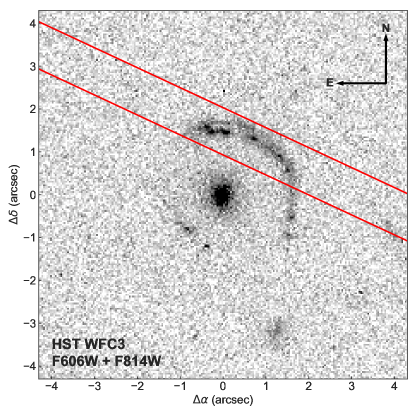
In order to improve the gravitational lensing model and study the stellar populations in the arc, we obtained WFC3 Hubble Space Telescope imaging (Program ID 14093, PI Berg). Exposure times were 1348, 1209, 1080 and 1170 s in the F606W, F814W, F125W and F160W filters respectively. Three exposures were obtained for each filter utilizing a 3-point dither pattern to improve spatial sampling, and each set of exposures was then drizzled to a common output frame with a center defined by the centroid of the lensing galaxy. A 004 pixel scale and Lanczos3 kernel were used for drizzling the UVIS data, and the IR data reduction employed a 008 pixel scale and Gaussian kernel.
2.2 Spectroscopy
2.2.1 FORS2 Spectra
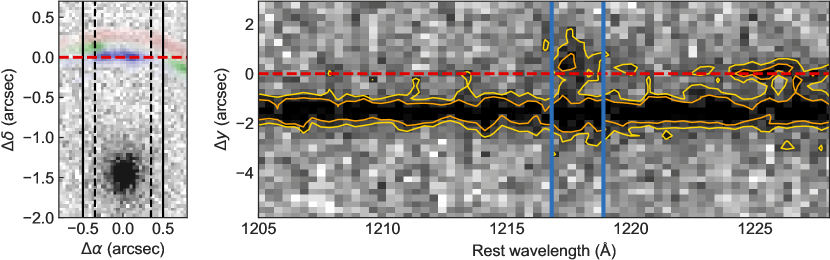
Rest-frame FUV spectra were obtained of FORS J0332-3557 using the FOcal Reducer and low dispersion Spectrograph 2 (FORS) on the Very Large Telescope (VLT) of the European Southern Observatory (ESO). Spectra were observed for the ESO program 086.A-0035(A) on the UT dates of 2012 April 12, October 10, and November 18. As shown in Figure 1, the 10500″ slit was used at an angle of in order to encompass the most flux possible from the arc. The 1200R and 1028z grisms were used with the GG435+81 and OG590+32 filters, respectively, and a CCD pixel binning of (0252/pixel in the spatial direction). This combination provided an observed wavelength coverage of roughly 57707380 Å and 78309590 Å at resolutions of and , respectively. At the redshift of J0332, this corresponds to rest-frame wavelength ranges of roughly Å and Å respectively. The 1200R grism was used for s or 5.8 hours and the 1028z grism for s or 14.4 hours, summing 20.2 hours of total integration time. We note that the previous FORS2 spectrum was taken at a position angle of centered on the lens and brightest knot of the arc only (see Cabanac et al. 2008), and so was not combined with the FORS2 spectra presented here.
2.2.2 XSHOOTER Spectra
Medium-resolution echelle spectra were obtained for FORS-J0332 using XSHOOTER on VLT in order to obtain the rest-frame optical emission lines. Observations were taken as part of the ESO program 094.A-0252(A) on the UT dates of 2014 October 21 and 28. Each of two positions were observed for seconds, for a total exposure time of two hours. XSHOOTER111https://www.eso.org/sci/facilities/paranal/instruments/xshooter/overview.html has three spectroscopic arms: UVB with an observed wavelength range of roughly 3000–5595 Å, VIS with an observed wavelength range of roughly 5595–10,240 Å, and NIR with an observed wavelength range of roughly 10,240–24,800 Å or 1.024–2.480. Note that the rest-frame XSHOOTER VIS wavelength coverage overlaps with the rest-frame FORS2 coverage, allowing us to consistently calibrate the two spectra and use emission line ratios for our analysis. Slits of [10, 09, 09]11″ were used for the UVB, VIS, and NIR arms, respectively, all positioned at in order to match the FORS2 spectrum. This setup provides resolutions of 5400, 8900, and 5600 for the UVB, VIS, and NIR arms, respectively.
2.2.3 Spectral Reductions
The initial spectral reductions for the FORS2 and XSHOOTER spectra were performed using the IDL packages FORS2_REDUCE and XSHOOTER_REDUCE, respectively, written by one of us (GB). The individual 2D frames were bias-subtracted and flat-fielded using a “normalized" pixel flat, with the illumination function in each order divided out. For the NIR arm of the XSHOOTER spectra, dark exposures are also combined and subtracted to remove underlying structure.
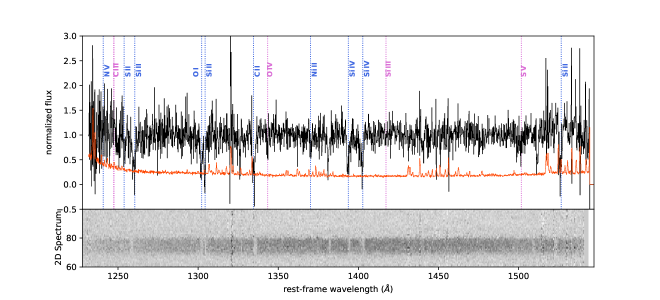
Individual FORS2 exposures were combined into a single 2D frame with bad-pixel rejection. The combined frame was then analyzed using standard iraf tools222https://iraf-community.github.io/. Two versions of FORS2 1D spectra were extracted. By visual inspection of the 2D spectra in the bottom panels of Figure 2, the absorption features transverse the entire continuum emission, while the emission features are more spatially compact. Therefore, a wide aperture of 20 pixels, or 504, was used to extract 99% of the continuum light in the slit in order to optimize absorption line measurements. Additionally, a narrow aperture of 9.6 pixels, or 242, was used to capture 99% of the nebular emission. Finally, wavelength and flux calibration were performed using the known FORS2 wavelength map and the standard sensitivity functions provided for the 1028z and 1200R grisms.
The remaining XSHOOTER spectral reduction was performed with the aforementioned IDL package. Wavelength calibration was performed using the known XSHOOTER wavelength-pixel map. The sky was then modeled using a b-spline fit and subtracted from the 2D frame in each arm. An optimal sky subtraction was performed on each order by fitting a b-spline to the sky counts333The XSHOOTER_REDUCE package uses the optimal sky subtraction techniques of Kelson (2003). It also uses the IDLUTILS routines developed for SDSS spectral reduction, in particular the b-spline fitting routines written by Scott Burles and David Schlegel. Because the sky is very bright in the NIR arm, a nodded exposure was used for the primary sky subtraction. Additionally, since little to no continuum was detected in the XSHOOTER-NIR observations of J0332, the bright [O II] nebular emission doublet was used to determine the fiducial center of the extraction, while the trace shape was determined from a standard star spectrum. An extraction FWHM of 15 pixels, or 242, was used for the VIS arm and 9 pixels, or 223, was used for the NIR arm in order to best match the extraction aperture of the narrow FORS2 extraction. Atmospheric corrections and response functions for each arm are used to simultaneously flux calibrate and optimally extract a single 1D spectrum by flux scaling the individual arms to match.
2.2.4 Relative Flux Calibration
While neither our absorption line analysis (using the normalized spectrum) or nebular emission line analysis (using line ratios) depends on the absolute flux calibration, the latter does combine line fluxes from both the FORS2 and XSHOOTER spectra. Therefore, for this work, we are primarily concerned with having a robust relative flux calibration between the FORS2 and XSHOOTER spectra.
For the XSHOOTER spectra, the instrumental profile of the skylines has FWHM pixels, allowing us to rebin the XSHOOTER spectra by 2 to improve the signal-to-noise. The XSHOOTER spectra are then scaled to the narrow-aperture FORS spectrum using the flux in the C III] emission lines, which are common to both spectra. The resulting set of flux-calibrated spectra – the narrow- and wide-aperture FORS spectra and the XSHOOTER spectrum – have equivalent measurements of the C III] flux.
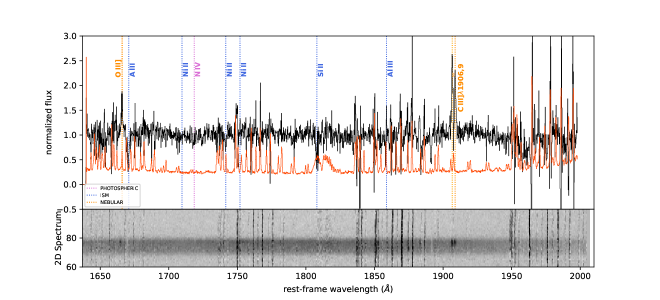
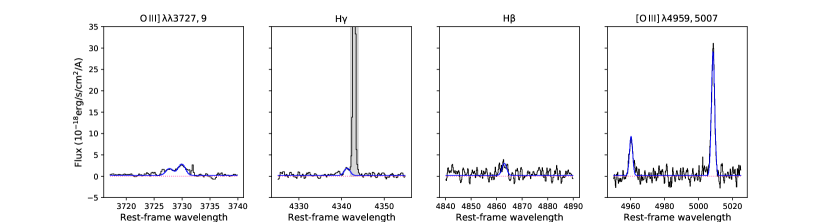
The resulting spectra are shown in Figures 2 and 3 for the FORS2 and XSHOOTER spectra, respectively. The FORS2 rest-frame UV spectrum covers a wavelength range of 1230–2000 Å, with a gap in the wavelength coverage from 1540–1640 Å due to the use of two non-overlapping gratings. Unfortunately, the FORS2 spectrum also lacks coverage of the the Ly feature. The XSHOOTER spectrum covers the rest-frame UV and optical regimes. The four strongest rest-frame emission lines detected ([O II] 3727, H , H , and [O III] 4959,5007) are shown in Figure 3.
3 Lens model, source reconstruction and spectroscopic redshift
The lens model is fitted directly to the HST imaging data. The NIR images have significantly higher signal-to-noise than the UVIS images, but they also suffer from relatively poor spatial resolution and significant confusion between the lensed Einstein ring and the lensing galaxy. We therefore use the UVIS images for the lens modelling and combine the F606W and F814W bands to improve the signal-to-noise. Our noise model is determined by adding in quadrature the empirical background (sky plus detector) noise with the Poisson noise determined from the images in conjunction with the exposure time map produced in our drizzling procedure.
We employ a singular isothermal ellipsoid plus external shear model for the lensing mass distribution. The source surface brightness distribution is described as the amplitudes of pixels on an irregular grid that adapts to the local lensing magnification Vegetti & Koopmans (2009). A field star from the combined F606W+F814W image is used for a PSF model, and we use the lensing galaxy position as a starting point for our modelling but otherwise ignore the light from the foreground galaxy as it has essentially no impact on the resulting lens or source models, which yield an inferred magnification of .
We measure the spectroscopic redshift of J0332 using the strong nebular emission lines O III] 1666, C III] 1906,9, [O III] 5007 observed in the FORS2/XSHOOTER spectra. The values obtained from each emission line used are reported in Table LABEL:tab:redshift.
| Ion | redshift | error | |
|---|---|---|---|
| O iii] | 1666.15 | 3.77195 | 0.00024 |
| [C iii] | 1906.68 | 3.77302 | 0.00006 |
| C iii] | 1908.73 | 3.77358 | 0.00012 |
| [O iii] | 5008.24 | 3.77327 | 0.00003 |
The derived average redshift is . This estimates is, within the uncertainties, in agreement with the one measured by Cabanac et al. (2008).
4 SED fitting
We model the broadband photometry of J0332 with the SED-fitting code prospector (Johnson et al. 2021), which uses the Flexible Stellar Population Synthesis (FSPS) models (Conroy et al. 2009; Conroy & Gunn 2010). In addition to the HST measurements in the F606W, F814W, F125W and F160W filters, which span the wavelength range –3200 Å in the rest frame of the arc, we use ground-based imaging (Cabanac et al. 2008) in order to extend the photometric coverage beyond the Balmer break. The observed AB magnitudes in the five modeled bands are given in Table LABEL:tab:photometry.
We use the Binary Population and Spectral Synthesis (BPASS, Eldridge et al. 2017) v2.2 stellar population models, a Chabrier (2003) intial mass function, and the SMC extinction law (Gordon et al. 2003). In order to minimize the number of free parameters, we assume a constant star formation history and fix the metallicty of the models to 0.05 , the best-fit metallicity from fitting the stellar spectrum (see Section 6.1 below).
The resulting best-fit stellar population properties are , age Myr, and . A constant star formation history then implies a star formation rate of 21.6 M⊙ yr-1.
| Band | |
|---|---|
| F606W | |
| F814W | |
| F125W | |
| F160W | |
5 The UV interstellar absorption spectrum
The velocity profiles of interstellar absorption features encode information about the kinematics of the gas where the lines are produced, while their strength is related to the abundance of the elements they are produced from (to the extent that they are not saturated). In the following sections we focus on the UV absorption features in the FORS2 spectrum of J0332 and derive the kinematics and chemical composition of its ISM.
5.1 Gas kinematics
We identify several absorption lines in the FORS2 spectrum of J0332 (see Figure 2). These lines are produced by a variety of ions in different ionization states, from to . We find that the absorption lines have velocity profiles extending from approximately to .
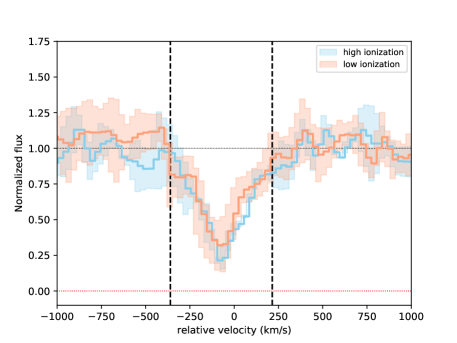
Figure 4 shows the average velocity profiles for the high and the low ionization lines. The velocity profiles are obtained by separately averaging the individual velocity profiles of the low ionization lines (, , , , ) and the high ionization lines ( and )444The average high ionization profile has larger uncertainties since only 2 lines are used to obtain it.. In order to compute the average, we masked the portion of the lines which are contaminated by stellar features (where resolved). When spectral features are close to each other, we alternately include one of them in the average while masking the other. From the average profiles, we note the presence of blue-shifted absorption extending to velocities up to .
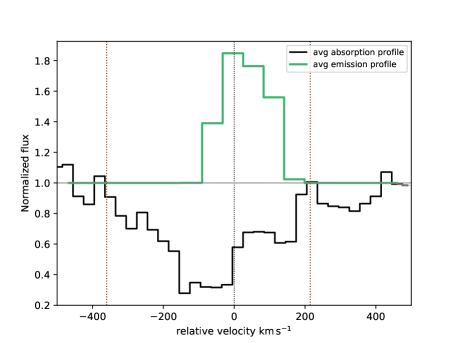
Figure 5 compares the average absorption profile obtained by averaging all the UV absorption lines (both high and low ionization) to the average emission profile obtained by averaging together the individual lines of the C III] 1906,9 doublet. Also in this case, we alternately mask the doublet line not being used in the average. We observe that the absorption profile extends to higher negative velocities than the emission profile (we find an intrinsic velocity dispersion ). In contrast, the emission and absorption profiles share the same velocity range at positive velocities, suggesting the absence of inflows.
5.2 The mechanism of outflow production
Outflows are a common feature in star-forming galaxies at high as well as low redshifts (Pettini et al. 2001, Shapley et al. 2003, Steidel et al. 2010, Marques-Chaves et al. 2020). The relationship between outflow and star formation properties has been investigated by several theoretical and observational studies (e.g., Ferrara & Ricotti 2006; Steidel et al. 2010; Murray et al. 2011; Sharma & Nath 2012). These studies have suggested the presence of two main mechanisms of outflow production: (1) mechanical energy injected into the ISM by supernovae or (2) momentum injected through radiation pressure from massive stars acting on dust grains or (3) a combination of the two (e.g., Xu et al. 2022).
At low redshift (), there is general agreement that the - SFR relationship is a weak power law, with (Martin 2005, Weiner et al. 2009, Chisholm et al. 2016, Trainor et al. 2015, Sugahara et al. 2017). At higher redshift (), there is instead uncertainty about the significance of this relation.
Recently, Weldon et al. (2022) have investigated the relation between and the SFR of a sample of 155 typical star-forming galaxies at drawn from the MOSFIRE Deep Evolution Field (MOSDEF - Shapley et al. 2015) survey. They found that . This weak dependence is compatible with the mechanical energy injection scenario. However, their relation is characterized by a large scatter. Given the SFR we derive for J0332 from H () (see Section 7.2), and the , we find that J0332 actually lies within the scatter of the Weldon et al. (2022) relation, favoring the mechanical energy injection scenario.
The fact that we do not detect any inflows in J0332 is a common finding in high redshift galaxies. To our knowledge, only two gravitationally lensed galaxies show signatures of inflows in their spectra: the Cosmic Eye (Quider et al. 2010) and J1059+4251 (Citro et al. 2021). The reason why inflows of accreting cold gas at high redshift are very elusive and difficult to observe is that they are often obscured by outflows or by absorption from the galaxy’s ISM (Steidel et al. 2010). However, other effects can play a significant role: for example,a lower covering fraction compared to the outflows or lower metallicities, which makes the metal lines very weak.
5.3 Chemical composition
In this section, we use the UV absorption lines in the FORS2 UV rest-frame spectrum of J0332 to derive the chemical composition of its neutral ISM.
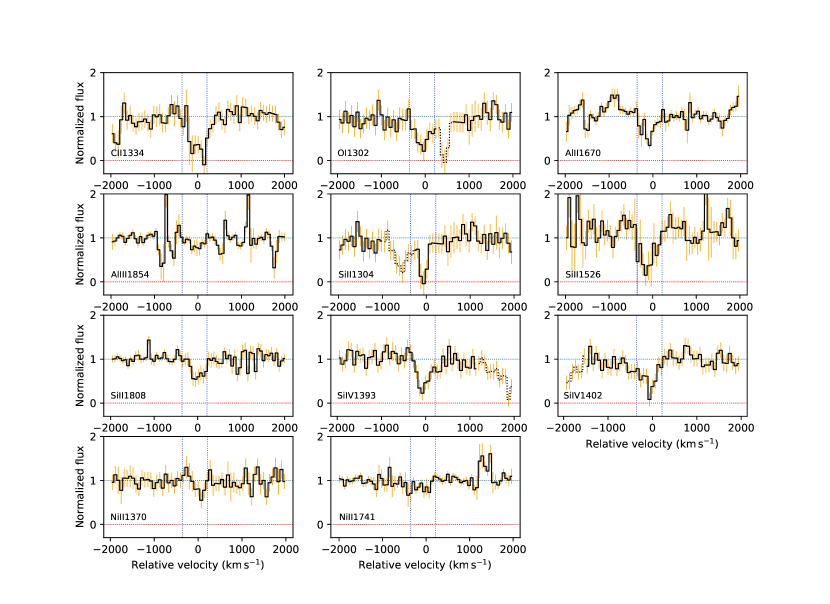
Figure 6 shows the velocity profiles of the identified ISM absorption lines. The first step adopted to derive the abundances of these elements is deriving the column densities of the absorption lines. In order to do so, we apply the apparent optical depth (AOD) method proposed by Savage & Sembach (1991). This approach allows us to recognize cases where narrow saturated components are hidden by overlapping broader ones; this circumstance is very likely to happen in J0332, given the shape of the velocity profiles and the fact that the observed absorption lines are a combination of many unresolved sight-lines.
In the AOD method, the column density of an ion per velocity bin, , is related to the apparent optical depth in that bin, , by the expression:
| (1) |
where and f are, respectively, the wavelength (in Å) and oscillator strength of the atomic transition. When lines with differing -values absorbing from the same ground state of an ion produce discordant values of , then hidden saturation is present (since by definition there is only one value of the column density for that ground state).
Partial, as opposed to complete, coverage of the stars by the absorbing gas would produce a similar effect. However, in our case we do not expect this to be a significant complication, since our strongest lines reach the zero flux level (i.e., , and ). We apply the AOD method to the three silicon lines available, which are characterized by very different -values. We find that (as expected) and are saturated. , the weakest of the three, is instead not saturated and therefore the only one more likely to provide a reliable estimate of the Si column density.
We expect to be saturated, since O I has a ionization level which is very similar to that of Si II. Moreover, Fig. 6 shows that has the same depth as , but it has a much higher -value (see Table 4). This suggests that is also saturated. From the AOD method, we derive that and are not saturated. We derive that the lines are both saturated. However, we are not able to verify the saturation level through the AOD method, as it is the only Al++ transition we detect.
Summarizing, we rely on the , and transitions as representative of the abundances of -capture and iron peak elements.
Table 3 lists the equivalent widths (EWs) and the column densities () of the absorption lines we derive. We verify that our measured EWs and values agree with those derived from the J0332 spectrum analyzed by Cabanac et al. (2008) (obtained through private communication) if we assume the same velocity range for the integration as theirs. However, the values of EWs and column densities reported in their paper are higher than ours, possibly due to the larger velocity range assumed for the integration (see Sec. 2).
Figure 7 shows the chemical abundances derived from the AOD method compared with those obtained for other lensed galaxies at high redshift. For these calculations, we assume a solar metallicity from Asplund et al. (2021) is Z = 0.014 (corresponding to 12+log(O/H) = 8.69).
The N(HI) measurement used in this plot is the value derived by Cabanac et al. (2008) from fitting the damped Ly profile. Together with our measurements for Si and Ni, we also show the Fe abundance that Cabanac et al. 2008 found from the Fe II 1608 line. We note that Si is more abundant than Fe by 1.3 dex. However, given the large uncertainty on the Ni abundance, we cannot draw definitive conclusions about the Si/Ni relative abundance. Our findings suggest that the ISM in J0332 is -enhanced, and therefore characterized by a rapid star formation. In J0332, the iron peak elements such as Fe and Ni, which are produced on longer timescales ( 1 Gyr) by supernova Type Ia events, have not had time to dilute the -elements (such as Si) produced on shorter timescales ( Myr) by supernova type II explosions. However, we remind that Iron is strongly affected by dust depletion as well, which can be another reason for it to be weak.
Our results may be affected by the neglect of potential ionization corrections and dust depletions, which we do not have sufficient data here to estimate quantitatively. However, according to Hernandez et al. (2020), the ionization correction for Si II has a positive value ( ICF Si II ) for a hydrogen column density (which is the hydrogen column density found for J0332 by Cabanac et al. 2008), indicating that our offset of Si with respect to Ni might be due to the ionization correction fraction.

| Ion | ||||||
|---|---|---|---|---|---|---|
| C ii | 1334.53 | 0.129 | 1.4 | 0.3 | 15.04 | 0.03 |
| O i | 1302.17 | 0.048 | 1.1 | 0.2 | 15.395 | 0.002 |
| Al ii | 1670.78 | 1.74 | 0.8 | 0.2 | 13.43 | 0.02 |
| Al iii | 1854.72 | 0.561 | 0.4 | 0.1 | 13.50 | 0.02 |
| Si ii | 1260.42 | 1.20 | 1.3 | 0.2 | 14.10 | 0.02 |
| Si ii | 1304.37 | 0.091 | 0.3 | 0.1 | 14.73 | 0.09 |
| Si ii | 1526.72 | 0.144 | 1.2 | 0.4 | 14.81 | 0.05 |
| Si ii | 1808.00 | 0.00245 | 0.8 | 0.1 | 16.27 | |
| Si iv | 1393.76 | 0.513 | 0.99 | 14.3 | 0.04 | |
| Si iv | 1402.77 | 0.254 | 1.19 | 14.6 | 0.04 | |
| Ni ii | 1370.13 | 0.0811 | 0.3 | 14.58 | 0.02 | |
| Ni ii | 1741.55 | 0.0488 | 0.4 | 14.58 |
-
a
Rest wavelengths and -values from Cashman et al. (2017).
-
b
Saturated line.
-
c
We cannot tell its level of saturation because it is the only transition of Al2+ that we detect.
| Ion | Rest () | Flux (observed) | F (observed) | Flux (dust corrected) | F (dust corrected) |
|---|---|---|---|---|---|
| He ii | 1640.42 | 5.9 | 0.3 | 15.3 | 0.9 |
| O iii] | 1660.81 | 4.5 | 1.0 | 11.8 | 2.3 |
| O iii] | 1666.15 | 8.5 | 1.5 | 21.7 | 4.0 |
| N iii | 1751.91 | 6.3 | 1.3 | 16.1 | 3.3 |
| Si ii | 1883.00 | 3.6 | 1.0 | 9.5 | 2.3 |
| [C iii] | 1906.68 | 15.2 | 1.4 | 40.5 | 3.8 |
| C iii] | 1908.73 | 11.9 | 1.2 | 31.7 | 3.1 |
| [O ii] | 3726.03 | 29.2 | 3.2 | 51.8 | 5.7 |
| [O ii] | 3728.81 | 48.0 | 4.1 | 85.1 | 7.3 |
| H | 4340.47 | 31.1 | 3.8 | 51.3 | 6.3 |
| H | 4861.33 | 69.6 | 7.0 | 107.4 | 11.0 |
| [O iii] | 4958.91 | 225.5 | 18.1 | 343.9 | 27.7 |
| [O iii] | 5006.84 | 749.7 | 54.4 | 1137.3 | 82.6 |
6 Properties of the stellar populations
In the following sections we use the UV spectrum of J0332 to derive the stellar metallicity of its stellar populations.
6.1 Stellar metallicity
The stellar metallicity of a galaxy () is an indicator of the abundance of metals (mostly iron) in the photospheres of stars. is usually derived from the stellar continuum and absorption lines and therefore is an average of all the stellar populations contributing to the integrated light of the galaxy in the portion of the spectrum considered. Therefore, the UV based stellar metallicities we derive reflect the iron abundance in the photospheres of young, massive, O- and B-type stars (optical/IR based stellar metallicities are instead related to the metal content of older stars).
We fit the observed UV spectrum with Binary Population and Spectral Synthesis (BPASS) models v2.0 (Eldridge & Stanway 2016), which include massive binary stars. This older version of the BPASS models was adopted since it includes synthetic spectra with a continuous star formation history, which is a better representation of the SFH of high redshift star forming galaxies compared to single burst models. We adopt a 100 Myr old continuous star formation history and stellar metallicities in the range . We assume a Salpeter IMF (Salpeter 1955) with an upper mass cut-off of 100 . The 100 Myr old star formation history (SFH) was chosen to ensure that the synthetic UV spectra are stable against the fast evolution of very massive stars, which occurs on timescales shorter than 30 Myr.
We compare the synthetic spectra and the data through a minimization. Before this step, we match the velocity dispersion, , of the models with that of the stars in J0332. Specifically, we measured by fitting the [O III] 5007 line in the available XSHOOTER spectrum with a Gaussian profile and obtain a value (corrected for instrumental resolution). We attribute this small value of to the fact that the nebular emission might be dominated only by one clump of star formation (as we see for the C III] 1906,9 emission in Sect. 10), while the stellar mass measurements use all the light.
Since the BPASS models are designed to reproduce only the stellar components of a galaxy spectrum, we mask out the interstellar and nebular features from the data before carrying out the spectral fit. We define the as:
| (2) |
where is the observed spectrum, is the model considered for the fit and is the error on the observed spectrum. From 500 re-simulations of the J0332 spectrum, we find that only the two lowest metallicity models ( and ) are chosen as best fit models, therefore we conclude that the stellar metallicity of J0332 is in the range , which corresponds to (assuming the BPASS solar metallicity ). We assume the value for the analysis in the paper.
6.2 The stellar mass-stellar metallicity relation
In the local universe, a tight relation between stellar mass and has been established, mostly exploiting the vast spectral database provided by the Sloan Digital Sky Survey (SDSS; York et al. 2000). According to this relation, less massive galaxies are characterized by lower stellar metallicities than more massive ones. The existence of this relation reflects the complex interplay between inflows, outflows and enrichment rate (e.g., Cullen et al. 2019).
While in the local Universe ground-based facilities provide high quality spectra from which the stellar metallicities can be easily derived, performing this type of study at high redshift is hampered by the low spectral S/N of distant sources. For this reason, the majority of high redshift stellar metallicity measurements have so far been inconclusive. Recently, Steidel et al. (2016), Cullen et al. (2019), Theios et al. (2019), Topping et al. (2020a), Calabrò et al. (2020), Cullen et al. (2021) and Kashino et al. (2022) performed high- stellar metallicity analyses on composite spectra. Cullen et al. (2021) found that the metallicities increase from to across the stellar mass range in the redshift range . Moreover, they observed a decrease of by dex at this redshift relative to local galaxies of similar mass. Our result is one of the few which is obtained from an individual spectrum at .
Figure 8 shows the stellar mass- plane for J0332 and literature galaxies at different redshifts. In particular, we compare J0332 to the local samples analyzed by Kirby et al. (2013) and Zahid et al. (2017) and to the the mass stacks of VANDELS galaxies at by Cullen et al. (2019). The stellar metallicity of J0332 is compatible, within the uncertainties, with the results by Cullen et al. 2019. These authors also created stacks in bin of mass and redshift. Our metallicity estimate is in agreement with their stacks in the range and . This result supports the hypothesis that the stellar mass-stellar metallicity relation does not strongly evolve over the redshift range .
Compared to the nearby samples by Kirby et al. (2013) and Zahid et al. (2017), we find that the stellar metallicity of J0332 is dex lower than that of local galaxies of similar mass and the difference is compatible with that found by Cullen et al. (2019). An important consideration to make is that the high-redshift metallicities derived from UV spectra and the local stellar metallicities usually derived from optical lines do not necessarily trace the same stellar populations. In fact, the optical are related to more evolved stars than ultraviolet . Therefore, following Cullen et al. (2019), we compare J0332 to the HST Faint Object Spectrograph (FOS) and the Goddard High Resolution Spectrograph (GHRS) samples (Leitherer et al. 2011). In particular, we consider the three galaxies He2-10a, He2-10b, and NGC4670. These galaxies have stellar masses (as measured by Cullen et al. (2019) from their ) similar to J0332 and a high S/N per resolution element of 14, 6, and 12, respectively. Fitting the UV spectra of He2-10a, He2-10b, and NGC4670 using the same procedure described in Section 6.1, we derive that their metallicity is . We observe that J0332 lies 1.4 dex below the local metallicity values.
The evolution of the stellar mass-stellar metallicity relation with redshift can be explained in terms of the gas consumption timescale (which describes how efficiently gas is transformed into stars) and the mass loading factor (which describes the efficiency of the outflows). In particular, Cullen et al. (2019) found that a high loading factor, more than a long depletion timescale, can explain the low stellar metallicities of VANDELS galaxies at . The stellar metallicity of J0332 is compatible with this scenario.
7 Properties of the H II regions
We now move our analysis to the properties of the ionized gas in J0332 and the scaling relations characterizing it.
7.1 Dust extinction correction
The results shown in the next sections rely on the use of optical and UV emission lines. Since UV lines are particularly affected by dust extinction, it is important to correct the observed emission lines for dust extinction.
First, we correct our emission lines for Galactic extinction. We assume a Cardelli et al. (1989) extinction curve and use the E(B-V) produced by the Bayestar 3D dust map (Green et al. 2018) which, at the coordinates of J0332, produces a E(B-V) = 0.024. After applying this correction, we correct the emission line fluxes for the dust within J0332. Since the line is not captured by the XSHOOTER spectrum, we cannot use the Balmer decrement to estimate the dust extinction in J0332. We instead use the ratio . Adopting the PyNeb v1.1.15 (Luridiana et al. 2015) get_emissivity task and the values of electron temperature in the low ionization zone and (see Section 7.2), we derive an intrinsic (our observed value is ). Adopting the PyNeb RedCorr task and assuming a Cardelli et al. (1989) extinction curve, we derive a color excess 555Note that the large uncertainty is probably due to the relatively small wavelength range between and . This value is in agreement with that obtained from the SED fitting (see Section 4). Based on the large equivalent widths of the emission lines, we assume no underlying absorption in H and H. Moreover, the Galactic absorption is also very small. Note that, because of the gap between the two gratings (see Sect. 2.2.1), we are not able to provide a measurement of the He II emission line. Therefore, we adopt the He II flux derived by Cabanac et al. (2008) and rescale it according to the ratio between theirs and our O III] 1666 emission.
7.2 Electron temperature, density and star formation rate
We adopt the 1.1.15 version of PyNeb and the get_temden task to derive the electron temperature of the high ionization region from the O III] 1666 and [O III] 5007 lines. We obtain . As a second step, we assume the relationships by Stasińska (1982) to derive the electron temperature in the low ionization region, finding a value . We derive the electron density of the high ionization region using the ratio, obtaining .
The SFR is derived from the dust and magnification-corrected line using the Theios et al. (2019) SFR - L(H) relation (their Eq. 6), adopting L(H) = 2.8 L(H). This relation assumes t = , and and IMF with a high mass cutoff . We find that J0332 has a . This corresponds to a sSFR of (log(sSFR) = ). This value is compatible with the expected sSFR at (Khusanova et al. 2020; Lehnert et al. 2015).
7.3 Ionization parameter
Optical and UV lines can be used to infer the ionization state of a galaxy, which informs us about the excitation level of the H II regions. The ionization state is usually parameterized by means of the ionization parameter (), where is the emission of ionizing photons and is the size of the H II region. In the optical regime, a variety of diagnostics have been defined to derive . For J0332, we derive log(U) by adopting the [O III]/[O II] ratio and the photoionization models fit coefficients derived by Berg et al. (2019). We find a high value of (U) . This result suggests the presence of a hard ionizing spectrum in J0332, which is compatible with its young age and low stellar metallicity derived in the previous sections (See Sections 4 and 6.1).
7.4 Direct-metallicity estimate
The metallicity of the ionized gas in a galaxy is usually parameterized through the abundance of oxygen, which is the third most abundant element after hydrogen and helium. The most robust method to derive the gas-phase metallicity is through the “direct method”, which adopts the flux ratio of auroral to strong lines as a proxy of the gas electron temperature. In turn, since metals are the primary coolants in H II regions, is strictly linked to the gas metallicity, with hotter electron temperatures corresponding to lower metallicities.
In J0332, we detect the auroral line with and we are therefore able to apply the direct method. In particular, we use the ratio between O III] 1666 and [O III] 5007 to determine the electron temperature (see Section 7.2), and then the strengths of [O II] 3727 and [O III] 5007 to obtain the O+/H+ and O2+/H+ ionic abundances, respectively. We adopt the ionization corrections derived by Berg et al. (2019) to account for contributions of ions in different ionization states, in particular O3+. This contribution is usually considered to be negligible since O3+ has a high ionization energy of 54.9 eV. However, the presence of the high ionization He II line in the spectrum of J0332 (as seen by Cabanac et al. 2008) suggests that this correction must be taken into account. The atomic data by Aggarwal & Keenan (1999) were used to define the radiative and collisional transition probabilities. From the direct method, we derive a gas-phase metallicity .
7.5 Strong line estimate
Since auroral lines are difficult to observe with a sufficient S/N especially at high metallicities, an alternative way to derive consists in using calibrated strong optical line ratios such as the (O32) and the ratio. The calibrations can be empirical (i.e., based on direct metallicity measurements - e.g., Pettini & Pagel 2004; Marino et al. 2013; Pilyugin & Grebel 2016), theoretical (i.e., based on photoionization models - e.g., Kobulnicky & Kewley 2004; Tremonti et al. 2004; Dopita et al. 2013, 2016), or a combination of the two.
Unfortunately, the calibrations are usually not perfect and the metallicities estimated through different calibrations present large discrepancies, even for the same sample of objects, with variations up to 0.6 dex (Kewley & Ellison 2008; Moustakas et al. 2010). This is, in part, due to the fact that strong emission lines are hardly pure metallicity indicators, being often also probes of the ionization parameter. At high redshift, a further element of uncertainty of the calibrations is represented by the fact that the physical conditions which produce the strong emission lines in a galaxy change over cosmic time, therefore it is not certain that calibrations used in the local universe are valid also at high . The best way to address this issue is to derive the calibrations directly from high redshift sources. However, due to the difficulty of detecting the auroral lines in distant galaxies, the observations are often performed on high- local analogs, whose physical properties are expected to be close to those of high- sources (Bian et al. 2018, Jiang et al. 2019).
Here we derive the gas metallicity of J0332 using the O32 ratio and the empirical calibrations by Maiolino et al. (2008), Curti et al. (2017), and Bian et al. (2018). We do not adopt the R23 index since our value of metallicity is around the transition region between the low and high metallicity branches of the R23 calibration (e.g., Nagao et al. 2006), which makes it not very sensitive to metallicity in this range. Moreover, we our wavelength range does not include either the H or the [N II] 6584 lines. By comparing the strong line and direct gas metallicities, we derive dex, dex and dex. These results indicate that different calibrations can produce very different values of the gas metallicity and confirm that the physical conditions of galaxies at earlier epochs might be different and that the calibrations used at lower redshift might not hold when higher redshifts are involved.
7.6 Stellar mass-gas metallicity relation
The stellar mass– relation () is one of the most important scaling relations observed in the local and high-redshift Universe, and shows the existence of a trend between galaxy stellar mass and gas-phase metallicity, with increasing for increasing stellar mass. In the local Universe, the correlation between stellar mass and oxygen abundance has been defined with a scatter of only 0.1 dex in log(O/H) (e.g., Tremonti et al. 2004) and extends for over five orders of magnitude in stellar mass, from (Lee et al. 2006; Berg et al. 2012). The stellar mass- relation has been observed out to and evolves such that O/H decreases with increasing redshift at fixed stellar mass (Mannucci et al. 2010; Steidel et al. 2014; Troncoso et al. 2014; Sanders et al. 2015, 2020; Hunt et al. 2016; Onodera et al. 2016; Suzuki et al. 2017). Recently, JWST data showed a small evolution of the mass- relation at more extreme redshifts (Langeroodi et al. 2022, Nakajima et al. 2023).
Up to , literature studies agree in finding a slow evolution of the , with O/H dex lower than at at a fixed stellar mass (e.g., Erb et al. 2006; Steidel et al. 2014; Sanders et al. 2015).
However, a general consensus on the evolution rate of the at is yet to be reached. Some authors find a rapid decrease of the gas metallicity above these redshifts, with a drop dex between and , and a drop of dex between and (Maiolino et al. 2008; Mannucci et al. 2010; Troncoso et al. 2014; Onodera et al. 2016). On the contrary, other studies show very little evolution between and and a general shallower decrease of log(O/H) over the whole redshift range (e.g., Suzuki et al. 2017, Sanders et al. 2021).
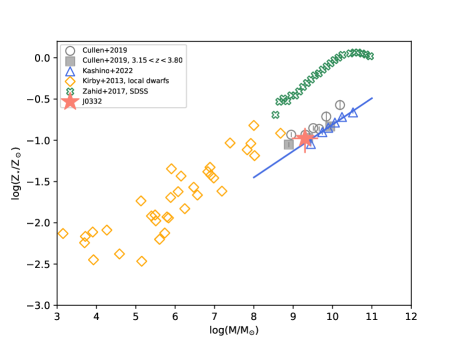
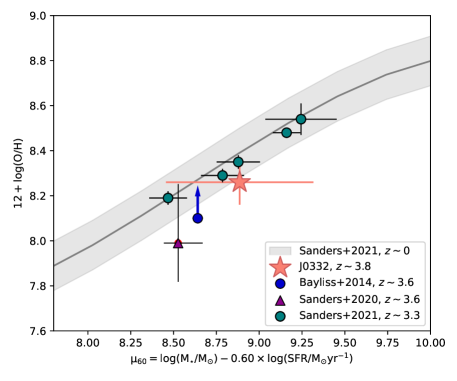
Figure 9 shows J0332 within the plane. We compare J0332 with the local relation by Curti et al. (2020), which is based on strong-line diagnostics calibrated on -based measurements. The plot also illustrates the results from Sanders et al. (2021). These authors stacked a subsample of 150 galaxies at from the MOSDEF survey in mass bins. They calibrated their strong-line metallicity measurements with direct ones employing the local analogue-based calibrations by Bian et al. (2018). We also show the direct metallicity estimate obtained for SGAS J105039.6+001730, a gravitationally lensed galaxy at (Bayliss et al. 2014), and that for COSMOS-23895, a gravitationally lensed galaxy at (Sanders et al. 2020).
We find that J0332 lies 0.3 dex below the Curti et al. (2020) local relation. Moreover, it is compatible, within the uncertainties, with the results by Bayliss et al. (2014), Sanders et al. (2020) and Sanders et al. (2021).
The decrease of with redshift can be traced back to the interplay between three main factors: (i) the fraction of gas , which is indicative of how diluted the metals are, (ii) the star formation efficiency - i.e., how much of the gas (and metals) is turned into stars and consequently returned to the ISM and (iii) the outflow metal loading factor - i.e., the amount of metals ejected in outflow events.
The gas fraction has been observed to strongly evolve with redshift as (e.g., Tacconi et al. 2013, 2018; Scoville et al. 2017; Liu et al. 2019).
The star formation efficiency has been observed to increase with redshift as well, but the rate of its evolution is less clear. From an observational point of view, some authors find that strongly evolves with redshift as (e.g., Tacconi et al. 2013, 2018; Scoville et al. 2017; Liu et al. 2019); while others derive a shallower evolution (e.g., Genzel et al. 2017) or no evolution at all (e.g., Onodera et al. 2016). From a theoretical point of view, cosmological models tend to disfavor a weakly evolving , since such an evolution seems to underpredict the observed metallicities at (Mannucci et al. 2010, Sanders et al. 2018, Curti et al. 2020). From the direct method, we infer a for J0332 which is only 0.3 dex lower than that of local galaxies at similar masses. This shallow redshift evolution is consistent with a strong evolution of , which compensates for the higher gas fraction at high redshifts.
The location of J0332 within the stellar mass-gas metallicity plane is also compatible with the scenario recently presented by Sanders et al. (2021), where the redshift evolution of is attributed to an increase of both the gas fraction and the outflow efficiency. It is important to point out that the models from Sanders et al. (2021) assume that gas inflows are negligible. If inflows are included, the redshift evolution of the mass-metallicity relation can be explained without increasing the outflow loading factor (the inflow scenario was first suggested by Davé et al. 2011). However, it is worth noting that observations can only be reproduced by an increase of 666 is the metallicity of the inflowing gas and is the metallicity of the surrounding ISM. from to from to (assuming gas is pristine at ). The is higher than observed in HI clouds around the Milky Way ( - Sancisi et al. 2008).

7.7 Fundamental metallicity relation
In addition to the scaling relation between stellar mass and gas metallicity, a secondary dependence of the on star-formation rate (SFR) has been observed at (Fundametal mass metallicity relation - FMR, Lara-López et al. 2010, Mannucci et al. 2010, Andrews & Martini 2013, Henry et al. 2021). This secondary dependence suggests that, at a fixed stellar mass, galaxies with higher SFRs are characterized by lower O/H. The most common interpretation for the existence of the FMR is the inflow of pristine gas from the intergalactic medium, which increases the SFR while diluting the metallicity of the ISM. Even though these observations are supported by both semi-analytic models and numerical simulations (Yates et al. 2012; Torrey et al. 2018; De Lucia et al. 2020), some literature studies argue that the local has a stronger secondary dependence on the gas content rather than the SFR (Bothwell et al. 2013), and that the SFR-defined FMR is a projection of this more fundamental relation (e.g., Brown et al. 2018).
The evolution rate of the FMR with redshift has not been clearly defined yet. Mannucci et al. (2010) found that galaxies up to lie on the same FMR as local galaxies, and their result is supported by recent work based on larger samples and more uniform analyses of metallicity up to redshift 2.5 (Sanders et al. 2018; Cresci et al. 2019; Curti et al. 2020) and 3.3 (Sanders et al. 2021).
However, other authors find a significant evolution of the FMR over the redshift range : for example, Troncoso et al. (2014) analyzed a sample of 40 star-forming galaxies at from the AMAZE and LSD ESO programs and found that a significant fraction of these galaxies are located up to a factor of ten below the local FMR. Onodera et al. (2016) found that galaxies are a factor 5 more metal poor than the local FMR for galaxies at similar masses. The strong redshift evolution of the FMR could be a physical phenomenon. However, another possible explanation could be the different calibrations used to derive at different redshifts (see Sanders et al. 2021). In fact, theoretical calibrations based on photoionization models tend to yield metallicities that are dex higher than direct-method calibrations (e.g., Kewley & Ellison 2008).
Figure 10 shows the projection of the local FMR relation as O/H vs. taken from Sanders et al. (2021). These authors derived the SFR from Balmer lines ( or at higher redshift). They parametrize the FMR using the method described in Mannucci et al. (2010), i.e., defining:
| (3) |
where is the value that minimizes the scatter in at fixed .
Adopting the SFR derived from (SFR = 4.55 0.46 ), we find that the location of J0332 is compatible, within the uncertainties, with the local FMR and also with SGAS J105039.6+001730 (Bayliss et al. 2014) and COSMOS-23895 (Sanders et al. 2020). This result suggests a redshift invariant FMR up to . According to the standard intepretation of the FMR relation, the invariance suggests that galaxies with same stellar mass and SFR have similar fractions of pristine gas. However, according to Sanders et al. (2021), the invariance of the FMR indicates that galaxies with same mass and SFR have both similar gas fractions and similar outflow metal loading factors.
8 Gas-phase vs. stellar metallicity
| stellar | gas phase (direct) |
|
|
|
||||||
|---|---|---|---|---|---|---|---|---|---|---|
| 7.52-7.83 |
-
a
These two values correspond to 5 and 10 of the solar metallicity assumed by the BPASS models (which corresponds to 12+log(O/H)=8.83).
-
b
O32 = [O III] 4959,5007/[O II] 3727,9
-
c
O32 = [O II] 3727,9/[O III] 5007
In the previous sections we have derived the stellar and the gas-phase metallicity of J0332 using the UV full-spectrum fitting and the direct method, respectively (all the metallicities measured in this paper are summarized in Table 5). While the stellar metallicity is a measurement of the iron abundance in the photospheres of young, massive, O- and B-type stars in the galaxy, the direct traces the abundance of oxygen surrounding the same young stellar populations. We find that the two metallicities differ by a factor 3-4, with the gas metallicity being higher than the stellar one777We remind that the stellar metallicity is derived using BPASS models, which assume a solar metallicity (i.e., ). Discrepancies between ISM and stellar metallicities have been observed both in the local (González Delgado et al. 2014) and high redshift universe (Lian et al. 2017). However, it is worth reminding that some authors do not find such discrepancies (e.g., Kudritzki et al. 2014, 2015).
A possible way to explain the difference between the two is by invoking an overabundance of oxygen, which would result in a higher gas-phase metallicity. Such an overabundance can be traced by the oxygen or by other -elements (C, Ne, Mg, Si, and S) produced through the same alpha-capture process as the oxygen. Steidel et al. (2016) found evidence of oxygen enrichment, measuring in galaxies at . Cullen et al. (2019) found enhanced O/Fe ratios of the order of in star-forming galaxies at . Evidence of enhancement at has been found also by Topping et al. (2020a, b). Becker et al. (2012) also find enhanched O/Fe in Damped-Ly systems. Very recently, Cullen et al. (2021) analyzed the combined FUV + optical spectra of a sample of 33 star forming galaxies from the NIRVANDELS survey (VANDELS+MOSFIRE) at and found evidence for , with no clear dependence on the stellar mass.
Our findings in Section 5.3 and Figure 7 suggest that J0332 is alpha enhanced, with Si being more abundant than Fe and Ni. Therefore, we can safely establish that the discrepancy between stellar and gas metallicity is due to J0332 being oxygen-enriched.
| Property | value |
|---|---|
| redshift | |
| age [Myr] | |
| () | |
| () | |
| C ICF | |
| 12+log(O/H) | |
| log(C/O) | |
| SFR() [] |
9 The carbon-to-oxygen ratio
As explained in Section 8, a useful way to study the chemical enrichment and star formation history of a galaxy is by means of the relative abundances of elements produced by stars of different mass, since they trace different timescales for star formation.
Among these elements, carbon and oxygen are particularly relevant, not only because they are the most abundant elements after hydrogen and helium, but also because they are the primary coolants of the ISM. Carbon and oxygen are produced by different mechanisms and in stars with different stellar masses: oxygen is almost entirely produced by massive stars () and ejected into the interstellar medium via core-collapse supernovae explosions; carbon can instead be released into the ISM by both massive stars () through Type II supernovae explosions and by low-intermediate-mass stars () through the convective dredge-up of freshly-synthesized carbon during the asymptotic giant branch phase (AGB; see review by Nomoto et al. 2013).
The relative C/O abundance has been investigated for many years as a function of the gas metallicity both for stars in the Milky Way (e.g., Mattsson 2010) and for galaxies (e.g., Berg et al. 2016, 2019); however, the relative contribution of two carbon production/release channels (massive vs. low/intermediate mass stars) to the observed abundance has not been clearly defined yet (e.g., Chiappini et al. 2003, Mattsson 2010). At any given metallicity, the C/O observed in a galaxy is a snapshot of the carbon and oxygen produced and released into the ISM up to that point. The difficulty in distinguishing between the two paths derives from the fact that at low redshift galaxies are old enough to have produced carbon through both channels.
An increasing trend of C/O with 12+log(O/H) has been observed in the past decades (e.g., Chiappini et al. 2003, Mattsson 2010, Berg et al. 2019). Both production channels can explain this behaviour: (i) if carbon is mostly produced by intermediate mass stars and released into the ISM on longer timescales than oxygen, then the C/O might build up as O/H does or (ii) carbon might be mostly supplied by massive stars through metallicity-dependent stellar winds (e.g., Garnett et al. 1999; Henry et al. 2000b; Chiappini et al. 2003), therefore C/O increseas with O/H. Since the launch of James Webb Space Telescope (JWST), the opportunity to derive the individual contributions from massive and low-intermediate mass stars to the carbon production has become more concrete, thanks to the possibility of observing rest-UV spectra of galaxies at extremely high redshifts. In fact, at very early epochs, galaxies are too young to be carbon-enriched by low-intermediate mass stars, and the massive star contribution to carbon can be safely isolated. So far, these studies have been focused on gas metallicities (Arellano-Córdova et al. 2022, Jones et al. 2023). Our C/O measurement on J0332 is the highest redshift individual measurement obtained at .
In order to derive the C/O abundance in J0332, we first derive the ionic abundances from the [O II] 3727 line and from the [O III] 5007 line.
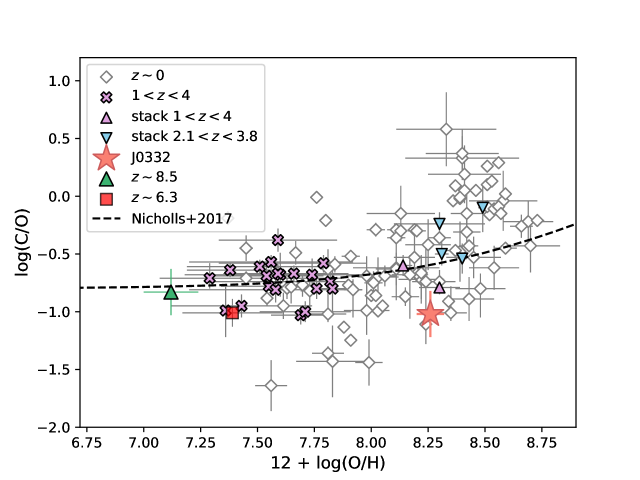
From the [C III] 1909 and [O III] , we derive . Applying the ICF correction fraction from Berg et al. (2019), we derive a low log(C/O)= . Figure 11 illustrates where J0332 lies within the C/O vs. O/H diagram with respect to galaxies at different redshifts. The low C/O ratio of J0332 might arise from the fact that J0332 is a young system (its age is Myrs - see Section 9) which has not yet developed a significant population of low-intermediate mass stars experiencing the AGB phase. This conclusion is supported by the chemical evolution models by Mattsson (2010), which predict a contribution to the carbon abundance from low-intermediate mass stars at ages 500 Myr. As described in Section 8, J0332 shows evidence of being oxygen-enriched, which might be another factor contributing to the low C/O. Even though studies at higher redshifts are needed to safely isolate massive star carbon production at , J0332 suggests that the C/O trend as a function of O/H might flatten out over the whole metallicity range as we go towards higher and higher redshifts, where carbon release originates from massive stars only.
The second interesting aspect of the log(C/O) vs. 12+log(O/H) diagram is its scatter at any given metallicity. A detailed study of the scatter has been performed by Berg et al. (2019). In particular, they modelled the C/O abundance using the OPENDISK chemical evolution code (Henry et al. 2000a), which assumes a galaxy to be a single, well-mixed zone (see Tinsley 1980). The free parameters of their models are: the number of star formation episodes characterizing the galaxy star formation history, the duration of the bursts and the amount of oxygen which is re-injected into the ISM through supernovae Type II outflows. They find that galaxies with a low C/O might be characterized by longer burst duration (i.e., a larger yield of oxygen from supernova Type II), a smaller amount of oxygen expelled through outflows and a smaller number of SF episodes (i.e., lower star formation efficiency). Given its low C/O, J0332 might be characterized by similar properties. However, an independent study of its SFH would be needed in order to confirm this scenario.
10 Equivalent width of the [C III] 1906,9 emission line
J0332 shows an , which is weaker compared to that of other galaxies of similar redshift and gas metallicity (see Figure 12). The is related to many physical properties, such as the ionization parameter, the gas metallicity, the C/O ratio, the gas optical depth, the dust extinction, the age and the sSFR. In the following, we explore in more detail what factors can influence and explain which are the main drivers of the low in J0332.
The first factor which affects is the age of the stellar populations in a galaxy. Jaskot & Ravindranath (2016) found that peaks at very early ages (< 10 Myr) and decreases afterwards, stabilizing around 20 Myr (assuming a continuous star-formation history). This happens because, by this time, an equilibrium is reached between the birth and the death of the most massive stars and the increase of the 1909 continuum flux from the growing stellar populations is the only factor lowering the . From the SED fitting, we derive that the age of J0332 is Myr. We exclude that the age is the main driver of the low in J0332. In fact, according to the Jaskot & Ravindranath (2016) models for the stellar metallicity and ionization parameter of J0332, we would expect its to be higher than what we observe, i.e., .
A second factor related to the is the ionization parameter, since it influences the population of the excited levels of an atom or ion and therefore the production of a specific emission line. We exclude that the ionization parameter is what drives the low in J0332. In fact, the Jaskot & Ravindranath (2016) models for a continuous star formation history and with a metallicity () and ionization parameter () similar to J0332 predict a higher .
Jaskot & Ravindranath (2016) and Ravindranath et al. (2020) suggested that density-bounded, optically thin systems exhibit weaker for a given ionization parameter, since the absorption of C+ ionizing radiation is lower and this can decrease the amount of C2+. In Section 5.3, we observed that many of the transitions identified in the ISM of J0332 are saturated, and in turn that (at least some of) its ISM is optically thick. Therefore, the low observed in J0332 is not because J0332 is density-bounded.
A higher amount of dust might preferentially attenuate the ionizing continuum over the stellar continuum reducing the emission line fluxes (Charlot & Fall 2000; Shapley et al. 2003). Assuming that the line emission and the continuum are produced within the same location, J0332 is characterized by a low dust extinction (E(B-V)0.13 - see Section 7.1), therefore we exclude that dust extinction can be the reason behind the low .
The dependence of on the sSFR is more complicated. A high sSFR is indicative of a phase of rapid stellar mass growth over the last 100 Myr (i.e., the time-scale probed by the UV continuum luminosity) of the galaxy life-time. This rapid mass growth can provide a stronger and harder ionizing continuum, favoring the production of UV emission lines and increasing . However, not all the galaxies with a high sSFR show a high . For example, as pointed out in Rigby et al. (2015), the lensed galaxy RCS0327 at is characterized by a high sSFR but a low . Stark et al. (2014) and Rigby et al. (2015) suggested that a possible explanation for these puzzling observations is that the sSFR must be coupled with both a higher ionization parameter and a lower metallicity in order to boost the C III] 1906,9 emission.
We find that J0332 is characterized by a sSFR of , which is a common value at . Therefore, we do not expect the sSFR to be the main driver of the low .
Figure 12 illustrates the dependence of on the gas metallicity. As it is possible to see, increases (negative values are indicative of emission), peaks around and then decreases at larger metallicities. This trend is explained by the fact that, as the gas metallicity increases, the amount of carbon in the ISM increases and the C III] 1906,9 emission increases as a consequence. However, at higher metallicities, which act as coolants, the electron temperature decreases and therefore the probability of ionization of C+ ions. Therefore, the low observed in J0332 can be explained by its higher gas metallicity. Of course is also related to the relative C/O abundance. In this regard, we find that our estimate of is compatible with that predicted by the Jaskot & Ravindranath (2016) photoionization models for their lowest assumed C/O = 0.04 (note that they assume single bursts and not a continuous SFH.) Among all the galaxy physical properties which affect the , we conclude that the main driver for the low in J0332 is the higher gas phase metallicity and low carbon abundance relative to oxygen.

11 Physical properties along the arc
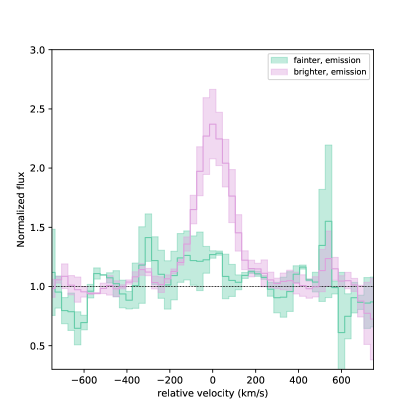
In the previous sections, we have inferred the physical properties of J0332 using its integrated spectrum and we have provided information about the average properties of J0332. In the following, we perform a UV spatially resolved analysis of J0332 by extracting the FORS2 spectrum in two different apertures. This analysis is motivated by the fact that the C III] 1906,9 lines do not cover the entire spatially resolved continuum.
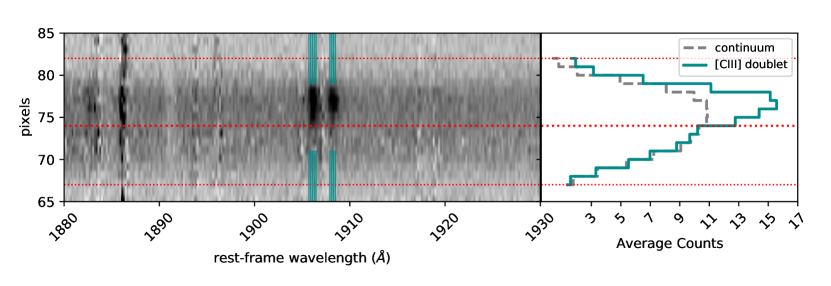
We first define several slices along the slit spatial direction in order to measure the average counts in the continuum as a function of position along the slit and the average spatial C III] 1906,9 emission counts (defining slices corresponding to the carbon emission - see Figure 13). We then move from the bottom to the top of the trace (this direction corresponds to the SW to the NE direction in Figure 2) and define two regions along the trace. We divide the two regions at the pixel where the carbon emission counts start separating from the continuum count spatial distribution (Figure 13). We refer to the upper portion of the spectral trace as the bright region, where the carbon emission is strong, and the lower portion as the faint region.
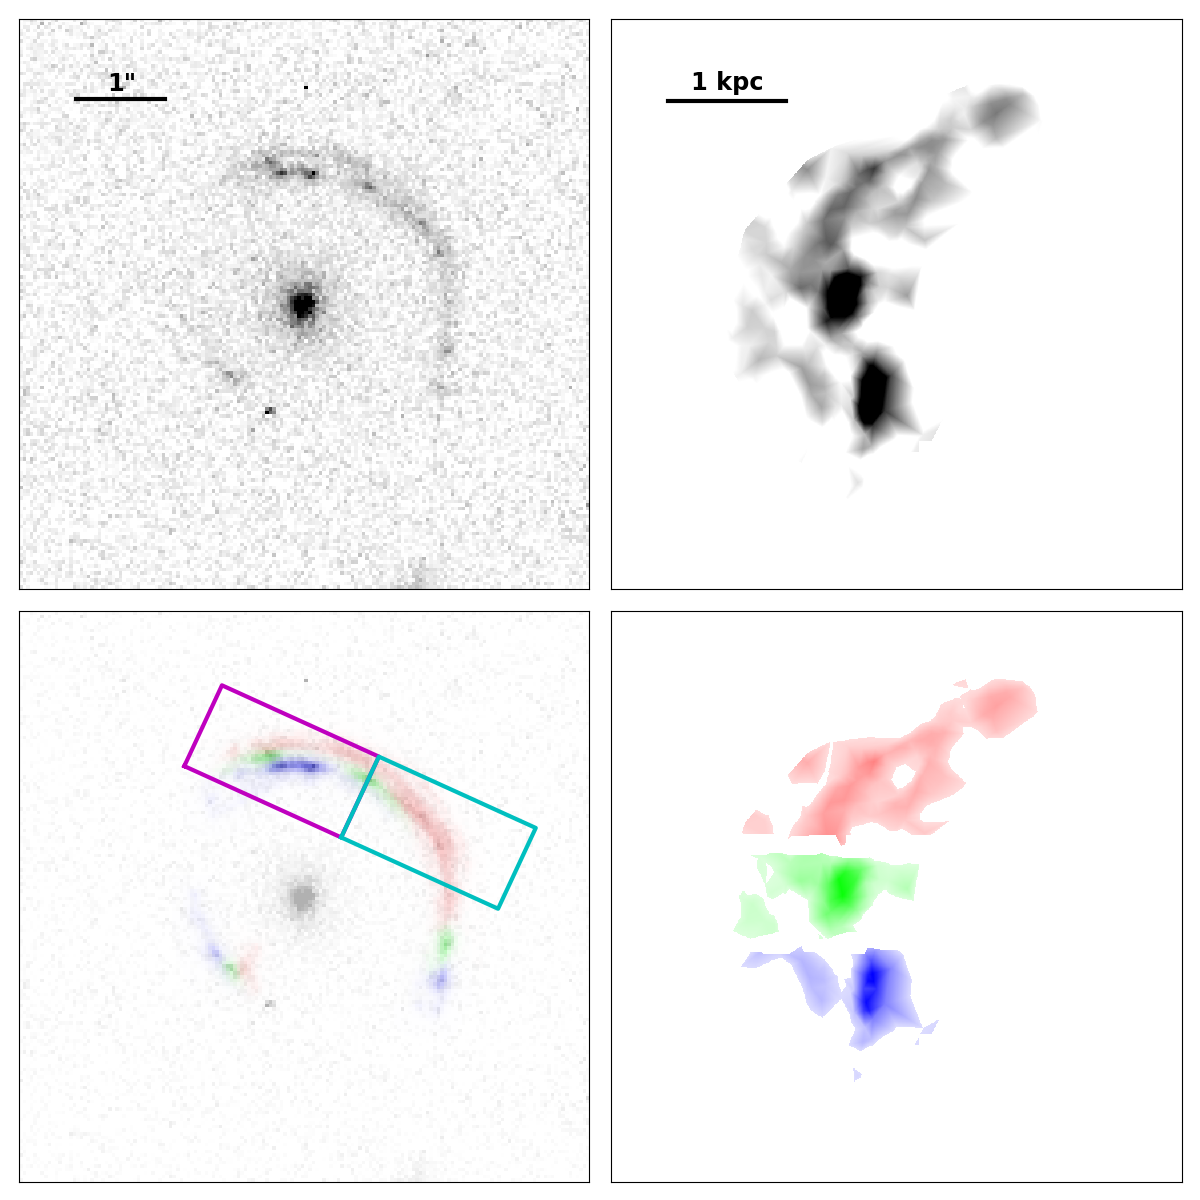
Figure 14 shows the portions of the arc captured by these two extractions and the corresponding regions in the source plane. We find that the aperture centered on the brighter half of the trace (magenta box) is dominated by the emission from the brighter and more compact regions in the source (blue and green knot in lower right panel of Figure 14), while the aperture centered on the lower and fainter half of the trace (cyan box) consists mostly of light from a diffuse region (red area in the lower left panel of Figure 14). However, we note that some level of blending is present between the two regions.
Cabanac et al. (2008) found that J0332 is characterized by an emission line superimposed to the damped Ly profile in absorption. This emission is shifted both spatially (0.5 arcsec with respect to the UV continuum) and in velocity space (by with respect to the centroid of the low ionization absorption lines). Cabanac et al. (2008) interpret this feature as probably due to an expanding outflow. Here we reconstruct in more detail where the Ly emission described in Cabanac et al. (2008) originates (as illustrated in Figure 15). In particular, we observe that the spatial offset of the Ly emission in the Cabanac et al. (2008) 2D spectrum is roughly equivalent to the distance between the blue color-coded knot and the diffuse region. Although we cannot exclude that a contribution from the bright knot to the Ly emission is present, it is reasonable to assume that the Ly emission is mostly coming from the diffuse region. This is compatible with many literature studies which find extended Ly emission in high redshift galaxies (e.g., Steidel et al. 2011, Leclercq et al. 2020).
Besides addressing the spatial origin of the Ly emission, we use the absorption lines visible in the two extracted spectra to compare the gas kinematics in the two regions, as shown in Figure 16. Note that, in order to increase the S/N of the final average profile, in this plot we do not differentiate between high and low ionization lines. We observe that the absorption profile of the bright region is characterized by a negative centroid velocity, which is indicative of the presence of an outflow. However, we are not able to draw conclusions about the faint region due to the large noise characterizing the velocity profile. Our current data do not allow us to conclude whether outflows are present in both regions, and therefore whether they are sourced globally (James et al. 2018). Higher S/N or spatially resolved JWST-NIRspec IFU observations of J0332 are needed to help disentangle between the two scenarios.
11.1 Spatially resolved [C III] 1906,9 equivalent width
We quantify the strength of the UV emission lines from the two extractions by measuring their equivalent widths (Table LABEL:tab:tableewregions).
We find that , while . The value obtained from the integrated spectrum (see Section 10) is slightly lower, probably due to the fact that more continuum emission is included in the integrated spectrum.
Our finding that the C III] 1906,9 emission mostly comes from a bright knot inside J0332 is compatible with that found by Micheva et al. (2020) at a much lower redshift in the galaxy Haro 11888In their analysis, Micheva et al. (2020) do not exclude that the C III] 1906,9 emission in the more diffuse region is not detected only because of the low S/N of their data. Similar gradients of the C III] 1906,9 emission have been found in other high redshift galaxies, such as the Cosmic Horseshoe (James et al. 2018) and indicate that the physical conditions in the two analyzed regions of J0332 might be different.
We use the measured in the two apertures and the Mingozzi et al. (2022) EW vs. 12 +log(O/H) relations999These relations are derived for local high- analogues drawn from the COS Legacy Archive Spectroscopic SurveY (CLASSY) (Berg et al. 2022) to derive the metallicity of the two regions. We find that and . For comparison, the derived metallicity of the integrated spectrum is . This is consistent, within the uncertainties, with the gas metallicity obtained through the direct method, which is also probably dominated by the bright region.
12 Summary and conclusions
In this paper we have analyzed the UV and optical spectra of J0332-3557 (J0332), a gravitationally lensed galaxy at redshift . Exploiting the wide wavelength range offered by the rest-frame UV FORS2 and the rest-frame optical XSHOOTER spectra, we are able to provide one of the most comprehensive metallicity analyses at such high redshift.
In particular, we focus on the stellar metallicity, derived from the UV stellar continuum; the ISM abundances from the UV absoroption lines; the gas-phase metallicity, derived through the direct method; and the relative chemical abundances of carbon and oxygen, derived from nebular emission lines. Our main results can be summarized as follow:
From the SED fitting of the HST F606W, F814W, F125W and F160W filters + ground based imaging, we derive a stellar mass , an age of Myr, and an . We derive a star formation rate of 21.6 M⊙ yr-1.
From the spectral fitting to the FORS2 UV specrtrum, we find that the stellar populations in J0332 are metal poor, with .
The kinematic analysis of the ISM absorption lines shows that J0332 is characterized by an outflow, with speeds up to . Our results are compatible with the scenario where the outflows are produced by the mechanical energy released by Type II supernovae explosions. We do not find evidences of inflows.
Thanks to the detection of the auroral O III] line, we are able to infer the ionized gas metallicity of J0332 with the direct method, obtaining .
Comparing the gas metallicity to the stellar metallicity, we find the first to be higher than the second by a factor 3-4. This discrepancy can be explained by J0332 having an enhanced O/Fe ratio.
The direct gas metallicity of J0332 is compatible with that of other galaxies at similar redshift and with similar masses, and it is dex lower than that of local galaxies at the same mass. This decrease in metallicity as a function of redshift is consistent with an increase of both the gas fraction and the outflow efficiency. The direct metallicity inferred for J0332 also supports the scenario of a redshift-invariant FMR on the redshift range .
From the UV carbon and oxygen lines, we derive log(C/O) . This value places J0332 on the lower envelope of the log(C/O) vs. 12+log(O/H) distribution at . The low C/O can be explained by the fact that J0332 is young enough to have mostly only massive stars contributing to the carbon abundance and by an oxygen-enriched ISM.
We perform a spatially resolved study of J0332. The spatial scales of this analysis are (based on the size of the compact knots in Figure 14). We find that = in the compacts knots visible in the source plane, while it is only = in the diffuse region. We conclude that the carbon emission mostly originates in the compact knots.
| Ion | |||||
|---|---|---|---|---|---|
| O iii] | 1666 | -0.48 | 0.13 | -1.11 | 0.08 |
| [C iii] | 1906 | -0.16 | 0.14 | -2.05 | 0.15 |
| C iii] | 1909 | -0.28 | 0.14 | -1.62 | 0.11 |
As a concluding note, we reiterate that J0332 is one of the highest redshift galaxies studied at and allows us to investigate the chemical enrichment history at these metallicities as early as Gyr after the Big bang. Another important consideration is that thanks to the James Webb Telescope (JWST), the UV spectral features used to perform our analysis on J0332 at are now accessible for galaxies at . Therefore, studies such as the one we performed on J0332 represent a bridge towards the exploration of the chemical composition of galaxies back to when the universe was only a few hundred million years old.
References
- Aggarwal & Keenan (1999) Aggarwal, K. M., & Keenan, F. P. 1999, The Astrophysical Journal Supplement Series, 123, 311, doi: 10.1086/313232
- Aloisi et al. (2001) Aloisi, A., Tosi, M., & Greggio, L. 2001, Ap&SS, 276, 421, doi: 10.1023/A:1017595115910
- Aloisi et al. (2007) Aloisi, A., Clementini, G., Tosi, M., et al. 2007, ApJ, 667, L151, doi: 10.1086/522368
- Amorín et al. (2017) Amorín, R., Fontana, A., Pérez-Montero, E., et al. 2017, Nature Astronomy, 1, 0052, doi: 10.1038/s41550-017-0052
- Andrews & Martini (2013) Andrews, B. H., & Martini, P. 2013, ApJ, 765, 140, doi: 10.1088/0004-637X/765/2/140
- Arellano-Córdova et al. (2022) Arellano-Córdova, K. Z., Berg, D. A., Chisholm, J., et al. 2022, ApJ, 940, L23, doi: 10.3847/2041-8213/ac9ab2
- Asplund et al. (2021) Asplund, M., Amarsi, A. M., & Grevesse, N. 2021, A&A, 653, A141, doi: 10.1051/0004-6361/202140445
- Bayliss et al. (2014) Bayliss, M. B., Rigby, J. R., Sharon, K., et al. 2014, ApJ, 790, 144, doi: 10.1088/0004-637X/790/2/144
- Becker et al. (2012) Becker, G. D., Sargent, W. L. W., Rauch, M., & Carswell, R. F. 2012, ApJ, 744, 91, doi: 10.1088/0004-637X/744/2/91
- Berg et al. (2018) Berg, D. A., Erb, D. K., Auger, M. W., Pettini, M., & Brammer, G. B. 2018, ApJ, 859, 164, doi: 10.3847/1538-4357/aab7fa
- Berg et al. (2019) Berg, D. A., Erb, D. K., Henry, R. B. C., Skillman, E. D., & McQuinn, K. B. W. 2019, ApJ, 874, 93, doi: 10.3847/1538-4357/ab020a
- Berg et al. (2016) Berg, D. A., Skillman, E. D., Henry, R. B. C., Erb, D. K., & Carigi, L. 2016, ApJ, 827, 126, doi: 10.3847/0004-637X/827/2/126
- Berg et al. (2012) Berg, D. A., Skillman, E. D., Marble, A. R., et al. 2012, ApJ, 754, 98, doi: 10.1088/0004-637X/754/2/98
- Berg et al. (2022) Berg, D. A., James, B. L., King, T., et al. 2022, ApJS, 261, 31, doi: 10.3847/1538-4365/ac6c03
- Bian et al. (2018) Bian, F., Kewley, L. J., & Dopita, M. A. 2018, ApJ, 859, 175, doi: 10.3847/1538-4357/aabd74
- Bothwell et al. (2013) Bothwell, M. S., Maiolino, R., Kennicutt, R., et al. 2013, MNRAS, 433, 1425, doi: 10.1093/mnras/stt817
- Brown et al. (2018) Brown, T., Cortese, L., Catinella, B., & Kilborn, V. 2018, MNRAS, 473, 1868, doi: 10.1093/mnras/stx2452
- Cabanac et al. (2005) Cabanac, R. A., Valls-Gabaud, D., Jaunsen, A. O., Lidman, C., & Jerjen, H. 2005, A&A, 436, L21, doi: 10.1051/0004-6361:200500115
- Cabanac et al. (2008) Cabanac, R. A., Valls-Gabaud, D., & Lidman, C. 2008, MNRAS, 386, 2065, doi: 10.1111/j.1365-2966.2008.13157.x
- Calabrò et al. (2020) Calabrò, A., Castellano, M., Pentericci, L., et al. 2020, arXiv e-prints, arXiv:2011.06615. https://arxiv.org/abs/2011.06615
- Calabrò et al. (2021) —. 2021, A&A, 646, A39, doi: 10.1051/0004-6361/202039244
- Cardelli et al. (1989) Cardelli, J. A., Clayton, G. C., & Mathis, J. S. 1989, ApJ, 345, 245, doi: 10.1086/167900
- Cashman et al. (2017) Cashman, F. H., Kulkarni, V. P., Kisielius, R., Ferland, G. J., & Bogdanovich, P. 2017, ApJS, 230, 8, doi: 10.3847/1538-4365/aa6d84
- Chabrier (2003) Chabrier, G. 2003, PASP, 115, 763, doi: 10.1086/376392
- Charlot & Fall (2000) Charlot, S., & Fall, S. M. 2000, ApJ, 539, 718, doi: 10.1086/309250
- Chiappini et al. (2003) Chiappini, C., Romano, D., & Matteucci, F. 2003, MNRAS, 339, 63, doi: 10.1046/j.1365-8711.2003.06154.x
- Chisholm et al. (2016) Chisholm, J., Tremonti, C. A., Leitherer, C., Chen, Y., & Wofford, A. 2016, MNRAS, 457, 3133, doi: 10.1093/mnras/stw178
- Christensen et al. (2012a) Christensen, L., Laursen, P., Richard, J., et al. 2012a, MNRAS, 427, 1973, doi: 10.1111/j.1365-2966.2012.22007.x
- Christensen et al. (2012b) Christensen, L., Richard, J., Hjorth, J., et al. 2012b, MNRAS, 427, 1953, doi: 10.1111/j.1365-2966.2012.22006.x
- Citro et al. (2021) Citro, A., Erb, D. K., Pettini, M., et al. 2021, ApJ, 922, 187, doi: 10.3847/1538-4357/ac24a2
- Conroy & Gunn (2010) Conroy, C., & Gunn, J. E. 2010, ApJ, 712, 833, doi: 10.1088/0004-637X/712/2/833
- Conroy et al. (2009) Conroy, C., Gunn, J. E., & White, M. 2009, ApJ, 699, 486, doi: 10.1088/0004-637X/699/1/486
- Cresci et al. (2019) Cresci, G., Mannucci, F., & Curti, M. 2019, A&A, 627, A42, doi: 10.1051/0004-6361/201834637
- Cullen et al. (2019) Cullen, F., McLure, R. J., Dunlop, J. S., et al. 2019, MNRAS, 487, 2038, doi: 10.1093/mnras/stz1402
- Cullen et al. (2021) Cullen, F., Shapley, A. E., McLure, R. J., et al. 2021, MNRAS, 505, 903, doi: 10.1093/mnras/stab1340
- Curti et al. (2017) Curti, M., Cresci, G., Mannucci, F., et al. 2017, MNRAS, 465, 1384, doi: 10.1093/mnras/stw2766
- Curti et al. (2020) Curti, M., Mannucci, F., Cresci, G., & Maiolino, R. 2020, MNRAS, 491, 944, doi: 10.1093/mnras/stz2910
- Davé et al. (2011) Davé, R., Oppenheimer, B. D., & Finlator, K. 2011, MNRAS, 415, 11, doi: 10.1111/j.1365-2966.2011.18680.x
- De Lucia et al. (2020) De Lucia, G., Xie, L., Fontanot, F., & Hirschmann, M. 2020, MNRAS, 498, 3215, doi: 10.1093/mnras/staa2556
- Dessauges-Zavadsky et al. (2010) Dessauges-Zavadsky, M., D’Odorico, S., Schaerer, D., et al. 2010, A&A, 510, A26, doi: 10.1051/0004-6361/200913337
- Dopita et al. (2016) Dopita, M. A., Kewley, L. J., Sutherland, R. S., & Nicholls, D. C. 2016, Ap&SS, 361, 61, doi: 10.1007/s10509-016-2657-8
- Dopita et al. (2013) Dopita, M. A., Sutherland, R. S., Nicholls, D. C., Kewley, L. J., & Vogt, F. P. A. 2013, ApJS, 208, 10, doi: 10.1088/0067-0049/208/1/10
- Eldridge & Stanway (2016) Eldridge, J. J., & Stanway, E. R. 2016, MNRAS, 462, 3302, doi: 10.1093/mnras/stw1772
- Eldridge et al. (2017) Eldridge, J. J., Stanway, E. R., Xiao, L., et al. 2017, PASA, 34, e058, doi: 10.1017/pasa.2017.51
- Erb et al. (2010) Erb, D. K., Pettini, M., Shapley, A. E., et al. 2010, ApJ, 719, 1168, doi: 10.1088/0004-637X/719/2/1168
- Erb et al. (2006) Erb, D. K., Steidel, C. C., Shapley, A. E., et al. 2006, ApJ, 647, 128, doi: 10.1086/505341
- Esteban et al. (2009) Esteban, C., Bresolin, F., Peimbert, M., et al. 2009, ApJ, 700, 654, doi: 10.1088/0004-637X/700/1/654
- Esteban et al. (2014) Esteban, C., García-Rojas, J., Carigi, L., et al. 2014, MNRAS, 443, 624, doi: 10.1093/mnras/stu1177
- Esteban et al. (2004) Esteban, C., Peimbert, M., García-Rojas, J., et al. 2004, MNRAS, 355, 229, doi: 10.1111/j.1365-2966.2004.08313.x
- Ferrara & Ricotti (2006) Ferrara, A., & Ricotti, M. 2006, MNRAS, 373, 571, doi: 10.1111/j.1365-2966.2006.10978.x
- García-Rojas & Esteban (2007) García-Rojas, J., & Esteban, C. 2007, ApJ, 670, 457, doi: 10.1086/521871
- García-Rojas et al. (2005) García-Rojas, J., Esteban, C., Peimbert, A., et al. 2005, MNRAS, 362, 301, doi: 10.1111/j.1365-2966.2005.09302.x
- García-Rojas et al. (2004) García-Rojas, J., Esteban, C., Peimbert, M., et al. 2004, ApJS, 153, 501, doi: 10.1086/421909
- Garnett et al. (1999) Garnett, D. R., Shields, G. A., Peimbert, M., et al. 1999, ApJ, 513, 168, doi: 10.1086/306860
- Gburek et al. (2019) Gburek, T., Siana, B., Alavi, A., et al. 2019, ApJ, 887, 168, doi: 10.3847/1538-4357/ab5713
- Genzel et al. (2017) Genzel, R., Förster Schreiber, N. M., Übler, H., et al. 2017, Nature, 543, 397, doi: 10.1038/nature21685
- González Delgado et al. (2014) González Delgado, R. M., Cid Fernandes, R., García-Benito, R., et al. 2014, ApJ, 791, L16, doi: 10.1088/2041-8205/791/1/L16
- Gordon et al. (2003) Gordon, K. D., Clayton, G. C., Misselt, K. A., Landolt, A. U., & Wolff, M. J. 2003, ApJ, 594, 279, doi: 10.1086/376774
- Green et al. (2018) Green, G. M., Schlafly, E. F., Finkbeiner, D., et al. 2018, MNRAS, 478, 651, doi: 10.1093/mnras/sty1008
- Henry et al. (2021) Henry, A., Rafelski, M., Sunnquist, B., et al. 2021, ApJ, 919, 143, doi: 10.3847/1538-4357/ac1105
- Henry et al. (2000a) Henry, R. B. C., Edmunds, M. G., & Köppen, J. 2000a, ApJ, 541, 660, doi: 10.1086/309471
- Henry et al. (2000b) Henry, R. B. C., Kwitter, K. B., & Bates, J. A. 2000b, ApJ, 531, 928, doi: 10.1086/308509
- Hernandez et al. (2020) Hernandez, S., Aloisi, A., James, B. L., et al. 2020, ApJ, 892, 19, doi: 10.3847/1538-4357/ab77c6
- Hunt et al. (2016) Hunt, L., Dayal, P., Magrini, L., & Ferrara, A. 2016, MNRAS, 463, 2002, doi: 10.1093/mnras/stw1993
- Iani et al. (2023) Iani, E., Zanella, A., Vernet, J., et al. 2023, MNRAS, 518, 5018, doi: 10.1093/mnras/stac3198
- James et al. (2018) James, B. L., Auger, M., Pettini, M., et al. 2018, MNRAS, 476, 1726, doi: 10.1093/mnras/sty315
- James et al. (2014) James, B. L., Pettini, M., Christensen, L., et al. 2014, MNRAS, 440, 1794, doi: 10.1093/mnras/stu287
- Jaskot & Ravindranath (2016) Jaskot, A. E., & Ravindranath, S. 2016, ApJ, 833, 136, doi: 10.3847/1538-4357/833/2/136
- Jiang et al. (2019) Jiang, T., Malhotra, S., Rhoads, J. E., & Yang, H. 2019, ApJ, 872, 145, doi: 10.3847/1538-4357/aaee8a
- Johnson et al. (2021) Johnson, B. D., Leja, J., Conroy, C., & Speagle, J. S. 2021, ApJS, 254, 22, doi: 10.3847/1538-4365/abef67
- Jones et al. (2023) Jones, T., Sanders, R., Chen, Y., et al. 2023, arXiv e-prints, arXiv:2301.07126, doi: 10.48550/arXiv.2301.07126
- Kashino et al. (2022) Kashino, D., Lilly, S. J., Renzini, A., et al. 2022, ApJ, 925, 82, doi: 10.3847/1538-4357/ac399e
- Kelson (2003) Kelson, D. D. 2003, PASP, 115, 688, doi: 10.1086/375502
- Kewley & Ellison (2008) Kewley, L. J., & Ellison, S. L. 2008, ApJ, 681, 1183, doi: 10.1086/587500
- Khusanova et al. (2020) Khusanova, Y., Le Fèvre, O., Cassata, P., et al. 2020, A&A, 634, A97, doi: 10.1051/0004-6361/201935400
- Kirby et al. (2013) Kirby, E. N., Cohen, J. G., Guhathakurta, P., et al. 2013, ApJ, 779, 102, doi: 10.1088/0004-637X/779/2/102
- Kobulnicky & Kewley (2004) Kobulnicky, H. A., & Kewley, L. J. 2004, ApJ, 617, 240, doi: 10.1086/425299
- Kudritzki et al. (2015) Kudritzki, R.-P., Ho, I. T., Schruba, A., et al. 2015, MNRAS, 450, 342, doi: 10.1093/mnras/stv522
- Kudritzki et al. (2014) Kudritzki, R.-P., Urbaneja, M. A., Bresolin, F., Hosek, Matthew W., J., & Przybilla, N. 2014, ApJ, 788, 56, doi: 10.1088/0004-637X/788/1/56
- Langeroodi et al. (2022) Langeroodi, D., Hjorth, J., Chen, W., et al. 2022, arXiv e-prints, arXiv:2212.02491, doi: 10.48550/arXiv.2212.02491
- Lara-López et al. (2010) Lara-López, M. A., Cepa, J., Bongiovanni, A., et al. 2010, A&A, 521, L53, doi: 10.1051/0004-6361/201014803
- Leclercq et al. (2020) Leclercq, F., Bacon, R., Verhamme, A., et al. 2020, A&A, 635, A82, doi: 10.1051/0004-6361/201937339
- Lee et al. (2006) Lee, H., Skillman, E. D., Cannon, J. M., et al. 2006, ApJ, 647, 970, doi: 10.1086/505573
- Lehnert et al. (2015) Lehnert, M. D., van Driel, W., Le Tiran, L., Di Matteo, P., & Haywood, M. 2015, A&A, 577, A112, doi: 10.1051/0004-6361/201322630
- Leitherer et al. (2011) Leitherer, C., Tremonti, C. A., Heckman, T. M., & Calzetti, D. 2011, AJ, 141, 37, doi: 10.1088/0004-6256/141/2/37
- Lian et al. (2017) Lian, J., Thomas, D., Goddard, D., & Marston, C. 2017, in Galaxy Evolution Across Time, 36, doi: 10.5281/zenodo.807550
- Liu et al. (2019) Liu, D., Schinnerer, E., Groves, B., et al. 2019, ApJ, 887, 235, doi: 10.3847/1538-4357/ab578d
- Llerena et al. (2022) Llerena, M., Amorín, R., Cullen, F., et al. 2022, A&A, 659, A16, doi: 10.1051/0004-6361/202141651
- López-Sánchez et al. (2007) López-Sánchez, Á. R., Esteban, C., García-Rojas, J., Peimbert, M., & Rodríguez, M. 2007, ApJ, 656, 168, doi: 10.1086/510112
- Luridiana et al. (2015) Luridiana, V., Morisset, C., & Shaw, R. A. 2015, A&A, 573, A42, doi: 10.1051/0004-6361/201323152
- Madau & Dickinson (2014) Madau, P., & Dickinson, M. 2014, ARA&A, 52, 415, doi: 10.1146/annurev-astro-081811-125615
- Mainali et al. (2020) Mainali, R., Stark, D. P., Tang, M., et al. 2020, MNRAS, 494, 719, doi: 10.1093/mnras/staa751
- Maiolino et al. (2008) Maiolino, R., Nagao, T., Grazian, A., et al. 2008, A&A, 488, 463, doi: 10.1051/0004-6361:200809678
- Mannucci et al. (2010) Mannucci, F., Cresci, G., Maiolino, R., Marconi, A., & Gnerucci, A. 2010, MNRAS, 408, 2115, doi: 10.1111/j.1365-2966.2010.17291.x
- Marino et al. (2013) Marino, R. A., Rosales-Ortega, F. F., Sánchez, S. F., et al. 2013, A&A, 559, A114, doi: 10.1051/0004-6361/201321956
- Marques-Chaves et al. (2020) Marques-Chaves, R., Pérez-Fournon, I., Shu, Y., et al. 2020, MNRAS, 492, 1257, doi: 10.1093/mnras/stz3500
- Martin (2005) Martin, C. L. 2005, ApJ, 621, 227, doi: 10.1086/427277
- Matthee et al. (2021) Matthee, J., Sobral, D., Hayes, M., et al. 2021, MNRAS, 505, 1382, doi: 10.1093/mnras/stab1304
- Mattsson (2010) Mattsson, L. 2010, A&A, 515, A68, doi: 10.1051/0004-6361/200913315
- Micheva et al. (2020) Micheva, G., Östlin, G., Melinder, J., et al. 2020, ApJ, 903, 123, doi: 10.3847/1538-4357/abbdff
- Mingozzi et al. (2022) Mingozzi, M., James, B. L., Arellano-Córdova, K. Z., et al. 2022, ApJ, 939, 110, doi: 10.3847/1538-4357/ac952c
- Moustakas et al. (2010) Moustakas, J., Kennicutt, Robert C., J., Tremonti, C. A., et al. 2010, ApJS, 190, 233, doi: 10.1088/0067-0049/190/2/233
- Murray et al. (2011) Murray, N., Ménard, B., & Thompson, T. A. 2011, ApJ, 735, 66, doi: 10.1088/0004-637X/735/1/66
- Nagao et al. (2006) Nagao, T., Maiolino, R., & Marconi, A. 2006, A&A, 459, 85, doi: 10.1051/0004-6361:20065216
- Nakajima et al. (2023) Nakajima, K., Ouchi, M., Isobe, Y., et al. 2023, arXiv e-prints, arXiv:2301.12825, doi: 10.48550/arXiv.2301.12825
- Nakajima et al. (2018) Nakajima, K., Schaerer, D., Le Fèvre, O., et al. 2018, A&A, 612, A94, doi: 10.1051/0004-6361/201731935
- Nicholls et al. (2017) Nicholls, D. C., Sutherland, R. S., Dopita, M. A., Kewley, L. J., & Groves, B. A. 2017, MNRAS, 466, 4403, doi: 10.1093/mnras/stw3235
- Nomoto et al. (2013) Nomoto, K., Kobayashi, C., & Tominaga, N. 2013, ARA&A, 51, 457, doi: 10.1146/annurev-astro-082812-140956
- Onodera et al. (2016) Onodera, M., Carollo, C. M., Lilly, S., et al. 2016, ApJ, 822, 42, doi: 10.3847/0004-637X/822/1/42
- Peña-Guerrero et al. (2017) Peña-Guerrero, M. A., Leitherer, C., de Mink, S., Wofford, A., & Kewley, L. 2017, ApJ, 847, 107, doi: 10.3847/1538-4357/aa88bf
- Peimbert et al. (2005) Peimbert, A., Peimbert, M., & Ruiz, M. T. 2005, ApJ, 634, 1056, doi: 10.1086/444557
- Pettini & Pagel (2004) Pettini, M., & Pagel, B. E. J. 2004, MNRAS, 348, L59, doi: 10.1111/j.1365-2966.2004.07591.x
- Pettini et al. (2002) Pettini, M., Rix, S. A., Steidel, C. C., et al. 2002, ApJ, 569, 742, doi: 10.1086/339355
- Pettini et al. (2001) Pettini, M., Shapley, A. E., Steidel, C. C., et al. 2001, ApJ, 554, 981, doi: 10.1086/321403
- Pilyugin & Grebel (2016) Pilyugin, L. S., & Grebel, E. K. 2016, MNRAS, 457, 3678, doi: 10.1093/mnras/stw238
- Planck Collaboration et al. (2020) Planck Collaboration, Aghanim, N., Akrami, Y., et al. 2020, A&A, 641, A6, doi: 10.1051/0004-6361/201833910
- Quider et al. (2010) Quider, A. M., Shapley, A. E., Pettini, M., Steidel, C. C., & Stark, D. P. 2010, MNRAS, 402, 1467, doi: 10.1111/j.1365-2966.2009.16005.x
- Ravindranath et al. (2020) Ravindranath, S., Monroe, T., Jaskot, A., Ferguson, H. C., & Tumlinson, J. 2020, ApJ, 896, 170, doi: 10.3847/1538-4357/ab91a5
- Reddy et al. (2008) Reddy, N. A., Steidel, C. C., Pettini, M., et al. 2008, ApJS, 175, 48, doi: 10.1086/521105
- Rigby et al. (2015) Rigby, J. R., Bayliss, M. B., Gladders, M. D., et al. 2015, ApJ, 814, L6, doi: 10.1088/2041-8205/814/1/L6
- Romano (2022) Romano, D. 2022, A&A Rev., 30, 7, doi: 10.1007/s00159-022-00144-z
- Salpeter (1955) Salpeter, E. E. 1955, ApJ, 121, 161, doi: 10.1086/145971
- Sancisi et al. (2008) Sancisi, R., Fraternali, F., Oosterloo, T., & van der Hulst, T. 2008, A&A Rev., 15, 189, doi: 10.1007/s00159-008-0010-0
- Sanders et al. (2015) Sanders, R. L., Shapley, A. E., Kriek, M., et al. 2015, ApJ, 799, 138, doi: 10.1088/0004-637X/799/2/138
- Sanders et al. (2018) —. 2018, ApJ, 858, 99, doi: 10.3847/1538-4357/aabcbd
- Sanders et al. (2020) Sanders, R. L., Shapley, A. E., Reddy, N. A., et al. 2020, MNRAS, 491, 1427, doi: 10.1093/mnras/stz3032
- Sanders et al. (2021) Sanders, R. L., Shapley, A. E., Jones, T., et al. 2021, ApJ, 914, 19, doi: 10.3847/1538-4357/abf4c1
- Savage & Sembach (1991) Savage, B. D., & Sembach, K. R. 1991, ApJ, 379, 245, doi: 10.1086/170498
- Schlegel et al. (1998) Schlegel, D. J., Finkbeiner, D. P., & Davis, M. 1998, ApJ, 500, 525, doi: 10.1086/305772
- Scoville et al. (2017) Scoville, N., Lee, N., Vanden Bout, P., et al. 2017, ApJ, 837, 150, doi: 10.3847/1538-4357/aa61a0
- Senchyna et al. (2021) Senchyna, P., Stark, D. P., Charlot, S., et al. 2021, MNRAS, 503, 6112, doi: 10.1093/mnras/stab884
- Senchyna et al. (2019) Senchyna, P., Stark, D. P., Chevallard, J., et al. 2019, MNRAS, 488, 3492, doi: 10.1093/mnras/stz1907
- Senchyna et al. (2017) Senchyna, P., Stark, D. P., Vidal-García, A., et al. 2017, MNRAS, 472, 2608, doi: 10.1093/mnras/stx2059
- Shapley et al. (2003) Shapley, A. E., Steidel, C. C., Pettini, M., & Adelberger, K. L. 2003, ApJ, 588, 65, doi: 10.1086/373922
- Shapley et al. (2015) Shapley, A. E., Reddy, N. A., Kriek, M., et al. 2015, ApJ, 801, 88, doi: 10.1088/0004-637X/801/2/88
- Sharma & Nath (2012) Sharma, M., & Nath, B. B. 2012, ApJ, 750, 55, doi: 10.1088/0004-637X/750/1/55
- Stark et al. (2014) Stark, D. P., Richard, J., Siana, B., et al. 2014, MNRAS, 445, 3200, doi: 10.1093/mnras/stu1618
- Stark et al. (2017) Stark, D. P., Ellis, R. S., Charlot, S., et al. 2017, MNRAS, 464, 469, doi: 10.1093/mnras/stw2233
- Stasińska (1982) Stasińska, G. 1982, A&AS, 48, 299
- Steidel et al. (1999) Steidel, C. C., Adelberger, K. L., Giavalisco, M., Dickinson, M., & Pettini, M. 1999, ApJ, 519, 1, doi: 10.1086/307363
- Steidel et al. (2011) Steidel, C. C., Bogosavljević, M., Shapley, A. E., et al. 2011, ApJ, 736, 160, doi: 10.1088/0004-637X/736/2/160
- Steidel et al. (2010) Steidel, C. C., Erb, D. K., Shapley, A. E., et al. 2010, ApJ, 717, 289, doi: 10.1088/0004-637X/717/1/289
- Steidel et al. (1996) Steidel, C. C., Giavalisco, M., Pettini, M., Dickinson, M., & Adelberger, K. L. 1996, ApJ, 462, L17, doi: 10.1086/310029
- Steidel et al. (2016) Steidel, C. C., Strom, A. L., Pettini, M., et al. 2016, ApJ, 826, 159, doi: 10.3847/0004-637X/826/2/159
- Steidel et al. (2014) Steidel, C. C., Rudie, G. C., Strom, A. L., et al. 2014, ApJ, 795, 165, doi: 10.1088/0004-637X/795/2/165
- Sugahara et al. (2017) Sugahara, Y., Ouchi, M., Lin, L., et al. 2017, ApJ, 850, 51, doi: 10.3847/1538-4357/aa956d
- Suzuki et al. (2017) Suzuki, T. L., Kodama, T., Onodera, M., et al. 2017, ApJ, 849, 39, doi: 10.3847/1538-4357/aa8df3
- Tacconi et al. (2013) Tacconi, L. J., Neri, R., Genzel, R., et al. 2013, ApJ, 768, 74, doi: 10.1088/0004-637X/768/1/74
- Tacconi et al. (2018) Tacconi, L. J., Genzel, R., Saintonge, A., et al. 2018, ApJ, 853, 179, doi: 10.3847/1538-4357/aaa4b4
- Theios et al. (2019) Theios, R. L., Steidel, C. C., Strom, A. L., et al. 2019, ApJ, 871, 128, doi: 10.3847/1538-4357/aaf386
- Tinsley (1980) Tinsley, B. M. 1980, Fund. Cosmic Phys., 5, 287, doi: 10.48550/arXiv.2203.02041
- Topping et al. (2020a) Topping, M. W., Shapley, A. E., Reddy, N. A., et al. 2020a, MNRAS, 495, 4430, doi: 10.1093/mnras/staa1410
- Topping et al. (2020b) —. 2020b, MNRAS, 499, 1652, doi: 10.1093/mnras/staa2941
- Toribio San Cipriano et al. (2017) Toribio San Cipriano, L., Domínguez-Guzmán, G., Esteban, C., et al. 2017, MNRAS, 467, 3759, doi: 10.1093/mnras/stx328
- Toribio San Cipriano et al. (2016) Toribio San Cipriano, L., García-Rojas, J., Esteban, C., Bresolin, F., & Peimbert, M. 2016, MNRAS, 458, 1866, doi: 10.1093/mnras/stw397
- Torrey et al. (2018) Torrey, P., Vogelsberger, M., Hernquist, L., et al. 2018, MNRAS, 477, L16, doi: 10.1093/mnrasl/sly031
- Trainor et al. (2015) Trainor, R. F., Steidel, C. C., Strom, A. L., & Rudie, G. C. 2015, ApJ, 809, 89, doi: 10.1088/0004-637X/809/1/89
- Tremonti et al. (2004) Tremonti, C. A., Heckman, T. M., Kauffmann, G., et al. 2004, ApJ, 613, 898, doi: 10.1086/423264
- Troncoso et al. (2014) Troncoso, P., Maiolino, R., Sommariva, V., et al. 2014, A&A, 563, A58, doi: 10.1051/0004-6361/201322099
- Tsamis et al. (2003) Tsamis, Y. G., Barlow, M. J., Liu, X. W., Danziger, I. J., & Storey, P. J. 2003, MNRAS, 338, 687, doi: 10.1046/j.1365-8711.2003.06081.x
- Vegetti & Koopmans (2009) Vegetti, S., & Koopmans, L. V. E. 2009, MNRAS, 392, 945, doi: 10.1111/j.1365-2966.2008.14005.x
- Weiner et al. (2009) Weiner, B. J., Coil, A. L., Prochaska, J. X., et al. 2009, ApJ, 692, 187, doi: 10.1088/0004-637X/692/1/187
- Weldon et al. (2022) Weldon, A., Reddy, N. A., Topping, M. W., et al. 2022, MNRAS, 515, 841, doi: 10.1093/mnras/stac1822
- Xu et al. (2022) Xu, X., Heckman, T., Henry, A., et al. 2022, ApJ, 933, 222, doi: 10.3847/1538-4357/ac6d56
- Yates et al. (2012) Yates, R. M., Kauffmann, G., & Guo, Q. 2012, MNRAS, 422, 215, doi: 10.1111/j.1365-2966.2012.20595.x
- York et al. (2000) York, D. G., Adelman, J., Anderson, John E., J., et al. 2000, AJ, 120, 1579, doi: 10.1086/301513
- Yuan & Kewley (2009) Yuan, T. T., & Kewley, L. J. 2009, ApJ, 699, L161, doi: 10.1088/0004-637X/699/2/L161
- Zahid et al. (2017) Zahid, H. J., Kudritzki, R.-P., Conroy, C., Andrews, B., & Ho, I. T. 2017, ApJ, 847, 18, doi: 10.3847/1538-4357/aa88ae