Main Sequence to Starburst Transitioning Galaxies:
Gamma-ray Burst Hosts at
Abstract
Star-forming galaxies populate a main sequence (MS), a well-defined relation between stellar mass () and star-formation rate (SFR). Starburst (SB) galaxies lie significantly above the relation whereas quenched galaxies lie below the sequence. In order to study the evolution of galaxies on the SFR- plane and its connection to the gas content, we use the fact that recent episodes of star formation can be pinpointed by the existence of gamma-ray bursts (GRBs). Here we present sensitive [C I]-nondetections of ultra luminous infrared (ULIRG) GRB host galaxies. We find that our GRB hosts have similar molecular masses to those of other ULIRGs. However, unlike other ULIRGs, the GRB hosts are located at the MS or only a factor of a few above it. Hence, our GRB hosts are caught in the transition toward the SB phase. This is further supported by the estimated depletion times, which are similar to those of other transitioning galaxies. The GRB hosts are [C I]-dark galaxies, defined as having a [C I]/CO temperature brightness ratio of 0.1. Such a low [C I]/CO ratio has been found in high-density environments () where CO is shielded from photodissociation, leading to under-abundances of [C I]. This is consistent with the merger process that is indeed suggested for our GRB hosts by their morphologies.
1 Introduction
Star formation occurs in molecular gas clouds (Wong & Blitz 2002; Gao & Solomon 2004a; Bigiel et al. 2008; but see Glover & Clark 2012; Krumholz 2012; Michałowski et al. 2015). The molecular gas fraction and its availability for star formation are key ingredients that shape the evolution of galaxies (see review by Saintonge & Catinella, 2022) and determine the place where a galaxy is found in the star-formation rate (SFR)–stellar mass () plane. Normal star-forming galaxies (SFGs) form a well-defined ‘main sequence’ (MS) on this plane with a scatter of about 0.2 dex (Brinchmann et al., 2004; Noeske et al., 2007; Speagle et al., 2014).
The so-called starburst galaxies are found above the MS with extremely high SFRs for a given stellar mass (Combes et al., 2011; Rodighiero et al., 2011; Larson et al., 2016). It is not clear whether an increase in star formation efficiency (SFE; Cheng et al., 2018; Hogan et al., 2022) or gas mass fraction (Lee et al., 2017; Valentino et al., 2020a) drives the departure from the MS. As pointed out by Gao & Solomon (2004b), the global SFR depends mainly on the amount of dense molecular gas, which can be traced for example by a hydrogen cyanide (HCN) line. This dependence remains nearly the same (with a slope of about 1) for normal and starburst galaxies, including ultra-luminous galaxies (ULIRGs). The HCN observations however are limited to the local universe due to the weakness of this line. Thus, until deep HCN (or other dense gas tracers) observations are available, we need to rely on other approximations.
Major and minor mergers have been invoked as possible causes for triggering the starburst behavior (Combes et al., 2011; Rodighiero et al., 2011; Larson et al., 2016; Saintonge & Catinella, 2022). Eventually, some galaxies will terminate their star formation. These galaxies tend to have red colors, compact and spheroidal morphologies (Schawinski et al., 2014; Nadolny et al., 2021), with relatively low gas and dust content.
Most of the information on molecular gas in galaxies comes from observations of the carbon monoxide (CO) lines (Bolatto et al., 2013; Carilli & Walter, 2013). The notion that the neutral carbon line ([C I]) traces the bulk of the molecular gas mass has been investigated for more than four decades now (Phillips & Huggins, 1981; Papadopoulos et al., 2004; Jiao et al., 2017; Valentino et al., 2018). On the other hand, in UV-intense and metal-poor environments, the use of [C I] as a molecular gas tracer is limited due to the increased ionisation of carbon. The limited usefulness of [C I] has also been shown in dense conditions, i.e in the collisional fronts of mergers (Michiyama et al., 2021). Bisbas et al. (2017) showed however, that even if [C I] is limited in such cases, it is still a more reliable tracer of global molecular mass than CO. This is due to the high sensitivity of the [C/CO] abundance to even small changes in the cosmic ray ionization rate, especially when the average gas densities are low (). It is in such densities that the bulk of the H2 reservoirs in galaxies is often found.
Recent episodes of star formation in galaxies can be pinpointed by the existence of gamma-ray bursts (GRBs) which are explosions of short-lived massive stars (Hjorth et al., 2003; Stanek et al., 2003). In this paper we take advantage of this feature to study the evolution of galaxies on the SFR- plane and its connection to the gas content by analyzing high-sensitivity observations of [C I] line emission towards selected GRB hosts. In particular, we want to shed light on the cause of weak [C I] lines of galaxies, i.e. if they are due to gas properties (e.g., density) or due to true low molecular gas content.
This paper is organized as follows. In Section 2 we describe the sample selection, observations, and reduction process. We also define the comparison sample from the literature and describe the methods used to derive fluxes, luminosities, and molecular masses. In Section 3 we describe the results of our analysis. Section 4 discusses our interpretation of the observables together with alternative scenarios. Finally, in Section 5 we present the conclusions of our work. Throughout this paper we use a cosmological model with = 70 km s-1Mpc-1, , and .
2 Data
2.1 Sample Selection
The GRB host sample observed in [C I]() (hereafter [C I]) was selected based on the availability of infrared or radio detections (Hunt et al., 2014; Perley et al., 2015; Michałowski et al., 2015), allowing precise estimates of SFRs. We selected hosts with spectroscopic redshifts so that their [C I] lines were expected to be observed away from atmospheric water lines. This resulted in seven potential targets (the hosts of GRB 051006, 051022, 060814, 061121, 080207 100316D, 111005A). Depending on their declinations, these sources were observed with the Atacama Pathfinder Experiment (APEX) or the IRAM 30m radio telescope. The hosts of GRB 111005A, 051006, 051022 were not observed, because they are at the lower redshift range proposed for a given telescope, resulting in a high observing frequency at which the weather requirements were challenging.
Low-redshift targets (GRB 061121 and 100316D) were only suitable for the APEX telescope because for them the observing frequency is high and requires very stable weather conditions and also a very low amount of precipitable water vapor. These stringent conditions are often attained at Chajnantor (the APEX site), but not at Pico Veleta (the IRAM 30m telescope site).
2.2 Observations and Data Reduction
We observed the hosts of GRB 060814 and 080207 with the IRAM 30m telescope (proposal 172-16; PI: M.J.M.), equipped with the Eight MIxer Receiver111 www.iram.es/IRAMES/mainWiki/EmirforAstronomers (Carter et al., 2012). We implemented the wobbler-switching mode and the Fourier Transform Spectrometers 200 (FTS-200) providing 195 kHz spectral resolution and 16 GHz bandwidth in each linear polarisation. The observations for both targets were executed between 2017-Feb-01 and 2017-May-22 and lasted in total 13.1 hr on-source for GRB 060814 and 17.8 hr for GRB 080207. The observations were divided into 6 min scans, each consisting of 12 subscans 30 s long. Pointing was checked and corrected every 1–2 hr. Each spectrum was calibrated, and corrected for baseline shape. The spectra were aligned in frequency and noise-weight averaged. Some well-known platforming, due to the fact that the instantaneous bandwidth of 4 GHz is sampled by three different FTS units, was corrected off-line by a dedicated procedure within the Continuum and Line Analysis Single Dish Software (Class). In all cases, the [C I] line is far away from the step of the platforming.
The hosts of GRB 061121 and 100316D were observed with the APEX telescope (Güsten et al. 2006; proposals 098.F-9300 and 098.D-0243; PI: M.J.M.), equipped with the Swedish Heterodyne Facility Instrument (SHeFI; Vassilev et al. 2008; Belitsky et al. 2006). However the upper limits were not sufficiently constraining to allow robust conclusions about the molecular content of these sources, hence we do not report the results for these galaxies.
All data were reduced and analyzed using the Class package within the Grenoble Image and Line Data Analysis Software: Gildas222www.iram.fr/IRAMFR/GILDAS (Pety, 2005).
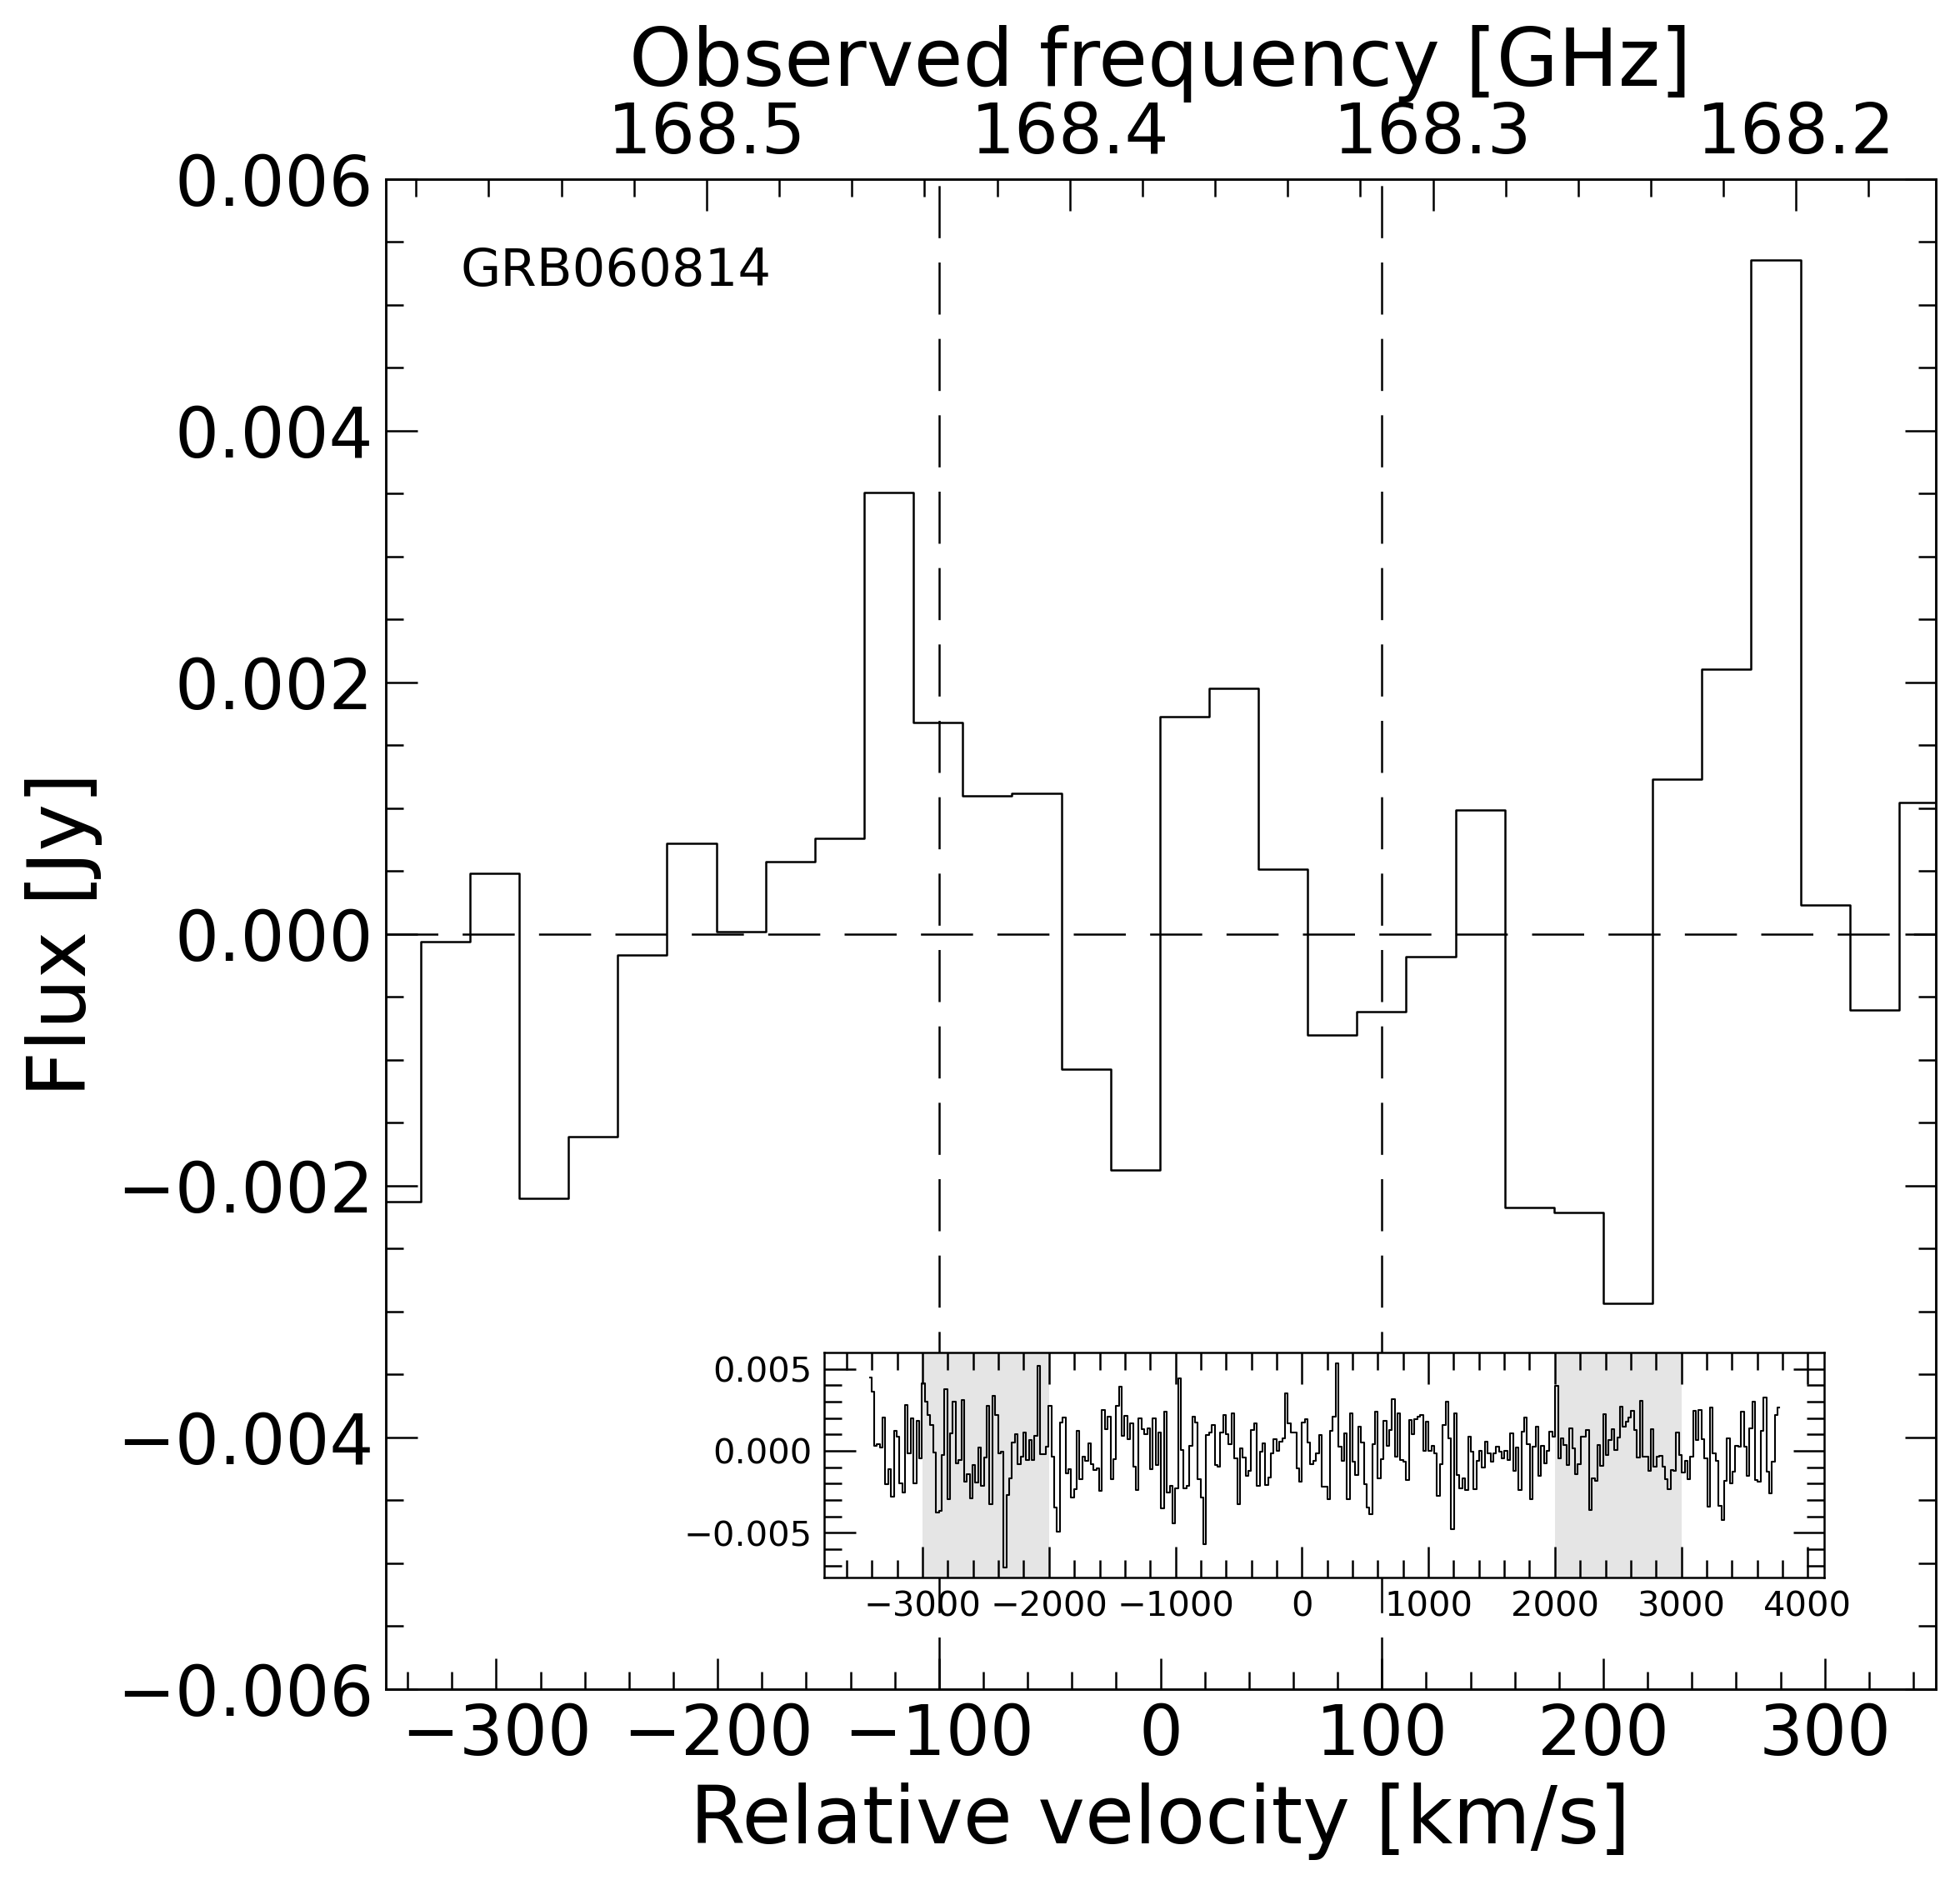
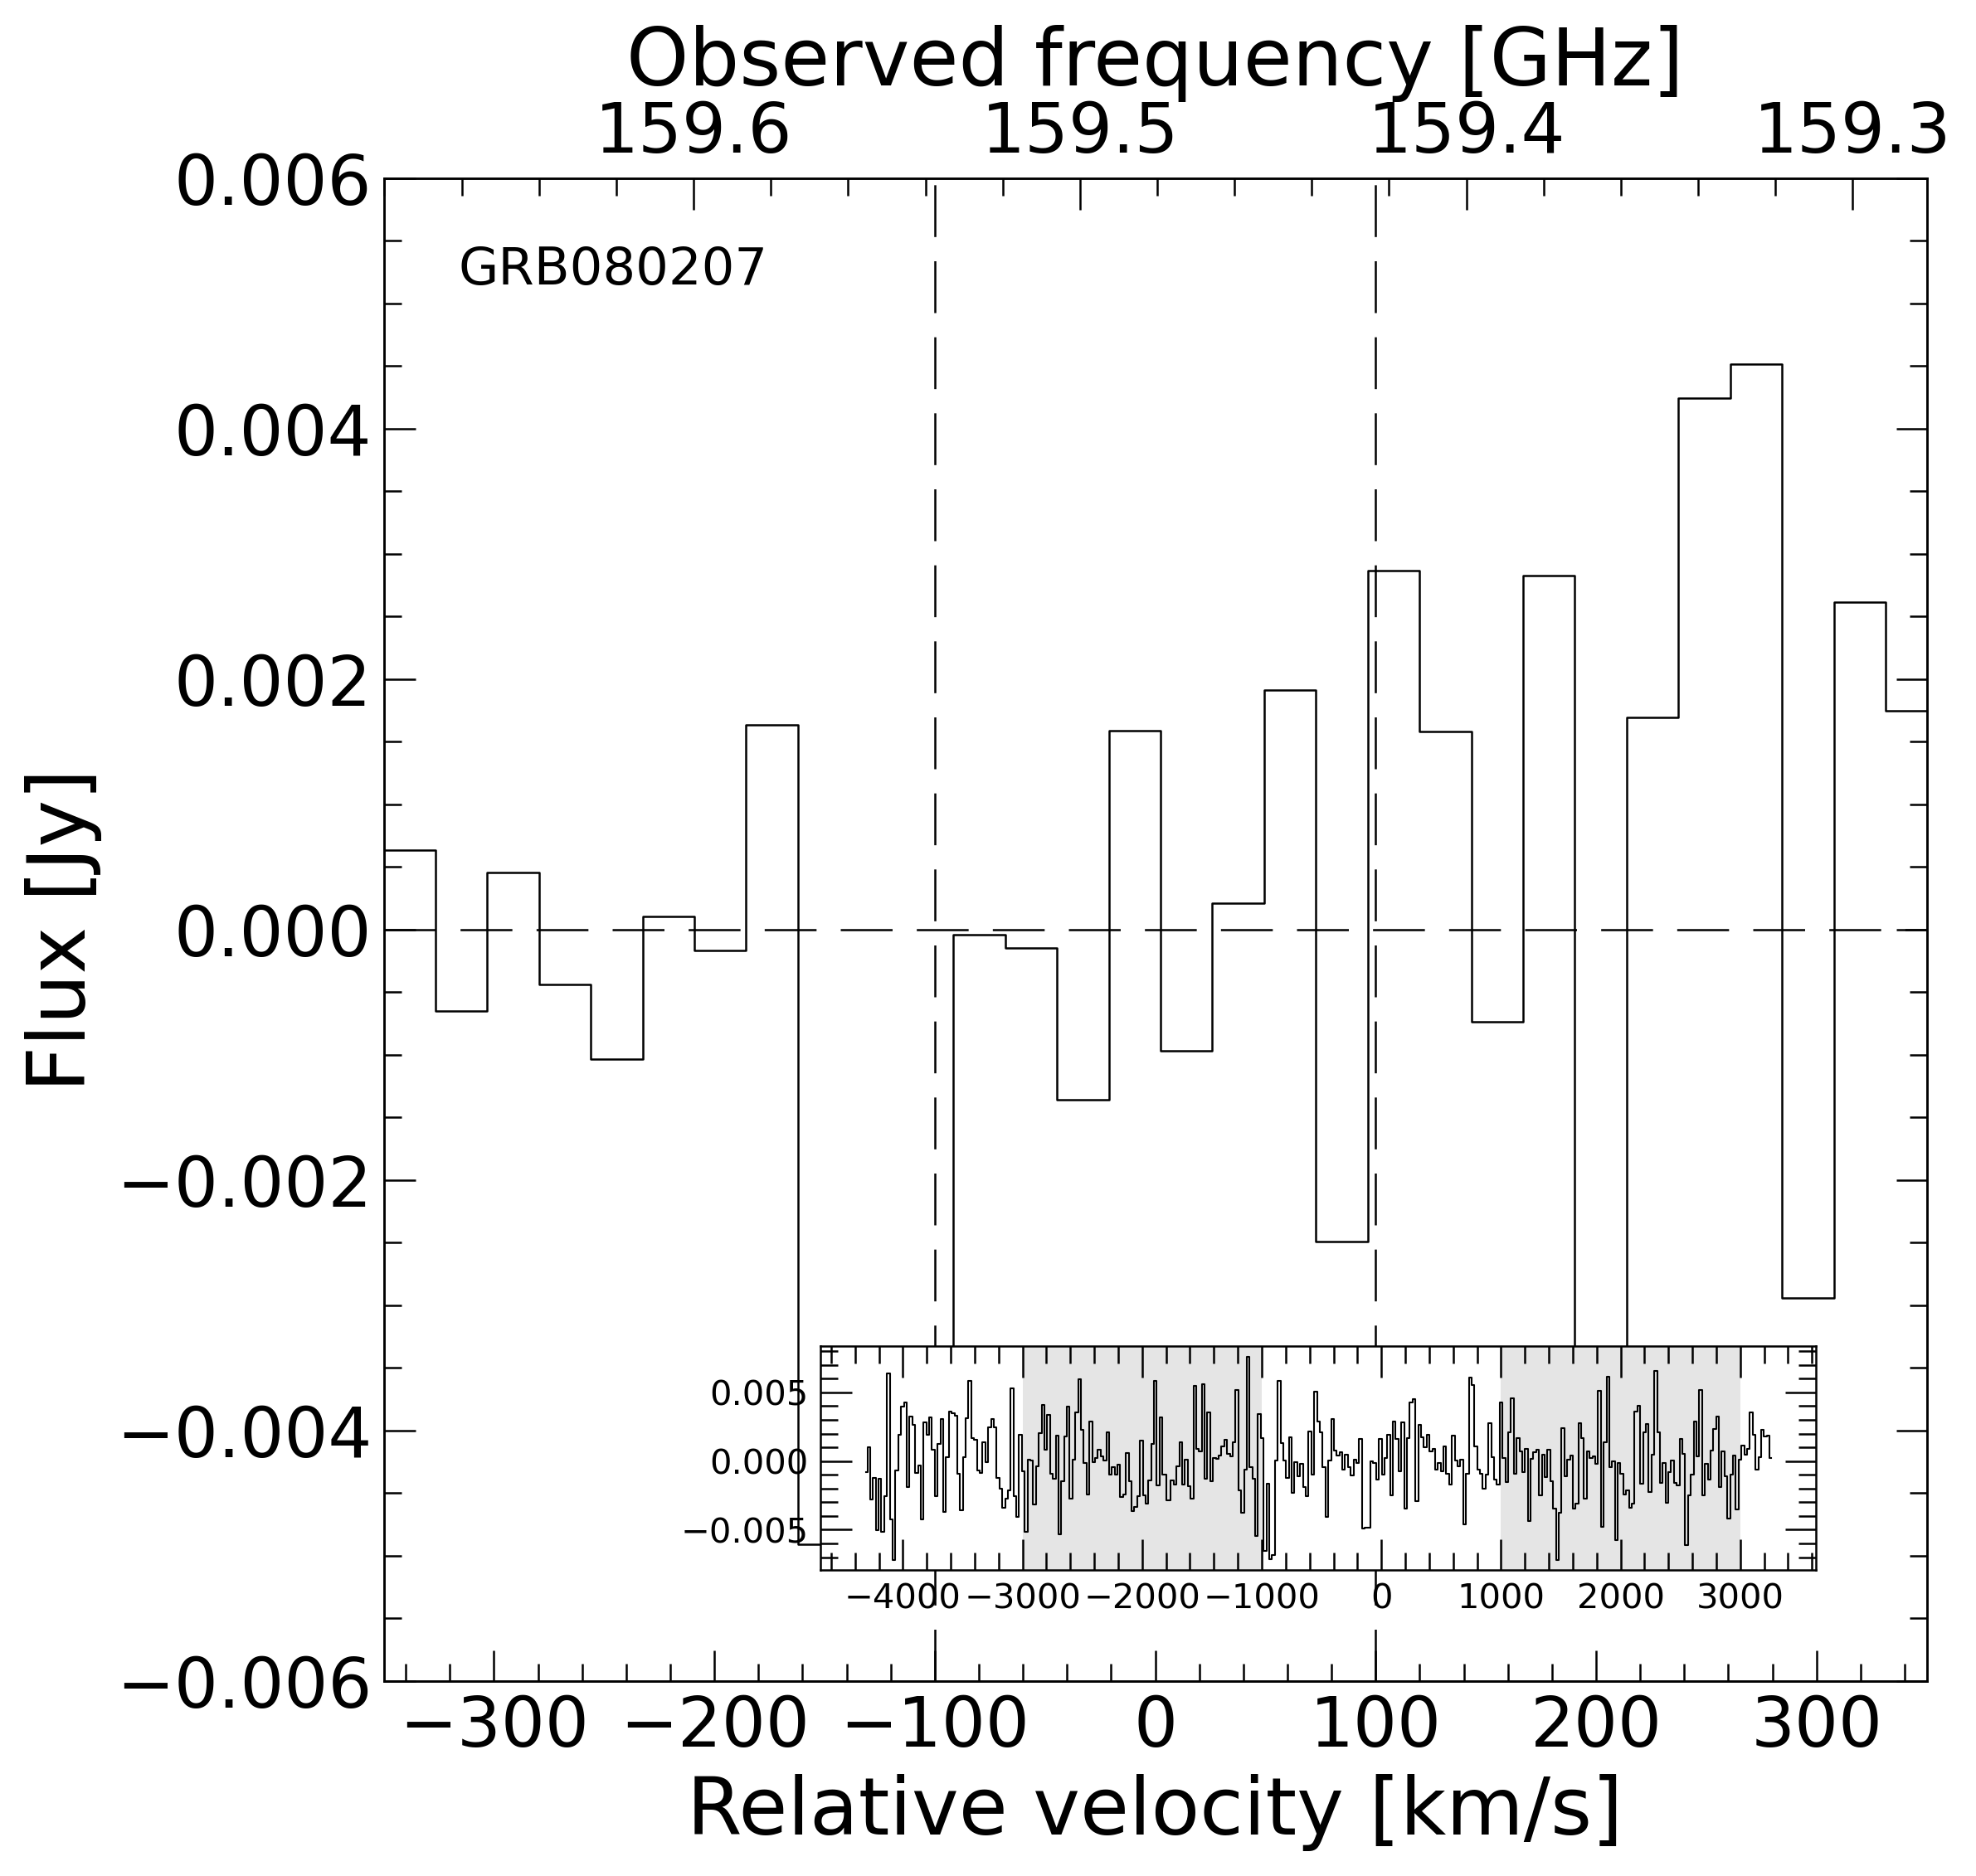
The obtained [C I] spectra of our two GRB (060814 and 080207) hosts are shown in Figure 1.
2.3 Comparision Sample
In order to place our two GRB hosts into a general perspective we compiled a sample of galaxies spanning several orders of magnitude in stellar mass, SFR and gas mass. In particular, this compilation contains normal SFG (Bourne et al., 2019; Dunne et al., 2021; Valentino et al., 2020b), (Ultra) Luminous IR Galaxies [(U)LIRGs] (Valentino et al., 2020b; Michiyama et al., 2021; Lu et al., 2017), intermediate- isolated LIRGs (Lee et al., 2017) and merging starburst ULIRGs (Combes et al., 2011), high- starbursts (Shi et al., 2018), and transitioning isolated and merging galaxies (Cheng et al., 2018; Hogan et al., 2022). For all sources with [C I] data, has here been estimated in a consistent manner (see Sec. 2.4). We used the total far-infrared luminosity to estimate the SFR (Kennicutt, 1998), as
(converted to the Chabrier 2003 IMF), and the fundamental plane (Lara-López et al., 2010) to estimate the oxygen metallicity (Valentino et al., 2018; Bourne et al., 2019; Dunne et al., 2021), for galaxies without these estimates in the literature. The latter is needed to estimate the metallicity-dependent conversion factor introduced below.
2.4 Flux, Luminosity and Mass Measurements
Our deep observations of [C I] in GRB hosts show a lack of significant emission. We estimated upper limits of the line flux, luminosity, and molecular gas masses by integration within a velocity range of -100 to 100 km s-1 around the expected velocity of the [C I] line at the redshift of each source. For our sample, as well as for the data from other works, we estimated the [C I] luminosity using the same prescription – equation 3 in Solomon et al. (1997).
We employed two methods to estimate the molecular gas mass from the luminosity of the [C I] line. The first method is based on a theoretical analysis of the [C I] emission from the ISM assuming local thermal equilibrium given by Papadopoulos et al. (2004). Using their Equation 11, evaluating all the constants we derived an expression to estimate the molecular gas mass from the [C I](1-0) line flux as:
| (1) |
where the abundance ratio is (Valentino et al., 2018; Jiao et al., 2017), Einstein coefficient for this transition is s-1, is given by Equation A15 from Papadopoulos et al. (2004) with assumed , is the luminosity distance given in Mpc, and is the velocity integrated [C I] line flux in units of Jy km s-1. We refer to this method as P04 (see Weiß et al. 2003 for a similar method). The second method is taken from Heintz & Watson (2020), and is based on the conversion factor between and , estimated from observations of the [C I] absorption line in spectra of GRB afterglows and QSOs. In this case is metallicity dependent. We refer to this method as H20. Note that in both methods a factor that corrects for the contribution from helium and heavier elements is included.
3 Results
| GRB | |||||
|---|---|---|---|---|---|
| (Jy km s-1) | (K km s-1 pc-2) | P04(a) | H20(a) | M18 | |
| 060814 | -0.064 | 9.178 | 9.852 | 10.859 | 10.92 |
| 080207 | 0.016 | 9.504 | 10.17 | 10.777 | 11.3 |
| GRB | SFR (M⊙/yr) | (M∗/M⊙) | |
|---|---|---|---|
| 060814 | 1.92 (H12) | 256.0 (P15) | 10.2 (P15) |
| 080207 | 2.09 (H12) | 170.0 (H12) | 11.17 (H14) |
All the measurements obtained for our GRB hosts are given in Table 1. The upper limits are 2. The SFRs, stellar masses, and spectroscopic redshifts from the literature are given in Table 2.
3.1 [C I] Luminosity
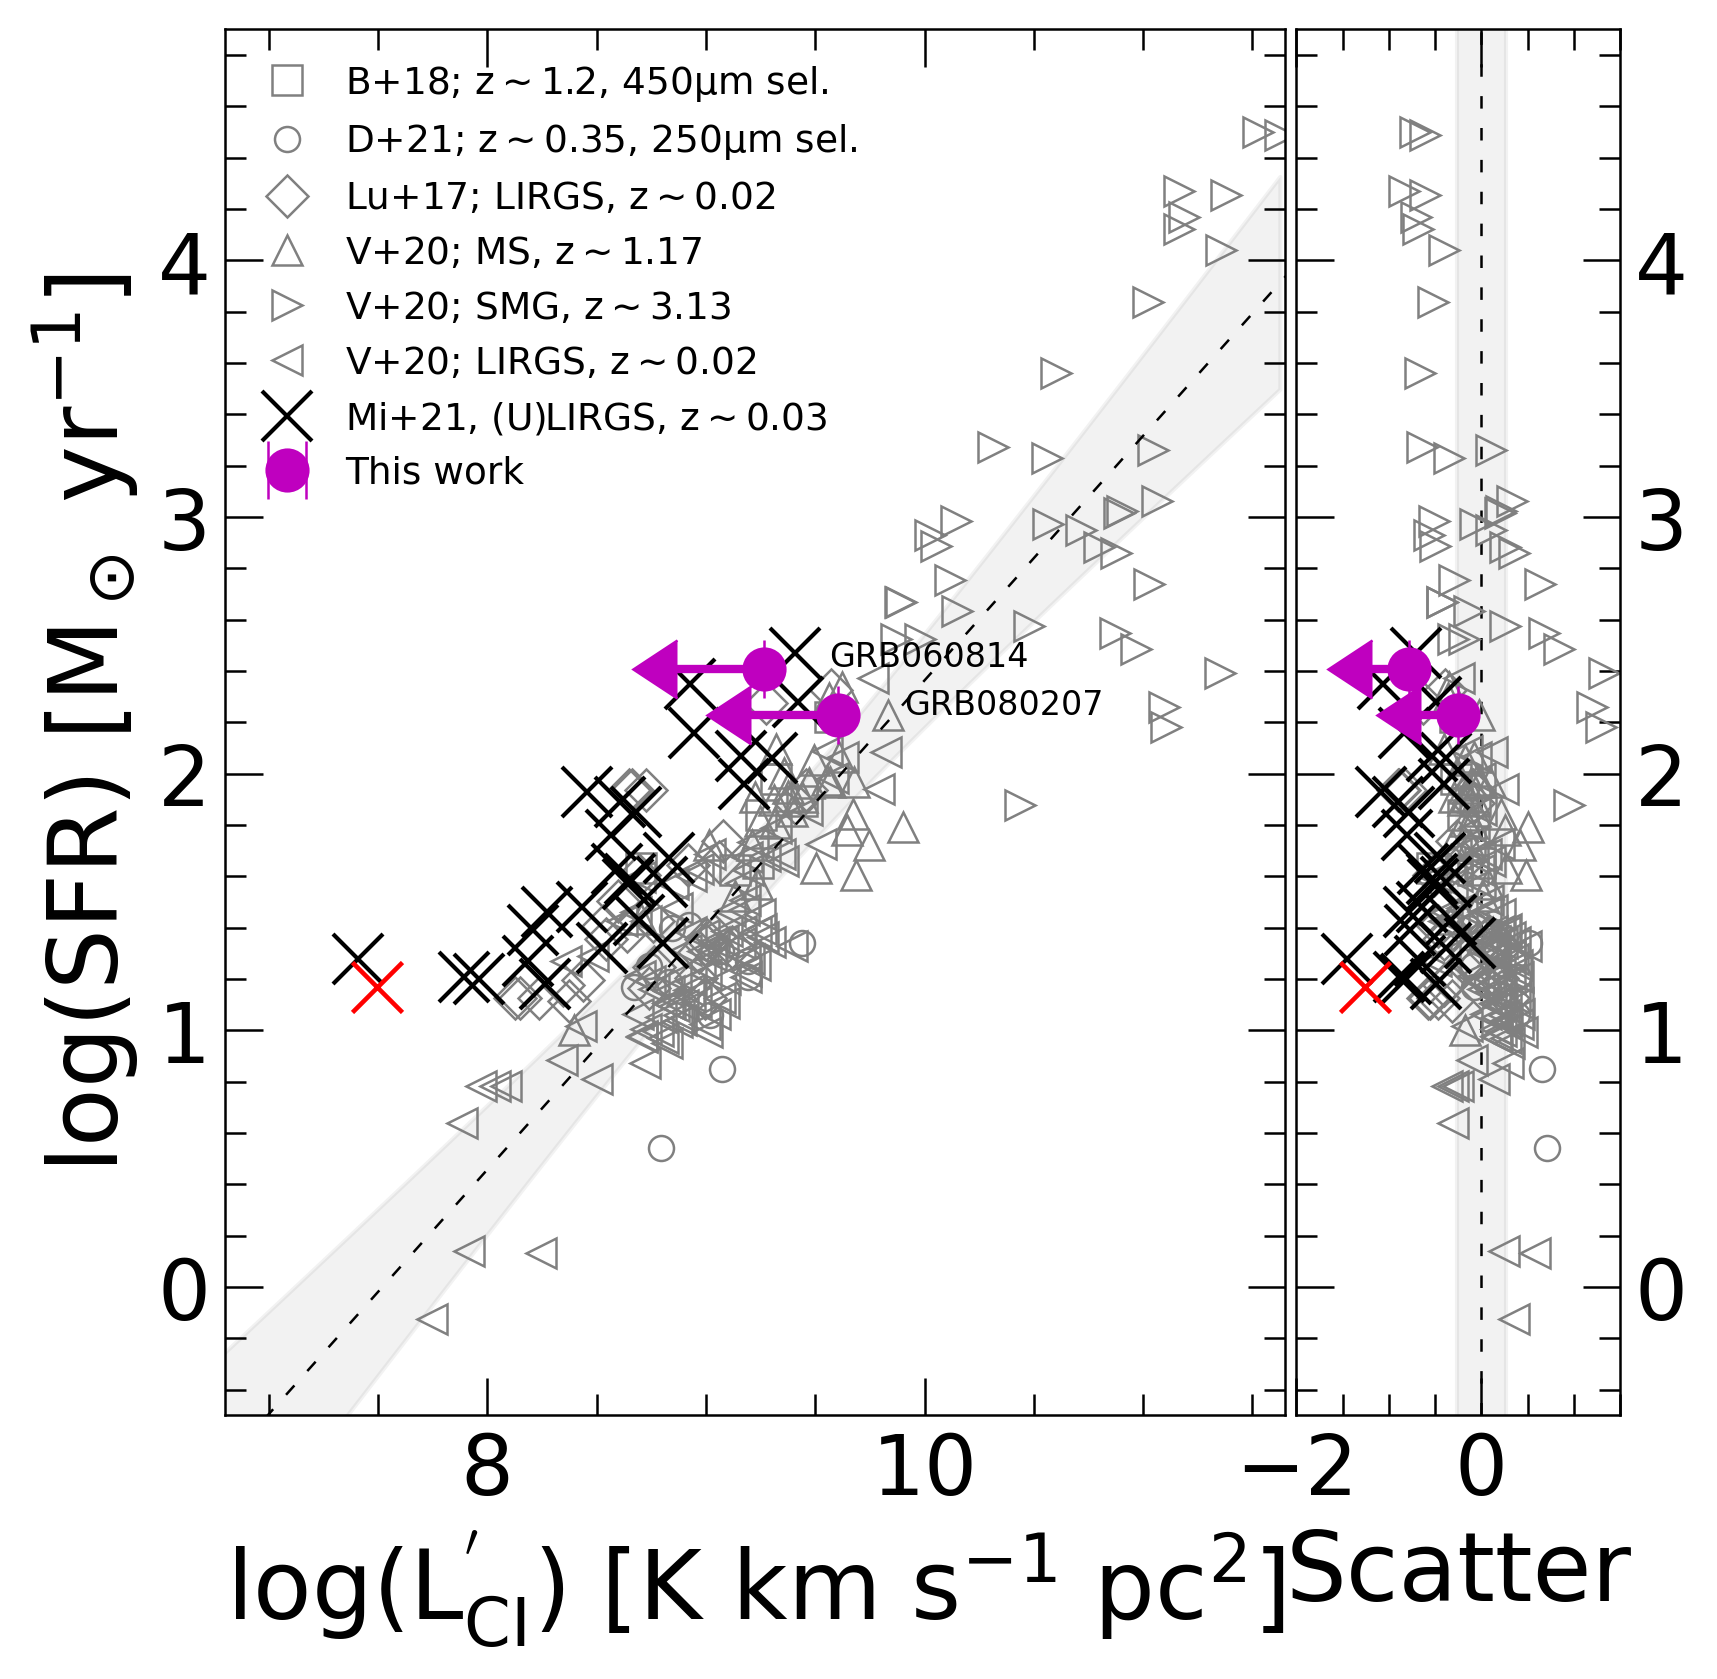
In Figure 2 we show the SFRs as a function of [C I] line luminosity for our sample and for data from the literature for which the [C I] fluxes were available (Bourne et al., 2019; Lu et al., 2017; Valentino et al., 2020b; Dunne et al., 2021; Michiyama et al., 2021). Using only data for SFG from the literature (gray empty markers), we find the best-fit relation between and SFR as:
| (2) |
which holds over a wide redshift range () with scatter of 0.27 dex. As shown in Figure 2, the hosts of GRBs 060814 and 080207 have lower (by 0.8 and 0.3 dex, respectively) than expected for their SFRs based on our best-fit. It has been shown for GRB hosts, in general, that, we can rule out the possible contamination of the emission by active galactic nuclei at the wavelengths used to estimate SFRs (Perley et al., 2015), so we consider these SFRs to be robust.
In Figure 2 we also show the local (U)LIRG merging galaxies (Michiyama et al., 2021), which together with our low- GRB hosts are found above the SFG population in terms of their SFR. This is also clearly visible on the right-hand panel in the same Figure where the scatter around the best-fit relation is shown. In particular, the red X symbol shows NGC 7679, the [C I]-dark AGN host found by Michiyama et al. (2021). The [C I]/CO ratio of 0.07 of this galaxy is below those of other ULIRGs (Jiao et al., 2017). Using the CO data from Michałowski et al. (2018) we estimated the [C I]/CO ratio of our GRB hosts to be of the order of 0.1. This is lower than normal ULIRGs but not as low as [C I]-dark galaxies like NGC 7679 or NGC 6052 studied in Michiyama et al. (2020, 2021). On average (U)LIRGs have 0.6 dex lower while the [C I]-dark NGC 7679 has 1.2 dex lower than the expectations from the -SFR fit.
3.2 Molecular Gas Mass
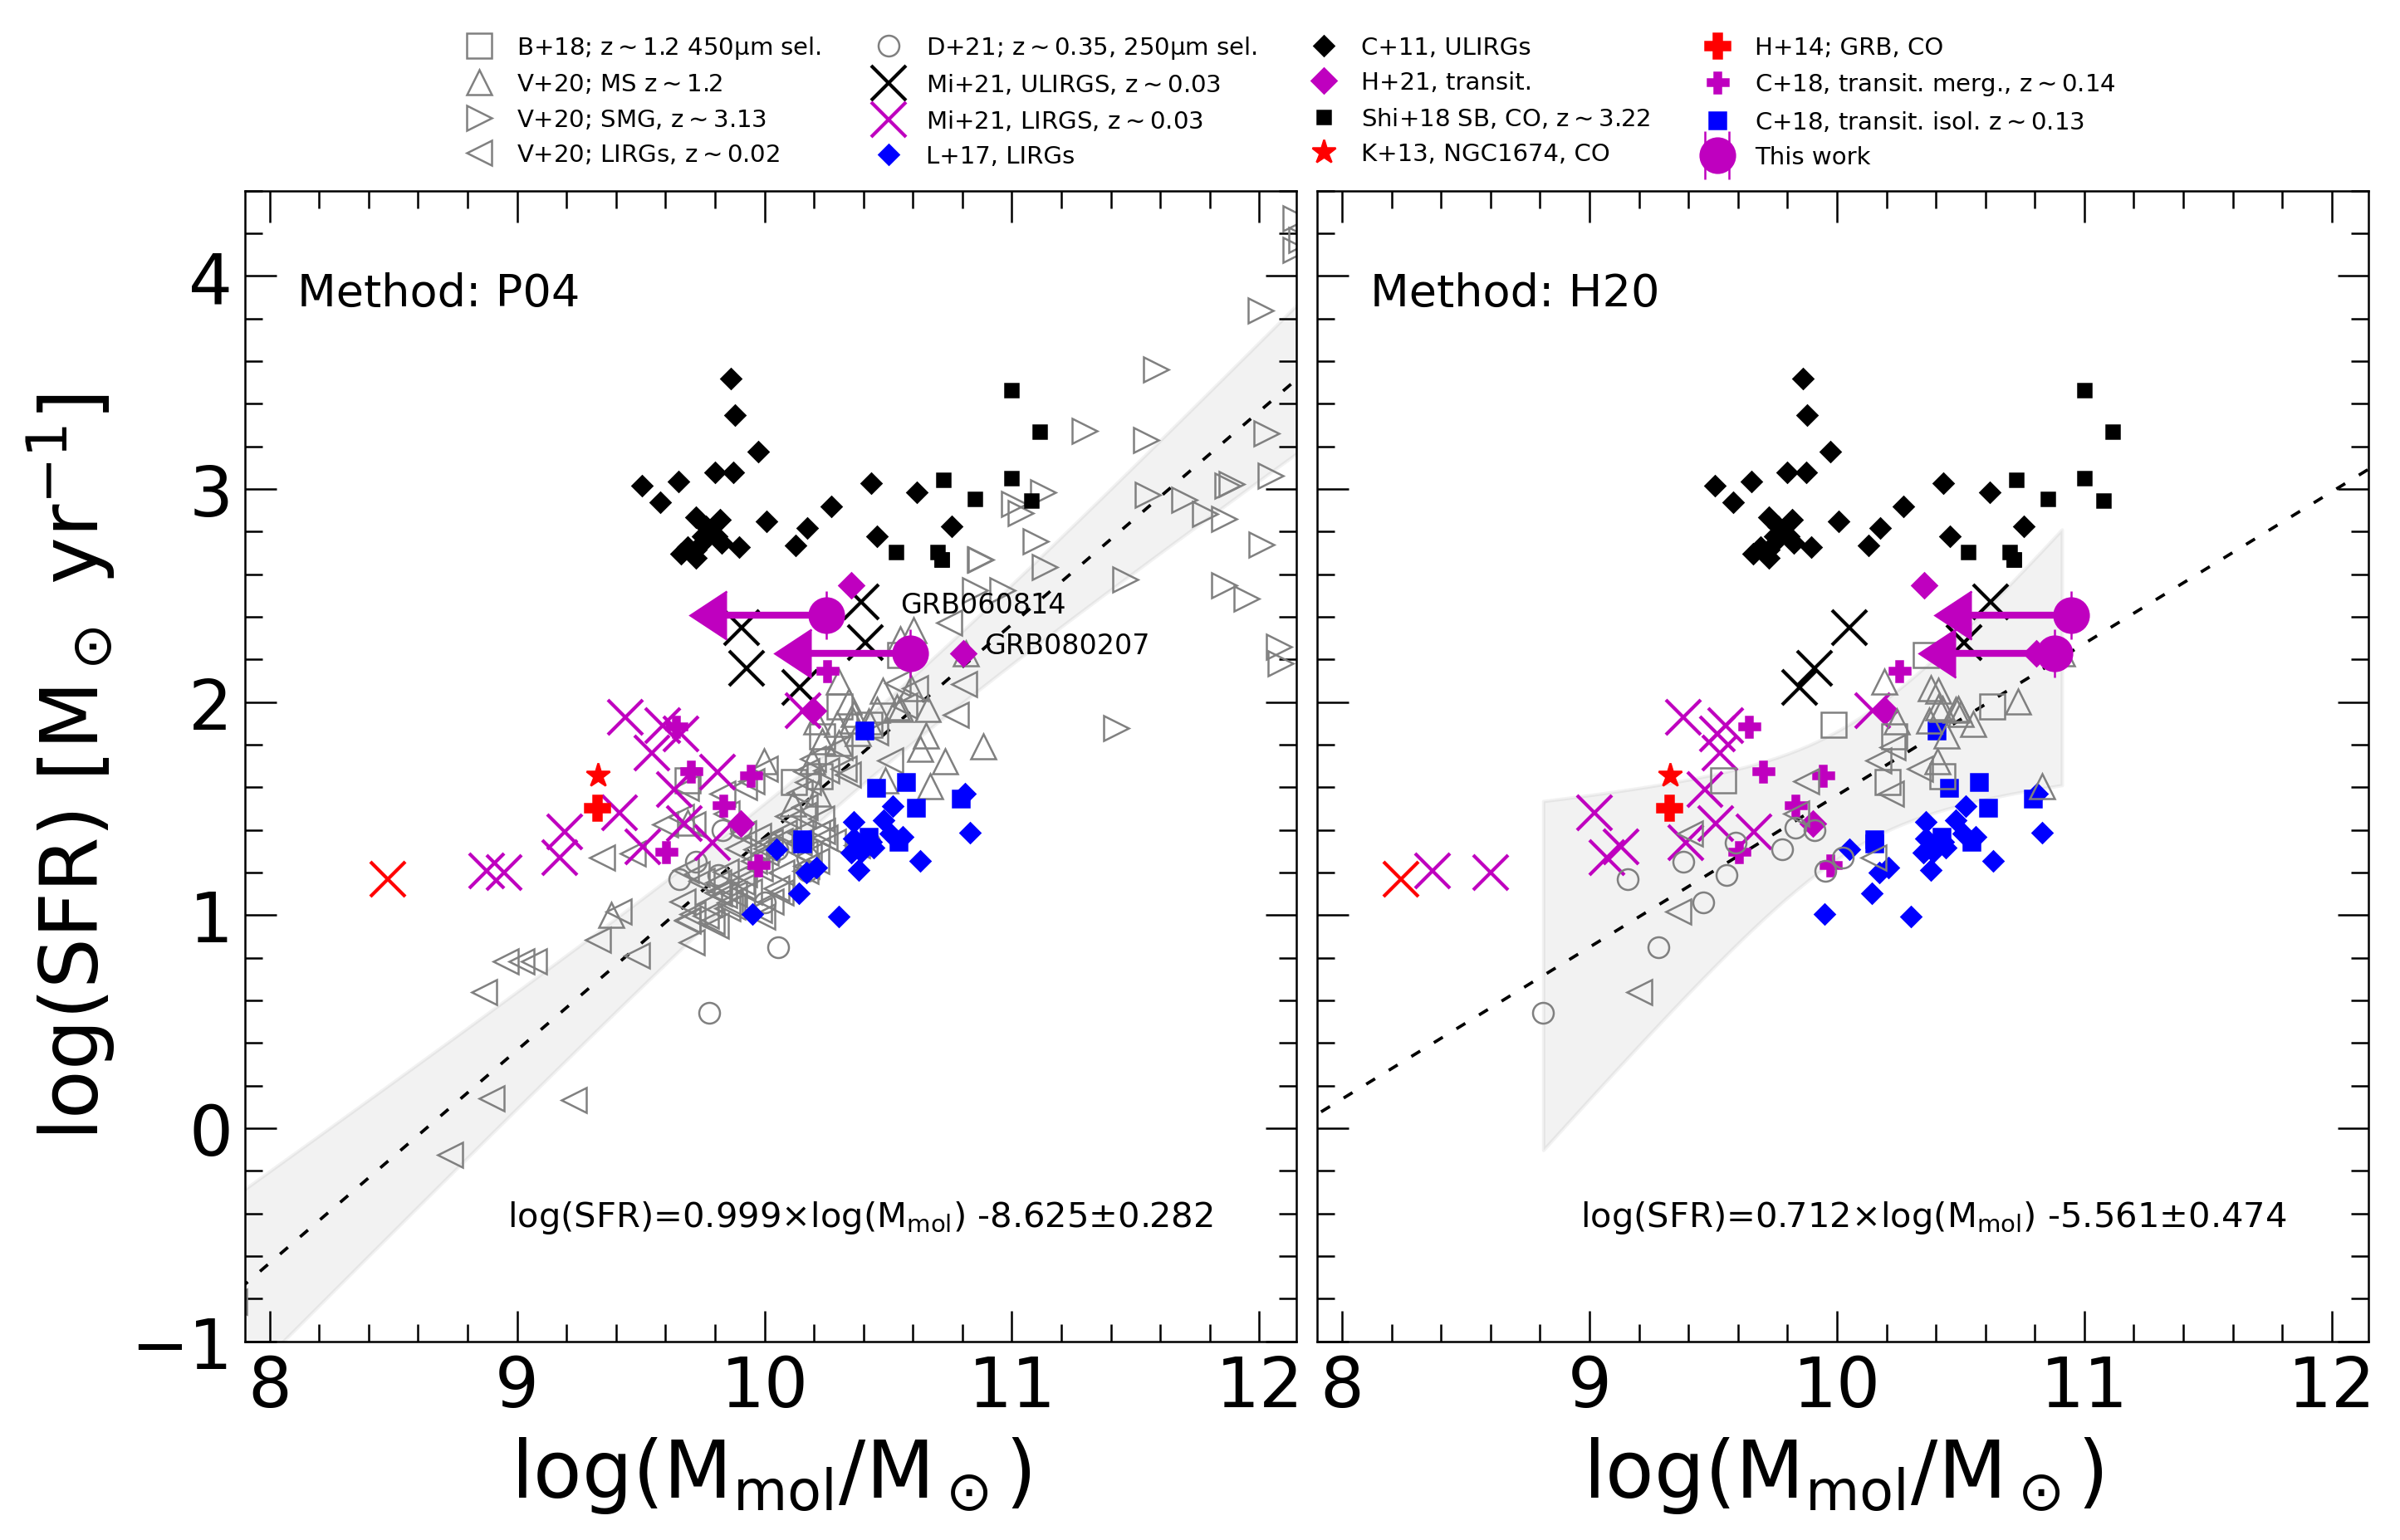
In Figure 3 we show the estimated molecular gas masses of our GRB hosts based on using our two different methods (see section 2.4 for details). We include the same data as in Figure 2,333Not all the galaxies from Fig. 2 had metallicity estimates available, nor was it possible to estimate these using the fundamental metallicity relation (Lara-López et al., 2010). These galaxies could not be included in the method where the conversion factor is metallicity-dependent, i.e. for Method H20. together with local LIRG NGC 1674 (König et al., 2013), intermediate- isolated LIRGs (Lee et al., 2017), intermediate- merging starburst ULIRGs (Combes et al., 2011), and high- starburst ULIRGs (Shi et al., 2018), and low- and intermediate- transitioning isolated and merging galaxies (Cheng et al., 2018; Hogan et al., 2022) with the molecular mass estimated from CO emission (i.e. these have the same in both panels, and are shown for comparison only). Using the SFG sample from the literature (gray empty markers) we find the best-fit relation between SFR and [C I]-based for each of the methods. The results of the fitting are given in each panel. The for the GRB 060814 and 080207 host galaxies are found to be lower by 0.8 and 0.2 dex from our best-fit for the P04 method. At least in the case of the host galaxy of GRB 060814 the offset is in agreement with the distance from the best-fit estimated for (U)LIRGs (0.8 dex), high- starburst (0.7), NGC 1674 (0.9 dex), and for the transitioning SFG mergers (0.4 dex).
The range of the molecular gas mass in isolated SFG (blue markers), merging transitioning systems (magenta), and in starburst (black) is similar (between and ), but their SFRs vary significantly from tens to thousands solar masses per year, which translates to different depletion times (or SFEs; see Sec. 3.3). Considering the second method used (H20), which is metallicity-dependent, we can see that the majority of the ULIRGs, including our GRB hosts, have above, but within the scatter of, the best-fit relation.
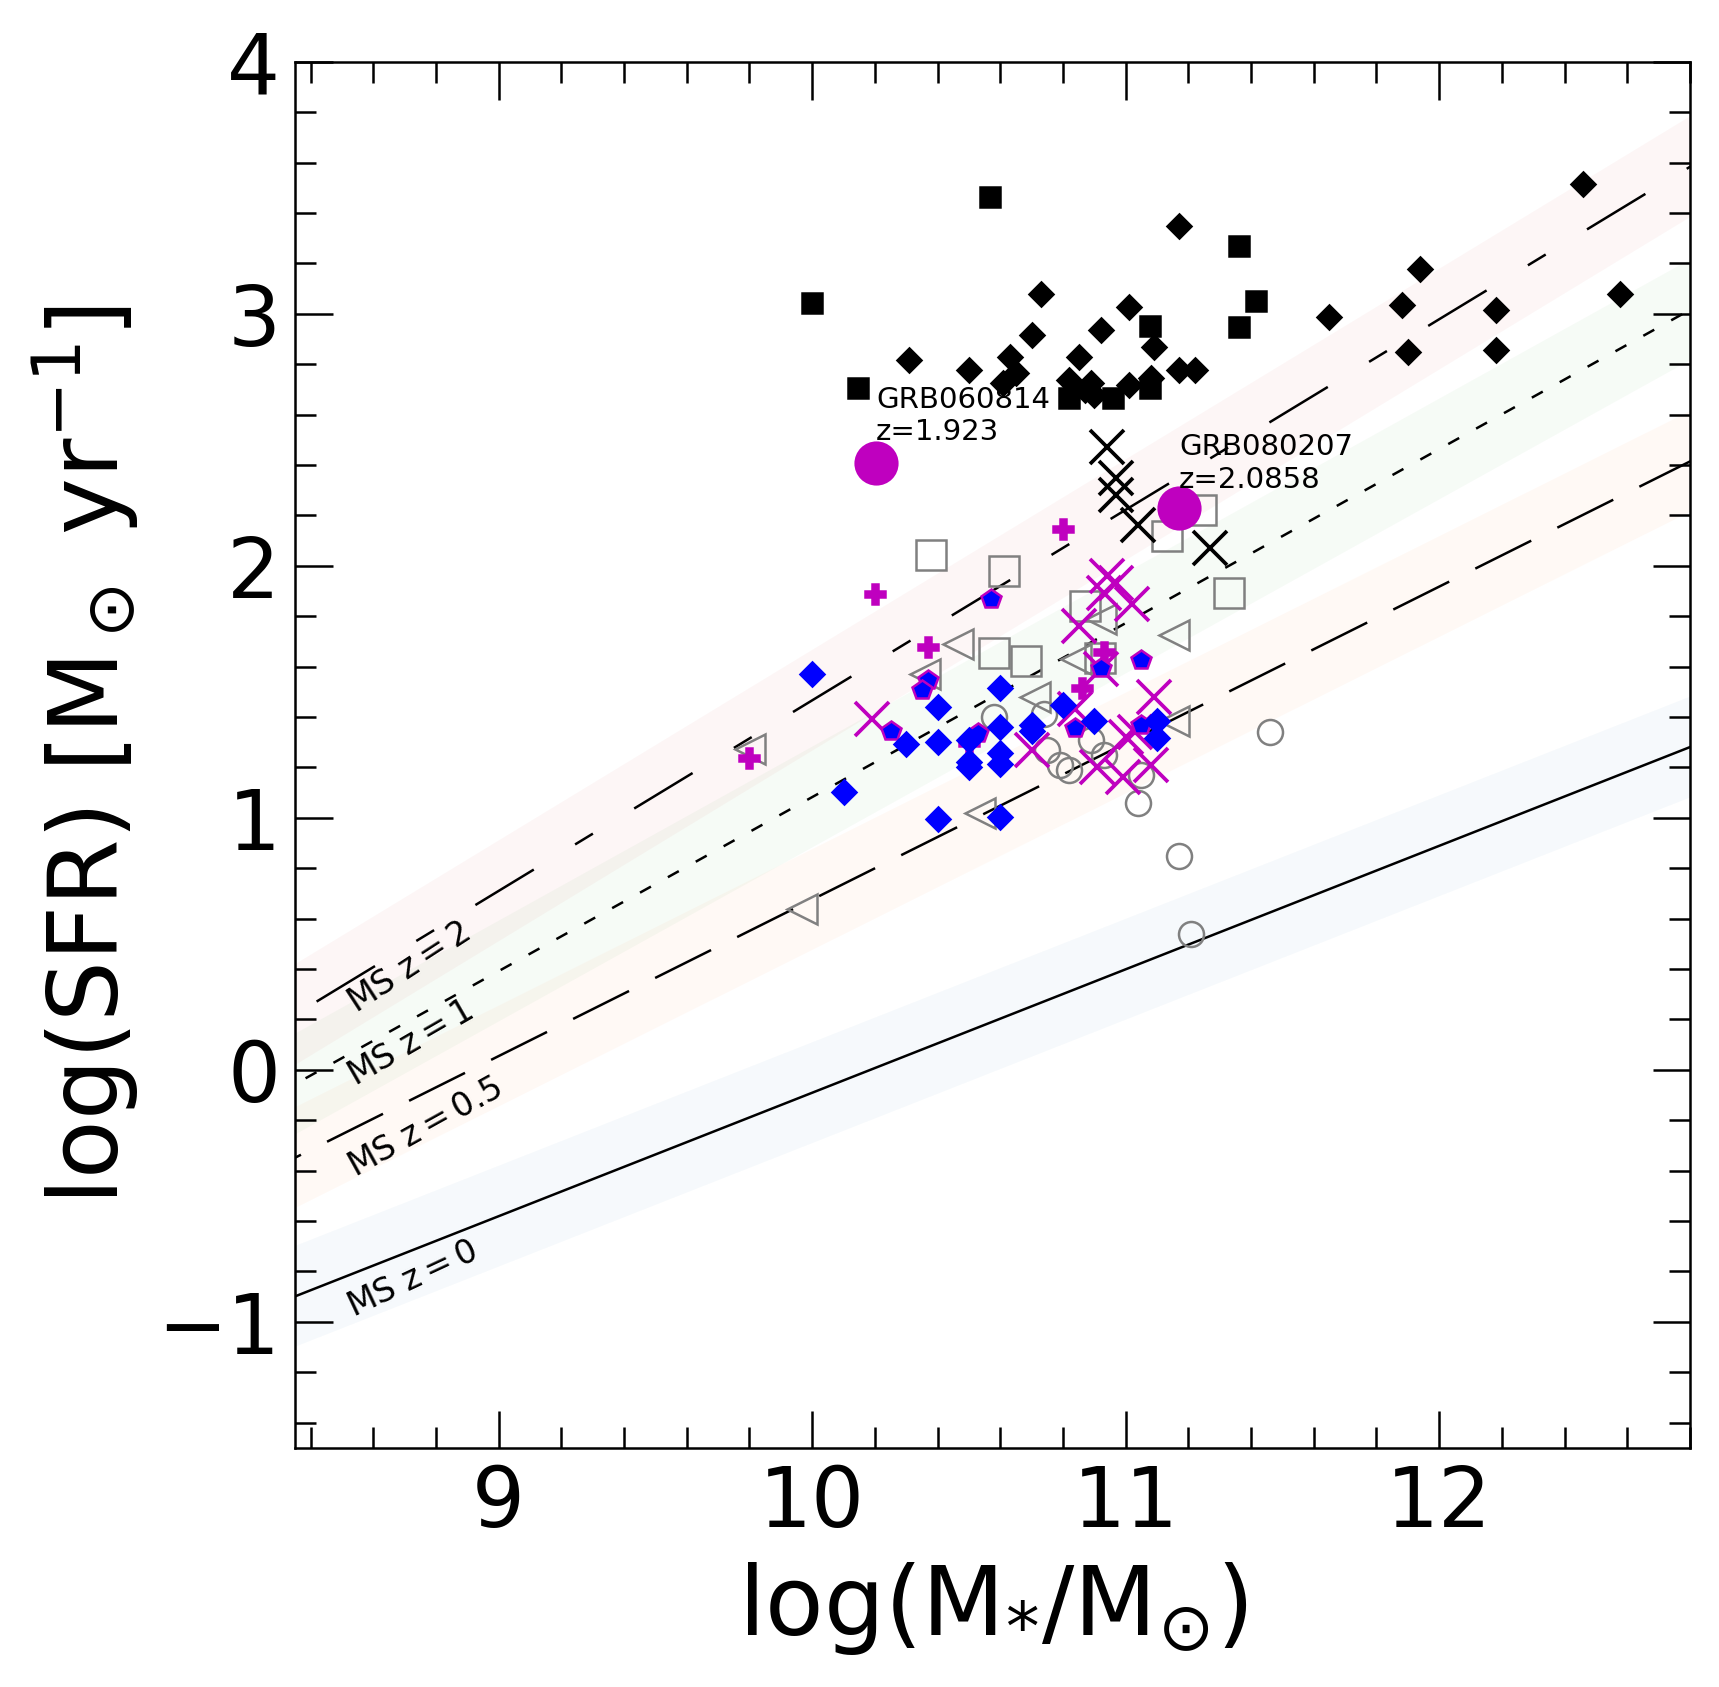
3.3 Main Sequence and Depletion Times
To establish whether the position of GRB hosts in Figures 2 and 3 is due to low or elevated SFRs, we investigate their location relative to the MS. Figure 4 shows the stellar mass as a function of SFR, and the MS for SFGs at different redshifts (Speagle et al., 2014). While intermediate- LIRGs are found on their MS, the GRB hosts, (U)LIRGs, and transitioning SFG are found to lie above the MS for their redshifts. To better quantify this, the distance from the MS is estimated as the ratio of the observed SFR to the SFR of a galaxy on the MS with the same stellar mass and redshift (SFR/SFRMS).
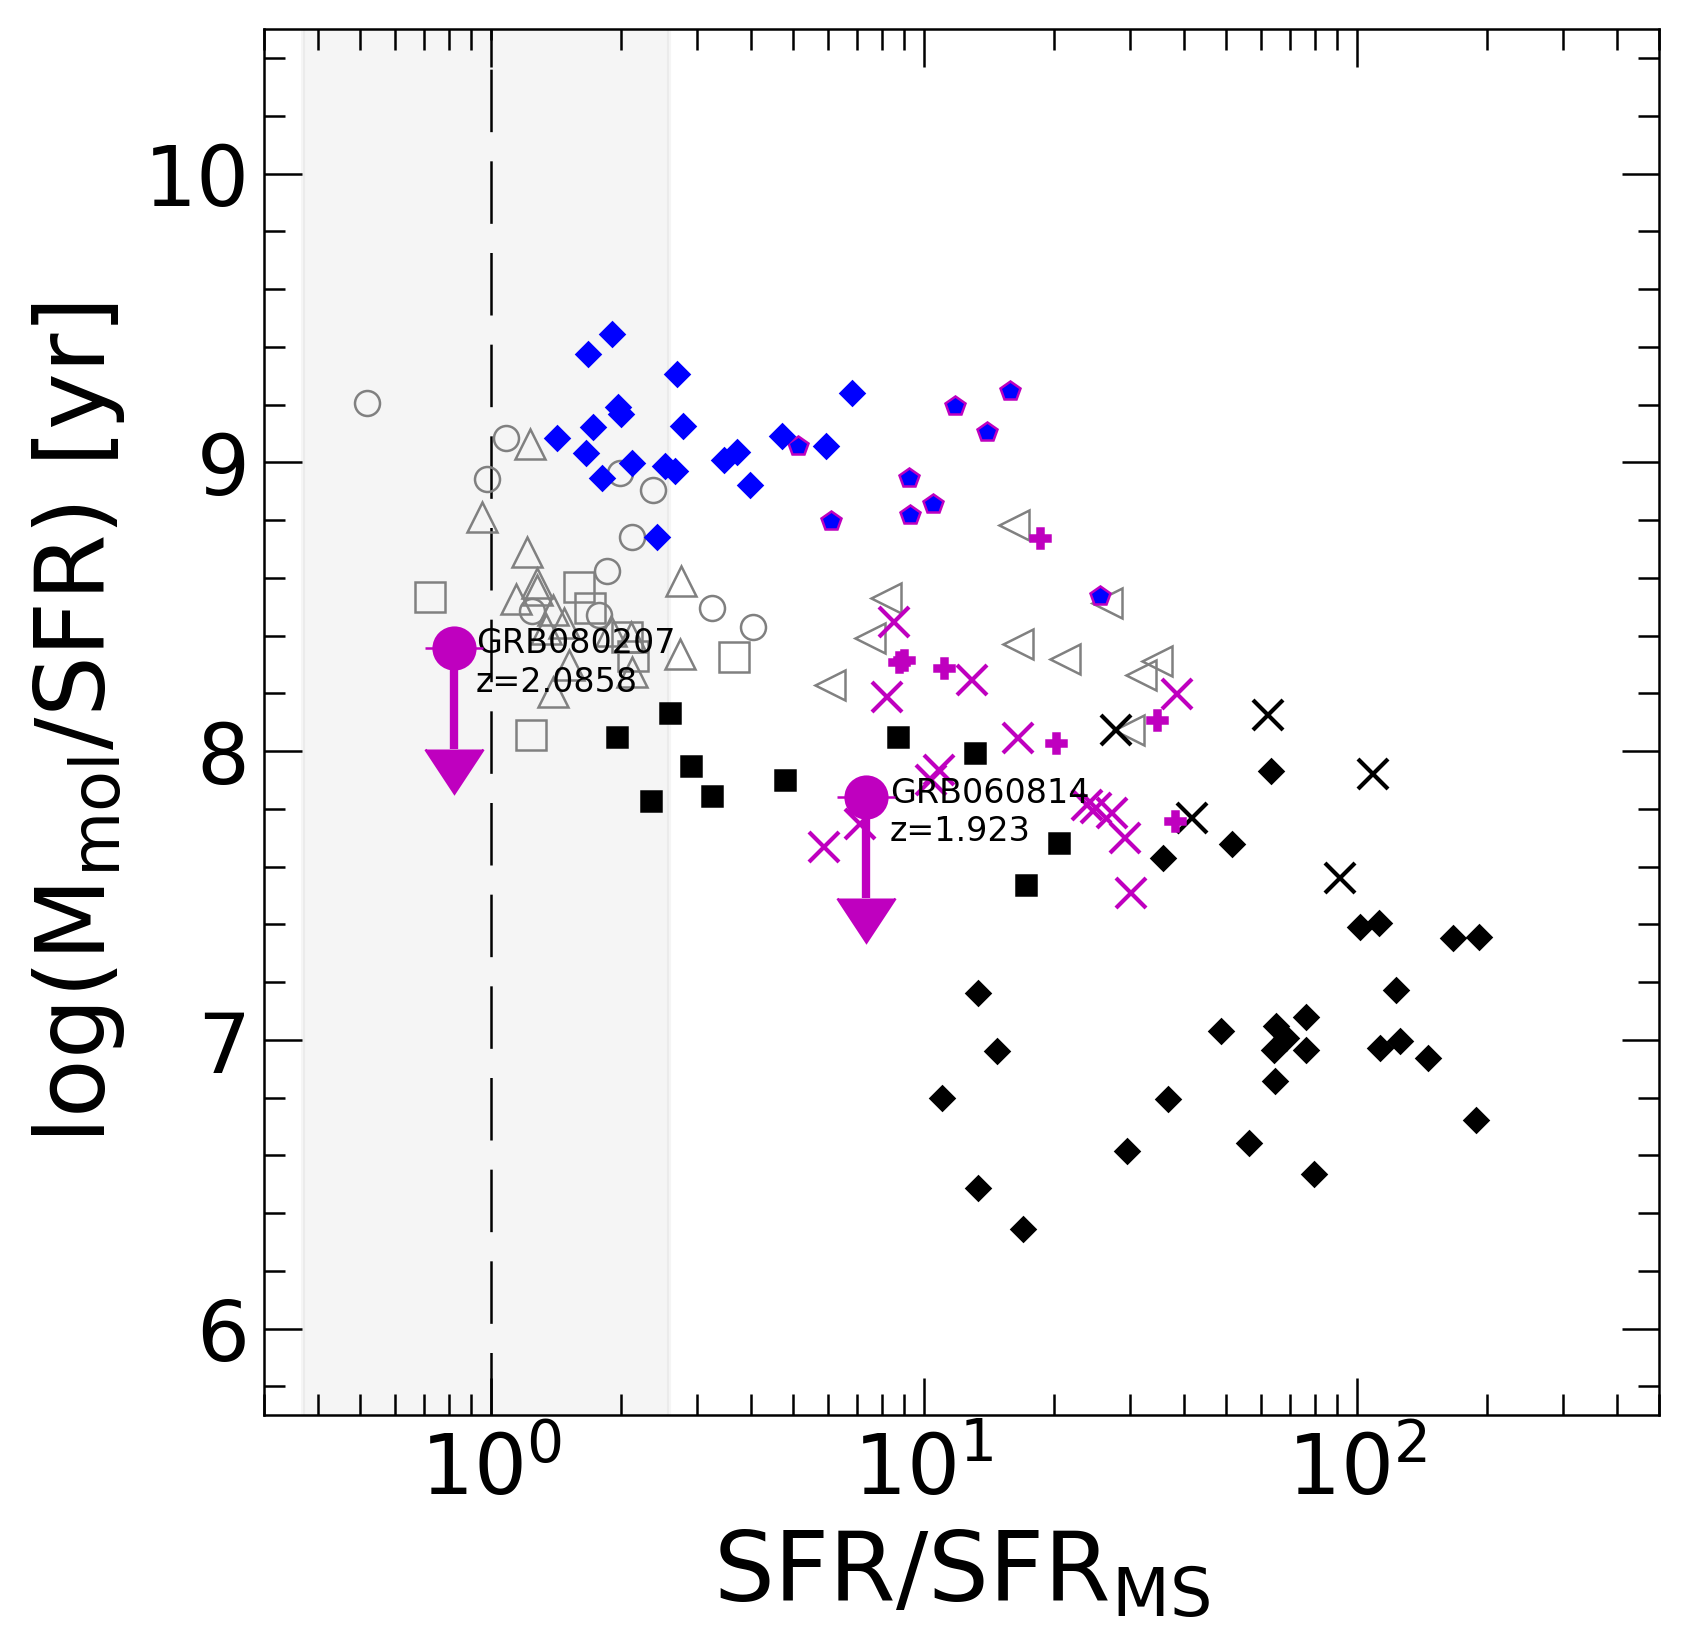
On the right panel of Figure 4, we show the molecular gas depletion timescale (/SFR using P04 method, or CO-based molecular gas masses from the literature when necessary), as a function of the distance to the MS. We find that GRBs 060814 is about seven times above the MS, while GRB 080207 lies on the corresponding MS within the scatter. The intermediate- isolated LIRGs lie close to the MS, while isolated transitioning galaxies are found one order of magnitude above it. The transitioning merging galaxies and starburst merging ULIRGs are found at even greater distances (with an average offset of a factor 20 and 77, respectively).
We obtained relatively short gas depletion times of 64 and 238 Myr (2 upper limits) for the hosts of GRB 060814, and 080207, respectively. These values are similar to those of high- starbursts for which we obtain a mean depletion time of 84 Myr and of transitioning mergers with an average of 205 Myr. The shortest depletion times (15 Myr on average) are found in intermediate- merging ULIRGs galaxies. As expected, the isolated LIRGs and isolated transitioning galaxies show longer depletion times of 1 Gyr on average.
In the right panel of Figure 4 we can see that with the gradual departure from the MS, the depletion time decreases. Gao & Solomon (2004b) showed that the fraction of the dense gas is the primary predictor of the SFR, and that the relation between these quantities is similar for different galaxy types. Here we can see that the merging process plays an important role in decreasing depletion time (or increasing SFE). Indeed, for the dense environment, it has been shown that the gas is converted quicker to stars, in particular in gas-rich mergers (Genzel et al., 2010). Perhaps this is to be expected given that in mergers there are much more turbulent molecular gas reservoirs, whose higher Mach numbers will place more gas at high densities ().
4 Discussion
A common feature for both GRB hosts studied in this work is a sensitive [C I] nondetection implying relatively low [C I] emission. The disturbed multi-component morphology in the Hubble Space Telescope imaging of both galaxies suggests an ongoing merger process (Svensson et al., 2012; Blanchard et al., 2016; Chrimes et al., 2019; Schneider et al., 2022). In what follow we put forward two non-exclusive scenarios to explain this feature. The first one is that the GRB hosts are caught at their transition from the main sequence toward the starburst phase (Michiyama et al., 2021; Hogan et al., 2022; Cheng et al., 2018). The second possibility is that they are [C I]-dark galaxies, which may explain their low [C I]/CO brightness temperature ratio (Jiao et al., 2017; Michiyama et al., 2020).
4.1 Transition To Starburst
Our GRB hosts exhibit lower molecular masses than the best fit to normal galaxies (Fig. 3), similar to merging ULIRGs and high- starbursts. Moderate SFRs (as for the redshift of our GRB hosts) result in distances from their MS in between that measured for intermediate- isolated LIRGs and that for intermediate- and high- starbursts. Estimated depletion times (/SFR) are similar to that of transitioning merger galaxies, while being shorter than intermediate- isolated LIRGs, and isolated transitioning galaxies, and longer (by about an order of magnitude) than the merging intermediate- and high- starburst galaxies (Fig. 4, right panel). The moderate distances from the MS and short depletion times suggest that our GRB hosts are observed in their transition toward the starburst phase. Given the morphology, this increase in SFR is likely caused by mergers. The existence of GRB events indicates that this may be the beginning of such a transition, because the progenitors of GRBs are short-lived stars.
We note that estimated depletion times assume no feedback effects (e.g. energetic winds from massive stars, radiative pressure). These effects have been found to be a possible cause of the enlargement of the time over which starburst galaxies consume their available cold gas reservoirs. In this work we treat all the galaxies in the same manner, i.e. depletion times are estimated without such feedback effects (Semenov et al., 2017; Díaz-García & Knapen, 2020), thus we consider this comparison as valid. Moreover, the depletion times are not used to draw any conclusions about the timescale of running out of gas.
4.2 [C I]-dark Galaxies
The [C I] nondetection may be caused by an underabundance of carbon, rather than low molecular hydrogen mass. This would result in a [C I]-dark object. The [C I]-dark galaxies are characterised by a low [C I]/CO temperature brightness ratio, below 0.1 (Michiyama et al., 2020, 2021), while regular ULIRGs have this ratio not lower than 0.2 (Jiao et al., 2017). These [C I]-dark galaxies have high hydrogen densities between and cm-3, as shown using photodissociation region (PDR) models (Valentino et al., 2020b; Michiyama et al., 2020, 2021).
In standard models of photodissociation regions, CO molecules are efficiently shielded from ultraviolet radiation at the dust extinction above a few mag, which could lead to low abundances of [C I] (Tielens & Hollenbach, 1985). Recent models show, however, that the abundance ratio of [C I] over CO is linked more strongly with the cosmic rays ionization rate rather than the UV radiation field (Bisbas et al., 2017). Nevertheless, [C I] can be considered as a good tracer of H2 gas in mergers, except in the highest-density medium where carbon is locked in CO. Such high densities are indeed commonly detected toward [C I]-dark objects which have undergone a merger event (Michiyama et al., 2020, 2021).
The proposed explanations of transitioning-to-starburst galaxies and [C I]-dark galaxies may be related. The low [C I]/CO line ratio in [C I]-dark galaxies could be an effect of mergers yielding high average density H2 gas reservoirs but with a yet-to-be-fully-ignited starburst, producing lower average cosmic ray energy densities. The combination of high and low cosmic ray energy density can then naturally produce [C I]-dark galaxies, albeit only for short cosmic time intervals. In that regard, it would be interesting to examine whether [C I]-dark galaxies of this type deviate from the far infrared-radio correlation, i.e., with lower synchrotron emission for a given far-infrared luminosity.
The estimated upper limit [C I]/CO temperature brightness ratio of for the GRB 080207 hosts places it in the regime of [C I]-dark galaxies. Very high gas density between and cm-3 have also been inferred for this galaxy using a [C II] marginal detection (Hashimoto et al., 2019), which is consistent with the proposed [C I]-dark nature of the host. Both our GRB hosts have also low [C I] luminosities for their SFRs. In the case of the GRB 060814 host, the [C I] and CO were not detected, so we can not confirm or rule out this interpretation for this galaxy. High gas densities were also claimed for other GRB hosts (Christensen et al., 2008; Michałowski et al., 2014, 2015, 2016; Arabsalmani et al., 2015, 2019, 2020, 2022; de Ugarte Postigo et al., 2020).
Thus, until additional observations (e.g. of HCN to trace the dense gas phase) are available we conclude that both GRB hosts are candidates for [C I]-dark galaxies that are transitioning toward the starburst phase with the merger event being the cause.
4.3 Ruled Out Mechanism: Post-starbursts
In principle, our galaxies might be observed in the post-starburst phase, on the way down from the starburst regime. This would explain their SFRs and low gas content. However, this possibility is inconsistent with the presence of optical emission lines, indicating recent star formation. Furthermore, Balmer absorption features are not detected in the spectra of these GRB hosts (Krühler et al., 2015), unlike for post-starburst galaxies. Post-starburst galaxies have low SFRs and high metallicities, so while it is not impossible (e.g. Rossi et al., 2014; Levan et al., 2023), they are less likely to host a GRB, as opposed to an early starburst phase.
5 Conclusions
Our targets display spectra indicative of a young stellar population and have slightly increased SFRs relative to their MS (Perley et al., 2013; Krühler et al., 2015). Based on our [C I] emission line measurements, we have inferred a molecular gas content similar to that of local ULIRGs but lower than would be expected from the best fit to the normal star-forming galaxies (see Figs. 2 and 3). We propose that these are high- merger systems caught at the transition from the main sequence toward the starburst phase. These are high redshift analogs to the intermediate- transitioning galaxies (Cheng et al., 2018; Hogan et al., 2022). Furthermore, their low [C I]/CO ratio point to a high-density environment observed in the collisional fronts of mergers (Valentino et al., 2020b; Michiyama et al., 2020, 2021). Indeed, the merger signatures have been observed for our GRB hosts (Svensson et al., 2012; Blanchard et al., 2016; Chrimes et al., 2019; Schneider et al., 2022). While such merger-driven starbursts play a lesser role in the overall star-formation rate density at (Rodighiero et al., 2011), these systems may play a crucial role in the quenching and morphological transformation.
To test whether these galaxies indeed contain dense molecular star-forming clouds it would be essential to observe their emission of the high dipole-moment molecule HCN (Gao & Solomon, 2004a). This, however, will be challenging because of the weakness of the HCN line. Additionally, the deep, high-resolution imaging of [C I], and CO (e.g., with the NOEMA interferometer) would be helpful to study the relative location of [C I] and CO, which again is not an easy task considering that both GRB hosts are at .
6 Acknowledgments
We thank the anonymous reviewer for all the comments that helped to improve our work. J.N., M.J.M., M.S. and A.L. acknowledge the support of the National Science Centre, Poland through the SONATA BIS grant 2018/30/E/ST9/00208. This research was funded in whole or in part by National Science Centre, Poland (grant number: 2021/41/N/ST9/02662). J.R.R. acknowledges support by grant PID2019-105552RB-C41 funded by MCIN/AEI/10.13039/501100011033. A.K. acknowledges support from the First TEAM grant of the Foundation for Polish Science No. POIR.04.04.00-00-5D21/18-00 and the Polish National Agency for Academic Exchange grant No. BPN/BEK/2021/1/00319/DEC/1. This article has been supported by the Polish National Agency for Academic Exchange under grant No. PPI/APM/2018/1/00036/U/001. A.R. acknowledges support from the INAF project Premiale Supporto Arizona & Italia. J.H. was supported by a VILLUM FONDEN Investigator grant (project number 16599). Based on observations collected at the European Organisation for Astronomical Research in the Southern Hemisphere under ESO programmes 098.F-9300(A) and 098.D-024 (A). Based on observations with the Atacama Pathfinder EXperiment (APEX) telescope. APEX is a collaboration between the Max Planck Institute for Radio Astronomy, the European Southern Observatory, and the Onsala Space Observatory. Swedish observations on APEX are supported through Swedish Research Council grant No 2017-00648. This work is based on observations carried out under project number 172-16 with the IRAM 30m telescope. IRAM is supported by INSU/CNRS (France), MPG (Germany) and IGN (Spain). The research leading to these results has received funding from the European Union’s Horizon 2020 research and innovation program under grant agreement No 730562 [RadioNet]. This research has made use of the GHostS database (www.GRBhosts.org), which is partly funded by Spitzer/NASA grant RSA Agreement No. 1287913; and the NASA’s Astrophysics Data System Bibliographic Services.
References
- Arabsalmani et al. (2022) Arabsalmani, M., Roychowdhury, S., Renaud, F., et al. 2022, AJ, 164, 69, doi: 10.3847/1538-3881/ac77f5
- Arabsalmani et al. (2015) Arabsalmani, M., Roychowdhury, S., Zwaan, M. A., Kanekar, N., & Michałowski, M. J. 2015, MNRAS, 454, L51, doi: 10.1093/mnrasl/slv118
- Arabsalmani et al. (2019) Arabsalmani, M., Roychowdhury, S., Starkenburg, T. K., et al. 2019, MNRAS, 485, 5411, doi: 10.1093/mnras/stz735
- Arabsalmani et al. (2020) Arabsalmani, M., Renaud, F., Roychowdhury, S., et al. 2020, ApJ, 899, 165, doi: 10.3847/1538-4357/aba3c0
- Astropy Collaboration et al. (2013) Astropy Collaboration, Robitaille, T. P., Tollerud, E. J., et al. 2013, A&A, 558, A33, doi: 10.1051/0004-6361/201322068
- Astropy Collaboration et al. (2018) Astropy Collaboration, Price-Whelan, A. M., Sipőcz, B. M., et al. 2018, AJ, 156, 123, doi: 10.3847/1538-3881/aabc4f
- Belitsky et al. (2006) Belitsky, V., Lapkin, I., Monje, R., et al. 2006, in Society of Photo-Optical Instrumentation Engineers (SPIE) Conference Series, Vol. 6275, Society of Photo-Optical Instrumentation Engineers (SPIE) Conference Series, ed. J. Zmuidzinas, W. S. Holland, S. Withington, & W. D. Duncan, 62750G, doi: 10.1117/12.671383
- Bigiel et al. (2008) Bigiel, F., Leroy, A., Walter, F., et al. 2008, AJ, 136, 2846, doi: 10.1088/0004-6256/136/6/2846
- Bisbas et al. (2017) Bisbas, T. G., van Dishoeck, E. F., Papadopoulos, P. P., et al. 2017, ApJ, 839, 90, doi: 10.3847/1538-4357/aa696d
- Blanchard et al. (2016) Blanchard, P. K., Berger, E., & Fong, W.-f. 2016, ApJ, 817, 144, doi: 10.3847/0004-637X/817/2/144
- Bolatto et al. (2013) Bolatto, A. D., Wolfire, M., & Leroy, A. K. 2013, ARA&A, 51, 207, doi: 10.1146/annurev-astro-082812-140944
- Bourne et al. (2019) Bourne, N., Dunlop, J. S., Simpson, J. M., et al. 2019, MNRAS, 482, 3135, doi: 10.1093/mnras/sty2773
- Brinchmann et al. (2004) Brinchmann, J., Charlot, S., White, S. D. M., et al. 2004, MNRAS, 351, 1151, doi: 10.1111/j.1365-2966.2004.07881.x
- Carilli & Walter (2013) Carilli, C. L., & Walter, F. 2013, ARA&A, 51, 105, doi: 10.1146/annurev-astro-082812-140953
- Carter et al. (2012) Carter, M., Lazareff, B., Maier, D., et al. 2012, A&A, 538, A89, doi: 10.1051/0004-6361/201118452
- Chabrier (2003) Chabrier, G. 2003, ApJ, 586, L133, doi: 10.1086/374879
- Cheng et al. (2018) Cheng, C., Ibar, E., Hughes, T. M., et al. 2018, MNRAS, 475, 248, doi: 10.1093/mnras/stx3183
- Chrimes et al. (2019) Chrimes, A. A., Levan, A. J., Stanway, E. R., et al. 2019, MNRAS, 486, 3105, doi: 10.1093/mnras/stz1039
- Christensen et al. (2008) Christensen, L., Vreeswijk, P. M., Sollerman, J., et al. 2008, A&A, 490, 45, doi: 10.1051/0004-6361:200809896
- Combes et al. (2011) Combes, F., García-Burillo, S., Braine, J., et al. 2011, A&A, 528, A124, doi: 10.1051/0004-6361/201015739
- de Ugarte Postigo et al. (2020) de Ugarte Postigo, A., Thöne, C. C., Martín, S., et al. 2020, A&A, 633, A68, doi: 10.1051/0004-6361/201936668
- Díaz-García & Knapen (2020) Díaz-García, S., & Knapen, J. H. 2020, A&A, 635, A197, doi: 10.1051/0004-6361/201937384
- Dunne et al. (2021) Dunne, L., Maddox, S. J., Vlahakis, C., & Gomez, H. L. 2021, MNRAS, 501, 2573, doi: 10.1093/mnras/staa3526
- Gao & Solomon (2004a) Gao, Y., & Solomon, P. M. 2004a, ApJS, 152, 63, doi: 10.1086/383003
- Gao & Solomon (2004b) —. 2004b, ApJ, 606, 271, doi: 10.1086/382999
- Genzel et al. (2010) Genzel, R., Tacconi, L. J., Gracia-Carpio, J., et al. 2010, MNRAS, 407, 2091, doi: 10.1111/j.1365-2966.2010.16969.x
- Glover & Clark (2012) Glover, S. C. O., & Clark, P. C. 2012, MNRAS, 421, 9, doi: 10.1111/j.1365-2966.2011.19648.x
- Güsten et al. (2006) Güsten, R., Nyman, L. Å., Schilke, P., et al. 2006, A&A, 454, L13, doi: 10.1051/0004-6361:20065420
- Hashimoto et al. (2019) Hashimoto, T., Hatsukade, B., Goto, T., et al. 2019, MNRAS, 488, 5029, doi: 10.1093/mnras/stz2034
- Hatsukade et al. (2014) Hatsukade, B., Ohta, K., Endo, A., et al. 2014, Nature, 510, 247, doi: 10.1038/nature13325
- Heintz & Watson (2020) Heintz, K. E., & Watson, D. 2020, ApJ, 889, L7, doi: 10.3847/2041-8213/ab6733
- Hjorth et al. (2003) Hjorth, J., Sollerman, J., Møller, P., et al. 2003, Nature, 423, 847, doi: 10.1038/nature01750
- Hjorth et al. (2012) Hjorth, J., Malesani, D., Jakobsson, P., et al. 2012, ApJ, 756, 187, doi: 10.1088/0004-637X/756/2/187
- Hogan et al. (2022) Hogan, L., Rigopoulou, D., García-Burillo, S., et al. 2022, MNRAS, 512, 2371, doi: 10.1093/mnras/stac520
- Hunt et al. (2014) Hunt, L. K., Palazzi, E., Michałowski, M. J., et al. 2014, A&A, 565, A112, doi: 10.1051/0004-6361/201323340
- Jiao et al. (2017) Jiao, Q., Zhao, Y., Zhu, M., et al. 2017, ApJ, 840, L18, doi: 10.3847/2041-8213/aa6f0f
- Kennicutt (1998) Kennicutt, Robert C., J. 1998, ARA&A, 36, 189, doi: 10.1146/annurev.astro.36.1.189
- König et al. (2013) König, S., Aalto, S., Muller, S., Beswick, R. J., & Gallagher, J. S. 2013, A&A, 553, A72, doi: 10.1051/0004-6361/201220453
- Krühler et al. (2015) Krühler, T., Malesani, D., Fynbo, J. P. U., et al. 2015, A&A, 581, A125, doi: 10.1051/0004-6361/201425561
- Krumholz (2012) Krumholz, M. R. 2012, ApJ, 759, 9, doi: 10.1088/0004-637X/759/1/9
- Lara-López et al. (2010) Lara-López, M. A., Cepa, J., Bongiovanni, A., et al. 2010, A&A, 521, L53, doi: 10.1051/0004-6361/201014803
- Larson et al. (2016) Larson, K. L., Sanders, D. B., Barnes, J. E., et al. 2016, ApJ, 825, 128, doi: 10.3847/0004-637X/825/2/128
- Lee et al. (2017) Lee, N., Sheth, K., Scott, K. S., et al. 2017, MNRAS, 471, 2124, doi: 10.1093/mnras/stx1753
- Levan et al. (2023) Levan, A. J., Malesani, D. B., Gompertz, B. P., et al. 2023, Nature Astronomy, arXiv:2303.12912, doi: 10.48550/arXiv.2303.12912
- Lu et al. (2017) Lu, N., Zhao, Y., Díaz-Santos, T., et al. 2017, ApJS, 230, 1, doi: 10.3847/1538-4365/aa6476
- Michałowski et al. (2014) Michałowski, M. J., Hunt, L. K., Palazzi, E., et al. 2014, A&A, 562, A70, doi: 10.1051/0004-6361/201322843
- Michałowski et al. (2015) Michałowski, M. J., Gentile, G., Hjorth, J., et al. 2015, A&A, 582, A78, doi: 10.1051/0004-6361/201526542
- Michałowski et al. (2016) Michałowski, M. J., Castro Cerón, J. M., Wardlow, J. L., et al. 2016, A&A, 595, A72, doi: 10.1051/0004-6361/201629441
- Michałowski et al. (2018) Michałowski, M. J., Karska, A., Rizzo, J. R., et al. 2018, A&A, 617, A143, doi: 10.1051/0004-6361/201833250
- Michiyama et al. (2020) Michiyama, T., Ueda, J., Tadaki, K.-i., et al. 2020, ApJ, 897, L19, doi: 10.3847/2041-8213/ab9d28
- Michiyama et al. (2021) Michiyama, T., Saito, T., Tadaki, K.-i., et al. 2021, ApJS, 257, 28, doi: 10.3847/1538-4365/ac16df
- Nadolny et al. (2021) Nadolny, J., Bongiovanni, Á., Cepa, J., et al. 2021, A&A, 647, A89, doi: 10.1051/0004-6361/202037861
- Noeske et al. (2007) Noeske, K. G., Weiner, B. J., Faber, S. M., et al. 2007, ApJ, 660, L43, doi: 10.1086/517926
- Papadopoulos et al. (2004) Papadopoulos, P. P., Thi, W. F., & Viti, S. 2004, MNRAS, 351, 147, doi: 10.1111/j.1365-2966.2004.07762.x
- Perley et al. (2013) Perley, D. A., Levan, A. J., Tanvir, N. R., et al. 2013, ApJ, 778, 128, doi: 10.1088/0004-637X/778/2/128
- Perley et al. (2015) Perley, D. A., Perley, R. A., Hjorth, J., et al. 2015, ApJ, 801, 102, doi: 10.1088/0004-637X/801/2/102
- Pety (2005) Pety, J. 2005, in SF2A-2005: Semaine de l’Astrophysique Francaise, ed. F. Casoli, T. Contini, J. M. Hameury, & L. Pagani, 721
- Phillips & Huggins (1981) Phillips, T. G., & Huggins, P. J. 1981, ApJ, 251, 533, doi: 10.1086/159494
- Rodighiero et al. (2011) Rodighiero, G., Daddi, E., Baronchelli, I., et al. 2011, ApJ, 739, L40, doi: 10.1088/2041-8205/739/2/L40
- Rossi et al. (2014) Rossi, A., Piranomonte, S., Savaglio, S., et al. 2014, A&A, 572, A47, doi: 10.1051/0004-6361/201423865
- Saintonge & Catinella (2022) Saintonge, A., & Catinella, B. 2022, Annual Review of Astronomy and Astrophysics, 60, 319, doi: 10.1146/annurev-astro-021022-043545
- Schawinski et al. (2014) Schawinski, K., Urry, C. M., Simmons, B. D., et al. 2014, MNRAS, 440, 889, doi: 10.1093/mnras/stu327
- Schneider et al. (2022) Schneider, B., Le Floc’h, E., Arabsalmani, M., Vergani, S. D., & Palmerio, J. T. 2022, A&A, 666, A14, doi: 10.1051/0004-6361/202243367
- Semenov et al. (2017) Semenov, V. A., Kravtsov, A. V., & Gnedin, N. Y. 2017, The Astrophysical Journal, 845, 133, doi: 10.3847/1538-4357/aa8096
- Shangguan et al. (2019) Shangguan, J., Ho, L. C., Li, R., et al. 2019, ApJ, 870, 104, doi: 10.3847/1538-4357/aaf21a
- Shi et al. (2018) Shi, Y., Yan, L., Armus, L., et al. 2018, ApJ, 853, 149, doi: 10.3847/1538-4357/aaa3e6
- Solomon et al. (1997) Solomon, P. M., Downes, D., Radford, S. J. E., & Barrett, J. W. 1997, ApJ, 478, 144, doi: 10.1086/303765
- Speagle et al. (2014) Speagle, J. S., Steinhardt, C. L., Capak, P. L., & Silverman, J. D. 2014, ApJS, 214, 15, doi: 10.1088/0067-0049/214/2/15
- Stanek et al. (2003) Stanek, K. Z., Matheson, T., Garnavich, P. M., et al. 2003, ApJ, 591, L17, doi: 10.1086/376976
- Svensson et al. (2012) Svensson, K. M., Levan, A. J., Tanvir, N. R., et al. 2012, MNRAS, 421, 25, doi: 10.1111/j.1365-2966.2011.19811.x
- Tielens & Hollenbach (1985) Tielens, A. G. G. M., & Hollenbach, D. 1985, ApJ, 291, 722, doi: 10.1086/163111
- Valentino et al. (2018) Valentino, F., Magdis, G. E., Daddi, E., et al. 2018, ApJ, 869, 27, doi: 10.3847/1538-4357/aaeb88
- Valentino et al. (2020a) Valentino, F., Daddi, E., Puglisi, A., et al. 2020a, A&A, 641, A155, doi: 10.1051/0004-6361/202038322
- Valentino et al. (2020b) Valentino, F., Magdis, G. E., Daddi, E., et al. 2020b, ApJ, 890, 24, doi: 10.3847/1538-4357/ab6603
- Vassilev et al. (2008) Vassilev, V., Meledin, D., Lapkin, I., et al. 2008, A&A, 490, 1157, doi: 10.1051/0004-6361:200810459
- Weiß et al. (2003) Weiß, A., Henkel, C., Downes, D., & Walter, F. 2003, A&A, 409, L41, doi: 10.1051/0004-6361:20031337
- Wong & Blitz (2002) Wong, T., & Blitz, L. 2002, ApJ, 569, 157, doi: 10.1086/339287