Is Fine-tuning Needed? Pre-trained Language Models Are Near Perfect for Out-of-Domain Detection
Abstract
Out-of-distribution (OOD) detection is a critical task for reliable predictions over text. Fine-tuning with pre-trained language models has been a de facto procedure to derive OOD detectors with respect to in-distribution (ID) data. Despite its common use, the understanding of the role of fine-tuning and its necessity for OOD detection is largely unexplored. In this paper, we raise the question: is fine-tuning necessary for OOD detection? We present a study investigating the efficacy of directly leveraging pre-trained language models for OOD detection, without any model fine-tuning on the ID data. We compare the approach with several competitive fine-tuning objectives, and offer new insights under various types of distributional shifts. Extensive evaluations on 8 diverse ID-OOD dataset pairs demonstrate near-perfect OOD detection performance (with 0% FPR95 in many cases), strongly outperforming its fine-tuned counterparts. We show that using distance-based detection methods, pre-trained language models are near-perfect OOD detectors when the distribution shift involves a domain change. Furthermore, we study the effect of fine-tuning on OOD detection and identify how to balance ID accuracy with OOD detection performance. Our code is publically available111https://github.com/Uppaal/lm-ood.
Is Fine-tuning Needed? Pre-trained Language Models Are Near Perfect for Out-of-Domain Detection
Rheeya Uppaal1 Junjie Hu1,2 Yixuan Li1 1Department of Computer Sciences, 2Department of Biostatistics and Medical Informatics University of Wisconsin-Madison {uppaal, jhu, sharonli}@cs.wisc.edu
1 Introduction
Despite recent successes, high-performing pre-trained language models are still fragile under distribution shifts, making their applications to the real world challenging Ribeiro et al. (2020). In most real-world settings, the train and test distributions are often not independent and identically distributed. Furthermore, test distributions are often non-stationary and can change over time. The problem of out-of-distribution (OOD) detection addresses the identification of anomalous data, enabling the model to abstain from prediction when it is not supposed to. This is especially important for high-risk settings like financial and medical applications, where unreliable predictions could incur great costs Ulmer et al. (2020); Zhang et al. (2021).
In literature, a de facto procedure is to fine-tune a pre-trained language model on the in-distribution (ID) data222Note that the ID data is defined w.r.t. the downstream dataset of interest, not the pre-training data., and then derive the OOD detector based on the adapted model Zhou et al. (2021); Hendrycks et al. (2020); Xu et al. (2021). The fine-tuned model is hypothesized to produce embeddings that are customized to the ID data. Thus, prior work focuses on the design of fine-tuning and expects the adapted representations to be more useful for OOD detection. Despite its common use, the understanding of the role of fine-tuning and its necessity for OOD detection is largely lacking in the field.
Motivated by this, we revisit the common procedure and raise the unexplored question: is fine-tuning necessary at all, for OOD detection? To answer this question, we introduce a simple and effective procedure for OOD detection, which does not require any model fine-tuning on the ID data. Specifically, we explore distance-based metrics for detection, which measure the relative distances of samples in the representation space of a pre-trained language model. The operating hypothesis is that embeddings of ID samples are closer to each other than the OOD sample embeddings. To the best of our knowledge, we are the first to explore distance-based OOD detection methods directly on a pre-trained language model, rather than the fine-tuned models adopted in previous works.
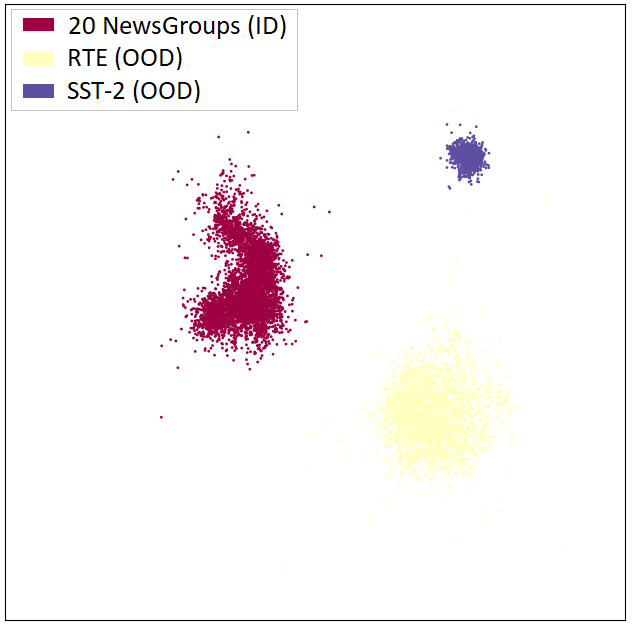
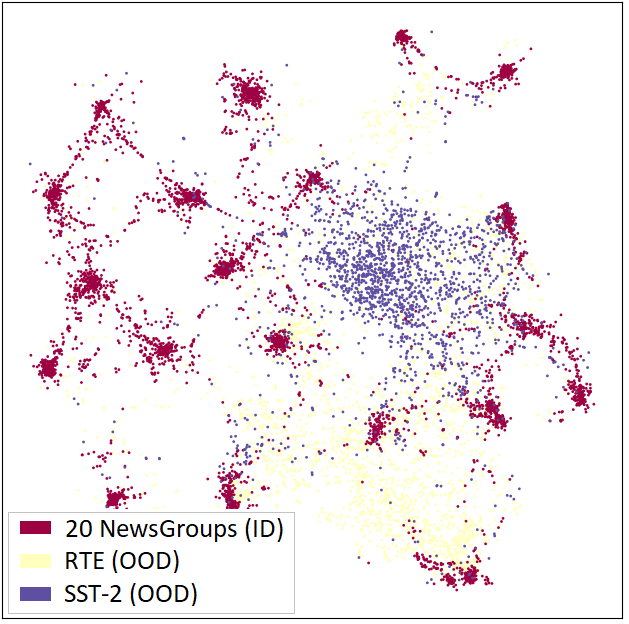
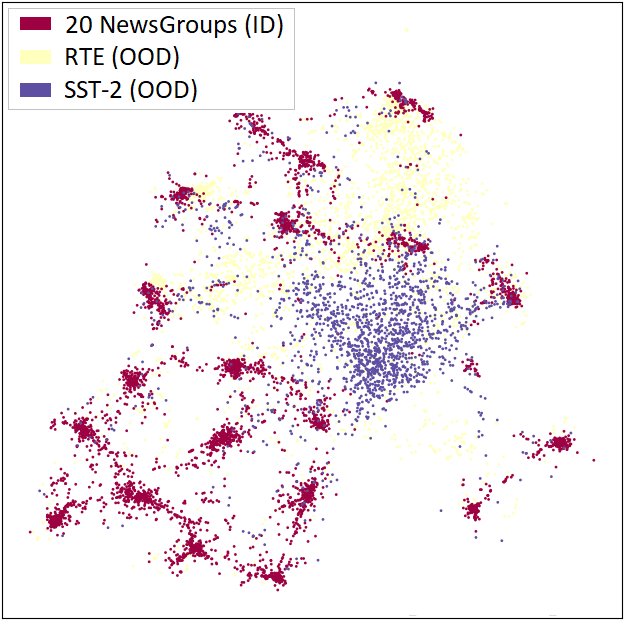
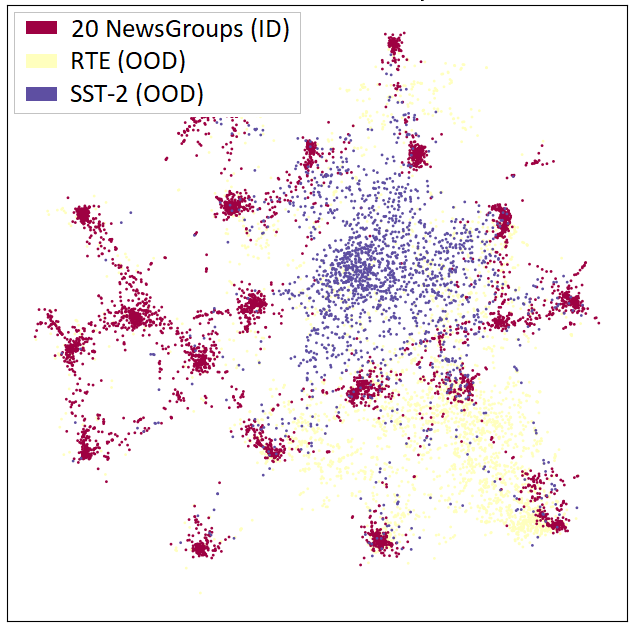
We show that our method based on a pre-trained language model achieves near-perfect performance in detecting out-of-domain shifts, favorably outperforming its fine-tuned counterparts. For example, for 20NewsGroups (ID) vs. RTE (OOD), OOD detection with the best fine-tuning loss Khosla et al. (2020) yields an FPR95 of 24.8%, while a pre-trained language model can perfectly detect RTE as OOD with 0% FPR95. For comprehensive evaluations, we experiment on 8 diverse ID-OOD dataset pairs spanning semantic and background shifts, and show that the strong performance of using the pre-trained model holds consistently. To better understand the strong performance, we further show that pre-trained models display strongly separated domain clusters, both qualitatively and quantitatively. The strong separation of domain clusters leads to the efficacy of distance-based OOD detection.
Even further, we systematically compare different fine-tuning objectives, and interestingly observe that the performance of distance-based OOD detection declines over the course of fine-tuning across all objectives, despite the increase in ID classification accuracy. To this end, we provide new insights that early stopping Yao et al. (2007) can be a promising solution, if one desires a good tradeoff between OOD detection and ID classification performance.
Our contributions can be summarized as follows:
-
1.
We propose a simple and effective method for zero-shot333We use the term “zero-shot” to refer to a setting where no (ID or OOD) data is used to update the model parameters. OOD detection, leveraging pre-trained language models without fine-tuning on the ID data. Extensive experiments demonstrate its near-perfect performance (with 0% FPR95 in most cases), favorably outperforming its fine-tuned counterparts.
-
2.
We conduct a comprehensive study to understand fine-tuning objectives and their impact on OOD detection. We offer new insights on their efficacy under various types of distribution shifts.
-
3.
We perform qualitative and quantitative analysis on the embedding characteristics, explaining the strong performance of using a pre-trained language model for OOD detection.
2 Preliminaries
OOD Detection
For a supervised multi-class classification task, the labeled training dataset consists of samples from the joint distribution , where is the input space and is the label space. Given a test-time sample , OOD detection aims to identify whether is in-distribution (ID) or not, where is the marginal of on . Formally, we denote the OOD detector as a binary function mapping .
Types of Distribution Shifts
Arora et al. (2021) categorize OOD samples by the type of distribution shift they exhibit in NLP problems. According to Ren et al. (2019), the representations can be decomposed into two independent and disjoint components—semantic features and background features. Semantic features are discriminative and strongly correlated with labels for prediction, while background features contain population-level statistics and are invariant across labels.
Based on the type of features in OOD samples, the distribution shift is categorized as semantic shift or background shift. An example of the semantic shift is the open-set classification problem that encounters novel classes at test time Scheirer et al. (2012), where the semantic of is outside the support of . Background shift is often seen when the domain or style of texts changes in the input space while remains the same Pavlick and Tetreault (2016). We comprehensively consider both types of shifts later in our experiments in Section 4.
3 Methodology
In Section 3.1, we start by introducing OOD detection with pre-trained language models, which does not require any model fine-tuning on the ID dataset. We further consider OOD detection with model fine-tuning in Section 3.2.
3.1 OOD Detection with Pre-trained Models
We consider a pre-trained language model backbone , which encodes an input to a -dimensional text embedding .
The goal of OOD detection is to identify samples that do not belong to . Note that the ID data is defined w.r.t. the downstream dataset of interest, instead of the pre-training data. Different from prior works, there is no fine-tuning/training on the ID samples, and the setup is thus labelled as zero-shot OOD detection.
We formulate the zero-shot OOD detector as a binary function mapping:
| (1) |
where is the OOD scoring function, and is the threshold. By convention, is chosen so that a high fraction of ID data (e.g., 95%) is above the threshold. We describe in details next.
We employ distance-based methods for zero-shot OOD detection, which measure the relative distances of samples in representation space. To the best of our knowledge, we are the first to use distance-based OOD detection directly with a pre-trained language model, while previous works use models adapted to the ID data. The operating hypothesis is that the embeddings of ID samples are closer to each other than the OOD sample embeddings. Modeling the learned representation space as a mixture of multivariate Gaussians, Lee et al. (2018) used the Maximum Mahalanobis distance Mahalanobis (2018) to all class centroids as the score for OOD detection:
where is the covariance matrix and is the mean embedding of class . Both and are estimated on the ID embeddings extracted from the pre-trained language model .
Using Mahalanobis distance for OOD detection requires some distributional assumptions on the representation space. This is circumvented through non-parametric density estimation using nearest neighbors Sun et al. (2022). The distance between a query point and its -th nearest neighbor in the ID data is used for OOD detection:
where and are the normalized embeddings, for the query point and its -th nearest neighbor. In Section 5, we evaluate zero-shot OOD detection performance using both parametric (Maha) and non-parametric (KNN) distance functions.
3.2 OOD Detection with Fine-tuning
In contrast to the zero-shot OOD detection setup, an alternative strategy is to fine-tune the model on the ID dataset and then perform OOD detection w.r.t. the fine-tuned model. In what follows, we comprehensively consider three different fine-tuning objectives: (1) cross-entropy loss, (2) task-adaptive pretraining loss, and (3) supervised contrastive loss.
Cross-Entropy (CE)
The cross-entropy loss is widely used for training neural networks, making it an ideal baseline for our study. Given a pre-trained model, we fine-tune with the CE loss:
where is the logit output corresponding to the ground truth label , and is the parameterization of the neural network.
Task-adaptive Pretraining (TAPT)
Gururangan et al. (2020) show that multi-phase adaptive pretraining boosts downstream task performance of pre-trained language models. They introduce Task Adaptive Pre-Training (TAPT), which involves extending the unsupervised pre-training process (using the masked language modeling objective Kenton and Toutanova (2019)) with data for the downstream task, before fine-tuning to the same task using cross-entropy. TAPT improves generalization capabilities by providing a strong initialization for fine-tuning, and to the best of our knowledge, TAPT has not been used in the setting of OOD detection prior to our work.
Supervised Contrastive Learning (SupCon)
By leveraging information on labels and increasing the number of positive pairs during contrastive training, SupCon Khosla et al. (2020) has been shown to consistently outperform cross-entropy on large-scale classification tasks Gunel et al. (2020). The objective encourages embeddings of a class to be highly separated from other classes, boosting the performance of OOD detection on text classification tasks Zhou et al. (2021). Formally,
where is the set of anchor instances from the same class as , is the set of all anchor instances, is the normalized sentence embedding for , and is the temperature.
After fine-tuning, OOD detection is performed using a similar procedure as Equation 1, except that the scoring function is calculated using the fine-tuned model. While our primary focus is distance-based detection, we additionally consider two common output-based methods—maximum softmax probability (MSP) Hendrycks and Gimpel (2017) and energy score Liu et al. (2020). They derive OOD scores from the confidence or logits from the classification head of the model.
4 Experimental Setup
Datasets
We adopt the benchmark in Hendrycks et al. (2020) and Zhou et al. (2021), examining 9 diverse ID-OOD dataset pairs. Specifically, we use the IMDB dataset Maas et al. (2011) and SST-2 Socher et al. (2013) on sentiment analysis, the 20NewsGroups (20NG) dataset Lang (1995) on topic classification, the RTE Wang et al. (2018) and MNLI Williams et al. (2018) on natural language inference, the English side of Multi30k Elliott et al. (2016) on machine translation, the cross-intent dataset CLINC150 Larson et al. (2019), and the NewsCategory multiclass classification dataset Misra (2018). Details of the data preparation are described in Appendix A.
With these datasets, we examine two main settings: out-of-domain (OoD) shift where ID and OOD examples come from different datasets (i.e., domains), and same-domain (SD) shift where ID and OOD examples come from the same domain but have disjoint sets of classes. In the OoD setting, we further categorize the ID-OOD pairs into the semantic shift and background shift. Particularly, IMDB and SST-2 are both sentiment analysis datasets that have the same set of classes but consist of examples from different domains. In the same-domain setting, we split the NewsCategory dataset, where we make disjoint sets of classes as ID and OOD (Appendix A).
| Settings | ID | OOD |
|---|---|---|
| OoD: Semantic Shift | 20NewsGroups | SST-2, MNLI, RTE, Multi30K |
| IMDB, NewsCategory, CLINC150 | ||
| OoD: Background Shift | IMDB | SST-2 |
| Same Domain Shift | NewsCategory-ID | NewsCategory-OOD |
| KNN (non-parametric) | Mahalanobis (parametric) | ||||||||
| IDOOD Pair | Training | AUROC ↑ | AUPR (In) ↑ | AUPR (Out) ↑ | FPR95 ↓ | AUROC ↑ | AUPR (In) ↑ | AUPR (Out) ↑ | FPR95 ↓ |
| Out-of-Domain: Semantic Shift | |||||||||
| Zhou et al. | 0.935 | 0.982 | 0.664 | 0.713 | 0.978 | 0.994 | 0.865 | 0.015 | |
| CE | 0.973 | 0.991 | 0.923 | 0.155 | 0.981 | 0.994 | 0.942 | 0.087 | |
| 20NGSST-2 | TAPT | 0.969 | 0.990 | 0.903 | 0.169 | 0.981 | 0.994 | 0.939 | 0.088 |
| SupCon | 0.969 | 0.990 | 0.909 | 0.180 | 0.980 | 0.994 | 0.943 | 0.094 | |
| Pre-trained | 1.000 | 1.000 | 1.000 | 0.000 | 1.000 | 1.000 | 1.000 | 0.000 | |
| Zhou et al. | 0.935 | 0.929 | 0.950 | 0.718 | 0.964 | 0.955 | 0.978 | 0.224 | |
| CE | 0.954 | 0.898 | 0.984 | 0.263 | 0.968 | 0.925 | 0.989 | 0.166 | |
| 20NGMNLI | TAPT | 0.950 | 0.887 | 0.982 | 0.263 | 0.964 | 0.910 | 0.988 | 0.175 |
| SupCon | 0.954 | 0.899 | 0.984 | 0.265 | 0.970 | 0.932 | 0.990 | 0.156 | |
| Pre-trained | 1.000 | 0.999 | 1.000 | 0.000 | 1.000 | 0.999 | 1.000 | 0.000 | |
| Zhou et al. | 0.934 | 0.972 | 0.780 | 0.594 | 0.956 | 0.981 | 0.860 | 0.312 | |
| CE | 0.922 | 0.958 | 0.858 | 0.410 | 0.945 | 0.970 | 0.902 | 0.285 | |
| 20NGRTE | TAPT | 0.898 | 0.942 | 0.822 | 0.455 | 0.919 | 0.952 | 0.869 | 0.352 |
| SupCon | 0.923 | 0.959 | 0.858 | 0.393 | 0.952 | 0.975 | 0.914 | 0.248 | |
| Pre-trained | 1.000 | 1.000 | 0.999 | 0.000 | 1.000 | 1.000 | 0.999 | 0.000 | |
| Zhou et al. | 0.954 | 0.823 | 0.993 | 0.261 | 0.969 | 0.867 | 0.996 | 0.144 | |
| CE | 0.951 | 0.804 | 0.993 | 0.292 | 0.961 | 0.817 | 0.995 | 0.206 | |
| 20NGIMDB | TAPT | 0.955 | 0.797 | 0.994 | 0.227 | 0.965 | 0.804 | 0.995 | 0.159 |
| SupCon | 0.958 | 0.826 | 0.994 | 0.234 | 0.970 | 0.852 | 0.996 | 0.150 | |
| Pre-trained | 0.988 | 0.970 | 0.998 | 0.019 | 0.990 | 0.975 | 0.998 | 0.012 | |
| Zhou et al. | 0.932 | 0.977 | 0.708 | 0.851 | 0.980 | 0.993 | 0.888 | 0.005 | |
| CE | 0.949 | 0.976 | 0.898 | 0.264 | 0.962 | 0.982 | 0.920 | 0.175 | |
| 20NGMulti30K | TAPT | 0.940 | 0.970 | 0.886 | 0.258 | 0.956 | 0.978 | 0.922 | 0.167 |
| SupCon | 0.937 | 0.969 | 0.887 | 0.294 | 0.955 | 0.977 | 0.918 | 0.201 | |
| Pre-trained | 1.000 | 1.000 | 1.000 | 0.000 | 1.000 | 1.000 | 1.000 | 0.000 | |
| Zhou et al. | 0.928 | 0.921 | 0.937 | 0.765 | 0.955 | 0.948 | 0.969 | 0.383 | |
| CE | 0.939 | 0.877 | 0.977 | 0.339 | 0.957 | 0.905 | 0.984 | 0.234 | |
| 20NGNewsCategory | TAPT | 0.931 | 0.853 | 0.973 | 0.343 | 0.947 | 0.874 | 0.981 | 0.243 |
| SupCon | 0.938 | 0.877 | 0.976 | 0.354 | 0.962 | 0.919 | 0.986 | 0.219 | |
| Pre-trained | 1.000 | 0.999 | 1.000 | 0.000 | 1.000 | 0.999 | 1.000 | 0.000 | |
| Zhou et al. | 0.952 | 0.992 | 0.601 | 0.388 | 0.988 | 0.998 | 0.870 | 0.005 | |
| CE | 0.953 | 0.991 | 0.816 | 0.247 | 0.964 | 0.993 | 0.844 | 0.189 | |
| 20NGCLINC150 | TAPT | 0.944 | 0.989 | 0.769 | 0.296 | 0.959 | 0.992 | 0.830 | 0.213 |
| SupCon | 0.940 | 0.988 | 0.761 | 0.343 | 0.957 | 0.992 | 0.821 | 0.230 | |
| Pre-trained | 1.000 | 1.000 | 1.000 | 0.000 | 1.000 | 1.000 | 1.000 | 0.000 | |
| Out-of-Domain: Background Shift | |||||||||
| CE | 0.865 | 0.994 | 0.147 | 0.741 | 0.893 | 0.996 | 0.231 | 0.618 | |
| IMDB SST-2 | TAPT | 0.857 | 0.994 | 0.137 | 0.746 | 0.877 | 0.995 | 0.172 | 0.683 |
| SupCon | 0.838 | 0.993 | 0.119 | 0.824 | 0.865 | 0.995 | 0.149 | 0.800 | |
| Pre-trained | 0.967 | 0.999 | 0.582 | 0.210 | 0.996 | 1.000 | 0.860 | 0.004 | |
| Same Domain Shift | |||||||||
| CE | 0.925 | 0.922 | 0.933 | 0.465 | 0.877 | 0.815 | 0.912 | 0.467 | |
| NewsCategory-ID | TAPT | 0.918 | 0.917 | 0.924 | 0.513 | 0.876 | 0.822 | 0.907 | 0.502 |
| NewsCategory-OOD | SupCon | 0.925 | 0.922 | 0.933 | 0.465 | 0.877 | 0.815 | 0.912 | 0.467 |
| Pre-trained | 0.816 | 0.839 | 0.806 | 0.845 | 0.550 | 0.458 | 0.628 | 0.939 | |
Models
We use RoBERTa Liu et al. (2019), which is a commonly used pre-trained language model like BERT Kenton and Toutanova (2019). Both models have been used in prior work on OOD detection Podolskiy et al. (2021); Hendrycks et al. (2020), but we choose RoBERTa as the diverse data it is pre-trained on has been shown to make it stronger for OOD detection Zhou et al. (2021); Podolskiy et al. (2021); Hendrycks et al. (2020). We use embeddings of the beginning-of-sentence (BOS) token as the sentence representation, and compare this to alternate approaches in Appendix C. Following Zhou et al. (2021), we fine-tune RoBERTa-base on downstream datasets for 10 epochs. For SupCon, we use a joint objective with Cross Entropy, with weight to the SupCon loss. For TAPT, we pre-train the model for 3 epochs on the ID data. For distance-based OOD detection, we use sentence embeddings from the penultimate layer. We fine-tune all layers using Adam, with batch size 4, learning rate , and weight decay . Further details of implementation and configurations are in Appendix G.
Evaluation Metrics
We report the following standard metrics: (1) the false positive rate (FPR95) of OOD samples when the true positive rate of ID samples is at 95%, (2) the area under the receiver operating characteristic curve (AUROC), (3) the area under the precision-recall curve (AUPR), and (4) ID classification accuracy (ID ACC).
5 Results and Analysis
5.1 Out-of-domain detection with pre-trained language models is near perfect
Table 2 shows the pre-trained model outperforming all its fine-tuned variants in the out-of-domain shift setting, and achieving near-perfect OOD detection on all ID-OOD pairs considered. In addition to comparisons with three fine-tuning objectives, we also compare with a competitive baseline proposed by Zhou et al. (2021), which fine-tunes a model with a novel contrastive objective. Taking 20NewsGroups (ID) vs. RTE (OOD) as an example, OOD detection with the best fine-tuning strategy (i.e., SupCon) yields an FPR95 of 24.8%. In sharp contrast, zero-shot OOD detection using the pre-trained language model can perfectly detect RTE as OOD with 0% FPR95. We investigate same-domain shift in-depth later in Section 5.3.
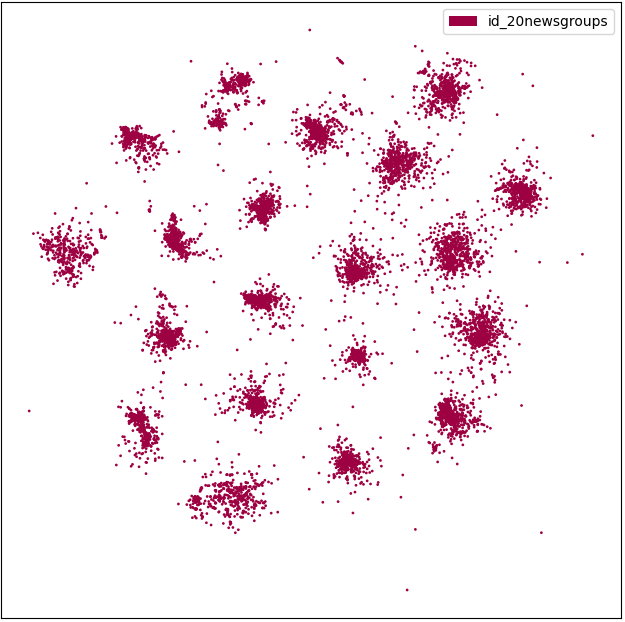
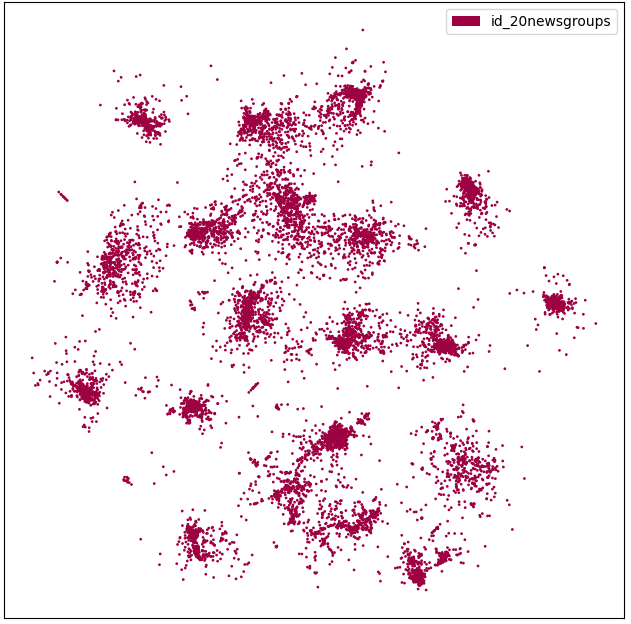
Figure 1 sheds some light on the strong performance of pre-trained language models for out-of-domain detection. In the leftmost figure, we observe that large pre-trained language models create separate domain clusters of sentence embeddings for ID and OOD data, matching the findings of Aharoni and Goldberg (2020). The strong separation of clusters boosts the performance of distance-based OOD detection. In contrast, fine-tuning induces a model to divide a single domain cluster into multiple class clusters. When a fine-tuned model encounters an OOD datapoint, it attempts to classify it by mapping it to one of the existing ID class clusters. However, due to the distributional difference of the datapoint, the model is unable to perfectly map such a point and OOD points end up in the space between the ID class clusters most similar to it. Fine-tuned representations of the data thus make distance-based OOD detection more challenging.
5.2 What’s the best way of fine-tuning for OOD detection?
While pre-trained models show strong out-of-domain detection performance, they lack the classification ability on the ID dataset. This is expected since the models are not optimized for the downstream classification task. Thus, we raise the next question: How can we fine-tune the model to accurately classify ID data while having reasonable OOD detection performance?
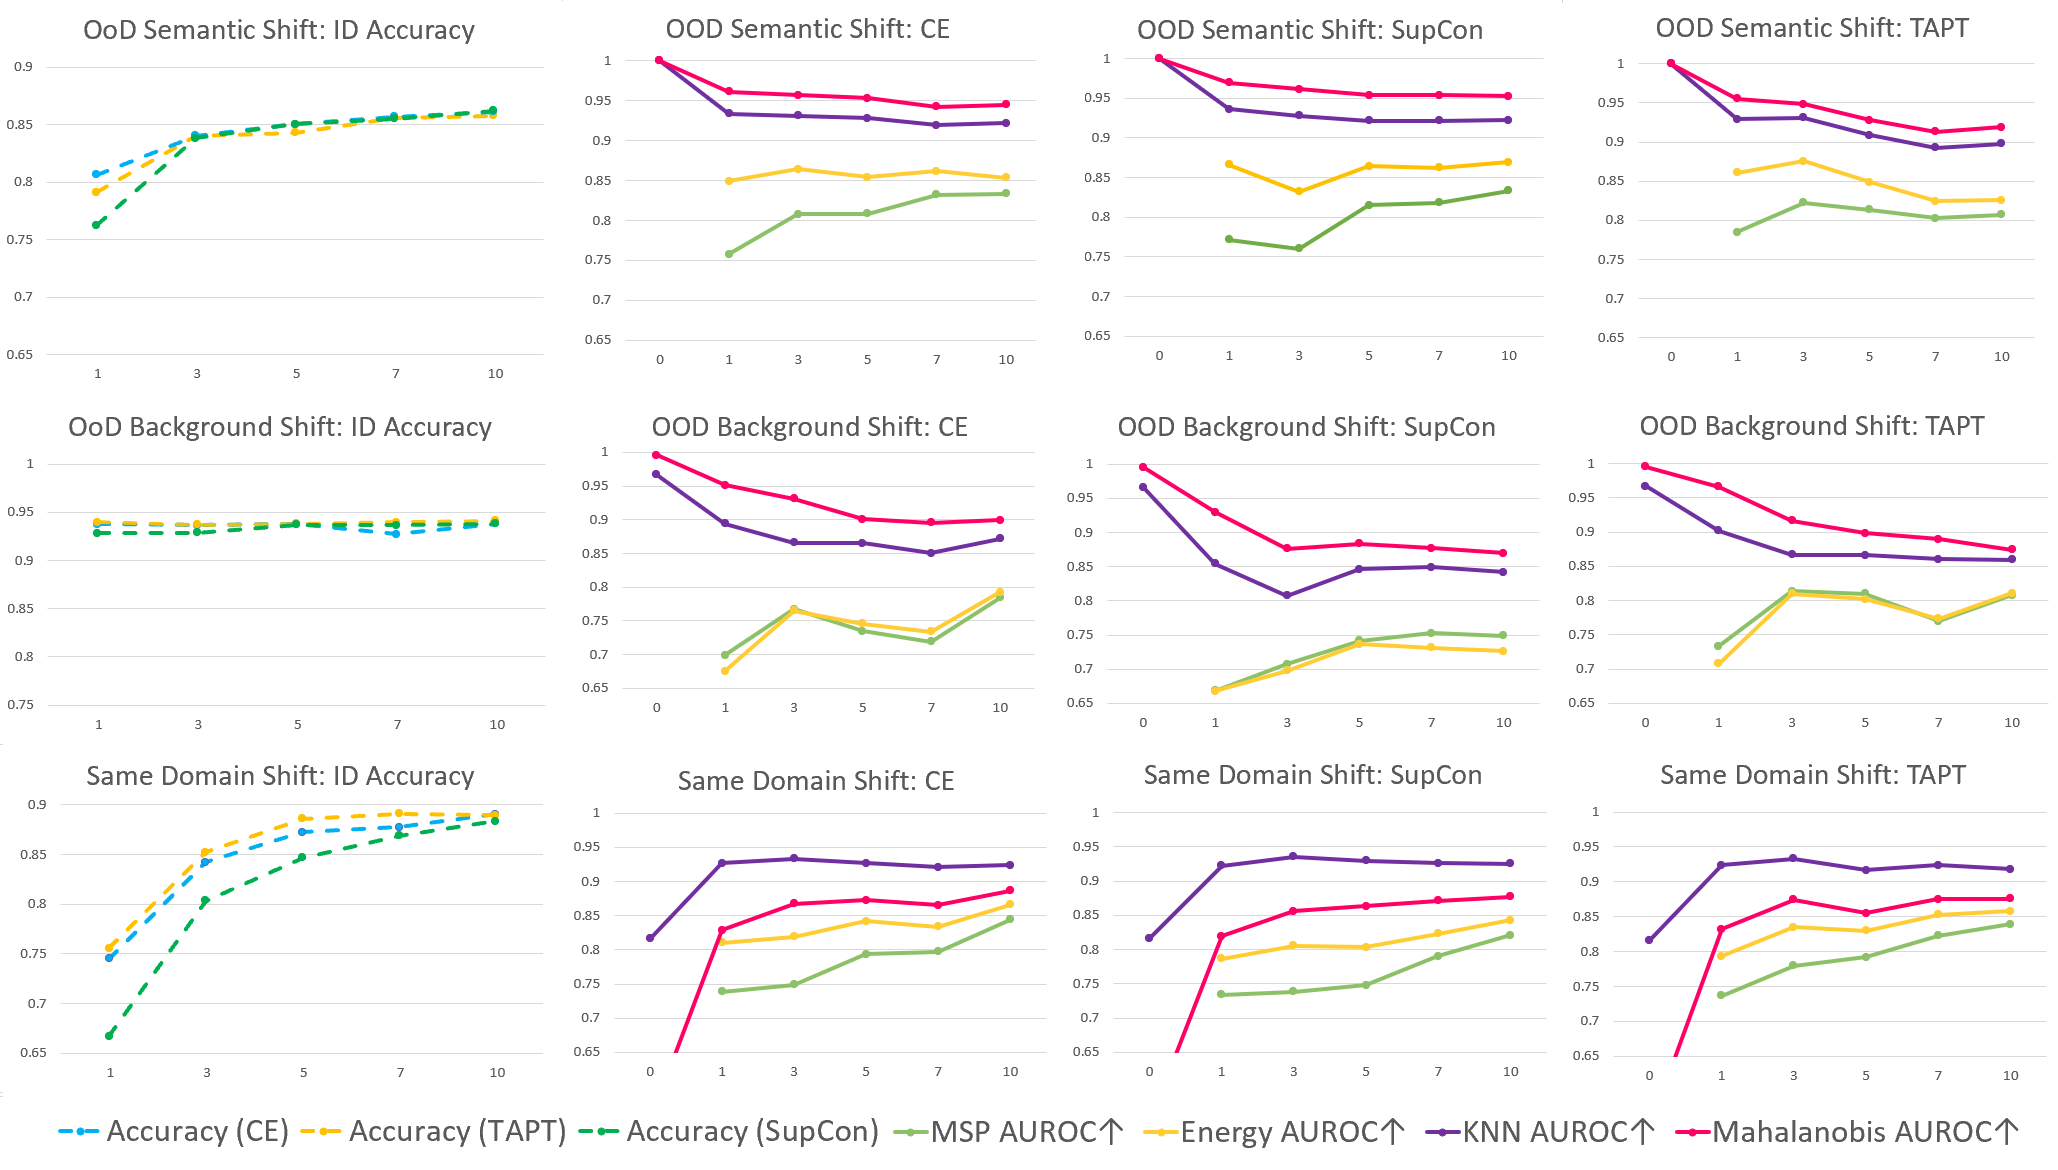
To answer this question, we comprehensively compare three fine-tuning objectives (c.f. Section 3.2), coupled with different OOD detection methods. Figure 2 depicts the effect of fine-tuning for OOD detection, for both semantic shift (top: 20NewsGroups vs. RTE) and background shift (middle: IMDB vs. SST-2). We highlight three key observations: (1) For distance-based methods, the OOD detection performance worsens as the number of fine-tuning epochs increases, highlighting that early stopping is the key to strong OOD detection performance. For example, on 20NewsGroups (ID) vs. RTE (OOD), the model trained with TAPT for 1 epoch yields an AUROC of 95.5% (with Mahalanobis), which declines to 91.9% after 10 epochs of fine-tuning. To the best of our knowledge, we are the first to show the importance of early stopping on fine-tuning language models for distance-based OOD detection. (2) Irrespective of the fine-tuning objectives, distance-based OOD detection methods consistently outperform output-based methods, particularly MSP using softmax confidence Hendrycks and Gimpel (2017) and energy score using logits Liu et al. (2020). (3) Under semantic shift, out-of-domain detection using any of the three fine-tuning objectives displays similar performance on most ID-OOD pairs, bearing a large gap w.r.t. the pre-trained language model.
Linear Probing is Suboptimal
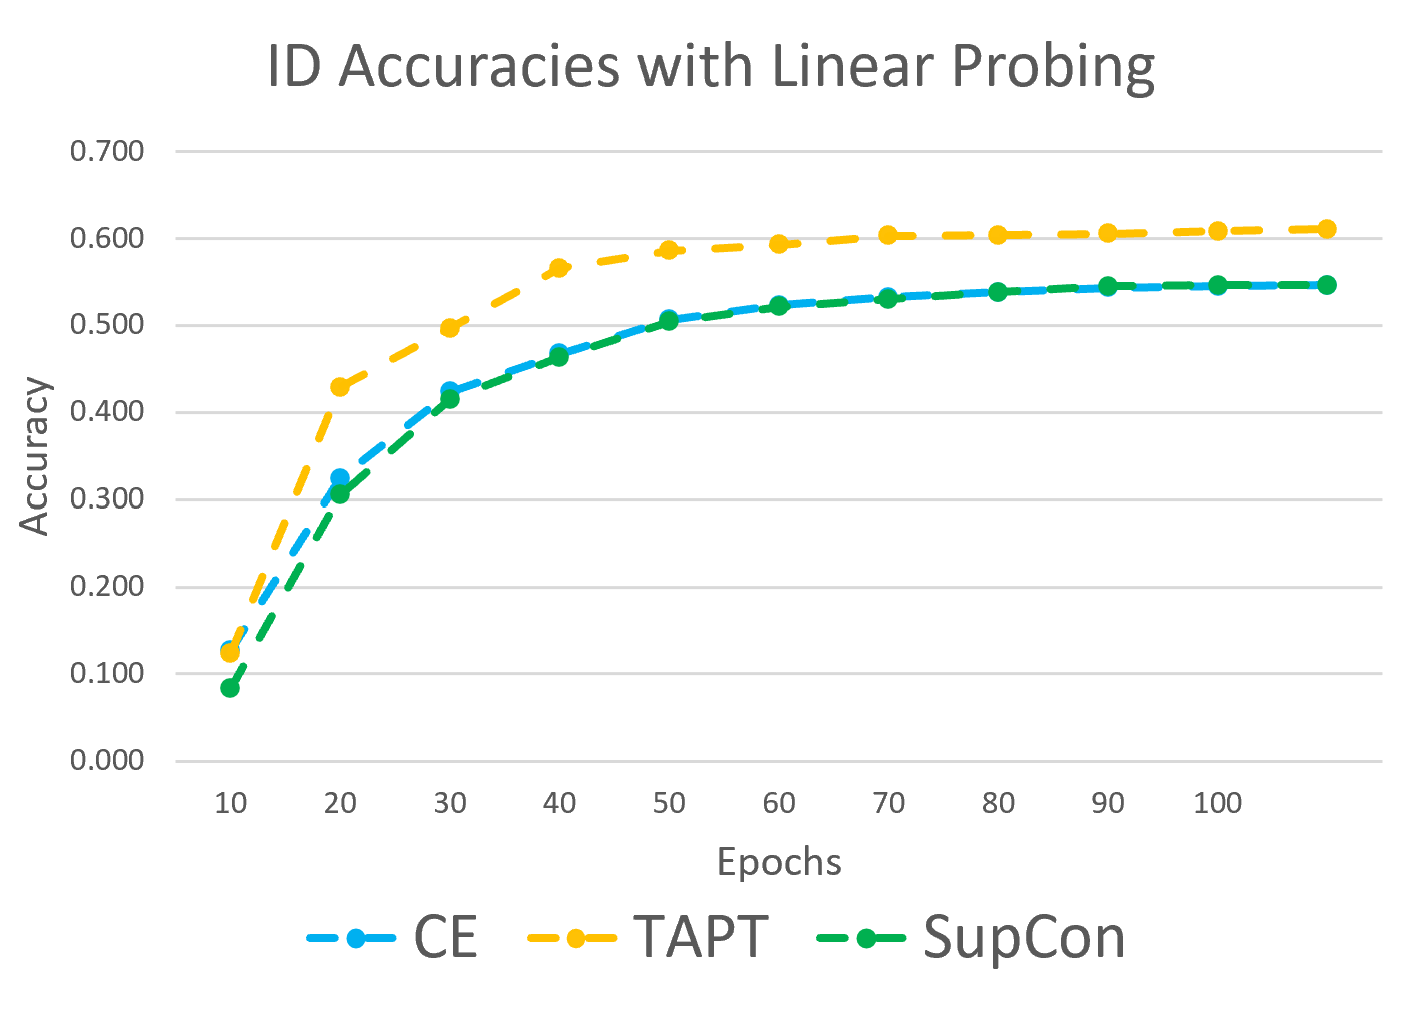
To perform classification while preserving the OOD detection performance of a pre-trained model, one possible solution is linear probing Alain and Bengio (2016), i.e., fine-tuning the classification head to the downstream task, while keeping the weights of the pre-trained model backbone unchanged. However, in Figure 6 (Appendix), we show that linear probing does not yield competitive classification performance. In particular, we observe the strongest fine-tuning objective (TAPT) only obtains an ID accuracy of 61% after 100 epochs of fine-tuning, compared to full network fine-tuning where an accuracy of 86% is achieved in 10 epochs.
5.3 Investigation on same-domain data shifts
In this subsection, we further investigate a more challenging type of data shift, where the test samples are from the same domain and thus can be distributionally very close to the ID data. This is in contrast to our evaluations in Sections 5.1 and 5.2, where the OOD samples are from different domains. To simulate same-domain shifts, we split the NewsCategory dataset into two sets with disjoint classes: one for ID, and another for OOD. The domain for both sets of classes is identical, while the semantic label sets are different. The allocation of classes is described in Table 5 (Appendix A).
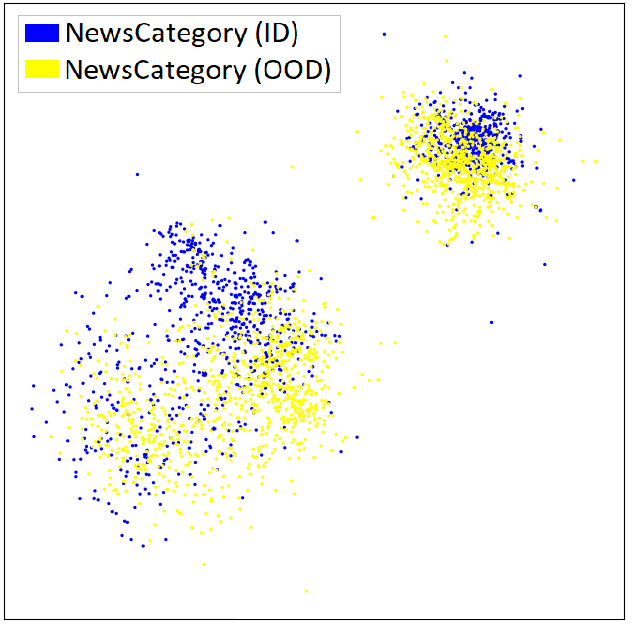
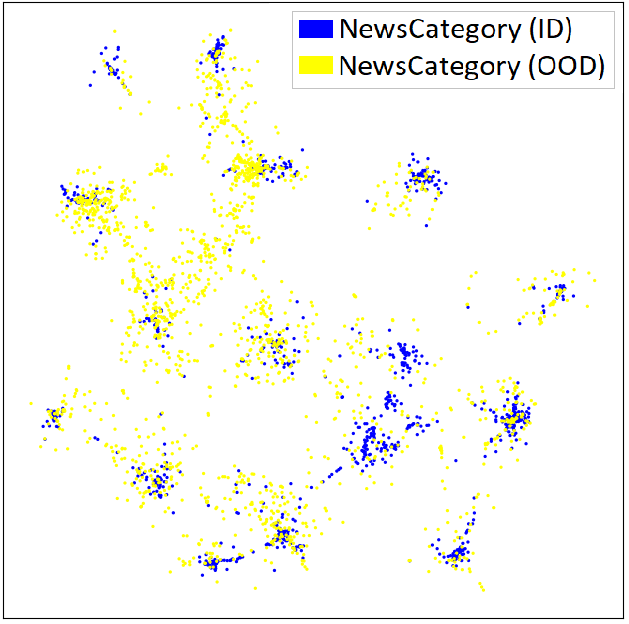
Figure 2 (bottom) shows the effect of fine-tuning for detection in this challenging setup of same-domain shifts. A salient observation is that fine-tuning consistently improves OOD detection performance, across all training objectives. To better understand why the pre-trained model underperforms in this case, in Figure 3, we plot feature representations, before and after fine-tuning, respectively. As seen in the left of Figure 3, when both ID and OOD data are sampled from the same domain, their embeddings are highly overlapping. This explains the suboptimal performance of directly employing embeddings from the pre-trained language model. In contrast, fine-tuning creates stronger separability between ID and OOD data. Table 3 quantitatively confirms that fine-tuning leads to stronger ID-OOD separability (c.f. Equation 2).
| Training | ID-OOD Separability ↑ |
|---|---|
| CE | 12.235 |
| TAPT | 12.489 |
| SupCon | 7.549 |
| Pre-trained | 0.138 |
5.4 Deeper look at embedding quality
We quantitatively measure the embeddings produced by both pre-trained and fine-tuned language models. We adopt the following three metrics as in Ming et al. (2023): (1) inter-class dispersion, which is the average cosine similarity among pair-wise class centroids, (2) intra-class compactness, which measures the average cosine similarity between each feature embedding and its corresponding class centroid, and (3) ID-OOD separability, which functions as a measure of domain gap between ID and OOD. Formally,
| (2) | ||||
where is the average of embeddings for samples in class , and is the normalized embedding.
| ID | Objective | ID Accuracy ↑ | Dispersion ↑ | Compactness ↓ | |
|---|---|---|---|---|---|
| (in degree) | (in degree) | ||||
| CE | 0.791 | 90.994 | 19.575 | ||
| 20NewsGroups | TAPT | 0.807 | 91.753 | 18.902 | |
| SupCon | 0.763 | 89.354 | 21.987 | ||
| Pre-trained | 0.053 | 1.514 | 4.326 | ||
| CE | 0.938 | 87.041 | 21.787 | ||
| IMDB | TAPT | 0.940 | 76.871 | 15.894 | |
| SupCon | 0.928 | 135.550 | 19.245 | ||
| Pre-trained | 0.500 | 0.636 | 6.058 | ||
| CE | 0.745 | 88.701 | 33.878 | ||
| NewsCategory | TAPT | 0.756 | 88.216 | 33.509 | |
| SupCon | 0.667 | 63.392 | 30.793 | ||
| Pre-trained | 0.050 | 3.086 | 9.210 | ||
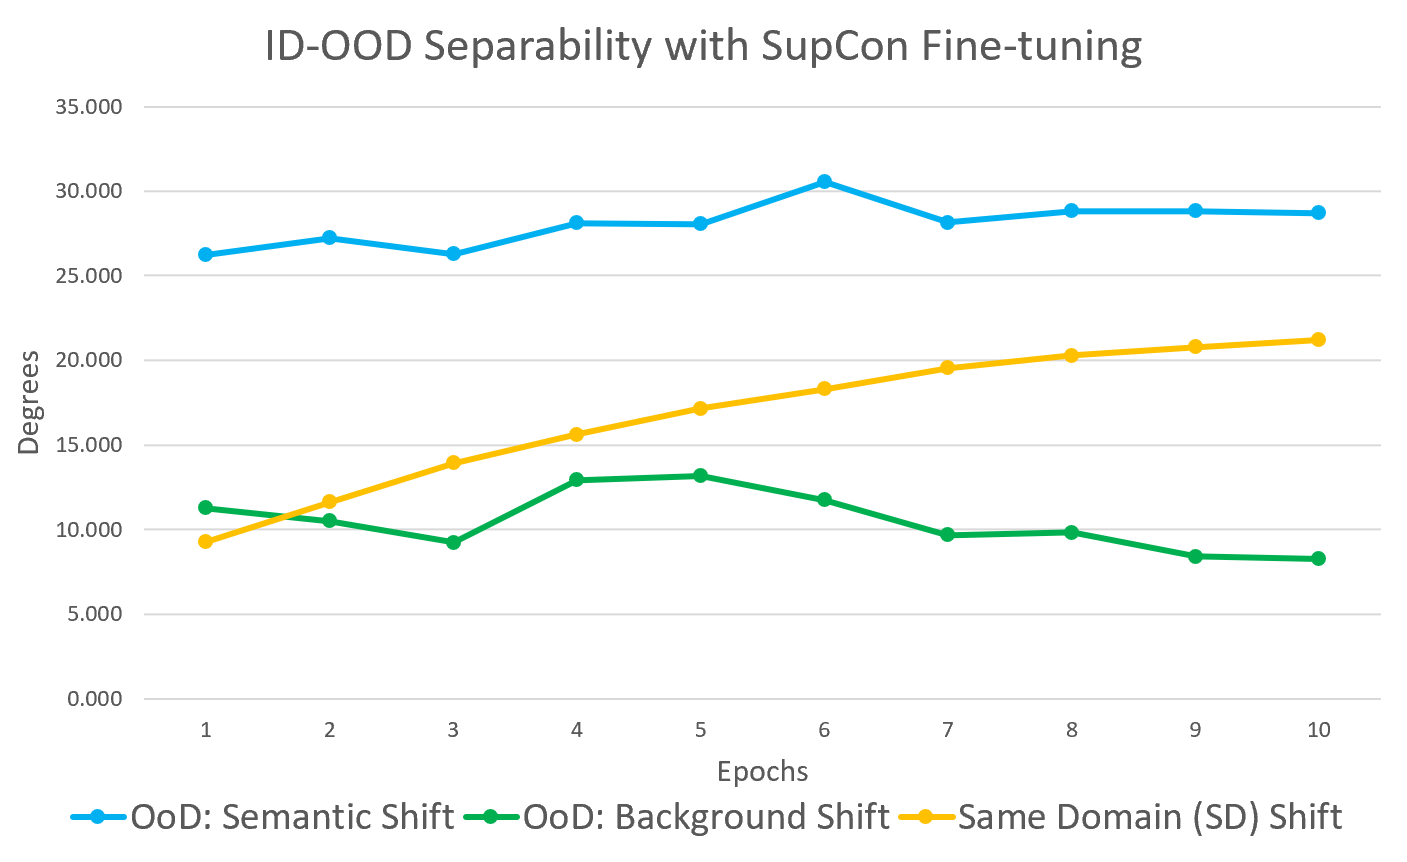
Table 4 shows us that fine-tuning encourages the model to embed the data into well-separated class clusters with high inter-class dispersion (measured in angular degrees). In contrast, the pre-trained model represents the entire domain as a homogeneous cluster containing data from all classes. Interestingly, the pre-trained model displays the strongest compactness, indicating the closeness among ID data points in the original representation space. Note that the ID accuracy is random for the pre-trained model, which is expected. Dispersion and compactness monotonically improve through fine-tuning, further indicating that fine-tuning encourages the model to project the data into well-separated and compact class-wise clusters. However, Figure 4 shows us that while fine-tuning improves ID-OOD separability for the same-domain shift, it has less impact on out-of-domain shifts. (Actual values and results for other objectives can be found in Appendix D.) This trend also echos our previous observations in Section 5.2 and Section 5.3, on OOD detection performance.
6 Related Work
The problem of OOD detection is different from domain adaptation Ramponi and Plank (2020), where a model is trained to generalize to a known target domain with the same label space. It is also different from selective prediction where a model abstains only when its confidence is low, irrespective of domain El-Yaniv et al. (2010); Geifman and El-Yaniv (2017); Kamath et al. (2020).
OOD Detection Methods
A popular baseline is the calibration method Maximum Softmax Probability (MSP) Hendrycks and Gimpel (2017), that directly uses maximum class probability produced by the logits of a trained classifier. However, predictive confidence has been shown to be undesirably high for OOD samples, making MSP ineffective Nguyen et al. (2015); Wei et al. (2022); Shen et al. (2021). Liu et al. (2020) propose using energy score for OOD detection, which better distinguishes in- and out-of-distribution samples than softmax scores. ReAct Sun et al. (2021) improves the energy score by introducing a rectified activation, which reduces model overconfidence in OOD data. Sun and Li (2022) utilize logit sparsification to enhance the vanilla energy score. More recently, detection methods that utilize distances of samples in representation space, have risen as a promising class of OOD detection methods in both the vision Mandelbaum and Weinshall (2017); Lee et al. (2018); Sun et al. (2022); Ming et al. (2023) and multi-modal Ming et al. (2022) regimes.
OOD Detection in NLP
In the realm of NLP, model confidence using sentence embeddings has been shown to be a strong baseline with pre-trained transformers Hendrycks et al. (2020); Desai and Durrett (2020). Contrastive learning Khosla et al. (2020); Gao et al. (2021); Jin et al. (2022) minimizes intra-class variance, leading to stronger OOD detection, especially in low data regimes Zeng et al. (2021), and with Mahalanobis distance Zhou et al. (2021); Podolskiy et al. (2021). Detection performance has also been strengthened using data augmentation Chen and Yu (2021); Rawat et al. (2021), discriminative training Zhan et al. (2021), mutual information maximization Nimah et al. (2021), ensembles Li et al. (2021) and prototypical networks in the few-shot setup Tan et al. (2019). While most previous works perform fine-tuning on the ID data, we provide a comprehensive understanding on directly using the pre-trained model for zero-shot OOD detection.
Pre-trained vs Fine-tuned
Pre-trained language models have been shown to learn implicit sentence representations, forming unsupervised domain clusters Aharoni and Goldberg (2020). Andreassen et al. (2021) and Kumar et al. (2021) showed that fine-tuning distorts pre-trained features, worsening accuracy on OOD generalization. However, to the best of our knowledge, we are the first to explore the effect of directly using pre-trained language models for OOD detection. Related to our work, Ming et al. (2022) show that pre-trained models can be used for zero-shot OOD detection. Different from ours, they perform OOD detection in the multi-modal space and calculate distances between the visual and textual representations.
7 Conclusion
In this paper, we explore the simple and effective setting of zero-shot OOD detection with pre-trained langage models. Our work departs from prior literature that typically requires fine-tuning on the ID data. Extensive evaluations demonstrate that pre-trained models are near-perfect for OOD detection when the test data comes from a different domain. We additionally investigate the effect of fine-tuning on OOD detection, and identify strategies to achieve both strong OOD detection performance and ID accuracy. We perform both qualitative and quantitative analysis on the embedding characteristics, explaining the strong performance of our method. We hope our work will inspire future work to the strong promise of using pre-trained models for OOD detection.
Ethical Considerations
Our project aims to improve the reliability and safety of large language models, which can be fragile under distribution shift Ribeiro et al. (2020) and incur great costs Ulmer et al. (2020); Zhang et al. (2021). By properly flagging anomalous data, our method can lead to direct benefits and societal impacts, particularly for safety-critical applications. From a user’s perspective, our method can help improve trust in the language models. Our study does not involve any human subjects or violation of legal compliance. We do not anticipate any potentially harmful consequences to our work. As detailed in Appendix A, all of our experiments are conducted using publicly available datasets. Our code has been released for reproducibility. Through our study and releasing our code, we hope to raise stronger research and societal awareness toward the problem of out-of-distribution detection in natural language processing.
Limitations
We provide a comprehensive study on the efficacy of leveraging pre-trained language models for zero-shot OOD detection. Our method is thus limited to the setting of abstaining from prediction on all OOD data. This is more conservative than selective prediction, where the model must make predictions over as many ID & OOD points as possible while maintaining high accuracy. Despite this, OOD detection has lower risks to high-risk and safety-critical applications, where rare and anomalous data is more reasonably flagged to the expert. We believe our work provides new values and insights to the research community, especially on safe handling of distributional shifts when deploying pre-trained language models.
As discussed in our Ethical Considerations, the OOD detection problem is of significant use in high-risk settings, and should be incorporated into production-level pipelines. However, for the same reason, the OOD detection models must be also reliable to avoid any risk to the downstream applications.
Acknowledgements
Li is supported in part by the AFOSR Young Investigator Award under No. FA9550-23-1-0184; UL Research Institutes through the Center for Advancing Safety of Machine Intelligence; Philanthropic Fund from SFF; and faculty research awards from Google, Meta, and Amazon. Hu is supported in part by a gift fund from ProtagoLabs. Any opinions, findings, conclusions, or recommendations expressed in this material are those of the authors and do not necessarily reflect the views, policies, or endorsements either expressed or implied, of the sponsors. We would like to thank Yifei Ming and the anonymous reviewers for helpful comments.
References
- Aharoni and Goldberg (2020) Roee Aharoni and Yoav Goldberg. 2020. Unsupervised domain clusters in pretrained language models. In Proceedings of the 58th Annual Meeting of the Association for Computational Linguistics, pages 7747–7763.
- Alain and Bengio (2016) Guillaume Alain and Yoshua Bengio. 2016. Understanding intermediate layers using linear classifier probes. arXiv preprint arXiv:1610.01644.
- Andreassen et al. (2021) Anders Johan Andreassen, Yasaman Bahri, Behnam Neyshabur, and Rebecca Roelofs. 2021. The evolution of out-of-distribution robustness throughout fine-tuning. Transactions on Machine Learning Research.
- Arora et al. (2021) Udit Arora, William Huang, and He He. 2021. Types of out-of-distribution texts and how to detect them. In Proceedings of the 2021 Conference on Empirical Methods in Natural Language Processing, pages 10687–10701.
- Chen and Yu (2021) Derek Chen and Zhou Yu. 2021. Gold: Improving out-of-scope detection in dialogues using data augmentation. In Proceedings of the 2021 Conference on Empirical Methods in Natural Language Processing, pages 429–442.
- Desai and Durrett (2020) Shrey Desai and Greg Durrett. 2020. Calibration of pre-trained transformers. In Proceedings of the 2020 Conference on Empirical Methods in Natural Language Processing (EMNLP), pages 295–302.
- El-Yaniv et al. (2010) Ran El-Yaniv et al. 2010. On the foundations of noise-free selective classification. Journal of Machine Learning Research, 11(5).
- Elliott et al. (2016) Desmond Elliott, Stella Frank, Khalil Sima’an, and Lucia Specia. 2016. Multi30k: Multilingual english-german image descriptions. In Proceedings of the 5th Workshop on Vision and Language, pages 70–74.
- Gao et al. (2021) Tianyu Gao, Xingcheng Yao, and Danqi Chen. 2021. Simcse: Simple contrastive learning of sentence embeddings. In Proceedings of the 2021 Conference on Empirical Methods in Natural Language Processing, pages 6894–6910.
- Geifman and El-Yaniv (2017) Yonatan Geifman and Ran El-Yaniv. 2017. Selective classification for deep neural networks. Advances in neural information processing systems, 30.
- Gunel et al. (2020) Beliz Gunel, Jingfei Du, Alexis Conneau, and Veselin Stoyanov. 2020. Supervised contrastive learning for pre-trained language model fine-tuning. In International Conference on Learning Representations.
- Gururangan et al. (2020) Suchin Gururangan, Ana Marasović, Swabha Swayamdipta, Kyle Lo, Iz Beltagy, Doug Downey, and Noah A Smith. 2020. Don’t stop pretraining: Adapt language models to domains and tasks. In Proceedings of the 58th Annual Meeting of the Association for Computational Linguistics, pages 8342–8360.
- Hendrycks and Gimpel (2017) Dan Hendrycks and Kevin Gimpel. 2017. A baseline for detecting misclassified and out-of-distribution examples in neural networks. In 5th International Conference on Learning Representations, ICLR 2017, Toulon, France, April 24-26, 2017, Conference Track Proceedings.
- Hendrycks et al. (2020) Dan Hendrycks, Xiaoyuan Liu, Eric Wallace, Adam Dziedzic, Rishabh Krishnan, and Dawn Song. 2020. Pretrained transformers improve out-of-distribution robustness. In Proceedings of the 58th Annual Meeting of the Association for Computational Linguistics, pages 2744–2751.
- Jin et al. (2022) Di Jin, Shuyang Gao, Seokhwan Kim, Yang Liu, and Dilek Hakkani-Tür. 2022. Towards textual out-of-domain detection without in-domain labels. IEEE/ACM Transactions on Audio, Speech, and Language Processing, 30:1386–1395.
- Kamath et al. (2020) Amita Kamath, Robin Jia, and Percy Liang. 2020. Selective question answering under domain shift. In Proceedings of the 58th Annual Meeting of the Association for Computational Linguistics, pages 5684–5696.
- Kenton and Toutanova (2019) Jacob Devlin Ming-Wei Chang Kenton and Lee Kristina Toutanova. 2019. Bert: Pre-training of deep bidirectional transformers for language understanding. In Proceedings of NAACL-HLT, pages 4171–4186.
- Khosla et al. (2020) Prannay Khosla, Piotr Teterwak, Chen Wang, Aaron Sarna, Yonglong Tian, Phillip Isola, Aaron Maschinot, Ce Liu, and Dilip Krishnan. 2020. Supervised contrastive learning. Advances in Neural Information Processing Systems, 33:18661–18673.
- Kumar et al. (2021) Ananya Kumar, Aditi Raghunathan, Robbie Matthew Jones, Tengyu Ma, and Percy Liang. 2021. Fine-tuning can distort pretrained features and underperform out-of-distribution. In International Conference on Learning Representations.
- Lample and Conneau (2019) Guillaume Lample and Alexis Conneau. 2019. Cross-lingual language model pretraining. arXiv preprint arXiv:1901.07291.
- Lang (1995) Ken Lang. 1995. Newsweeder: Learning to filter netnews. In Machine Learning Proceedings 1995, pages 331–339. Elsevier.
- Larson et al. (2019) Stefan Larson, Anish Mahendran, Joseph J Peper, Christopher Clarke, Andrew Lee, Parker Hill, Jonathan K Kummerfeld, Kevin Leach, Michael A Laurenzano, Lingjia Tang, et al. 2019. An evaluation dataset for intent classification and out-of-scope prediction. In Proceedings of the 2019 Conference on Empirical Methods in Natural Language Processing and the 9th International Joint Conference on Natural Language Processing (EMNLP-IJCNLP), pages 1311–1316.
- Lee et al. (2018) Kimin Lee, Kibok Lee, Honglak Lee, and Jinwoo Shin. 2018. A simple unified framework for detecting out-of-distribution samples and adversarial attacks. Advances in neural information processing systems, 31.
- Li et al. (2021) Xiaoya Li, Jiwei Li, Xiaofei Sun, Chun Fan, Tianwei Zhang, Fei Wu, Yuxian Meng, and Jun Zhang. 2021. kfolden: k-fold ensemble for out-of-distribution detection-fold ensemble for out-of-distribution detection. In Proceedings of the 2021 Conference on Empirical Methods in Natural Language Processing, pages 3102–3115.
- Liu et al. (2020) Weitang Liu, Xiaoyun Wang, John Owens, and Yixuan Li. 2020. Energy-based out-of-distribution detection. Advances in Neural Information Processing Systems, 33:21464–21475.
- Liu et al. (2019) Yinhan Liu, Myle Ott, Naman Goyal, Jingfei Du, Mandar Joshi, Danqi Chen, Omer Levy, Mike Lewis, Luke Zettlemoyer, and Veselin Stoyanov. 2019. Roberta: A robustly optimized bert pretraining approach. arXiv preprint arXiv:1907.11692.
- Maas et al. (2011) Andrew Maas, Raymond E Daly, Peter T Pham, Dan Huang, Andrew Y Ng, and Christopher Potts. 2011. Learning word vectors for sentiment analysis. In Proceedings of the 49th annual meeting of the association for computational linguistics: Human language technologies, pages 142–150.
- Mahalanobis (2018) Prasanta Chandra Mahalanobis. 2018. On the generalized distance in statistics. Sankhyā: The Indian Journal of Statistics, Series A (2008-), 80:S1–S7.
- Mandelbaum and Weinshall (2017) Amit Mandelbaum and Daphna Weinshall. 2017. Distance-based confidence score for neural network classifiers. arXiv preprint arXiv:1709.09844.
- Ming et al. (2022) Yifei Ming, Ziyang Cai, Jiuxiang Gu, Yiyou Sun, Wei Li, and Yixuan Li. 2022. Delving into out-of-distribution detection with vision-language representations. In Advances in Neural Information Processing Systems.
- Ming et al. (2023) Yifei Ming, Yiyou Sun, Ousmane Dia, and Yixuan Li. 2023. How to exploit hyperspherical embeddings for out-of-distribution detection? In Proceedings of the International Conference on Learning Representations.
- Misra (2018) Rishabh Misra. 2018. News category dataset. DOI: DOI: https://doi. org/10.13140/RG, 2(20331.18729).
- Nguyen et al. (2015) Anh Nguyen, Jason Yosinski, and Jeff Clune. 2015. Deep neural networks are easily fooled: High confidence predictions for unrecognizable images. In Proceedings of the IEEE conference on computer vision and pattern recognition, pages 427–436.
- Nimah et al. (2021) Iftitahu Nimah, Meng Fang, Vlado Menkovski, and Mykola Pechenizkiy. 2021. Protoinfomax: Prototypical networks with mutual information maximization for out-of-domain detection. In Findings of the Association for Computational Linguistics: EMNLP 2021, pages 1606–1617.
- Pavlick and Tetreault (2016) Ellie Pavlick and Joel Tetreault. 2016. An empirical analysis of formality in online communication. Transactions of the Association for Computational Linguistics, 4:61–74.
- Podolskiy et al. (2021) Alexander Podolskiy, Dmitry Lipin, Andrey Bout, Ekaterina Artemova, and Irina Piontkovskaya. 2021. Revisiting mahalanobis distance for transformer-based out-of-domain detection. In Proceedings of the AAAI Conference on Artificial Intelligence, volume 35, pages 13675–13682.
- Ramponi and Plank (2020) Alan Ramponi and Barbara Plank. 2020. Neural unsupervised domain adaptation in nlp—a survey. In Proceedings of the 28th International Conference on Computational Linguistics, pages 6838–6855.
- Rawat et al. (2021) Mrinal Rawat, Ramya Hebbalaguppe, and Lovekesh Vig. 2021. Pnpood: Out-of-distribution detection for text classification via plug andplay data augmentation. arXiv preprint arXiv:2111.00506.
- Ren et al. (2019) Jie Ren, Peter J Liu, Emily Fertig, Jasper Snoek, Ryan Poplin, Mark Depristo, Joshua Dillon, and Balaji Lakshminarayanan. 2019. Likelihood ratios for out-of-distribution detection. Advances in neural information processing systems, 32.
- Ribeiro et al. (2020) Marco Tulio Ribeiro, Tongshuang Wu, Carlos Guestrin, and Sameer Singh. 2020. Beyond accuracy: Behavioral testing of nlp models with checklist. In Proceedings of the 58th Annual Meeting of the Association for Computational Linguistics, pages 4902–4912.
- Scheirer et al. (2012) Walter J Scheirer, Anderson de Rezende Rocha, Archana Sapkota, and Terrance E Boult. 2012. Toward open set recognition. IEEE transactions on pattern analysis and machine intelligence, 35(7):1757–1772.
- Shen et al. (2021) Yilin Shen, Yen-Chang Hsu, Avik Ray, and Hongxia Jin. 2021. Enhancing the generalization for intent classification and out-of-domain detection in slu. In Proceedings of the 59th Annual Meeting of the Association for Computational Linguistics and the 11th International Joint Conference on Natural Language Processing (Volume 1: Long Papers), pages 2443–2453.
- Socher et al. (2013) Richard Socher, Alex Perelygin, Jean Wu, Jason Chuang, Christopher D Manning, Andrew Y Ng, and Christopher Potts. 2013. Recursive deep models for semantic compositionality over a sentiment treebank. In Proceedings of the 2013 conference on empirical methods in natural language processing, pages 1631–1642.
- Sun et al. (2021) Yiyou Sun, Chuan Guo, and Yixuan Li. 2021. React: Out-of-distribution detection with rectified activations. In Advances in Neural Information Processing Systems.
- Sun and Li (2022) Yiyou Sun and Yixuan Li. 2022. Dice: Leveraging sparsification for out-of-distribution detection. In European Conference on Computer Vision.
- Sun et al. (2022) Yiyou Sun, Yifei Ming, Xiaojin Zhu, and Yixuan Li. 2022. Out-of-distribution detection with deep nearest neighbors. In International Conference on Machine Learning (ICML). PMLR.
- Tan et al. (2019) Ming Tan, Yang Yu, Haoyu Wang, Dakuo Wang, Saloni Potdar, Shiyu Chang, and Mo Yu. 2019. Out-of-domain detection for low-resource text classification tasks. In Proceedings of the 2019 Conference on Empirical Methods in Natural Language Processing and the 9th International Joint Conference on Natural Language Processing (EMNLP-IJCNLP), pages 3566–3572.
- Ulmer et al. (2020) Dennis Ulmer, Lotta Meijerink, and Giovanni Cinà. 2020. Trust issues: Uncertainty estimation does not enable reliable ood detection on medical tabular data. In Machine Learning for Health, pages 341–354. PMLR.
- Wang et al. (2018) Alex Wang, Amanpreet Singh, Julian Michael, Felix Hill, Omer Levy, and Samuel Bowman. 2018. Glue: A multi-task benchmark and analysis platform for natural language understanding. In Proceedings of the 2018 EMNLP Workshop BlackboxNLP: Analyzing and Interpreting Neural Networks for NLP, pages 353–355.
- Wang and Liu (2021) Feng Wang and Huaping Liu. 2021. Understanding the behaviour of contrastive loss. In Proceedings of the IEEE/CVF conference on computer vision and pattern recognition, pages 2495–2504.
- Wei et al. (2022) Hongxin Wei, Renchunzi Xie, Hao Cheng, Lei Feng, Bo An, and Yixuan Li. 2022. Mitigating neural network overconfidence with logit normalization. In International Conference on Machine Learning (ICML). PMLR.
- Williams et al. (2018) Adina Williams, Nikita Nangia, and Samuel Bowman. 2018. A broad-coverage challenge corpus for sentence understanding through inference. In Proceedings of the 2018 Conference of the North American Chapter of the Association for Computational Linguistics: Human Language Technologies, Volume 1 (Long Papers), pages 1112–1122.
- Xu et al. (2021) Keyang Xu, Tongzheng Ren, Shikun Zhang, Yihao Feng, and Caiming Xiong. 2021. Unsupervised out-of-domain detection via pre-trained transformers. In Proceedings of the 59th Annual Meeting of the Association for Computational Linguistics and the 11th International Joint Conference on Natural Language Processing (Volume 1: Long Papers), pages 1052–1061.
- Yao et al. (2007) Yuan Yao, Lorenzo Rosasco, and Andrea Caponnetto. 2007. On early stopping in gradient descent learning. Constructive Approximation, 26(2):289–315.
- Zeng et al. (2021) Zhiyuan Zeng, Keqing He, Yuanmeng Yan, Zijun Liu, Yanan Wu, Hong Xu, Huixing Jiang, and Weiran Xu. 2021. Modeling discriminative representations for out-of-domain detection with supervised contrastive learning. In Proceedings of the 59th Annual Meeting of the Association for Computational Linguistics and the 11th International Joint Conference on Natural Language Processing (Volume 2: Short Papers), pages 870–878.
- Zhan et al. (2021) Li-Ming Zhan, Haowen Liang, Bo Liu, Lu Fan, Xiao-Ming Wu, and Albert YS Lam. 2021. Out-of-scope intent detection with self-supervision and discriminative training. In Proceedings of the 59th Annual Meeting of the Association for Computational Linguistics and the 11th International Joint Conference on Natural Language Processing (Volume 1: Long Papers), pages 3521–3532.
- Zhang et al. (2021) Oliver Zhang, Jean-Benoit Delbrouck, and Daniel L Rubin. 2021. Out of distribution detection for medical images. In Uncertainty for Safe Utilization of Machine Learning in Medical Imaging, and Perinatal Imaging, Placental and Preterm Image Analysis, pages 102–111. Springer.
- Zhou et al. (2021) Wenxuan Zhou, Fangyu Liu, and Muhao Chen. 2021. Contrastive out-of-distribution detection for pretrained transformers. In Proceedings of the 2021 Conference on Empirical Methods in Natural Language Processing, pages 1100–1111.
Appendix A Preparation of Evaluation Benchmarks
For ID data, we use the train splits of the IMDB dataset on sentiment analysis Maas et al. (2011), and the 20NewsGroups dataset on topic classification Lang (1995). For OOD data, we use the test splits of IMDB and 20NewsGroups, as well as the test splits from the sentiment classification dataset SST-2 Socher et al. (2013), Natural Language Inference datasets RTE Wang et al. (2018) and MNLI Williams et al. (2018), the English source side of machine translation dataset Multi30k Elliott et al. (2016), and the cross intent dataset CLINC150 Larson et al. (2019). For MNLI, we use both the matched and mismatched test sets. For Multi30k, we combine the flickr 2016 English test set, mscoco 2017 English test set, and filckr 2018 English test. For CLINC150, we use the ‘out of scope’ class as the test set.
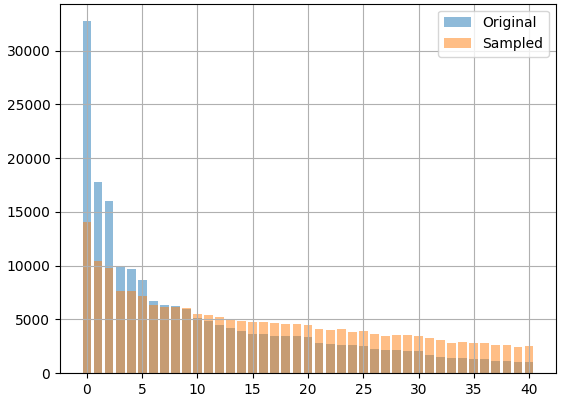
Inspired by Arora et al. (2021), we evaluate the detection performance under same-domain shift using the NewsCategory Misra (2018) dataset. We create two disjoint sets of classes, used as ID and OOD respectively. The domain for both sets of classes is identical, while the label sets differ. Notably, the NewsCategory dataset contains classes with similar semantics, for example ‘Arts’ and ‘Arts & Culture’. To ensure the semantic distinction between the ID and OOD classes, we categorize semantically similar classes to be entirely in either ID or OOD sets. The allocation of classes is summarized in Table 5. The dataset also has a strong class imbalance, so we sample data points according to a multinomial distribution, following Lample and Conneau (2019). Figure 5 shows the class frequencies before and after sampling.
More statistics about each dataset is available in Table 6. The listed datasets are intended for research purposes only. We do not make any commercial use of them.
| ID Classes | OOD Classes |
|---|---|
| Politics | Style & Beauty |
| The Worldpost | Style |
| Worldpost | Arts |
| World News | Arts & Culture |
| Impact | Culture & Arts |
| Crime | Food & Drink |
| Media | Taste |
| Business | College |
| Money | Education |
| Fifty | Science |
| Good News | Tech |
| Queer Voices | Sports |
| Black Voices | Wellness |
| Women | Healthy Living |
| Latino Voices | Travel |
| Religion | Home & Living |
| Weird News | Parenting |
| Parents | |
| Weddings | |
| Divorce | |
| Entertainment | |
| Comedy | |
| Environment | |
| Green |
| Dataset | Domain | Language | License | Statistics | ||
|---|---|---|---|---|---|---|
| Train | Val | Test | ||||
| IMDB | Large Movie Review Dataset | English | Unknown | 25,000 | 25,000 | 50,000 |
| 20NewsGroups | News Articles | English | Unknown | 11314 | 2000 | 5532 |
| SST-2 | Movie Reviews | English | cc-by-4.0 | 67349 | 872 | 1821 |
| RTE | News and Wikipedia text | English | cc-by-4.0 | 2490 | 277 | 3000 |
| MNLI | Open American National Corpus | English | cc-by-4.0 | 392702 | 19647 | 19643 |
| Multi30k | Flickr30K, MSCOCO | English, German | Custom (research-only, non-commercial) | N/A | N/A | 2532 |
| CLINC150 | Intent Classification | English | cc-by-3.0 | 15000 | 3000 | 1000 |
| NewsCategory | HuffPost | English | CC0: Public Domain | 64856 | 4053 | 17968 |
Appendix B Ablation on the Effect of Layers
The RoBERTa architecture consists of a backbone of multiple transformer layers, followed by a task-specific head on top. For the classification task, this task-specific head consists of a dense layer followed by a classification projection layer. Zhou et al. (2021) use the features from after the dense layer for OOD detection. Instead, we use the features from before this layer. Table 7 shows the OOD detection performance using the representations from after the dense layer. Table 7 displays a worse performance than our main results in Table 2, where the representations from before the dense layer are used. Using the representations from before the task-specific head also makes zero-shot OOD detection possible, where the task-specific head is randomly initialized, but weights from the backbone of the pre-trained model are used.
| KNN (non-parametric) | Mahalanobis (parametric) | ||||||||
| IDOOD Pair | Training | AUROC ↑ | AUPR (In) ↑ | AUPR (Out) ↑ | FPR95 ↓ | AUROC ↑ | AUPR (In) ↑ | AUPR (Out) ↑ | FPR95 ↓ |
| Out-of-Domain: Semantic Shift | |||||||||
| CE | 0.967 | 0.989 | 0.907 | 0.193 | 0.973 | 0.991 | 0.918 | 0.154 | |
| 20NGSST-2 | TAPT | 0.962 | 0.988 | 0.885 | 0.226 | 0.971 | 0.990 | 0.911 | 0.164 |
| SupCon | 0.962 | 0.987 | 0.889 | 0.230 | 0.971 | 0.990 | 0.917 | 0.159 | |
| CE | 0.946 | 0.884 | 0.981 | 0.311 | 0.955 | 0.900 | 0.984 | 0.250 | |
| 20NGMNLI | TAPT | 0.942 | 0.875 | 0.980 | 0.314 | 0.952 | 0.887 | 0.983 | 0.253 |
| SupCon | 0.946 | 0.884 | 0.981 | 0.311 | 0.957 | 0.904 | 0.985 | 0.246 | |
| CE | 0.912 | 0.953 | 0.839 | 0.445 | 0.927 | 0.960 | 0.870 | 0.373 | |
| 20NGRTE | TAPT | 0.889 | 0.938 | 0.806 | 0.507 | 0.902 | 0.944 | 0.836 | 0.430 |
| SupCon | 0.911 | 0.953 | 0.837 | 0.445 | 0.932 | 0.964 | 0.879 | 0.347 | |
| CE | 0.943 | 0.786 | 0.992 | 0.339 | 0.951 | 0.790 | 0.993 | 0.279 | |
| 20NGIMDB | TAPT | 0.947 | 0.778 | 0.993 | 0.283 | 0.956 | 0.782 | 0.994 | 0.212 |
| SupCon | 0.952 | 0.808 | 0.993 | 0.277 | 0.961 | 0.822 | 0.995 | 0.212 | |
| CE | 0.941 | 0.972 | 0.882 | 0.296 | 0.950 | 0.976 | 0.895 | 0.254 | |
| 20NGMulti30K | TAPT | 0.932 | 0.967 | 0.870 | 0.313 | 0.942 | 0.971 | 0.891 | 0.247 |
| SupCon | 0.928 | 0.964 | 0.869 | 0.331 | 0.940 | 0.970 | 0.892 | 0.274 | |
| CE | 0.932 | 0.864 | 0.974 | 0.375 | 0.941 | 0.878 | 0.978 | 0.324 | |
| 20NGNewsCategory | TAPT | 0.924 | 0.844 | 0.971 | 0.384 | 0.933 | 0.852 | 0.975 | 0.326 |
| SupCon | 0.929 | 0.861 | 0.973 | 0.396 | 0.944 | 0.886 | 0.979 | 0.319 | |
| CE | 0.946 | 0.990 | 0.783 | 0.285 | 0.952 | 0.991 | 0.800 | 0.255 | |
| 20NGCLINC150 | TAPT | 0.935 | 0.987 | 0.739 | 0.343 | 0.945 | 0.989 | 0.774 | 0.280 |
| SupCon | 0.932 | 0.987 | 0.732 | 0.372 | 0.943 | 0.989 | 0.770 | 0.319 | |
| Out-of-Domain: Background Shift | |||||||||
| CE | 0.856 | 0.994 | 0.135 | 0.784 | 0.877 | 0.995 | 0.171 | 0.738 | |
| IMDB SST-2 | TAPT | 0.852 | 0.994 | 0.130 | 0.765 | 0.867 | 0.995 | 0.136 | 0.760 |
| SupCon | 0.833 | 0.993 | 0.105 | 0.840 | 0.859 | 0.994 | 0.128 | 0.834 | |
| Same Domain Shift | |||||||||
| NewsCategory-ID | CE | 0.924 | 0.924 | 0.930 | 0.499 | 0.887 | 0.837 | 0.914 | 0.490 |
| NewsCategory-OOD | TAPT | 0.920 | 0.920 | 0.925 | 0.520 | 0.881 | 0.830 | 0.910 | 0.501 |
| SupCon | 0.927 | 0.925 | 0.935 | 0.464 | 0.878 | 0.817 | 0.912 | 0.475 | |
Appendix C Generation of Sequence Embeddings
Our experiments in the main paper use sentence embeddings obtained from the beginning-of-sentence (BOS) token. This practice is standard for most BERT-like models, including RoBERTa, which we use for our experiments. Prior work has also shown that using the average of all token embeddings can lead to the formation of similar domain-based clusters Aharoni and Goldberg (2020).
In this section, we compare this approach with the alternate approach of obtaining sequence embeddings as the average of all token embeddings in the sequence. Table 8 shows that both approaches yield almost identical performance on the OOD detection task.
| OOD | Embedding | AUROC (kNN) ↑ | FPR (kNN) ↓ | AUROC (kNN) ↑ | FPR (kNN) ↓ |
|---|---|---|---|---|---|
| SST-2 | Avg | 1.000 | 1.000 | 1.000 | 0.000 |
| BOS | 1.000 | 1.000 | 1.000 | 0.000 | |
| MNLI | Avg | 1.000 | 0.999 | 1.000 | 0.000 |
| BOS | 1.000 | 0.999 | 1.000 | 0.000 | |
| RTE | Avg | 0.999 | 0.999 | 0.997 | 0.000 |
| BOS | 1.000 | 1.000 | 0.999 | 0.000 | |
| IMDB | Avg | 0.986 | 0.973 | 0.997 | 0.008 |
| BOS | 0.988 | 0.970 | 0.998 | 0.019 | |
| Multi30K | Avg | 1.000 | 1.000 | 1.000 | 0.000 |
| BOS | 1.000 | 1.000 | 1.000 | 0.000 | |
| NewsCategory | Avg | 1.000 | 0.999 | 1.000 | 0.000 |
| BOS | 1.000 | 0.999 | 1.000 | 0.000 | |
| CLINC150 | Avg | 1.000 | 1.000 | 1.000 | 0.000 |
| BOS | 1.000 | 1.000 | 1.000 | 0.000 |
Appendix D Detailed Performance of Fine-tuning for OOD Detection
Table 9 summarizes the epoch-wise performance when fine-tuning on ID data, for the setting of OoD semantic shift. Table 10 shows the same for OoD background shift, while Table 11 shows this for same-domain (SD) shift.
| Training | Epoch | ID Accuracy ↑ | Dispersion ↑ | Compactness ↓ | ID-OOD | MSP | Energy | KNN | Mahalanobis | ||||
|---|---|---|---|---|---|---|---|---|---|---|---|---|---|
| Separability ↑ | AUROC ↑ | FPR95 ↓ | AUROC ↑ | FPR95 ↓ | AUROC ↑ | FPR95 ↓ | AUROC ↑ | FPR95 ↓ | |||||
| 1 | 0.791 | 89.777 | 24.303 | 26.594 | 0.757 | 0.687 | 0.849 | 0.432 | 0.934 | 0.332 | 0.961 | 0.221 | |
| 2 | 0.823 | 90.632 | 22.508 | 26.595 | 0.790 | 0.656 | 0.855 | 0.421 | 0.925 | 0.373 | 0.956 | 0.247 | |
| 3 | 0.840 | 91.439 | 20.312 | 28.570 | 0.808 | 0.638 | 0.864 | 0.426 | 0.931 | 0.344 | 0.957 | 0.229 | |
| 4 | 0.851 | 91.934 | 18.293 | 29.259 | 0.816 | 0.658 | 0.859 | 0.432 | 0.931 | 0.356 | 0.958 | 0.238 | |
| CE | 5 | 0.843 | 91.643 | 17.757 | 29.247 | 0.808 | 0.672 | 0.854 | 0.450 | 0.928 | 0.367 | 0.953 | 0.243 |
| 6 | 0.855 | 91.966 | 16.464 | 29.579 | 0.824 | 0.655 | 0.855 | 0.437 | 0.922 | 0.380 | 0.946 | 0.262 | |
| 7 | 0.856 | 92.097 | 16.210 | 29.064 | 0.832 | 0.691 | 0.862 | 0.459 | 0.919 | 0.422 | 0.942 | 0.277 | |
| 8 | 0.859 | 92.170 | 15.122 | 28.968 | 0.829 | 0.695 | 0.854 | 0.472 | 0.920 | 0.413 | 0.945 | 0.290 | |
| 9 | 0.858 | 92.211 | 14.745 | 30.084 | 0.841 | 0.653 | 0.863 | 0.448 | 0.925 | 0.393 | 0.946 | 0.274 | |
| 10 | 0.858 | 92.232 | 14.261 | 29.733 | 0.833 | 0.684 | 0.853 | 0.469 | 0.922 | 0.410 | 0.945 | 0.285 | |
| 1 | 0.807 | 90.555 | 23.987 | 27.595 | 0.785 | 0.646 | 0.861 | 0.403 | 0.929 | 0.326 | 0.955 | 0.239 | |
| 2 | 0.840 | 91.058 | 21.600 | 27.174 | 0.784 | 0.662 | 0.852 | 0.418 | 0.916 | 0.351 | 0.942 | 0.264 | |
| 3 | 0.841 | 91.473 | 20.052 | 29.920 | 0.823 | 0.610 | 0.875 | 0.386 | 0.931 | 0.323 | 0.948 | 0.250 | |
| 4 | 0.842 | 91.517 | 18.602 | 27.894 | 0.798 | 0.677 | 0.845 | 0.456 | 0.910 | 0.379 | 0.932 | 0.293 | |
| TAPT | 5 | 0.851 | 91.766 | 17.315 | 27.091 | 0.814 | 0.680 | 0.849 | 0.473 | 0.909 | 0.395 | 0.928 | 0.313 |
| 6 | 0.852 | 91.916 | 16.551 | 28.467 | 0.819 | 0.666 | 0.844 | 0.487 | 0.908 | 0.421 | 0.926 | 0.330 | |
| 7 | 0.857 | 92.016 | 15.881 | 25.505 | 0.803 | 0.712 | 0.824 | 0.541 | 0.893 | 0.486 | 0.913 | 0.393 | |
| 8 | 0.860 | 92.122 | 14.934 | 26.382 | 0.799 | 0.701 | 0.820 | 0.516 | 0.897 | 0.457 | 0.918 | 0.364 | |
| 9 | 0.856 | 92.149 | 14.602 | 26.829 | 0.808 | 0.691 | 0.828 | 0.508 | 0.897 | 0.463 | 0.918 | 0.360 | |
| 10 | 0.861 | 92.211 | 14.364 | 27.151 | 0.807 | 0.695 | 0.826 | 0.493 | 0.898 | 0.455 | 0.919 | 0.352 | |
| 1 | 0.763 | 87.389 | 26.510 | 26.239 | 0.771 | 0.622 | 0.866 | 0.404 | 0.936 | 0.327 | 0.970 | 0.180 | |
| 2 | 0.820 | 89.348 | 23.556 | 27.233 | 0.771 | 0.661 | 0.851 | 0.438 | 0.935 | 0.333 | 0.967 | 0.206 | |
| 3 | 0.838 | 90.452 | 21.171 | 26.267 | 0.760 | 0.710 | 0.832 | 0.487 | 0.928 | 0.350 | 0.962 | 0.230 | |
| 4 | 0.842 | 90.874 | 20.170 | 28.124 | 0.796 | 0.660 | 0.859 | 0.410 | 0.927 | 0.343 | 0.960 | 0.206 | |
| SupCon | 5 | 0.851 | 91.295 | 18.608 | 28.033 | 0.815 | 0.649 | 0.865 | 0.412 | 0.921 | 0.382 | 0.954 | 0.272 |
| 6 | 0.852 | 91.342 | 18.493 | 30.519 | 0.832 | 0.616 | 0.883 | 0.370 | 0.934 | 0.304 | 0.960 | 0.206 | |
| 7 | 0.855 | 91.736 | 17.224 | 28.144 | 0.818 | 0.711 | 0.863 | 0.448 | 0.922 | 0.375 | 0.954 | 0.248 | |
| 8 | 0.853 | 91.828 | 16.390 | 28.809 | 0.825 | 0.676 | 0.863 | 0.441 | 0.921 | 0.386 | 0.950 | 0.253 | |
| 9 | 0.857 | 91.977 | 15.999 | 28.812 | 0.832 | 0.666 | 0.869 | 0.452 | 0.922 | 0.390 | 0.952 | 0.247 | |
| 10 | 0.862 | 92.016 | 15.624 | 28.713 | 0.833 | 0.683 | 0.869 | 0.447 | 0.923 | 0.393 | 0.952 | 0.248 | |
| Training | Epoch | ID Accuracy ↑ | Dispersion ↑ | Compactness ↓ | ID-OOD | MSP | Energy | KNN | Mahalanobis | ||||
|---|---|---|---|---|---|---|---|---|---|---|---|---|---|
| Separability ↑ | AUROC ↑ | FPR95 ↓ | AUROC ↑ | FPR95 ↓ | AUROC ↑ | FPR95 ↓ | AUROC ↑ | FPR95 ↓ | |||||
| 1 | 0.938 | 87.041 | 21.787 | 8.437 | 0.699 | 0.868 | 0.675 | 0.873 | 0.894 | 0.432 | 0.951 | 0.254 | |
| 2 | 0.937 | 81.117 | 20.439 | 5.936 | 0.677 | 0.894 | 0.676 | 0.921 | 0.896 | 0.429 | 0.947 | 0.295 | |
| 3 | 0.937 | 97.130 | 18.534 | 10.150 | 0.767 | 0.852 | 0.765 | 0.856 | 0.866 | 0.539 | 0.931 | 0.344 | |
| 4 | 0.938 | 99.677 | 16.615 | 11.517 | 0.735 | 0.841 | 0.746 | 0.839 | 0.865 | 0.613 | 0.901 | 0.490 | |
| CE | 5 | 0.927 | 114.249 | 15.839 | 11.704 | 0.719 | 0.881 | 0.734 | 0.882 | 0.850 | 0.625 | 0.896 | 0.478 |
| 6 | 0.936 | 111.093 | 15.514 | 10.819 | 0.743 | 0.853 | 0.748 | 0.854 | 0.831 | 0.671 | 0.886 | 0.541 | |
| 7 | 0.938 | 122.309 | 14.283 | 14.760 | 0.745 | 0.829 | 0.752 | 0.826 | 0.860 | 0.679 | 0.889 | 0.571 | |
| 8 | 0.938 | 124.571 | 14.686 | 15.711 | 0.784 | 0.811 | 0.793 | 0.812 | 0.872 | 0.674 | 0.899 | 0.556 | |
| 9 | 0.941 | 130.242 | 13.908 | 16.455 | 0.787 | 0.805 | 0.798 | 0.806 | 0.872 | 0.713 | 0.898 | 0.596 | |
| 10 | 0.939 | 130.285 | 14.314 | 15.770 | 0.781 | 0.813 | 0.794 | 0.813 | 0.865 | 0.741 | 0.893 | 0.618 | |
| 1 | 0.940 | 76.871 | 15.894 | 7.455 | 0.733 | 0.830 | 0.708 | 0.838 | 0.902 | 0.414 | 0.966 | 0.166 | |
| 2 | 0.943 | 82.230 | 15.106 | 10.080 | 0.805 | 0.808 | 0.803 | 0.820 | 0.918 | 0.418 | 0.960 | 0.242 | |
| 3 | 0.937 | 89.350 | 14.646 | 10.831 | 0.814 | 0.782 | 0.810 | 0.789 | 0.867 | 0.650 | 0.916 | 0.513 | |
| 4 | 0.938 | 100.884 | 13.629 | 11.705 | 0.810 | 0.792 | 0.802 | 0.795 | 0.866 | 0.644 | 0.898 | 0.583 | |
| TAPT | 5 | 0.940 | 116.726 | 12.179 | 12.610 | 0.790 | 0.820 | 0.781 | 0.820 | 0.863 | 0.679 | 0.887 | 0.595 |
| 6 | 0.940 | 117.262 | 11.048 | 11.496 | 0.770 | 0.829 | 0.773 | 0.831 | 0.861 | 0.641 | 0.890 | 0.533 | |
| 7 | 0.940 | 119.857 | 10.796 | 13.009 | 0.789 | 0.806 | 0.789 | 0.810 | 0.870 | 0.634 | 0.901 | 0.519 | |
| 8 | 0.942 | 127.375 | 10.332 | 14.030 | 0.808 | 0.799 | 0.811 | 0.797 | 0.859 | 0.680 | 0.875 | 0.613 | |
| 9 | 0.944 | 134.293 | 8.886 | 14.992 | 0.787 | 0.792 | 0.791 | 0.790 | 0.859 | 0.738 | 0.881 | 0.682 | |
| 10 | 0.943 | 134.601 | 9.060 | 15.340 | 0.797 | 0.794 | 0.801 | 0.795 | 0.857 | 0.746 | 0.877 | 0.683 | |
| 1 | 0.928 | 135.550 | 19.245 | 11.282 | 0.669 | 0.869 | 0.667 | 0.876 | 0.855 | 0.600 | 0.930 | 0.381 | |
| 2 | 0.927 | 133.438 | 18.591 | 10.494 | 0.682 | 0.865 | 0.674 | 0.891 | 0.809 | 0.592 | 0.903 | 0.423 | |
| 3 | 0.929 | 148.985 | 13.544 | 9.218 | 0.708 | 0.872 | 0.698 | 0.882 | 0.807 | 0.696 | 0.876 | 0.621 | |
| 4 | 0.937 | 158.041 | 8.588 | 12.908 | 0.742 | 0.842 | 0.736 | 0.842 | 0.846 | 0.726 | 0.884 | 0.666 | |
| SupCon | 5 | 0.935 | 161.662 | 7.455 | 13.168 | 0.711 | 0.854 | 0.725 | 0.853 | 0.849 | 0.711 | 0.876 | 0.639 |
| 6 | 0.937 | 163.736 | 6.264 | 11.734 | 0.752 | 0.865 | 0.732 | 0.865 | 0.849 | 0.742 | 0.877 | 0.698 | |
| 7 | 0.936 | 164.397 | 5.306 | 9.679 | 0.688 | 0.868 | 0.678 | 0.868 | 0.849 | 0.775 | 0.877 | 0.744 | |
| 8 | 0.938 | 167.184 | 4.434 | 9.826 | 0.749 | 0.850 | 0.726 | 0.852 | 0.842 | 0.793 | 0.870 | 0.774 | |
| 9 | 0.938 | 167.316 | 4.306 | 8.397 | 0.727 | 0.858 | 0.745 | 0.859 | 0.841 | 0.815 | 0.868 | 0.787 | |
| 10 | 0.938 | 167.586 | 4.182 | 8.259 | 0.720 | 0.851 | 0.736 | 0.851 | 0.838 | 0.824 | 0.865 | 0.800 | |
| Training | Epoch | ID Accuracy ↑ | Dispersion ↑ | Compactness ↓ | ID-OOD | MSP | Energy | KNN | Mahalanobis | ||||
|---|---|---|---|---|---|---|---|---|---|---|---|---|---|
| Separability ↑ | AUROC ↑ | FPR95 ↓ | AUROC ↑ | FPR95 ↓ | AUROC ↑ | FPR95 ↓ | AUROC ↑ | FPR95 ↓ | |||||
| 1 | 0.745 | 86.386 | 38.342 | 13.311 | 0.739 | 0.794 | 0.810 | 0.705 | 0.927 | 0.481 | 0.829 | 0.626 | |
| 2 | 0.804 | 87.198 | 35.562 | 14.676 | 0.733 | 0.787 | 0.810 | 0.692 | 0.929 | 0.475 | 0.847 | 0.609 | |
| 3 | 0.842 | 89.052 | 33.008 | 17.263 | 0.749 | 0.770 | 0.819 | 0.636 | 0.934 | 0.446 | 0.867 | 0.547 | |
| 4 | 0.860 | 89.508 | 30.364 | 18.668 | 0.750 | 0.780 | 0.822 | 0.629 | 0.933 | 0.446 | 0.878 | 0.520 | |
| CE | 5 | 0.872 | 91.260 | 29.191 | 18.844 | 0.794 | 0.752 | 0.842 | 0.603 | 0.927 | 0.473 | 0.872 | 0.525 |
| 6 | 0.878 | 90.918 | 27.667 | 19.017 | 0.798 | 0.736 | 0.834 | 0.607 | 0.921 | 0.495 | 0.865 | 0.515 | |
| 7 | 0.884 | 91.440 | 25.515 | 21.154 | 0.821 | 0.706 | 0.855 | 0.549 | 0.927 | 0.469 | 0.885 | 0.475 | |
| 8 | 0.888 | 91.601 | 24.952 | 21.588 | 0.830 | 0.700 | 0.858 | 0.555 | 0.925 | 0.500 | 0.885 | 0.475 | |
| 9 | 0.890 | 91.885 | 24.063 | 21.728 | 0.837 | 0.693 | 0.862 | 0.548 | 0.924 | 0.499 | 0.884 | 0.474 | |
| 10 | 0.890 | 91.969 | 23.580 | 22.184 | 0.844 | 0.676 | 0.866 | 0.541 | 0.924 | 0.489 | 0.887 | 0.479 | |
| 1 | 0.756 | 85.080 | 38.572 | 13.219 | 0.737 | 0.800 | 0.794 | 0.750 | 0.924 | 0.500 | 0.832 | 0.631 | |
| 2 | 0.825 | 87.712 | 35.636 | 15.552 | 0.734 | 0.782 | 0.811 | 0.678 | 0.928 | 0.493 | 0.854 | 0.587 | |
| 3 | 0.852 | 89.502 | 33.618 | 18.240 | 0.780 | 0.728 | 0.835 | 0.609 | 0.933 | 0.438 | 0.874 | 0.508 | |
| 4 | 0.874 | 89.802 | 31.870 | 18.473 | 0.777 | 0.754 | 0.828 | 0.601 | 0.926 | 0.463 | 0.869 | 0.523 | |
| TAPT | 5 | 0.886 | 91.409 | 29.624 | 18.564 | 0.792 | 0.737 | 0.830 | 0.830 | 0.917 | 0.518 | 0.855 | 0.573 |
| 6 | 0.882 | 91.537 | 28.103 | 19.632 | 0.812 | 0.723 | 0.841 | 0.587 | 0.918 | 0.523 | 0.863 | 0.531 | |
| 7 | 0.891 | 91.683 | 26.551 | 20.700 | 0.823 | 0.711 | 0.853 | 0.559 | 0.924 | 0.486 | 0.875 | 0.503 | |
| 8 | 0.889 | 91.731 | 25.830 | 20.536 | 0.829 | 0.694 | 0.851 | 0.574 | 0.918 | 0.515 | 0.869 | 0.524 | |
| 9 | 0.888 | 91.874 | 25.309 | 21.490 | 0.835 | 0.683 | 0.858 | 0.563 | 0.920 | 0.494 | 0.878 | 0.489 | |
| 10 | 0.890 | 91.969 | 24.302 | 21.409 | 0.839 | 0.686 | 0.858 | 0.556 | 0.918 | 0.513 | 0.875 | 0.502 | |
| 1 | 0.667 | 69.588 | 36.713 | 9.288 | 0.734 | 0.796 | 0.786 | 0.726 | 0.922 | 0.510 | 0.820 | 0.656 | |
| 2 | 0.750 | 75.252 | 34.277 | 11.627 | 0.748 | 0.742 | 0.808 | 0.669 | 0.926 | 0.496 | 0.827 | 0.619 | |
| 3 | 0.803 | 79.054 | 31.839 | 13.914 | 0.738 | 0.771 | 0.806 | 0.674 | 0.935 | 0.437 | 0.856 | 0.561 | |
| 4 | 0.822 | 82.853 | 29.858 | 15.612 | 0.741 | 0.769 | 0.807 | 0.652 | 0.931 | 0.445 | 0.856 | 0.555 | |
| SupCon | 5 | 0.847 | 84.920 | 28.296 | 17.149 | 0.748 | 0.774 | 0.803 | 0.638 | 0.929 | 0.452 | 0.863 | 0.520 |
| 6 | 0.868 | 88.327 | 26.281 | 18.311 | 0.774 | 0.757 | 0.808 | 0.637 | 0.923 | 0.470 | 0.863 | 0.524 | |
| 7 | 0.869 | 89.118 | 24.956 | 19.524 | 0.790 | 0.747 | 0.823 | 0.587 | 0.926 | 0.462 | 0.872 | 0.500 | |
| 8 | 0.882 | 89.527 | 24.449 | 20.277 | 0.794 | 0.722 | 0.827 | 0.584 | 0.927 | 0.449 | 0.874 | 0.471 | |
| 9 | 0.884 | 90.408 | 23.481 | 20.775 | 0.813 | 0.711 | 0.836 | 0.581 | 0.924 | 0.473 | 0.873 | 0.467 | |
| 10 | 0.884 | 90.487 | 23.106 | 21.220 | 0.821 | 0.697 | 0.842 | 0.568 | 0.925 | 0.465 | 0.877 | 0.465 | |
Appendix E Effect of Temperature in SupCon
Contrastive loss is shown to be a hardness-aware loss function, penalizing hard negative samples by reducing tolerance to them Wang and Liu (2021). The temperature has been shown to control the tolerance to negative samples. As seen in Figure 7, low temperature leads to a uniform distribution with high separability in the learnt embedding space, but this can reduce tolerance to semantically similar samples, breaking underlying semantic structure. The temperature must be set optimally to balance the ‘uniformity-tolerance’ trade-off, having some tolerance to semantically similar examples. When IMDB is ID, we find OOD detection to be optimal at , since the two classes of the dataset share semantic similarities. However, with the 20NewsGroups topic classification task, we find a lower value of to be optimal. This is because a larger number of ID classes requires a stronger uniformity in the learnt distribution, and the weaker semantic similarities between classes assures that this uniformity does not hurt performance.
Tables 14, 16 and 15 show the effects of varying the temperature parameter in the SupCon loss, on OOD detection, in the settings of OoD semantic shift, OoD background shift and same-domain shift. All models are fine-tuned for 10 epochs.
Appendix F Effect of
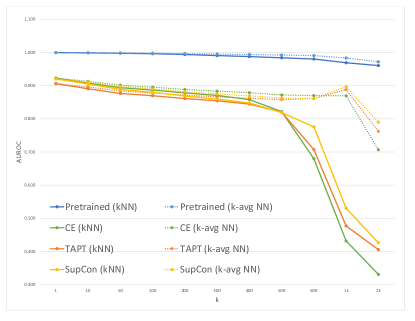
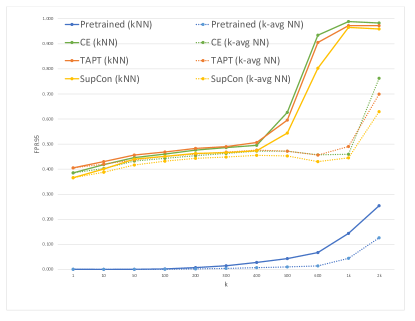
Figure 8 shows us that is consistently the optimal for kNN, across fine-tuning objectives and distribution shifts. The detection performance remains strong until reaches the ID class size, which is between 400 and 600 for 20NewsGroups. After this point, the nearest neighbour for an ID and OOD point will both be outside the nearest ID class cluster, making both distances more comparable and harder to distinguish. With pre-trained models, the performance remains strong as there is no concept of class clusters and a single domain cluster is instead present.
| KNN(non-parametric) | Mahalanobis (parametric) | ||||||||
| IDOOD Pair | Training | AUROC ↑ | AUPR (In) ↑ | AUPR (Out) ↑ | FPR95 ↓ | AUROC ↑ | AUPR (In) ↑ | AUPR (Out) ↑ | FPR95 ↓ |
| Out-of-Domain: Semantic Shift | |||||||||
| 20NGSST-2 | CE | 0.973 | 0.991 | 0.923 | 0.155 | 0.981 | 0.994 | 0.942 | 0.087 |
| TAPT | 0.969 | 0.990 | 0.903 | 0.169 | 0.981 | 0.994 | 0.939 | 0.088 | |
| SupCon | 0.969 | 0.990 | 0.909 | 0.180 | 0.980 | 0.994 | 0.943 | 0.094 | |
| Pre-trained | 1.000 | 1.000 | 1.000 | 0.000 | 1.000 | 1.000 | 1.000 | 0.000 | |
| 20NGRTE | CE | 0.922 | 0.958 | 0.858 | 0.410 | 0.945 | 0.970 | 0.902 | 0.285 |
| TAPT | 0.898 | 0.942 | 0.822 | 0.455 | 0.919 | 0.952 | 0.869 | 0.352 | |
| SupCon | 0.923 | 0.959 | 0.858 | 0.393 | 0.952 | 0.975 | 0.914 | 0.248 | |
| Pre-trained | 1.000 | 1.000 | 0.999 | 0.000 | 1.000 | 1.000 | 0.999 | 0.000 | |
| Hyperparameter | Value |
|---|---|
| Batch size | 4 |
| Learning rate | 1e-5 |
| Weight decay | 0.01 |
| Maximum sequence length | 256 |
| Number of pre-training epochs (for TAPT) | 3 |
| Contrastive loss weight (for SupCon) | 2.0 |
| CE loss weight (for SupCon) | 1.0 |
| Temperature (for SupCon) | 0.1 or 0.7 () |
Appendix G Details on Implementation
We use RoBERTa from the HuggingFace library444https://github.com/huggingface/transformers, and use PyTorch to train our models. Hyperparameter search is performed through a grid search. Apart from the default parameters in the trainer module from HuggingFace, our selected hyperparameters are listed in Table 13.
Computations
The RoBERTa base model has approximately 125 million parameters, including those of the classification head. On a single NVIDIA GeForce RTX 2080 Ti GPU, training the model for 10 epochs takes approximately 8-12 hours, and OOD detection for a single dataset takes approximately 15 minutes. Over the scale of our experiments, we have used about 200 hours of GPU training time.
Multiple Runs
Following the protocol in Arora et al. (2021), we report results over a single run. However, in Table 12 we show results of a subset of experiments averaged over 3 runs. There is no significant difference between the results in Table 12 and Table 2, indicating that our experiments are stable across runs. Therefore, for the sake of computational resources and time, we stick to the single-run practice in our experiments.
| ID Acc. | MSP | Energy | KNN | Mahalanobis | |||||
|---|---|---|---|---|---|---|---|---|---|
| AUROC↑ | FPR95↓ | AUROC↑ | FPR95↓ | AUROC↑ | FPR95 | AUROC↑ | FPR95↓ | ||
| 0.1 | 0.851 | 0.830 | 0.662 | 0.868 | 0.413 | 0.913 | 0.413 | 0.930 | 0.349 |
| 0.2 | 0.850 | 0.826 | 0.635 | 0.851 | 0.422 | 0.910 | 0.426 | 0.932 | 0.316 |
| 0.3 | 0.855 | 0.839 | 0.650 | 0.864 | 0.447 | 0.913 | 0.448 | 0.933 | 0.342 |
| 0.4 | 0.853 | 0.817 | 0.671 | 0.836 | 0.486 | 0.905 | 0.470 | 0.925 | 0.373 |
| 0.5 | 0.853 | 0.822 | 0.645 | 0.844 | 0.441 | 0.904 | 0.434 | 0.921 | 0.347 |
| 0.6 | 0.852 | 0.816 | 0.649 | 0.836 | 0.475 | 0.901 | 0.453 | 0.918 | 0.364 |
| 0.7 | 0.853 | 0.805 | 0.683 | 0.822 | 0.518 | 0.887 | 0.495 | 0.903 | 0.417 |
| 0.8 | 0.854 | 0.805 | 0.673 | 0.827 | 0.506 | 0.903 | 0.468 | 0.920 | 0.394 |
| 0.9 | 0.854 | 0.818 | 0.668 | 0.840 | 0.483 | 0.902 | 0.483 | 0.920 | 0.399 |
| 1 | 0.853 | 0.799 | 0.706 | 0.814 | 0.509 | 0.894 | 0.489 | 0.912 | 0.400 |
| ID Acc. | MSP | Energy | KNN | Mahalanobis | |||||
|---|---|---|---|---|---|---|---|---|---|
| AUROC↑ | FPR95↓ | AUROC↑ | FPR95↓ | AUROC↑ | FPR95 | AUROC↑ | FPR95↓ | ||
| 0.1 | 0.939 | 0.788 | 0.833 | 0.728 | 0.836 | 0.842 | 0.750 | 0.866 | 0.750 |
| 0.2 | 0.940 | 0.682 | 0.850 | 0.642 | 0.852 | 0.819 | 0.812 | 0.844 | 0.796 |
| 0.3 | 0.941 | 0.725 | 0.835 | 0.732 | 0.834 | 0.832 | 0.814 | 0.856 | 0.792 |
| 0.4 | 0.939 | 0.751 | 0.859 | 0.721 | 0.861 | 0.822 | 0.835 | 0.845 | 0.812 |
| 0.5 | 0.940 | 0.784 | 0.842 | 0.758 | 0.837 | 0.826 | 0.825 | 0.849 | 0.796 |
| 0.6 | 0.939 | 0.768 | 0.818 | 0.719 | 0.820 | 0.829 | 0.797 | 0.855 | 0.776 |
| 0.7 | 0.938 | 0.720 | 0.851 | 0.736 | 0.851 | 0.833 | 0.833 | 0.859 | 0.834 |
| 0.8 | 0.940 | 0.775 | 0.828 | 0.651 | 0.826 | 0.823 | 0.820 | 0.841 | 0.806 |
| 0.9 | 0.939 | 0.757 | 0.891 | 0.652 | 0.889 | 0.861 | 0.829 | 0.876 | 0.811 |
| 1 | 0.939 | 0.738 | 0.857 | 0.748 | 0.857 | 0.809 | 0.835 | 0.840 | 0.822 |
| ID Acc. | MSP | Energy | KNN | Mahalanobis | |||||
|---|---|---|---|---|---|---|---|---|---|
| AUROC↑ | FPR95↓ | AUROC↑ | FPR95↓ | AUROC↑ | FPR95 | AUROC↑ | FPR95↓ | ||
| 0.1 | 0.888 | 0.817 | 0.700 | 0.842 | 0.570 | 0.927 | 0.470 | 0.877 | 0.478 |
| 0.2 | 0.885 | 0.825 | 0.681 | 0.835 | 0.592 | 0.922 | 0.509 | 0.878 | 0.510 |
| 0.3 | 0.879 | 0.802 | 0.733 | 0.817 | 0.600 | 0.922 | 0.502 | 0.866 | 0.525 |
| 0.4 | 0.889 | 0.815 | 0.670 | 0.809 | 0.594 | 0.922 | 0.522 | 0.874 | 0.524 |
| 0.5 | 0.822 | 0.706 | 0.818 | 0.749 | 0.747 | 0.913 | 0.576 | 0.821 | 0.662 |
| 0.6 | 0.890 | 0.794 | 0.713 | 0.796 | 0.641 | 0.919 | 0.561 | 0.871 | 0.563 |
| 0.7 | 0.891 | 0.811 | 0.694 | 0.804 | 0.609 | 0.921 | 0.534 | 0.876 | 0.538 |
| 0.8 | 0.892 | 0.814 | 0.697 | 0.812 | 0.602 | 0.922 | 0.534 | 0.879 | 0.525 |
| 0.9 | 0.847 | 0.730 | 0.798 | 0.747 | 0.714 | 0.909 | 0.606 | 0.818 | 0.677 |
| 1 | 0.888 | 0.817 | 0.706 | 0.819 | 0.611 | 0.920 | 0.534 | 0.875 | 0.541 |