Coarse-to-Fine: a Hierarchical Diffusion Model for Molecule Generation in 3D
Abstract
Generating desirable molecular structures in 3D is a fundamental problem for drug discovery. Despite the considerable progress we have achieved, existing methods usually generate molecules in atom resolution and ignore intrinsic local structures such as rings, which leads to poor quality in generated structures, especially when generating large molecules. Fragment-based molecule generation is a promising strategy, however, it is nontrivial to be adapted for 3D non-autoregressive generations because of the combinational optimization problems. In this paper, we utilize a coarse-to-fine strategy to tackle this problem, in which a Hierarchical Diffusion-based model (i.e. HierDiff) is proposed to preserve the validity of local segments without relying on autoregressive modeling. Specifically, HierDiff first generates coarse-grained molecule geometries via an equivariant diffusion process, where each coarse-grained node reflects a fragment in a molecule. Then the coarse-grained nodes are decoded into fine-grained fragments by a message-passing process and a newly designed iterative refined sampling module. Lastly, the fine-grained fragments are then assembled to derive a complete atomic molecular structure. Extensive experiments demonstrate that HierDiff consistently improves the quality of molecule generation over existing methods111Code is available at https://github.com/qiangbo1222/HierDiff.
1 introduction
Deep generative models have specifically shown great promise in modeling complex graph-like molecular structures, ranging from generating molecular atom-bond graphs (Li et al., 2018a; Liu et al., 2018; Jin et al., 2018a) to generating molecular conformations from graphs (Xu et al., 2022; Jing et al., 2022). Despite the significant progress achieved, a remaining but vital research direction in this track is de novo design of drug molecules in 3D space. Integrating the 3D information into the molecule design process enjoys several advantages over only involving topological information in many important applications, e.g., structure-based drug design (Zhang et al., 2023; Peng et al., 2022; Luo et al., 2021), molecular dynamic simulation (Hansson et al., 2002), 3D similarity searching (Shin et al., 2015).
Some early studies on 3D molecule generation usually adopt an autoregressive approach (Gebauer et al., 2019; Luo et al., 2021; Li et al., 2021), which introduces an artificial order on the atoms and generates the atoms one by one in a language generation way. However, molecules have a natural geometric structure in 3D. Besides, these models suffer from the scale and error accumulation problem (Roney et al., 2022; Luo & Ji, 2022). To tackle these problems, non-autoregressive models have been introduced in this area and gain impressive results. For example, inspired by the successful diffusion model in text and image generation, Hoogeboom et al. (2022) proposed the first diffusion model for molecule generation and significantly improves the validity of generated molecules.
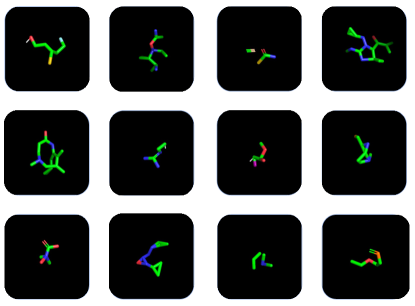
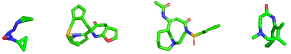
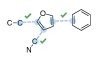
Nevertheless, the atom-level generation manner in these works, though enjoys higher flexibility to place each atom, lacks the necessary constraints to obtain reliable molecule structures, especially when generating large molecules. As shown in Figure 1, without imposing Euclidean geometric constraints on the modeling process, the generated 3D aromatic rings could seriously violate basic chemical rules.
In this paper, we propose a coarse-to-fine approach to tackle the above problems. The basic idea is that we first generate the coarse-grained structure of the molecule, where each node represents a cluster of fragments, and then the coarse-grained structure is decoded into fine-grained fragments to assemble atomic molecule structure. In this way, valid local structures will be preserved by replacing the computation unit from atoms with fragments. However, such a process is non-trivial since generated neighborhood fragments may suffer from atom-bonds conflicts, preventing them to be connected.
To tackle the problem, we treat 3D molecule generation as a constraint generation problem and propose a novel Hierarchical Diffusion-based model (HierDiff). In the coarse-grained phase, our method generates the fragment representation instead of deterministic fragment. Specifically, we introduce two different ways to obtain chemically interpretable features for representing fragments. Then we propose a geometric diffusion model to generate these fragment representations and their Cartesian coordinates in an efficient non-autoregressive manner. In the fine-grained phase, we utilize an equivariant message-passing network to guarantee connectivity and an iterative refinement module to correct the bias. At last, we construct atom-level 3D structure based on the decoded 3D fragment graph.
The proposed coarse-to-fine approach nicely mimics the chemistry expert’s drug design process by combining fragments from a pre-defined functional group database. In this way, important inductive biases in this area are encoded in our model.Furthermore, from machine learning’s perspective, the fragment-based representation of molecules significantly reduces unnecessary degrees of freedom in the atom-based methods, thus will lead to global optimum convergence and better generalization ability.
Extensive experiments are conducted to test our model on the challenging task of generating drug-size molecules. Compared to the baseline model, HierDiff can generate both realistic molecules with better drug-like properties and conformations that are much closer to the ground truth conformations. Visualized results also demonstrate HierDiff is capable of generating high-quality molecules with more stable substructures.
2 Related work
Molecule generation is one of the fundamental problems in drug discovery. In earlier works, molecule generation tasks are tackled by generating sequential representations of molecules, i.e. SMILES e.g. (Kusner et al., 2017; Dai et al., 2018; Segler et al., 2018). With the development of graph neural networks, researchers begin to utilize the graph-based generative model to generate molecular topological structures and gain great progress (Jin et al., 2018b, a; Li et al., 2018b) However, neither sequence nor graph-based models capture the 3D geometric information, which is crucial for various molecule applications, such as molecule property prediction and protein-ligand docking. Recently, 3D molecule generation has become an emerging hot topic in this area, and different deep generative models have been proposed to tackle this problem. For example, Gschnet (Gebauer et al., 2019) employs an autoregressive process equipped with Schnet (Schütt et al., 2017) to sample atoms and bonds iteratively. G-spherenet (Luo & Ji, 2022) applied discrete flows to autoregressively generate invariant geometric features. EnFlow (Satorras et al., 2022) utilizes continuous time normalizing flows to sample valid molecules. EDM (Hoogeboom et al., 2022) is the first to apply the powerful diffusion model to this area and gains further improvements. However, EDM always generates unrealistic ring systems and broken molecules, when training on large molecules.
A related branch of molecule generation is hierarchical graph generation. Most previous works derive the hierarchical structure based on some intrinsic rules. For example, some work uses different granularity levels, such as atom-motif (Jin et al., 2020, 2019), or node-edge(Xianduo et al., 2022), to construct different hierarchies. (Zhou et al., 2019) and (Chauhan et al., 2019) use predefined rules to distinguish different nodes to different levels. (Mi et al., 2021) employs the natural graphical topology to define the hierarchy. (Geng et al., 2023) collects connection information to form a hierarchical structure. (Kuznetsov & Polykovskiy, 2021) obtain the hierarchy by adding latent variables to different layers of the model. While in our method, we use the learnable decoding module to approximate a semantic-guided hierarchy.
3 Backgrounds
3.1 Denoising Diffusion Probabilistic Model
Denoising diffusion probabilistic model (DDPM) (Yang et al., 2022b; Sohl-Dickstein et al., 2015) provides a powerful generative modeling tool by reversing a diffusion process. More specifically, the diffusion process projects the noise into the ground truth data and the generative process learns to reverse the process. The two processes imply a latent variable model, where are the latent variables. The forward process could be seen as a fixed approximate posterior distribution:
| (1) | ||||
Here corresponds to a fixed variance schedule. For simplicity, we let and , the forward pass for arbitrary time step has an analytic form, i.e., . The generative process parameterized the transition kernel of the Markov chains, the corresponding likelihood function could be derived as:
| (2) | ||||
Here the refers to parameterized means function and the is the predefined variance. For the initial distribution , we select invariant base distribution for equivariant coordinates.
3.2 Equivariance and SE(3)-invariant Density Estimation
Equivariance widely exists in the physical world, especially in atomic systems. For example, the vector fields of atomic forces should rotate or translate correspondingly with the 3D positions of the molecule. Thus integrating such inductive bias into the function modeling has appealing properties and has been widely explored (Wu et al., 2018; Schütt et al., 2017; Satorras et al., 2021). More specifically, given two transformation and acting on the space and , a function is considered as equivariant with respect to the group if the following is satisfied:
| (3) |
In this task, we mainly focus on the SE(3) group, i.e., the group of rotation and translation in the 3D space. For generative modeling of 3D molecule graph, the density function of the model distribution should be SE(3)-invariant, i.e., . To this end, previous methods either directly model the invariant components, e.g., bond angles, or use some invariant base distribution and model the transformation by the equivariant neural network (Jing et al., 2022; Satorras et al., 2022). HierDiff extends the latter one to an equivariant hierarchical framework to model fragment coordinates and fit bond lengths to predefined rules, which will be discussed in Sec. 5.
4 Coarse-to-Fine Approach
In this section, we introduce our coarse-to-fine approach, including problem formulation and coarse-to-fine definition.
4.1 Problem Formulation and Notations
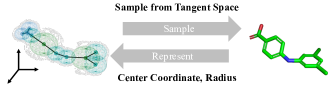
Let be the space of 3D graphs, where each 3D graph consists of the fragment set and the edge set . More specifically, every fragment represents a combination of several atoms and bonds, e.g., a benzene ring could be a fragment that includes six carbon atoms and aromatic bonds. Instead of using edges to represent chemical bonds as in previous works, we use edge to indicate that there is a bond/atom shared by two fragments and . This kind of definition enables us to model molecule geometry using tangent condition on fragment sphere, as Fig. 5 , with a reasonable size fragment vocabulary. Therefore, the target of a 3D generation model is to learn a probabilistic model to model the empirical distribution of 3D molecule graphs, which could also be used to sample new molecules.
4.2 Coarse-to-Fine Framework
4.2.1 Challenges of Non-autoregressive Methods
Compared with the autoregressive approach, non-autoregressive generative models are more promising for 3D molecule generation, due to their natural advantages of global modeling ability (De Cao & Kipf, 2018; Kwon et al., 2019; Satorras et al., 2022). Empirically, previous work has shown consistent observations (Hoogeboom et al., 2022).
Though there are several appealing properties, the non-autoregressive model at the fragment level indeed implies the following structure generation procedure under hard constraints.
| (4) | ||||
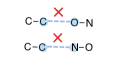
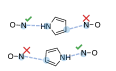
where stands for the substructure which consists of and its neighbors, stands for the set of all valid substructures. Intuitively, the valid substructures satisfy the following conditions: the neighbors should hold matched components(atoms/bonds) to get ensembled; for the cases where a node has multiple neighbors there should also be enough matched components in this node to match all its neighbors. We provide Fig. 2 to better illustrate the constraints in Eq. (4).
Limited chemical valency makes conflicts really common in fragment generation. Note that the problem of avoiding fragment conflict has high complexity and brings the so-called ”combinatorial exploding” issues(Jin et al., 2020) because of the multi-hop conflicts. For non-autoregressive modeling fashion, the complexity increases exponentially with the structure size. This problem is also discovered in other tasks, for example, Dispatching Route Generation (Ding et al., 2021), Optimal Experiment Design (Le Bras et al., 2012), and Protein Alignment Generation (Xu et al., 2015). In fragment-based molecule generation, it is challenging to generate realistic drug-size molecules in an ordering-agnostic way.
4.2.2 Solutions for Avoiding Conflicts
It is difficult to sample from the distribution with hard constraints. One direct solution that was adopted in previous work (Popova et al., 2019) is to conduct rejection sampling, i.e., only accept the connectable molecules. Nevertheless, rejection sampling is not applicable in practice for fragment-based methods due to the extremely low acceptance rate; Alternatively, one can use a learnable model, , to approximate the hard constraint, where stands for the neighbors of . Correspondingly, the generative distribution could be written as another target distribution . Unfortunately, Markov chain Monte Carlo (MCMC) sampling is needed, such as Gibbs Sampling, to conduct sampling from such distribution, which still suffers from efficiency issues.
Instead of making generated samples satisfy the constraint through filter or refinement, we try to decompose and embed the constraint directly into the model phase within a hierarchical fashion.
More specifically, we design the variable () as the latent variable and the probabilistic model could be expressed as .
Consequently, we could obtain a lower bound of the maximum likelihood objective by the concavity of the logarithm, as follows:
| (5) | ||||
where stands for the possible support of . Formally, in Eq. (5) is implemented by extracting chemical features and averaging the atom coordinates. As is set to a constant term, the objective will include only the former two terms, i.e. and . The first objective could be approximated by a coarse-grained fragment diffusion model and the second objective is modeled by equivariant message passing networks and iterative refinement process.
Intuitively, the coarse-to-fine process is like first determining the position and the function of each component, then finding the connectable fragments from small subsets and assembling them. Therefore, HierDiff could maintain the global modeling property of non-autoregressive methods and also significantly reduce the complexity of finding the connectable fragments.
5 HierDiff: hierarchical diffusion-based model
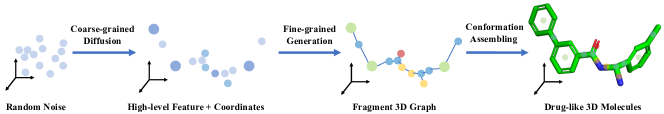
In this section, we introduce the proposed HierDiff model in detail, as illustrated in Fig. 3, including coarse-grained fragment generation, fine-grained fragment generation, and atom conformation assembling which also correspond to the parameterized terms in Eq. (5).
5.1 Coarse-Grained Fragment Diffusion
We define as the representation of the coarse nodes, where stands for the invariant chemical features and stands for the equivariant positional features. Formally, in Eq. (5) is implemented by extracting chemical features to obtain and averaging all the atom coordinates to obtain . Specifically, the property-based features could depend on both fragment and the attachment , i.e. the connection to neighbor fragments.
In the coarse-grained phase, a diffusion model is proposed to approximate . Note that, when sampling from the diffusion model, we first sample the number of coarse nodes from the histogram we calculated on the training set.
5.1.1 Chemical Feature
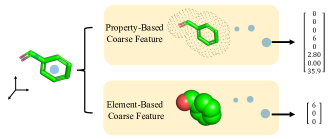
We carefully design the features to be discriminative enough for fragments and molecules with different chemical and geometrical properties, which allows us to easily integrate our domain knowledge as inductive bias into the model. And we specifically employ two kinds of features:
Property-based Coarse Feature: We summarize some important properties which are widely used in drug discovery into an 8-dimension vector, including the number of hydrogen bonds and rings, the area of different surfaces, etc.
Element-based Coarse Feature: We also include the histogram of element frequency, i.e., a 3-dimension vector, to the feature representation, inspired by the fact that elements with the same number of valence electrons usually share the same properties.
5.1.2 Positional Feature
There are several possible ways to represent the 3D conformation systems in fragment level, e.g., the dihedral angle between neighbor fragments, and the distance matrix. In this paper, we simply use the center coordinates as the positional feature of the coarse node, since we found that this information is enough to determine the conformation at atom resolution, with a predefined vocabulary of bond length and bond angles from the RDkit ETKDG module. Please note that the center position of the coarse node could be seen as the center of the conformation sphere which includes all possible conformations generated from the degree of freedom on rotation. The connected fragments correspond to the tangent condition which actually eliminates the degree of freedom, which is illustrated in Fig. 5.
5.1.3 Diffusion Process
Then, we introduce the modeling of and individually.
could be modeled by a typical diffusion model with Gaussian noise for step . However, we find that the -th term for continuous feature and , i.e. , should be designed carefully, as observed similarly in (Hoogeboom et al., 2022). In this paper, we use the following form, which has shown a better empirical performance.
Next, we describe the generation for .
To make the likelihood function in Eq. (2) to be SE(3)-invariant, we set the initial distribution under the zero center of mass (CoM) systems (Köhler et al., 2020), i.e., applying a CoM-free Gaussian:
Here belongs to the space , where is the number of fragment nodes and equals the coordinate dimension. Besides, an equivariant Markov transition kernel is constructed under the widely applied noise parameterization (Ho et al., 2020):
If is parameterized by SE(3)-equivariant networks, the transitional kernel is also SE(3)-equivariant, i.e., (Xu et al., 2022). We leave the detailed proof in Appendix A.2.
5.2 Fine-Grained Fragment Generation
After were generated by the diffusion model, a set of coarse-grained nodes in 3D space is obtained, illustrated in Fig. 3. Now we introduce the detailed process of generating fine-grained fragment types and edges, conditioned on the coarse-grained nodes, which correspond to the term .
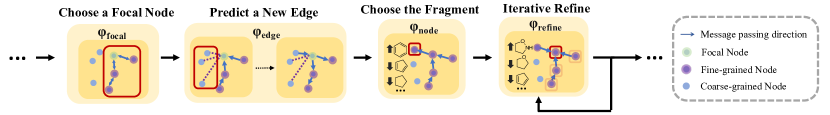
We first briefly introduce the decoding logic here. In each decoding step, the fine-grained generation process contains four stages. Firstly, we select a focal node from all the existing fine-grained nodes with a parameterized neural network module . Next, we utilize a link prediction network, i.e. , to identify a new node that could be linked to the focal node from all the remaining coarse-grained nodes. Then we obtain the fine-grained fragment type of the above newly linked coarse-grained node with the help of another network . At last, an iterative refinement process is conducted to correct the bias in fine-grained nodes, based on the newly determined fragment type. It should be noted that in the beginning, all the nodes are coarse-grained, so we randomly select a node and directly use to predict its fragment type. The above procedure is illustrated in Fig. 6. We emphasize several key elements of our assembling module in the following:
5.2.1 Iterative Refinement
Now we delve into the details of the iterative refinement process. The motivation for introducing this iterative refinement process is to correct the bias in the existing fine-grained nodes, to enhance the ability to generate more realistic molecules from a global view. Specifically, we design a mask prediction model to approximate the probability of each decoded fine-grained fragment conditioned on all coarse-grained nodes and the other fine-grained nodes. The target is to maximize the joint probability of fine-grained nodes as follows:
| (6) |
where is the set of all existing fine-grained nodes, is the set of coarse-grained nodes, and is a function to return the fragment type for a specific node. To sample from the above target distribution, we defined a Markov Chain, in which node type replacement is defined as the state transition, and an early-stopping Monte Carlo sampling strategy is adopted to conduct the sampling process. The detailed algorithm is illustrated in Appendix A.4. We also conduct an ablation study to prove the effectiveness of the proposed iterative refinement process, as shown in Appendix C.7.
5.2.2 Message Passing Neural Networks
Here we introduce the aforementioned models in the fine-grained process, i.e. , , and . In order to avoid the disconnectivity problem as Fig.2, we need to elaborately design these models.
Specifically, the input is a set of 3D fragments, represented by both chemical and positional features. In addition, we add one-hot vectors to indicate the fragment types for all fine-grained nodes. At the initial stage, the input is treated as a fully connected 3D graph and a vanilla EGNN (Satorras et al., 2021) extracts the initial embeddings for all links and nodes. According to the fine-grained generation process, simply passes information among fine-grained nodes. then aggregates information of all fine-grained nodes to the focal node by a tree bottom-up pattern, in which the focal node is treated as the root of the tree structure. After the new edge is predicted, the network broadcasts the addition of the new edge to all fine-grained nodes in a tree top-down pattern. Finally, aggregates the information from all fine-grained nodes in the bottom-up pattern to the new node for decoding the fine-grained fragment type. For mask prediction module , we utilize a bottom-up EGNN similar to . The information is aggregated from all fine-grained nodes to the masked nodes, to compute the target distribution as in Eq. (6). The illustration of the message-passing process could be found in Fig. 6. We discussed model-level modification of EGNN in Appendix A.3.
5.2.3 Training
During training, we start by first randomly sampling a connected subgraph at each step. Then a random leaf node is picked, and we simulate the fine-grained generation of this node All the fine-grained nodes and edges of the subgraph except the selected one are kept. For the other nodes, we only maintain the coarse features and their position. Then is trained based on the above feature to maximize the probability of the parent of the selected node among the nodes in the fine-grained subgraph. is trained to maximize the probability of the edge link between the focal node and the selected node among all other coarse-grained nodes. is trained to output the fine-grained fragment type of the selected node. For the iterative refinement part, we just randomly mask a node’s fine-grained feature on the subgraph, and is trained to reconstruct its masked fragment type. Detailed implementations and objectives could be found in Appendix A.4.
5.3 Assembling to Atom Conformation
Given all fine-grained nodes and link relations determined in the fine-grained generation process, we have to decide which atoms within two linked fragments could be merged to construct the atom-level conformation. To conduct this process, we first randomly choose a fragment, enumerate all possible attachments for its neighbor fragments, and select the one that has the closest fragment center geometric as our generated positional features in the coarse-grained fragment generation. Specifically, we use RDkit to generate the local conformation for each candidate attachment following (Wang et al., 2022) and apply the root-mean-square deviation (RMSD) to measure the difference between fragment center coordinates. The above process will be continued following the neighboring structure until all the local connections are determined. Then we generate the coordinates of each atom. To plug the local conformations into each molecule coordinate system, we need to determine the rotation matrix () and translation vector (). Here we compute and between generated local coordinates and RDkit predicted local coordinates using Kabsch Algorithm (Kabsch, 1976) at the fragment level. Then we applied the obtained , on the RDkit generated atom level coordinates to align the RDkit generated local geometry to our sampled center positions. This process starts from the subgraph constructed by a randomly selected fragment and its neighbors and is conducted successively until the full atom conformation is derived. Noted that, RDkit is only utilized for generating local geometry in conformation generation.
The full detailed algorithm is introduced in Appendix A.5.
6 Experiments
In this work, we mainly focus on generating drug-like molecules. So our main experiments are conducted on the dataset of GEOM (Axelrod & Gomez-Bombarelli, 2022) and CrossDocked2020 (Francoeur et al., 2020). Specifically, GEOM includes 304k drug-like molecules, and CrossDocked2020 (Francoeur et al., 2020) contains 100k 3D ligand structures extracted from protein-ligand complexes, respectively. As compared with two well-known 3D molecular generation models, i.e. EDM (Hoogeboom et al., 2022) and G-SphereNet (Luo & Ji, 2022), both versions of HierDiff achieve superior results, where HierDiff-E and HierDiff-P denotes the implementation using the element-based feature and property-based feature as representation, respectively. Though our model is not designed for generating small molecules, we also compare HierDiff with several existing models on QM9 (Axelrod & Gomez-Bombarelli, 2022), a popular benchmark for 3D molecule generation evaluation, which the results are shown in Table 5.
6.1 Drug-Likeness Evaluation
The purpose of our proposed generation method is to fabricate molecules that are similar to authentic drug molecules from scratch, thus it is important to measure how drug-likely are those fabricated molecules to true drug molecules.
6.1.1 Evaluation Metrics
Specifically, we mainly measure the drug-likeliness of a molecule from 6 aspects. Quantitative estimate of drug-likeness (QED), one of the most widely used metrics for virtual screening, is built on a series of carefully selected molecular properties to evaluate drug-likeness. Retrosynthetic accessibility (RA) is a machine learning based scoring function based on retrosynthesis protocol that evaluates synthetical accessibilities. Medicinal chemistry filter (MCF) is the rate of sampled molecules that do not contain any undruggable substructures (Brown et al., 2019). Synthetic accessibility score (SAS) is a ruled-based scoring function that evaluates the complexity of synthesizing a structure by organic reactions. LogP is the octanol-water partition coefficient which is the main factor that determines the distribution of the drug molecules, and indicates the difference between the computed LogP and the ground-truth one on the training distribution. Molecular weight (MW) is a measure of the sum of the atomic weight values of the atoms in a molecule. An ideal model will sample molecules from the same weight distribution as the training set, denoted as ground-truth MW. In practice, is usually adopted to measure the difference between the computed MW and the ground-truth one.
6.1.2 Experimental Results
Table. 1 shows the experimental results on GEOM and CrossDocked2020. From the results, it is obvious that HierDiff significantly outperforms EDM and G-SphereNet in terms of all the concerned evaluation metrics.
Specifically, the RA comparison results indicate that with all the sub-graphs derived from a predefined vocabulary, HierDiff generates molecules that are easier to synthesize in wet labs, without dangerous substructures. Since shows how close the distribution of generated molecules is to the training data, we can see that G-SphereNet is unable to generate large molecules, while HierDiff generates molecules with more similar size as the training data, as compared with EDM. We speculate that this is mainly due to the error accumulation problem in the autoregressive approach in G-SphereNet, which is proven by our ablation study in Table 12 of Appendix. Considering the poor performance of G-SphereNet on generating large molecules, we exclude it in the following conformation experiments.
We also carry out an ablation study on HierDiff w.r.t. the drug-likeliness. Specifically, we remove the iterative refining step and compare the obtained model with the original HierDiff. From the results shown in Appendix C.7, the model without iterative refining generates less complicated molecules, as compared with the original HierDiff, in terms of both QED and MCF. Though it has the ability to generate large molecules, such results are far from satisfactory in real applications. Through our analysis, the reason is that, without iterative refinement, HierDiff tends to choose fragments that are easier to assemble, indicating the importance of iterative refinement.
| GSNet | EDM | HierDiff-E | HierDiff-P | GEOM DRUG | |
| QED | 0.382 | 0.608 | 0.632 | 0.639 | 0.658 |
| RA | – | 0.441 | 0.548 | 0.639 | 0.915 |
| MCF | 0.489 | 0.621 | 0.727 | 0.659 | 0.774 |
| SAS | – | 4.054 | 3.859 | 3.547 | 4.018 |
| 2.306 | 0.566 | 0.653 | 0.128 | 0.000 | |
| 170.7 | 23.71 | 30.33 | 13.33 | 0.00 |
| GSNet | EDM | HierDiff-E | HierDiff-P | Cross Dock | |
| QED | 0.442 | 0.499 | 0.614 | 0.585 | 0.619 |
| RA | – | 0.332 | 0.574 | 0.262 | 0.912 |
| MCF | 0.449 | 0.613 | 0.759 | 0.687 | 0.746 |
| SAS | – | 7.056 | 4.051 | 5.397 | 2.564 |
| 3.359 | 2.840 | 1.872 | 1.176 | 0.000 | |
| 200.95 | 28.40 | 44.56 | 1.15 | 0.00 |
6.2 Conformation Quality Evaluation
6.2.1 Evaluation Metrics
However, since all generated molecules are new, i.e. not existing in training data, we cannot directly use ground-truth conformations from the database for evaluation. To obtain corresponding ground-truth conformation, we adopted the same experimental procedure as in (Axelrod & Gomez-Bombarelli, 2022). which has been proven to be suitable for evaluating the conformation quality 3D conformation generation in several previous work (Xu et al., 2022; Jing et al., 2022). Specifically, a computational costly molecular dynamic simulation (detailed experimental procedure is described in Appendix C.1) is carried out for all generated molecule graphs to return the set of MD simulated conformations. Then the coverage metric and matching metric denoted as Cov and Mat, are computed to measure the quality of generated conformations. The precise definitions are given as follows.
where denotes the generated conformation, represents the ground truth set of conformations sampled with MD simulation, denotes a ground truth instance from , is the indicator function which evaluates to 1 when the input is true otherwise 0, is the similarity threshold, which is set to 2Å in practice. From the above definition, the coverage metric describes the rate of ground truth conformations that are similar to the generated conformation, reflecting how likely the generated molecule is in a low energy state. The matching value is the minimum RMSD value between the generated molecule and the conformations in the ground truth set, indicating the similarity between the generated molecule and ground-truth conformations. In our experiments, we compute the coverage and matching metrics on both atom and fragment coordinates, to measure conformations quality at different levels.
| COV (atom) | MAT (atom) | COV (frag) | MAT (frag) | |
| EDM | 0.489 | 1.349 | 0.097 | 3.234 |
| HierDiff-E | 0.546 | 1.121 | 0.153 | 2.583 |
| HierDiff-P | 0.490 | 1.166 | 0.202 | 2.431 |
| GEOM | 0.589 | 0.494 | 0.435 | 1.494 |
6.2.2 Experimental Results
The experimental results listed in Table 2 show that HierDiff outperforms EDM consistently on all the evaluation metrics. Though HierDiff only generates center coordinates in the coarse phase, it is able to achieve impressive results on both levels, indicating the great power of HierDiff in capturing both global and local geometric information.
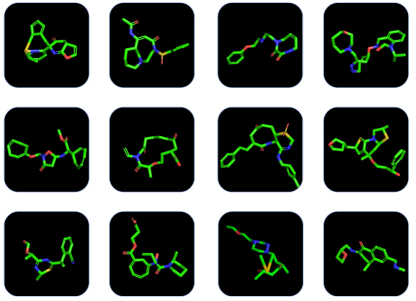
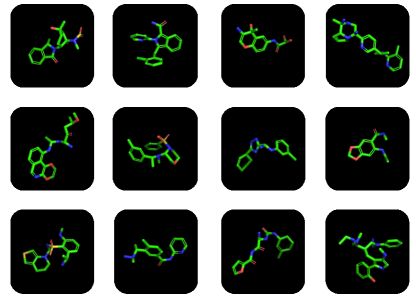
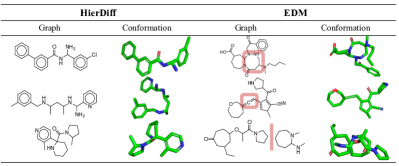
We also demonstrate some visualization results in Fig. 7. We can see that the structures generated from EDM are more chaotic, with clear distorted rings and unexpected broken substructures. On the contrary, our model generates much more stable molecular scaffolds, by utilizing the coarse-to-fine approach. We also provide force field based experiments on sampled conformation to prove that our model generates more low-energy conformations, shown in Appendix C.4 for space limitation. We discuss the choice of high-level features in Appendix C.9.
7 Conclusion
This paper is concerned with 3D molecule generation. To address the irrational molecule structure problems, a hierarchical diffusion probabilistic model is proposed. We carefully design our method so that it can solve the combinatorially constrained structure generation problem introduced by non-autoregressive fragment generation modeling. To our knowledge, our work is the first attempt to get the best of both the globalization of the non-autoregressive model and the effectiveness of the fragment-based generation. HierDiff generates better drug-like molecules, in terms of several widely used evaluation metrics. We believe that the proposed framework could inspire general solutions for other constrained structure generation tasks, such as protein alignment
Acknowledgements
This work was supported by the National Key R&D Program of China (No. 2021YFF1201600), Tsinghua University (NO.20221080053), Vanke Special Fund for Public Health and Health Discipline Development, and Beijing Academy of Artificial Intelligence(BAAI). Minkai Xu thanks the generous support of Sequoia Capital Stanford Graduate Fellowship.
References
- Axelrod & Gomez-Bombarelli (2022) Axelrod, S. and Gomez-Bombarelli, R. Geom, energy-annotated molecular conformations for property prediction and molecular generation. Scientific Data, 9(1):1–14, 2022.
- Brandstetter et al. (2021) Brandstetter, J., Hesselink, R., van der Pol, E., Bekkers, E. J., and Welling, M. Geometric and physical quantities improve e(3) equivariant message passing, 2021. URL https://arxiv.org/abs/2110.02905.
- Brown et al. (2019) Brown, N., Fiscato, M., Segler, M. H., and Vaucher, A. C. Guacamol: benchmarking models for de novo molecular design. Journal of chemical information and modeling, 59(3):1096–1108, 2019.
- Caccia et al. (2018) Caccia, M., Caccia, L., Fedus, W., Larochelle, H., Pineau, J., and Charlin, L. Language gans falling short. arXiv preprint arXiv:1811.02549, 2018.
- Chauhan et al. (2019) Chauhan, V., Gutfraind, A., and Safro, I. Multiscale planar graph generation. Applied Network Science, 4(1):1–28, 2019.
- Dai et al. (2018) Dai, H., Tian, Y., Dai, B., Skiena, S., and Song, L. Syntax-directed variational autoencoder for structured data. arXiv preprint arXiv:1802.08786, 2018.
- De Cao & Kipf (2018) De Cao, N. and Kipf, T. Molgan: An implicit generative model for small molecular graphs. arXiv preprint arXiv:1805.11973, 2018.
- Diao & Loynd (2022) Diao, C. and Loynd, R. Relational attention: Generalizing transformers for graph-structured tasks. arXiv preprint arXiv:2210.05062, 2022.
- Ding et al. (2021) Ding, F., Ma, J., Xu, J., and Xue, Y. Xor-cd: Linearly convergent constrained structure generation. In International Conference on Machine Learning, pp. 2728–2738. PMLR, 2021.
- Francoeur et al. (2020) Francoeur, P. G., Masuda, T., Sunseri, J., Jia, A., Iovanisci, R. B., Snyder, I., and Koes, D. R. Three-dimensional convolutional neural networks and a cross-docked data set for structure-based drug design. Journal of chemical information and modeling, 60(9):4200–4215, 2020.
- Fu et al. (2021) Fu, T., Xiao, C., Li, X., Glass, L. M., and Sun, J. Mimosa: Multi-constraint molecule sampling for molecule optimization. In Proceedings of the AAAI Conference on Artificial Intelligence, volume 35, pp. 125–133, 2021.
- Gebauer et al. (2019) Gebauer, N., Gastegger, M., and Schütt, K. Symmetry-adapted generation of 3d point sets for the targeted discovery of molecules. In Wallach, H., Larochelle, H., Beygelzimer, A., d'Alché-Buc, F., Fox, E., and Garnett, R. (eds.), Advances in Neural Information Processing Systems, volume 32. Curran Associates, Inc., 2019. URL https://proceedings.neurips.cc/paper/2019/file/a4d8e2a7e0d0c102339f97716d2fdfb6-Paper.pdf.
- Geng et al. (2023) Geng, Z., Xie, S., Xia, Y., Wu, L., Qin, T., Wang, J., Zhang, Y., Wu, F., and Liu, T.-Y. De novo molecular generation via connection-aware motif mining. arXiv preprint arXiv:2302.01129, 2023.
- Hansson et al. (2002) Hansson, T., Oostenbrink, C., and van Gunsteren, W. Molecular dynamics simulations. Current Opinion in Structural Biology, 12(2):190–196, 2002. ISSN 0959-440X. doi: https://doi.org/10.1016/S0959-440X(02)00308-1. URL https://www.sciencedirect.com/science/article/pii/S0959440X02003081.
- He et al. (2019) He, T., Zhang, J., Zhou, Z., and Glass, J. Exposure bias versus self-recovery: Are distortions really incremental for autoregressive text generation? arXiv preprint arXiv:1905.10617, 2019.
- Ho et al. (2020) Ho, J., Jain, A., and Abbeel, P. Denoising diffusion probabilistic models. Advances in Neural Information Processing Systems, 33:6840–6851, 2020.
- Hoogeboom et al. (2021) Hoogeboom, E., Nielsen, D., Jaini, P., Forré, P., and Welling, M. Argmax flows and multinomial diffusion: Learning categorical distributions, 2021. URL https://arxiv.org/abs/2102.05379.
- Hoogeboom et al. (2022) Hoogeboom, E., Satorras, V. G., Vignac, C., and Welling, M. Equivariant diffusion for molecule generation in 3d, 2022.
- Jin et al. (2018a) Jin, W., Barzilay, R., and Jaakkola, T. Junction tree variational autoencoder for molecular graph generation. In International conference on machine learning, pp. 2323–2332. PMLR, 2018a.
- Jin et al. (2018b) Jin, W., Yang, K., Barzilay, R., and Jaakkola, T. Learning multimodal graph-to-graph translation for molecular optimization. arXiv preprint arXiv:1812.01070, 2018b.
- Jin et al. (2019) Jin, W., Barzilay, R., and Jaakkola, T. Hierarchical graph-to-graph translation for molecules. arXiv preprint arXiv:1907.11223, 2019.
- Jin et al. (2020) Jin, W., Barzilay, R., and Jaakkola, T. Hierarchical generation of molecular graphs using structural motifs. In International conference on machine learning, pp. 4839–4848. PMLR, 2020.
- Jing et al. (2022) Jing, B., Corso, G., Chang, J., Barzilay, R., and Jaakkola, T. Torsional diffusion for molecular conformer generation, 2022. URL https://arxiv.org/abs/2206.01729.
- Kabsch (1976) Kabsch, W. A solution for the best rotation to relate two sets of vectors. Acta Crystallographica Section A: Crystal Physics, Diffraction, Theoretical and General Crystallography, 32(5):922–923, 1976.
- Köhler et al. (2020) Köhler, J., Klein, L., and Noé, F. Equivariant flows: exact likelihood generative learning for symmetric densities. In International conference on machine learning, pp. 5361–5370. PMLR, 2020.
- Kusner et al. (2017) Kusner, M. J., Paige, B., and Hernández-Lobato, J. M. Grammar variational autoencoder. In International conference on machine learning, pp. 1945–1954. PMLR, 2017.
- Kuznetsov & Polykovskiy (2021) Kuznetsov, M. and Polykovskiy, D. Molgrow: A graph normalizing flow for hierarchical molecular generation. In Proceedings of the AAAI Conference on Artificial Intelligence, volume 35, pp. 8226–8234, 2021.
- Kwon et al. (2019) Kwon, Y., Yoo, J., Choi, Y.-S., Son, W.-J., Lee, D., and Kang, S. Efficient learning of non-autoregressive graph variational autoencoders for molecular graph generation. Journal of Cheminformatics, 11(1):1–10, 2019.
- Langley (2000) Langley, P. Crafting papers on machine learning. In Langley, P. (ed.), Proceedings of the 17th International Conference on Machine Learning (ICML 2000), pp. 1207–1216, Stanford, CA, 2000. Morgan Kaufmann.
- Le Bras et al. (2012) Le Bras, R., Gomes, C., and Selman, B. From streamlined combinatorial search to efficient constructive procedures. In Proceedings of the AAAI Conference on Artificial Intelligence, volume 26, pp. 499–506, 2012.
- Li et al. (2018a) Li, Y., Vinyals, O., Dyer, C., Pascanu, R., and Battaglia, P. Learning deep generative models of graphs. arXiv preprint arXiv:1803.03324, 2018a.
- Li et al. (2018b) Li, Y., Zhang, L., and Liu, Z. Multi-objective de novo drug design with conditional graph generative model. Journal of cheminformatics, 10(1):1–24, 2018b.
- Li et al. (2021) Li, Y., Pei, J., and Lai, L. Structure-based de novo drug design using 3d deep generative models. Chemical science, 12(41):13664–13675, 2021.
- Liu et al. (2018) Liu, Q., Allamanis, M., Brockschmidt, M., and Gaunt, A. Constrained graph variational autoencoders for molecule design. Advances in neural information processing systems, 31, 2018.
- Luo et al. (2021) Luo, S., Guan, J., Ma, J., and Peng, J. A 3d generative model for structure-based drug design. Advances in Neural Information Processing Systems, 34:6229–6239, 2021.
- Luo & Ji (2022) Luo, Y. and Ji, S. An autoregressive flow model for 3d molecular geometry generation from scratch. In International Conference on Learning Representations, 2022. URL https://openreview.net/forum?id=C03Ajc-NS5W.
- Mi et al. (2021) Mi, L., Zhao, H., Nash, C., Jin, X., Gao, J., Sun, C., Schmid, C., Shavit, N., Chai, Y., and Anguelov, D. Hdmapgen: A hierarchical graph generative model of high definition maps. In Proceedings of the IEEE/CVF Conference on Computer Vision and Pattern Recognition, pp. 4227–4236, 2021.
- Mitton et al. (2021) Mitton, J., Senn, H. M., Wynne, K., and Murray-Smith, R. A graph vae and graph transformer approach to generating molecular graphs. arXiv preprint arXiv:2104.04345, 2021.
- Peng et al. (2022) Peng, X., Luo, S., Guan, J., Xie, Q., Peng, J., and Ma, J. Pocket2mol: Efficient molecular sampling based on 3d protein pockets. arXiv preprint arXiv:2205.07249, 2022.
- Popova et al. (2019) Popova, M., Shvets, M., Oliva, J., and Isayev, O. Molecularrnn: Generating realistic molecular graphs with optimized properties. arXiv preprint arXiv:1905.13372, 2019.
- Powers et al. (2022) Powers, A., Yu, H., Suriana, P., and Dror, R. Fragment-based ligand generation guided by geometric deep learning on protein-ligand structure. bioRxiv, 2022.
- Roney et al. (2022) Roney, J. P., Maragakis, P., Skopp, P., and Shaw, D. E. Generating realistic 3d molecules with an equivariant conditional likelihood model, 2022. URL https://openreview.net/forum?id=Snqhqz4LdK.
- Satorras et al. (2021) Satorras, V. G., Hoogeboom, E., and Welling, M. E(n) equivariant graph neural networks, 2021. URL https://arxiv.org/abs/2102.09844.
- Satorras et al. (2022) Satorras, V. G., Hoogeboom, E., Fuchs, F. B., Posner, I., and Welling, M. E(n) equivariant normalizing flows, 2022.
- Schmidt (2019) Schmidt, F. Generalization in generation: A closer look at exposure bias. arXiv preprint arXiv:1910.00292, 2019.
- Schütt et al. (2017) Schütt, K. T., Kindermans, P.-J., Sauceda, H. E., Chmiela, S., Tkatchenko, A., and Müller, K.-R. Schnet: A continuous-filter convolutional neural network for modeling quantum interactions. 2017. doi: 10.48550/ARXIV.1706.08566. URL https://arxiv.org/abs/1706.08566.
- Segler et al. (2018) Segler, M. H., Kogej, T., Tyrchan, C., and Waller, M. P. Generating focused molecule libraries for drug discovery with recurrent neural networks. ACS central science, 4(1):120–131, 2018.
- Shin et al. (2015) Shin, W.-H., Zhu, X., Bures, M. G., and Kihara, D. Three-dimensional compound comparison methods and their application in drug discovery. Molecules, 20(7):12841–12862, 2015.
- Simonovsky & Komodakis (2018) Simonovsky, M. and Komodakis, N. Graphvae: Towards generation of small graphs using variational autoencoders. In International conference on artificial neural networks, pp. 412–422. Springer, 2018.
- Sohl-Dickstein et al. (2015) Sohl-Dickstein, J., Weiss, E. A., Maheswaranathan, N., and Ganguli, S. Deep unsupervised learning using nonequilibrium thermodynamics, 2015. URL https://arxiv.org/abs/1503.03585.
- Thomas et al. (2018) Thomas, N., Smidt, T. E., Kearnes, S., Yang, L., Li, L., Kohlhoff, K., and Riley, P. Tensor field networks: Rotation- and translation-equivariant neural networks for 3d point clouds. CoRR, abs/1802.08219, 2018. URL http://arxiv.org/abs/1802.08219.
- Vahdat et al. (2021) Vahdat, A., Kreis, K., and Kautz, J. Score-based generative modeling in latent space. Advances in Neural Information Processing Systems, 34:11287–11302, 2021.
- Vignac & Frossard (2021) Vignac, C. and Frossard, P. Top-n: Equivariant set and graph generation without exchangeability. arXiv preprint arXiv:2110.02096, 2021.
- Wang et al. (2022) Wang, L., Zhou, Y., Wang, Y., Zheng, X., Huang, X., and Zhou, H. Regularized molecular conformation fields. In Advances in Neural Information Processing Systems, 2022.
- Wu et al. (2018) Wu, W., Qi, Z., and Fuxin, L. Pointconv: Deep convolutional networks on 3d point clouds, 2018. URL https://arxiv.org/abs/1811.07246.
- Xianduo et al. (2022) Xianduo, S., Xin, W., Yuyuan, S., Xianglin, Z., and Ying, W. Hierarchical recurrent neural networks for graph generation. Information Sciences, 589:250–264, 2022.
- Xie et al. (2021) Xie, Y., Shi, C., Zhou, H., Yang, Y., Zhang, W., Yu, Y., and Li, L. Mars: Markov molecular sampling for multi-objective drug discovery. arXiv preprint arXiv:2103.10432, 2021.
- Xu et al. (2015) Xu, J., Wang, S., and Ma, J. Protein homology detection through alignment of markov random fields: using MRFalign. Springer, 2015.
- Xu et al. (2022) Xu, M., Yu, L., Song, Y., Shi, C., Ermon, S., and Tang, J. Geodiff: A geometric diffusion model for molecular conformation generation. arXiv preprint arXiv:2203.02923, 2022.
- Yang et al. (2022a) Yang, N., Wu, H., Yan, J., Pan, X., Yuan, Y., and Song, L. Molecule generation for drug design: a graph learning perspective. arXiv preprint arXiv:2202.09212, 2022a.
- Yang et al. (2022b) Yang, R., Srivastava, P., and Mandt, S. Diffusion probabilistic modeling for video generation, 2022b. URL https://arxiv.org/abs/2203.09481.
- Yang et al. (2021) Yang, S., Hwang, D., Lee, S., Ryu, S., and Hwang, S. J. Hit and lead discovery with explorative rl and fragment-based molecule generation. In Ranzato, M., Beygelzimer, A., Dauphin, Y., Liang, P., and Vaughan, J. W. (eds.), Advances in Neural Information Processing Systems, volume 34, pp. 7924–7936. Curran Associates, Inc., 2021. URL https://proceedings.neurips.cc/paper/2021/file/41da609c519d77b29be442f8c1105647-Paper.pdf.
- Zhang et al. (2023) Zhang, Z., Min, Y., Zheng, S., and Liu, Q. Molecule generation for target protein binding with structural motifs. In The Eleventh International Conference on Learning Representations, 2023.
- Zhou et al. (2019) Zhou, D., Zheng, L., Xu, J., and He, J. Misc-gan: A multi-scale generative model for graphs. Frontiers in big Data, 2:3, 2019.
- Zhou et al. (2023) Zhou, G., Gao, Z., Ding, Q., Zheng, H., Xu, H., Wei, Z., Zhang, L., and Ke, G. Uni-mol: A universal 3d molecular representation learning framework. The Eleventh International Conference on Learning Representations, 2023.
Appendix A Supplemented Details for the Methods
A.1 Implementation for Fragmentizing the Molecule
To decrease the freedom in modeling large-size molecules, many models adopt fragment-based generation instead of building a model directly on atoms (Yang et al., 2022a). A number of methods are developed to break a molecule into a set of fragments. A good decomposing algorithm should satisfy that the derived fragment vocabulary needs to cover most of the molecular structures and also maintains a reasonable vocabulary size.
JT-VAE (Jin et al., 2018a) is the first deep-learning method that generates molecule graphs at the fragment level. It derived fragments by applying the minimum spanning tree algorithm to keep all chemical bond information while avoiding cycles. JT-VAE (Jin et al., 2018a) succeed to cover all buyable structures with a vocabulary size of less than 800. Recent works like MARS (Xie et al., 2021), FREED (Yang et al., 2021), MIMOSA (Fu et al., 2021), FragSBDD (Powers et al., 2022) though applied different criterion on breaking bonds to generate fragment vocabulary, fragments of low frequency need to be removed from the vocabulary to keep the vocabulary size reasonable.
The chemical space of drug-like molecules is enormous. Leaving out fragments of low frequency is undesirable. Therefore, we adopt the tree decomposition algorithm from (Jin et al., 2018a) in a 3D space. The procedure of processing the molecules into fragment graphs is a four-step process. Extract components We extract the set of chemical bonds which do not belongs to any rings and the set of simple rings which only represent a single topological cycle from the molecules. Merging The Bridged ring is a cluster of important chemical structures. They possess uncommon 3D conformation. Therefore, all pairs of rings are merged if the ring pair has more than two overlapping atoms. Edge linking Cycles in the fragment graph will cause problematic modeling since the decomposition for a molecule is not unique. To avoid cycles, the intersecting atom which connects more than 3 bonds is added to the graph as a fragment. Edges are linked between all fragment pairs that have overlapping atoms. The minimum spanning tree algorithm is run on this graph to remove overlapping edges. 3D coarse set At last, we assign 3D geometric information using the center of mass of the atoms within the fragment and coarse features for each fragment.
However, there are still other methods that can be applied for the fragmentation of molecules. Hence, an experiment is conducted to prove that our fragmentation strategy has advantages and the results are show in Appendix C.7
A.2 Implementation of Coarse-Grained Fragment Diffusion Model
In this section, we describe the non-autoregressive high-level feature generative model and its likelihood computation. Though diffusion models have been receiving outstanding results in computer vision (Yang et al., 2022b; Ho et al., 2020; Vahdat et al., 2021), it was nontrivial to apply directly on molecule fragment graphs. The graph features include integer features, continuous features, and continuous coordinates. These different vectors require different likelihood computations(Xu et al., 2022; Hoogeboom et al., 2022).
The diffusion model adds noise sequentially to the feature and coordinates like Eq. 1. At the time , the data distribution of invariant features is expected to approximate the prior distribution . However, in order to guarantee equivariance, the prior distribution for coordinates needs to be invariance in SE(3) group. It has been proven that when the prior distribution is invariant and the transformations are equivariant the diffusion model estimates a SE(3)-invariant data distribution (Xu et al., 2022):
| (7) | ||||
As a result, we move the prior distribution for coordinates to a linear subspace where
The model minimizes the lower bound of the log-likelihood:
| (8) |
where:
| (9) | ||||
| (10) | ||||
| (11) |
and can be computed easily by estimating the KL divergence between the estimated distribution and the target distribution. However, needs special treatment. Following the previous works (Hoogeboom et al., 2022, 2021), we define the as follows:
| (12) | ||||
For integer features, we centered the distribution to and integrate from to . While for continuous features and coordinates, the variance of the distribution is still approximated by the network. During sampling, our model used a regular reverse diffusion to generate features and coordinates. The only difference is that the integer feature dimensions are normalized using the round function.
| Property | Description | Type |
| HBA | Numbers of hydrogen bond acceptor | integer |
| HBD | Numbers of hydrogen bond donor | integer |
| Charge | Numbers of explicit electric charge | integer |
| Aromaticity | The size of aromatic ring | integer |
| Alicyclicity | The size of alicyclic ring | integer |
| Radius | The radius of the force filed optimized conformation | continuous |
| PSA | Polar surface area contribution to the conformation | continuous |
| ASA | Accessible surface area contribution to the conformation | continuous |
| Property | Description | Type |
| Hydrophobicity | Numbers of C element | integer |
| Hydrogen Bond Center | Numbers of O, N, S, P element | integer |
| Negative Charge Center | Numbers of F, Cl, Br, I element | integer |
A.3 Implementation of Equivariant Neural Network
Improved EGNN In the node/edge sampling process, our nodes are endowed with a set of invariant features and equivariant coordinates. Inspired by the recent equivariant neural networks (Thomas et al., 2018; Brandstetter et al., 2021), we propose an improved version of EGNN (Satorras et al., 2021). Each layer is formulated as:
and stands for the node/ edge embedding, while is a distance constant. stands for node coordination. All are classic MLPs. Previous works explore various kinds of techniques to maintain the equivariance of node features, however, the edge features are always ignored to encode into the latent variables. It has been proven that including edge feature updated in neural networks help improve performance (Diao & Loynd, 2022; Zhou et al., 2023). Edge latent variables are also needed for edge prediction in our methods. As a result, instead of carrying out the message passing on fully connected graphs with unified edges, we assigned edge features for sampling tasks. , , uses this improved network for message passing.
A.4 Algorithm for Training and Sampling of fragments
Algorithm 1 Training Algorithm for Node/edge decoding
Algorithm 2 Sampling Algorithm for Node/edge decoding
A.5 Algorithm for Atom-level Conformation Sampling
Algorithm 3 Algorithm for Conformation Alignment
Appendix B Discussion on potential negative societal impact
Incorporating 3D information into molecule generation could have the potential to bring a significant impact on the drug discovery industry. One key limitation of applying machine learning/ generative model approaches to the area lies in the data bias, i.e., how the 3D conformation is obtained. Such limitations could make the model difficult to generalize in practical applications. Besides, to involve human feedback, it would be ideal for the model to be model interpretable. It could be hard to obtain interpretable knowledge from the proposed generative model. The safety issues should be well taken care of towards AI-guided drug discovery. The generalization ability of such methods is a lack of exploration. More consistent and comprehensive tests are needed before the clinical tests.
Appendix C Additional Experiments
C.1 Experimental configuration
Both our model and the baseline model are trained on the GEOM (Axelrod & Gomez-Bombarelli, 2022), CrossDocked2020 (Francoeur et al., 2020) and QM9 (Axelrod & Gomez-Bombarelli, 2022). In GEOM experiments, we randomly selected 4 conformations of each molecule to train our model. To test EDM (Hoogeboom et al., 2022), we removed hydrogen atoms from the conformations and retrained the EDM model. The implicit hydrogen atoms are reconstructed using RDkit after all other heavy atoms are generated. Because EDM only generates atom types and coordinates, a proportion of sampled molecules are not fully connected. The broken fragments were removed for numerical evaluation. In all non-autoregressive methods, the number of nodes used for sampling is drawn from the size distribution histogram calculated on the training set.
Conformation Generation In this paragraph, we introduce the way to generate ground truth conformation using MD simulation. Firstly, 50 initial conformations are generated for each molecule graph using RDkit and optimized by MMF field. Then, these conformations are further optimized by MD software XTB, while the energy terms are computed for each conformation. At last, we choose the conformation with the minimum energy to sample the ground truth conformations using MD software CREST. To balance efficiency and accuracy, we set the level of optimization to ’normal’ in the software for both energy computing and conformation sampling. It took approximately 16 days to generate conformations for 400 different molecules on a 128-core server.
C.2 Stability and Validity Evaluation
MetricsTo illustrate our model’s capacity to generate chemically valid molecule structures, we conduct experiments to compare the validity and stability with baseline models. Since the baseline EDM model is not able to generate any valid molecule with full Hydrogen coordinates on GEOM, we compared our model with the EDM model that needs to sample Hydrogen coordinates with the help of RDkit. The mol stability is defined as the proportion of molecules that can be interpreted as valid molecules with all bonds and coordinates explicitly defined in RDkit. The validity is defined as the proportion of molecules that are connected rather than individual fragments in 3D space. Diversity measures the diversity of the generated molecules by calculating the average pairwise Tanimoto Morgan Fingerprint, following previous work (Xie et al., 2021).
Although our model is designed to generate drug-like molecules with relatively large molecule sizes, it can be applied for smaller organic molecule (QM9) generation tasks without effort. We also measure the validity and uniqueness metric from previous works (Hoogeboom et al., 2022) on 10000 generated small organic molecules and compared them with various baselines by using RDkit.
Baselines Our method is compared with previous methods. Both graph-based and coordinate-based models are included here. Graph-based methods like Graph VAE (Simonovsky & Komodakis, 2018), GTVAE (Mitton et al., 2021), and Set2GraphVAE (Vignac & Frossard, 2021), do not explicitly define the coordinates, so they need cheminformatic software to generate conformers. On the other hand, 3D coordinate-based models like E-NF (Satorras et al., 2022), G-Schnet (Gebauer et al., 2019), and EDM (Hoogeboom et al., 2022), need cheminformatic software to derive chemical bonds.
| Method | 3D | Bond | Valid (%) | Unique (%) |
| GraphVAE | ✓ | 55.7 | 75.9 | |
| GTVAE | ✓ | 74.6 | 22.5 | |
| Set2Graph | ✓ | 59.9 | 93.8 | |
| E-NF | ✓ | 40.2 | 98.0 | |
| G-Schnet | ✓ | 85.5 | 93.9 | |
| EDM | ✓ | 91.9 | 98.7 | |
| HierDiff (ours) | ✓ | ✓ | 87.8 | 97.9 |
| HierDiff (ours) | ✓ | ✓ | 83.6 | 98.5 |
| Method | Mol Stability | Unique | Validity | Diversity |
| EDM (without H) | 0.970 | 1.000 | 0.835 | 0.824 |
| HierDiff (ours) | 1.000 | 1.000 | 0.940 | 0.836 |
| HierDiff (ours) | 1.000 | 0.995 | 0.904 | 0.832 |
Results When testing the stability metrics on GEOM, our methods outperform EDM in stability, validity, and diversity. This indicates that our model generates not only accurate conformations of drug-like molecules but also enjoys great sampling efficiency. As shown in Table 5, our method performs comparable results in both validity and uniqueness. Though EDM (Hoogeboom et al., 2022) achieved better performance, our method still outperforms all other models. The slight performance drop compared to EDM could be due to the information loss ratio during fragmentization on the tiny graphs. Besides, our model is the only 3D method that does not depend on any chemical bond linking software, like Openbabel. Hydrogen atoms can be added by counting the valency for each atom in our method.
C.3 Additional evaluation of drug-like properties
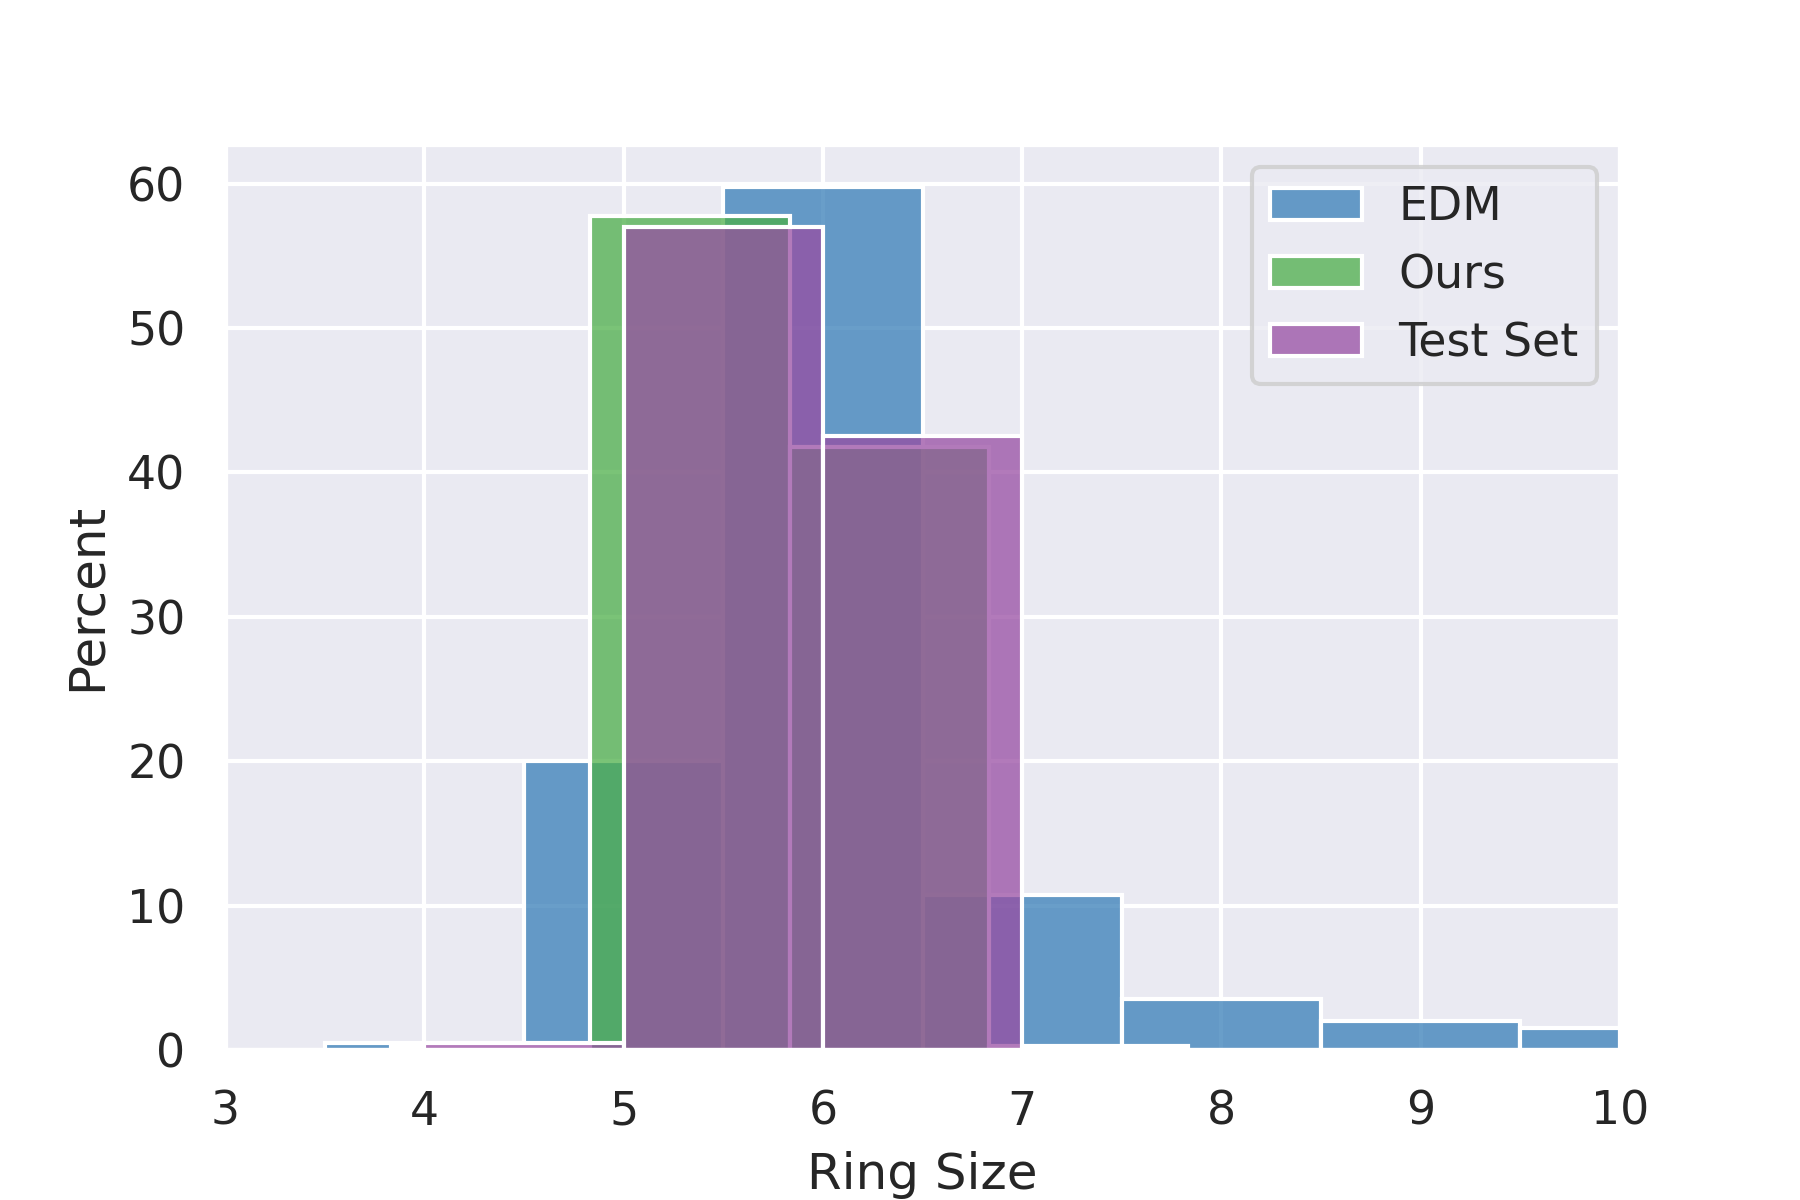
Ring Size Ring Systems with the size of 5-6 are stable chemical groups in organic chemical theories. HeteroAtom The number of heteroatoms represents area of the polar surface in the organic molecules, which highly determines the distribution of the drug molecules in the human body, e.g., the drug molecules that can cross the blood-brain barrier always has fewer heteroatoms. AromaticRing The Number of aromatic rings in the molecules indicates the ability to form interaction with proteins or other biomolecules. Aromatic rings also stabilize the molecule into lower energy conformations. AliphaticRing The Number of aliphatic rings in the molecules indicates the rigidity of the molecules. Instead of lying in a plane as aromatic rings, aliphatic rings constrained the conformation by contributing a specific torsion angle to the molecule conformation. Radius The mean radius of the fragment. A higher radius than the GEOM indicates too many rings are generated by the model. A smaller radius indicates the model is not able to construct valid ring systems.
Result and Discussion In addition to the evaluation of properties on the molecule level, we also break all the sampled molecules into fragments and test their performance on additional properties
As expected, our method chooses fragments that are similar to that of ground truth statistics.
We plotted the distribution of ring size in Fig. 8, the number of our method conforms best with ground truth. It is obvious that ring sizes 5 and 6 are most commonly seen in drug datasets and our sampled results, which are stable. However, on the contrary, the atom-based method such as EDM (Hoogeboom et al., 2022) has failed to capture this basic chemical rule.
Refer to Table 7 for additional property evaluation.
| Ring Size | HeteroAtom | AromaticRing | AliphaticRing | Radius | |
| EDM | 6.038 | 0.605 | 0.065 | 0.101 | 1.265 |
| HierDiff | 5.749 | 0.630 | 0.104 | 0.083 | 1.295 |
| HierDiff | 5.714 | 0.660 | 0.132 | 0.082 | 1.360 |
| GEOM | 5.747 | 0.677 | 0.134 | 0.066 | 1.351 |
C.4 Conformation Energy Experiments
Besides conformation quality evaluation, we also want to verify that our model generates conformation with realistic energy terms. We compared our model with two baseline methods, EDM (Hoogeboom et al., 2022) and JT-VAE (Jin et al., 2018a). JT-VAE is a 2D fragment-based molecule generation model, so we used the RDkit ETKDG module to generate the 3D conformation for the sampled 2D molecules. Similar to the conformation quality experiments, we trained all models on GEOM dataset and sampled 100 conformations with each method to carry out our experiments. We compute the energy using Merck Force Field(MFF). MMD distance with the Gaussian kernel is applied here to measure the difference between generated distributions and the original distribution.
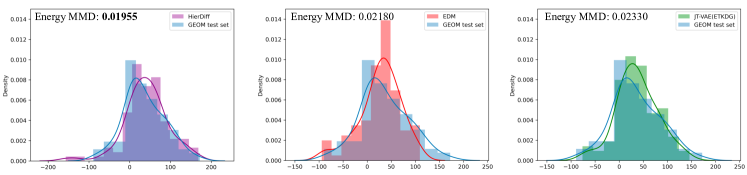
Result and Disscussion According to Fig. 9, HierDiff generates conformations with the closest energy distribution with the original dataset. Though EDM is outperformed by our method, it still beats JT-VAE(ETKDG) in generating more stable conformations. We can conclude that in this task, 3D methods have advantages over using RDkit conformation sampling along with a 2D method.
C.5 Evaluation of Uniqueness and Diversity on GEOM
To prove that our method does not occur the issue of mode collapse, we tested the uniqueness of generated molecules and evaluate the similarity of generated molecules with the GEOM test set. Similarity which measures the average similarity between generated molecules with the most similar molecule in the test set. We use the Tanimoto score between ECFP4 fingerprints to measure the similarity between two molecules. High similarity indicates that the method lack generalization. Unique is the proportion of unrepeated structures in generated molecules. Both metrics are tested on molecule level and Murko Scaffold level. Numeric results are listed in Table 8 It is quite clear that our model generates more diverse molecules.
Result and Disscussion HierDiff outperforms EDM (Hoogeboom et al., 2022) on this uniqueness and diversity test. It should be noted that both our method and EDM generate mostly unique molecules when training on GEOM. These methods succeed to generate diverse 3D molecules. Combining to results from Table 1, our method is able to generate 3D molecules that are drug-like and diverse.
| Similarity-atom | Unique-atom | Similarity-scaffold | Unique-scaffold | |
| EDM | 0.176 | 1.000 | 0.189 | 0.930 |
| HierDiff | 0.164 | 1.000 | 0.171 | 0.957 |
| HierDiff | 0.168 | 1.000 | 0.169 | 0.946 |
C.6 Conditional generation
In the field of AI-guided drug discovery, one of the most essential directions is to generate 3D molecules according to desirable properties. Though previous works (Gebauer et al., 2019; Hoogeboom et al., 2022) have tested their abilities to generate molecules conditioned on simulated energy, to our knowledge, we are the first to carry out practical drug discovery-related property-conditional generation experiments using the 3D molecule generative model. We include the properties as an additional atom feature dimension in our dual-phase generation process. We tested the difference using mean squared error (MSE) and mean absolute error (MAE) between the input properties and the real properties of the generated 3D molecules. The diversity of the generated molecules is also evaluated using mean fingerprint similarity as defined in Xie et al. (2021).
| Asphericity | QED | SAS | ||||||||||
| . | MSE | MAE | Div | MSE | MAE | Div | MSE | MAE | Div | MSE | MAE | Div |
| EDM | 0.626 | 0.455 | 0.895 | 0.113 | 0.285 | 0.883 | 0.074 | 0.193 | 0.897 | 6.054 | 2.019 | 0.883 |
| HierDiff- | 0.176 | 0.406 | 0.894 | 0.120 | 0.289 | 0.885 | 0.051 | 0.184 | 0.881 | 1.405 | 0.976 | 0.882 |
Results and Disscusions To make fair comparison, we excluded HierDiff- for property-conditional generation since it already implies fragment properties. For example, aromatic rings and topological surfaces are related to logP and SAS. The results illustrate that our model outperforms EDM on Asphericity, SAS, and LogP in generating 3D molecules with accurate properties. EDM outperforms HierDiff in the accuracy of the QED conditioned generation task and the diversity in other metrics by an almost negligible margin.
C.7 Ablation Study
We remove the iterative refinement step in each fragment sampling process when using the model training on GEOM to carry out the ablation study. The results are shown in Tab. 9. The experiment results illustrate that the hierarchical diffusion-based model samples molecules with higher molecular weight and lower SAS score, however, the drug-likeness score QED and safety score MCF decreased.
| QED | RA | MCF | SAS | (logP) | (MW) | |
| HierDiff (-r) | 0.628 | 0.626 | 0.681 | 3.669 | 0.638 (2.291) | 27.33 (332.8) |
| HierDiff (-r) | 0.635 | 0.638 | 0.656 | 3.512 | 0.185 (2.744) | 10.33 (349.8) |
| HierDiff | 0.632 | 0.548 | 0.727 | 3.859 | 0.653 (2.276) | 30.33 (329.8) |
| HierDiff | 0.639 | 0.643 | 0.659 | 3.547 | 0.128 (2.801) | 13.33 (346.8) |
| GEOM | 0.658 | 0.915 | 0.774 | 4.018 | 0.000 (2.929) | 0.000 (360.1) |
Besides, we also replaced the minimum spanning tree algorithm with the ’High-frequency Fragments’ strategy and ’Single Rings and Bonds’ strategy for an ablation study. The ’High-frequency Fragment’ is a common strategy applied in previous works (Xie et al., 2021; Powers et al., 2022) in which all fragments are collected from the training datasets using basic predefined rules. Only the high-frequency fragments are kept in the vocabulary in this method. ’Single Rings and Bonds’ is another simple fragmentation strategy in that the fragments are limited to all single bonds and single rings. Bridge rings and multiple-ring systems are broken into single rings to reduce fragment complexity. The results are listed in Tab. 10, which illustrate that without using a complicated fragmentation strategy our method still outperforms the baseline model in most metrics. We chose the minimum spanning tree-based strategy because it offers a more balanced performance in all drug-like properties.
| Fragmentize Methods | QED | RA | MCF | SAS | Log | MW | Validity |
| EDM | 0.608 | 0.441 | 0.621 | 4.054 | 0.566 | 23.71 | 0.835 |
| Minimum Spanning Tree | 0.639 | 0.639 | 0.659 | 3.574 | 0.128 | 13.33 | 0.904 |
| High-frequency Fragments | 0.609 | 0.632 | 0.662 | 3.638 | 0.228 | 9.80 | 0.853 |
| Single Rings and Bonds | 0.621 | 0.600 | 0.745 | 3.756 | 0.680 | 7.81 | 0.932 |
C.8 Discussion on Sampling Efficiency
| Model | Sample time per sample (s) |
| EDM (reported from Hoogeboom et al. (2022) | 10.2 |
| EDM (reproduce) | 3.15 |
| HierDiff (1000 steps) | 5.17 |
| HierDiff (500 steps) | 3.74 |
| HierDiff (250 steps) | 3.02 |
We conduct an experiment on the computation cost(sampling speed). It is true that the decoding models , and indeed bring some computational cost. While these modules are not the key bottleneck as only a few forward passes need to be conducted during sampling. As shown in Tab. 11, the diffusion phase is actually the main computational overhead as there are many forward passes, e.g. thousands of steps, that need to be conducted during a single sampling process. Besides, we also noted the fact that our model is capable of using a larger batch size for parallel on a GPU since our diffusion space is smaller. Your question actually inspires us to train our model in a new setting with fewer diffusion steps, for example, 500 steps or 250 steps. We leave this direction as future exploration.
C.9 Disscusion on the Choice of high-level feature
From the above experiments, we can see that both the property-based coarse feature and the element-based coarse feature outperform the baseline models in generating more drug-like molecules and sample stable conformations. However, these two kinds of features reveal different strengths.
In the Drug-likeness evaluation, HierDiff-P outperforms HierDiff-E in most metrics when training on GEOM. HierDiff-E achieves the highest score on MCF. The reason is that property-based features provide more chemical semantic information than element-based features. HierDiff-E achieves better results on chemical safety because the element histogram helps the model avoid generating combinations of elements that can form unstable subgraphs. On the contrary, when training on CrossDock, HierDiff-E performs better, because CrossDock is a smaller dataset. It’s easier to approximate the true distribution with a simpler representation as the latent variable.
In the conformation quality evaluation, HierDiff-E achieves better results on the atom level RMSD and HierDiff-P achieves better results on the fragment level RMSD. Since element-based features directly model on the atom level and property-based features include connection information, surface information on a global view, this result agrees with the motivation that inspires us to design these features.
C.10 Experimental Proof of Error Accumulation
One of our motivations for developing a hierarchical method for molecule generation is that we discovered the error accumulation in molecule generative models. This means that when the molecule size increase, the error from the previous steps of generation influences later steps which leads to unrealistic results. This issue has been discussed in the field of natural language modeling (Schmidt, 2019; He et al., 2019; Caccia et al., 2018). To prove this issue exists, we trained our method which represents the non-autoregressive method, and G-Spherenet which represents the autoregressive method on QM9. Both methods are set to generate molecules with the given molecule size. We test the validity of the generated molecules. We also do the same test on GEOM, however, the validity of the autoregressive model drops so fast that it cannot generate molecules with more than 20 heavy atoms. Numeric results on QM9 are listed in Table 12. Visualized results of GEOM can be found in Figure 10.
| Size | 5 | 6 | 7 | 8 |
| Valid (AR) | 0.710 | 0.692 | 0.690 | 0.588 |
| Valid (non-AR) | 1.000 | 0.950 | 0.953 | 0.991 |
C.10.1 More Visualization Results