A Pretrainer’s Guide to Training Data:
Measuring the Effects of Data Age, Domain Coverage, Quality, & Toxicity
Abstract
Pretraining is the preliminary and fundamental step in developing capable language models (LM). Despite this, pretraining data design is critically under-documented and often guided by empirically unsupported intuitions. To address this, we pretrain 28 1.5B parameter decoder-only models, training on data curated (1) at different times, (2) with varying toxicity and quality filters, and (3) with different domain compositions. First, we quantify the effect of pretraining data age. A temporal shift between evaluation data and pretraining data leads to performance degradation, which is not overcome by finetuning. Second, we explore the effect of quality and toxicity filters, showing a trade-off between performance on standard benchmarks and risk of toxic generations. Our findings indicate there does not exist a one-size-fits-all solution to filtering training data. We also find that the effects of different types of filtering are not predictable from text domain characteristics. Lastly, we empirically validate that the inclusion of heterogeneous data sources, like books and web, is broadly beneficial and warrants greater prioritization. These findings constitute the largest set of experiments to validate, quantify, and expose many undocumented intuitions about text pretraining, which we hope will help support more informed data-centric decisions in LM development.
1 Introduction
The strong performance (Chowdhery et al., 2022; Nostalgebraist, 2022; OpenAI, 2023; Google, 2023), and emergent abilities (Wei et al., 2022) of modern language models (LMs) depend on self-supervised pretraining on massive text datasets. All model developers implicitly or explicitly decide the composition of these datasets: what data sources to include, whether to filter for attributes such as quality and toxicity, and when to gather new documents. While many of the most prominent models do not document their curation procedures (OpenAI, 2023; Google, 2023), or only document which procedures they used (Brown et al., 2020; Nostalgebraist, 2022; Scao et al., 2022; Touvron et al., 2023), they rarely document why they chose those protocols or what effect they had. This documentation debt leaves practitioners to be guided by intuitions and precedents, neither thoroughly evaluated (Bandy and Vincent, 2021; Sambasivan et al., 2021). Given the outsized and fundamental role of pretraining data in modern LMs, we believe this neglectful practice has detracted from responsible data use and hampered effective model development (Rogers, 2021; Gebru et al., 2021; Bender and Friedman, 2018).
Among the small number of general-purpose LMs dominating community use and discussion, the prevailing focus has been on the scale of pretraining data and number of optimization steps (Brown et al., 2020; Nostalgebraist, 2022; Google, 2023). In this work, we systematically test how common data design decisions affect model performance—specifically: the time of collection, content filtering strategy (toxicity/quality), and domain composition. We study the impacts in two ways. First, we present observational measurements of the effect of existing quality and toxicity filtering methods (Section 3). We document how these filters affect a range of characteristics in two major pretraining datasets, C4 (Raffel et al., 2020) and the Pile (Gao et al., 2020). Second, we rigorously evaluate these dataset design decisions on downstream tasks. This is done by evaluating decoder-only autoregressive LMs each pretrained on a dataset modified along one dimension of time, toxicity, quality, or domain composition. Our contributions are summarized as findings and recommendations to model developers.
The Age of a Dataset (Section 4). We see performance degradation if evaluation data is either before or after pretraining data collection, and this deficit isn’t overcome with substantial finetuning. Further, this phenomenon is exacerbated in larger models. While rarely acknowledged, we show its effect can meaningfully complicate comparisons between new and old models, depending on the age of the evaluation dataset.
Quality and Toxicity Filters (Section 5). Filtering for document quality and toxicity have significant but opposite effects on model behaviour. Quality filtering, removing low-quality text, substantially increases both toxic generation and downstream performance across tasks we tested, despite reducing the amount of training data. On the other hand, removing toxic data trades-off fewer toxic generations for reduced generalization performance. Inverse toxicity filters, which remove the least toxic content, demonstrate targeted benefits. Lastly, evaluation on datasets with high quality text aren’t necessarily improved by removing low-quality text from the dataset. Performance effects due to quality filtering are mostly positive, but the benefits are not predictable from text characteristics. These findings demonstrate that one size (filter) does not fit all, and there is a need for practitioners to develop more targeted quality or inverse toxicity filters for their tasks.
Domain Compositions (Section 6). The best performing domains comprise high-quality (Books) and heterogeneous (Web) data, corroborating Brown et al. (2020); Chowdhery et al. (2022); Xie et al. (2023a). However, these text sources contribute most to toxic generation. Still, we found that the benefits of training on these data sources is often greater than data collection for a targeted domain, and so recommend practitioners focus future collection on more books and diverse web data. Additionally, our best performing models still use all data sources (even at the relatively small scale of 1.5B parameters); thus, we recommend practitioners generously include data sources less relevant to their downstream tasks (Madaan et al., 2022).
To our knowledge, these experiments constitute the largest publicly documented LM data curation study, spanning 28 1.5B parameter models. Their findings empirically quantify, validate, and, occasionally, challenge the entrenched set of under-examined pretraining assumptions; which we believe justifies their computational cost (Section 8). As the majority of the community has adopted a small set of models for most research and applications (BERT, T5, GPT-2, GPT-3), pretraining data curation decision have long-term ramifications. We hope these results better inform model developers training the next wave of LMs.
2 Methodology
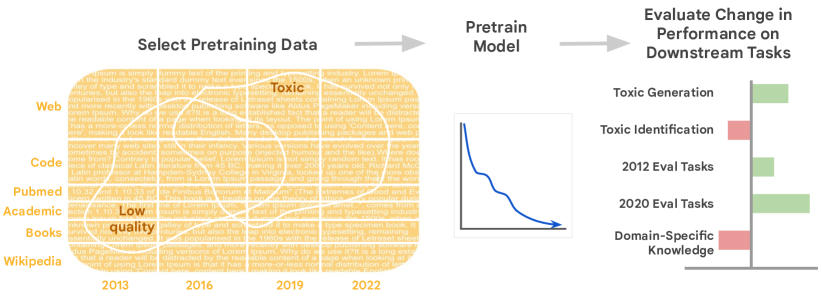
We measure how pretraining data curation choices affect downstream performance. Figure 1 illustrates our approach: each experiment starts with a pretraining dataset, applies a filter that removes documents, pretrains a language model on the curated dataset, and finally evaluates the model on downstream tasks.
| Represented Domains (%) | Filters | Data | |||||||||||
| Model | Wiki | Web | Books | Dialog | Code | Acad | Pile | C4 | M-L | Tox | Qual | Pub | Year |
| Bert | 76 | 24 | ✗ | ✗ | H | Part | 2018 | ||||||
| GPT-2 | 100 | ✗ | ✗ | H | Part | 2019 | |||||||
| RoBerta | 7 | 90 | 3 | ✗ | ✔ | H | Part | 2019 | |||||
| XLNet | 8 | 89 | 3 | ✗ | ✔ | H | Part | 2019 | |||||
| T5 | <1 | 99 | ✗ | ✔ | H | H | ✔ | 2019 | |||||
| GPT-3 | 3 | 82 | 16 | ✗ | ✔ | 7% | C | ✗ | 2021 | ||||
| GPT-J/Neo | 1.5 | 38 | 15 | 4.5 | 13 | 28 | ✔ | Part | C | ✔ | 2020 | ||
| GLaM | 6 | 46 | 20 | 28 | ✗ | ✔ | C | ✗ | 2021 | ||||
| LaMDA | 13 | 24 | 50 | 13 | ✔ | ✔ | 10% | C | C | ✗ | 2021 | ||
| AlphaCode | 100 | ✗ | ✗ | H | ✗ | 2021 | |||||||
| CodeGen | 1 | 24 | 10 | 3 | 40 | 22 | ✔ | Part | H | Part | 2020 | ||
| Chinchilla | 1 | 65 | 10 | 4 | ✔ | ✔ | H | C | ✗ | 2021 | |||
| Minerva | <1 | 1.5 | <1 | 2.5 | <1 | 95 | ✔ | ✔ | <1% | C | ✗ | 2022 | |
| BLOOM | 5 | 60 | 10 | 5 | 10 | 10 | ✔ | ✔ | 71% | H | C | Part | 2021 |
| PaLM | 4 | 28 | 13 | 50 | 5 | ✗ | ✔ | 22% | C | ✗ | 2021 | ||
| Galactica | 1 | 7 | 1 | 7 | 84 | ✔ | Part | H | Part | 2022 | |||
| LLAMA | 4.5 | 82 | 4.5 | 2 | 4.5 | 2.5 | Part | ✔ | 4% | C | Part | 2020 | |
2.1 Pretraining Datasets
We begin with two common, publicly available pretraining datasets: C4 (Raffel et al., 2020) and the Pile (Gao et al., 2020). Both have received basic initial heuristic filtering for English language and content quality. We further deduplicate both datasets using the approximate deduplication method described in Lee et al. (2022).
C4 (Raffel et al., 2020)
The English Colossal Clean Crawled Corpus (C4) is a snapshot of Common Crawl from 2019, which includes a mix of news, legal, wikipedia, and generic web documents (Dodge et al., 2021), filtered for well-formed English text.***https://commoncrawl.org/ While the original version of C4 filtered out any documents containing words from a “bad words list”, our version does not. C4 remains one of the most widely adopted fully open source datasets for textual training, given its permissive license. It is a key component of many LMs, as shown in Table 1.
The Pile (Gao et al., 2020)
is an 800GB dataset consisting of data from 22 sources. These include a Common Crawl web scrape as well as more diverse collections of academic, books, coding, medical, legal and social sources (see Table 8), which more closely resemble the reported data sources in larger non-open source models like PaLM (Chowdhery et al., 2022), Chinchilla (Hoffmann et al., 2022), and the GPT-3 series (Brown et al., 2020). Note that the Pile’s corpora composition was manually selected, and some options were excluded on the grounds of being too toxic or explicit.
2.2 Data Curation Choices
We evaluate variations in the pretraining data based on three categories of interventions.
Dataset Age
We create new versions of C4 by regenerating snapshots of the Common Crawl from different years (see Figure 11). Multiple time-based collections are not available for the Pile.
Domain Filtering
Both C4 and the Pile draw from multiple distinct data sources, but the Pile explicitly delineates 22 distinct sources from web pages, wikipedia articles, code repositories, online forums, legal texts, and research paper archives. To control for the topical content of the pretraining collection, we selectively remove documents from different domains (see Table 8).
Content Filtering
Datasets derived from the Common Crawl and other weakly curated internet sources tend to contain large amounts of low-quality, toxic, or offensive content. As a result, curators often apply content-based filters. Deciding what to include and what not to include is a challenging and context-dependent problem: A “high-quality” Reddit post does not look like a “high-quality“ academic paper; and even with academic papers, quality measured by peer review has high variance (Cortes and Lawrence, 2021).
There are several approaches to determining document appropriateness. The simplest filters use features such as sentence length, presence of stopwords and punctuation, and repetitiousness to identify pages that do not contain usable text (Rae et al., 2021; Yang et al., 2019; Laurençon et al., 2022; Zhang et al., 2022). Negatively-defined filters identify a category of text to be removed, and assume that everything else is usable. For example, Raffel et al. (2020) remove documents that contain words from a list of “bad words”. Positively-defined filters identify a category of text to keep, and remove everything else (Du et al., 2022; Touvron et al., 2023; Brown et al., 2020).
In this work, we evaluate the impact of two document-level, classifier-based filters that have been used widely in the development of state-of-the-art language models. These include negatively-defined, toxic content (text that is profane, explicit, insulting, or threatening) and postively-defined quality content (text similar to known “high-quality” sources). It is important to emphasize that we do not have ground truth: for the purposes of this paper we will use the description toxic or quality to refer to a document that triggers one of these automated classifiers, not to indicate a document that achieves those characteristics for a human reader.
Quality Filters
Most recent language models create quality classifiers to distinguish between “high-quality” corpora and other documents (Table 1). These are usually then applied to crawled web pages. Examples of high-quality reference corpora are (1) Wikipedia, WebText and books for GPT-3 (Brown et al., 2020), (2) Wikipedia, books and a few selected websites for PaLM (Chowdhery et al., 2022) and GLaM (Du et al., 2022), and (3) pages used as references in Wikipedia for LLaMA (Touvron et al., 2023). In our work, we use the classifier employed by PaLM and GLaM, which assigns each document a score from 0 (high quality) to 1 (low quality). We experiment with removing documents that fall above four quality thresholds: , , , , along with an inverse filter that instead removes the highest quality documents below a threshold.
Toxicity Filters
To identify toxic content, we use Jigsaw’s Perspective API †††https://www.perspectiveapi.com, which was trained on comments from online forums and assigns toxicity scores based on whether annotators found the comment to contain profanity/obscenity, identity-based negativity, insults, or threats. While the Perspective API, as with any classifier, has been shown to be imperfect—it falsely labels some neutral text as toxic and its training data reflects the normative values of its annotators—it has been shown to be far more accurate than heuristic and rule-based classifiers (Friedl, 2023; Gargee et al., 2022; Lees et al., 2022).
The Perspective API outputs a score from 0 (unlikely to be toxic) to 1 (very likely to be toxic). The documentation recommends using a score threshold of anywhere from 0.3 to 0.9 to filter documents, depending on the practitioner’s goals.‡‡‡See https://developers.perspectiveapi.com/s/about-the-api-score We experiment with removing documents with scores above five different toxicity threshold values , , , , and . Documents above a given threshold are filtered out, along with an inverse filter that removes documents with the least predicted toxicity below a threshold.
In addition to the classifier-based filter, we also experiment with the -gram based filter used by Raffel et al. (2020) in the original version of the C4 dataset. This filter removes all documents that contain any word present in the “List of Dirty, Naughty, Obscene, or Otherwise Bad Words”.§§§https://github.com/LDNOOBW/List-of-Dirty-Naughty-Obscene-and-Otherwise-Bad-Words
2.3 Evaluation
To measure the effects of time, topic and toxicity, we evaluate pretrained models on English-language tasks for toxicity identification, toxic generation, dozens of question-answering (QA) tasks from diverse domains, and several tasks with temporal annotations. In choosing evaluations, we compare the general utility of the different models, as well as their performance on tasks we expect to be influenced by the dataset characteristics being ablated. Since we are comparing the performance of different pretrained models, we evaluate the performance of each pretrained model on downstream tasks by finetuning the model on the relevant dataset for each task and evaluated on the same testing data (using the default splits for each task unless otherwise noted). As a result, any systematic differences between finetuned results can only be attributable to differences in pretraining. For all tasks we report mean performance relative to a baseline, usually the performance of models trained on an unfiltered dataset.
Evaluating Domain Generalization
We evaluate on the union of two question-answering benchmarks: Machine Reading for Question Answering (MRQA) (Fisch et al., 2019) and UnifiedQA (Khashabi et al., 2020), which together consist of 30 unique QA datasets. These QA datasets span a range of domains, allowing us to measure the impact of topic alignment (see Table 9).
Evaluating Temporal Misalignment
Prior work has shown that a dataset’s collection time can affect the downstream model’s abilities (Lazaridou et al., 2021; Agarwal and Nenkova, 2022). Luu et al. (2021) release several datasets in which increasing temporal distance between finetuning and evaluation time decreases test performance. We choose 5 of these datasets from varying domains to evaluate whether a similar phenomenon exists between pretraining and evaluation time: PubCLS, NewSum, PoliAffs, TwiERC, and AIC.
Evaluating Toxic Generation
Generateing profane, sexually explicit, insulting, or obscene text or text that attacks identity groups or targets protected human attributes limits the applications LMs may be used for (Gehman et al., 2020). We evaluate this behavior with language model prompts designed to elicit biased or toxic outputs related to gender, race, and religion (Chowdhery et al., 2022), and then measuring the fraction of generated continuations which are assigned a high toxicity score by the Perspective API (see Appendix C.3 for details). We also use the RealToxicityPrompts dataset (Gehman et al., 2020), which consists of text excerpts from the OpenWebText dataset (Gokaslan* et al., 2019) that were labeled as toxic by the Perspective API.
Evaluating Toxicity Identification
While some applications require LMs not to generate toxic text, in other applications it is important for LMs to recognize such language. Toxicity Identification has become particularly critical as a step in content moderation for major communication platforms (NYT, 2020; Singh, 2019). Definitions vary by setting, targeting hate speech, stereotypes, social bias, or some definition of toxicity. We evaluate this ability with a variety of toxicity interpretations, using train and test sets from Social Bias Frames (SBF, Sap et al., 2020), DynaHate (DH, Vidgen et al., 2021), and Toxigen (Hartvigsen et al., 2022).¶¶¶We use the offensiveness detection task from Social Bias Frames. DynaHate releases 4 rounds of adversarial datasets, for which we use the test sets for Round 3 (R3) and Round 4 (R4).
2.4 Models
For all our experiments, we use two sizes of decoder-only, Transformer-based language models, trained in the T5X codebase (Roberts et al., 2022). Our main experiments use LM-XL, a 1.5B parameter decoder-only model similar to the t5.1.1-XL architecture configuration trained with an autoregressive next-token-prediction objective. For experiments that measure scaling effects, we use LM-Small, a 20M parameter decoder-only model similar to the t5.1.1-small configuration. These configurations are popular, show decent performance (Wang et al., 2022) and can generate text without additional finetuning. Additional details on pretraining and finetuning are available in Appendix C
3 Impact of Data Curation on Data Characteristics
Before evaluating the effect of data ablations on models, we present observational statistics on the pretraining datasets themselves. This analysis reveals how the Pile’s domains compare to C4 and to one another, and how curation or filtering choices impact features of the data, sometimes inadvertently. We find that there are substantial interactions between curation choices.
We calculate a range of features for each document, including toxicity and quality metrics; categories of personally identifiable information (PII); and text statistics such as average word length, readability, type-token ratio, and sentiment. For more details and analysis on these features see Appendix D.
C4 vs the Pile
Figure 9 shows the differences between the two source datasets. Documents in the Pile are on average longer (2.4x), have more non-ASCII characters (1.9x) indicating greater linguistic range, and are also measured as higher quality (1.2x) and more readable (1.8x). Pile documents also contain more PII, in particular personal names, addresses, and emails.
Toxicity and Quality
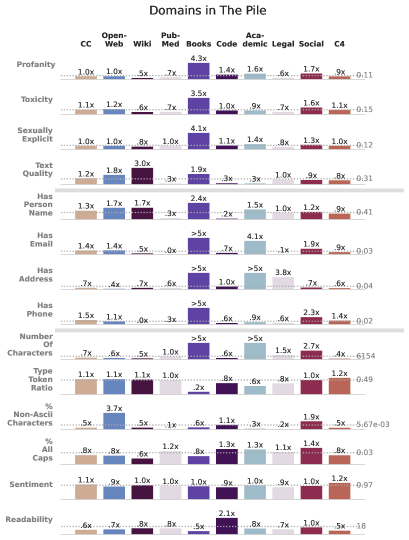
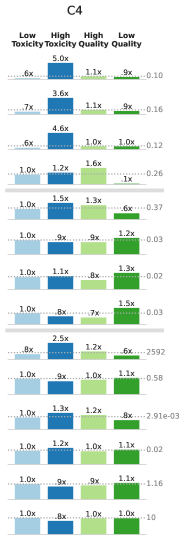
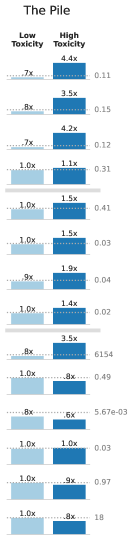
While it is reasonable to assume that high toxicity should correlate with low quality, Figure 2 shows that the relationship is more complicated: in fact, toxicity and quality are not well-aligned with one another. High toxicity documents have higher text quality than low toxicity documents. There is also little discernible difference in feature measurements for profanity, toxicity, and sexually explicit content between content classified as low vs. high quality.
Domains
Looking at characteristics of the Pile by domain in Figure 2 suggests an explanation. The Books subset stands out as having substantially more profane, toxic, and sexual content, but also greater predicted quality. While we might expect books to be high quality, in the sense that they typically contain meaningful, well-edited sentences, they also contain strong language and erotic subjects. This may also explain why documents classified as high toxicity in both C4 and the Pile are much longer (2.5x and 3.5x respectively), more profane (5x and 4.4x), sexually explicit (4.6x and 4.2x), and toxic (3.6x and 3.5x). However, Pile documents with high toxicity are 1.4-1.9 times more likely to have PII of various kinds, while in C4 this is not true. Documents classified as high quality in C4 were longer (1.3x and 1.2x), and had more names (1.6x and 1.8x), but fewer emails, addresses, and phone numbers.
Among the domains we studied, OpenWeb provides the most lexical and linguistic diversity, with the highest non-ASCII characters and type-token ratio. Wikipedia presents the highest quality text, before Books and OpenWeb. Technical domains such as PubMed, Code, and Academic score low on predicted quality, indicating that overly-specific positively-defined filters on web documents may remove substantial amounts of potentially useful specialized text.
Time
Comparing across different collection times of C4 (in Figure 9), we see a couple of steady trends. The percentage of non-ASCII characters increased steadily in more recent years while the measured text quality declines. This growth may be due to increasing non-English content, but could also correspond to rising use of emojis and non-ASCII punctuation. Toxicity scores also decrease slightly in later years, while sentiment increases.
4 Impact of Dataset Age on Pretrained Models
While models are frequently and cheaply updated with new finetuning data, the expense of pretraining means the NLP community has relied on relatively few static pretrained models that are rarely updated or exchanged. BERT, RoBERTa, GPT-2, and T5 variants, all pretrained prior to 2020, constitute the majority (estimated at ~58% as of April 16, 2023) of all models downloaded on HuggingFace. Prior work demonstrates that language use changes over time (Altmann et al., 2009; Labov, 2011) and that temporal misalignment between finetuning and evaluation datasets correlates with degraded performance, visible across settings and domains (Luu et al., 2021; Lazaridou et al., 2021; Agarwal and Nenkova, 2022; Jang et al., 2022). In contrast, we examine the effect of temporal misalignment between pretraining data and evaluation. In evaluating the impact of pretraining time across data domains, we can quantify the impact this design choice has on NLP broadly.
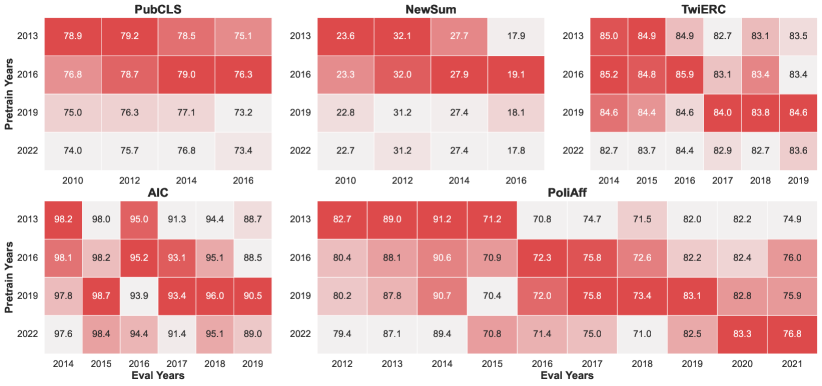
We pretrain four autoregressive language models on versions of C4: 2013, 2016, 2019, and 2022. For each version we begin with Common Crawl data and remove all data that was scraped after the cutoff year. Following Luu et al. (2021), we measure the effect of temporal misalignment by using evaluation tasks (from News, Twitter, and Science domains) that have training and test sets split by year. After pretraining, we finetune each model on each dataset’s training-year split separately, then evaluate on every test-year split. Full details and results are in Section C.4 and Section E.1, respectively.
First, we replicate the performance degradation observed by Luu et al. (2021) due to finetuning and evaluation misalignment on the five tasks in Figure 12. Next, we estimate the effects of temporal misalignment between pretraining and evaluation (Figure 3). Since all models were finetuned on the training sets of the evaluation tasks, we show that temporal misalignment during pretraining persists even with temporally-relevant finetuning data.
Performance degradation strongly correlates with pretraining misalignment and its effects are non-trivial.
Luu et al. (2021) formalize a definition for Temporal Degradation (TD), which measures the performance change observed from one year difference between the finetuning and evaluation years. We generalize TD to also measure the effect of one year difference between pretraining time and evaluation time, as described in Section C.4. Furthermore, we measure the Pearson correlation between the performance difference and the temporal difference to understand the strength of the correlation. In Table 2 we find temporal degradation is highest for finetuning (2.8 on average), as expected, but also surprisingly high for one year of pretraining (0.4)—particularly for the News domain. The average Pearson correlation of indicates a strong correlation between pretraining temporal misalignment and performance degradation. All five tasks pass a one-sided Wald test with , validating the slope is greater than zero.
| Finetuning | Pretraining | ||||||||
| LM-Small | LM-XL | LM-Small | LM-XL | ||||||
| Domain | Task | TD | r | TD | r | TD | r | TD | r |
| News | PubCLS | 5.82 | 0.84 | 5.63 | 0.80 | 0.02 | 0.01† | 0.59 | 0.67 |
| NewSum | 0.80 | 0.82 | 2.91 | 0.92 | -0.31 | -0.29 | 0.73 | 0.45 | |
| PoliAff | 3.74 | 0.84 | 4.93 | 0.89 | 0.50 | 0.21 | 0.28 | 0.56 | |
| TwiERC | 0.49 | 0.73 | 0.53 | 0.82 | 0.05 | 0.27 | 0.23 | 0.72 | |
| Science | AIC | 0.94 | 0.83 | 0.24 | 0.36 | 0.11 | 0.18† | 0.23 | 0.66 |
| Mean | 2.36 | 0.81 | 2.84 | 0.76 | 0.08 | 0.07 | 0.41 | 0.61 | |
Pretraining misalignment is not overcome by significant finetuning.
The temporal degradation due to pretraining suggests models pretrained on data from the same time frame as target evaluations will have advantages over models trained on much older or newer data. Notably, this effect is observed for models which are finetuned on the full temporally-relevant training sets. This suggests that even substantial finetuning cannot overcome pretraining data that is temporally misaligned.
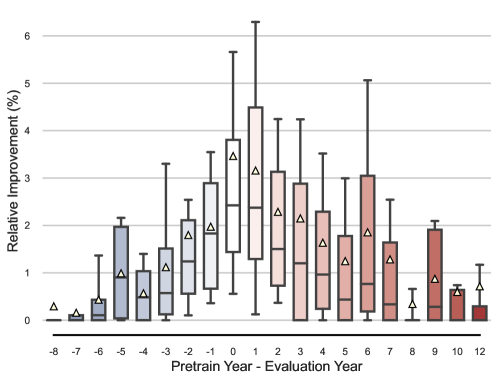
Pretraining misalignment effects are asymmetric and have implications for NLP evaluations.
We observe performance degradation regardless of whether the pretraining data was collected before or after the evaluation data. While we would not expect a 2019 checkpoint to perform well on questions about COVID, we also find that 2022 checkpoints perform less well on Obama-era evaluations than earlier models. In particular, Figure 4 shows performance degradation is asymmetric: it is steeper when the evaluation year is after the pretraining year (blue bars) as opposed to the reverse (red bars). This finding suggests that both models and evaluations become stale: older models perform less well than newer models on new evaluations and newer models will perform less well on older evaluations. This phenomenon may have subtle implications for NLP experiments comparing models pretrained at different times. For instance, newer evaluation sets may appear much more difficult than old evaluation sets when applied to established, but less fresh, models. Similarly, older evaluations may underestimate the capabilities of newer models.
Temporal Degradation is greater for larger models
We find more temporal degradation for LM-XL (1.5B parameters) than for LM-Small (20M parameters). As shown in Table 2, we do not find the same temporal degradation effects of pretraining were significant for LM-Small models. This suggests that larger models may have a greater sensitivity to temporal information than smaller models, which may not have the capacity to take advantage of subtle temporal features at all. Full results for LM-Small experiments are provided in Section E.1.
5 Impact of Quality & Toxicity Filters on Pretrained Models
Most modern large language models use some form of quality and/or toxicity filtering for their pretraining datasets (Table 1). To curb toxicity, T5 uses -gram filters, Gopher and Chinchilla use SafeSearch filters, and LaMDA uses “safety discriminators”. Quality heuristics are universally applied for web-scraped data, with newer models like LLaMA, the GPT-series and the PaLM-series all relying on quality classifiers. To compare and quantify the effects of these two filter types, we implement quality and toxicity filters at various thresholds, as described in Section 2.2, to vary the quantity of toxic and low-quality text present when pretraining models on the Pile and C4.
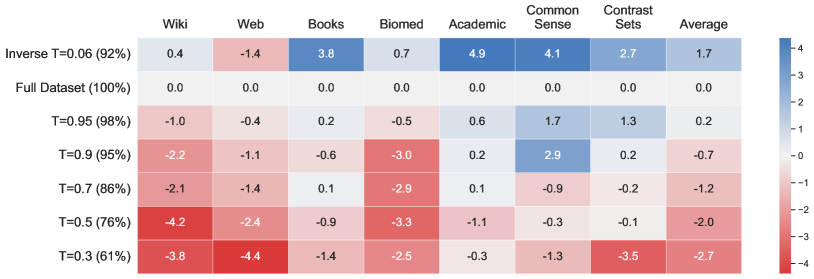
Quality filters significantly improve performance across nearly all tasks, despite reducing training data quantity and variety.
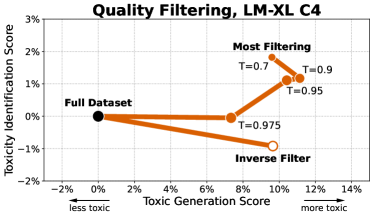
We see the quality filters improve nearly all downstream tasks: toxicity identification by 2% (Figure 5, right) and most QA task categories by 1-6% (Figure 6). Of most interest, these improvements are realized despite removing 10%+ of the training data, even though we find that removing data usually leads to a decrease in performance (Section 6). While the average performance peaks at for the QA tasks, greater quality filtering still outperforms the unfiltered baseline on average. For the toxicity identification experiments, the performance is still improving after , where 55% of the dataset has been filtered out.
Dataset quality characteristics are not strongly indicative of filtering effects.
In Section 3, Books, Wikipedia, and Web data are classified as highest quality. Figure 6 shows that despite this, quality filtering provides the least benefit to QA tasks in these categories, even hurting the performance for Books. On the other end, academic and biomedical data are ranked among the lowest quality, but their QA tasks benefit the most from quality filtering.
Optimizing on one measure of quality is not sufficient to predict or improve performance across domains.
Most interestingly, Wikipedia and Web QA tasks are among the most hurt by the inverse filter—suggesting these domains are not affected as much by the absence of the lowest quality data as the presence of the highest quality data. Also unexpectedly, both the quality and inverse quality filters led to models with higher toxic generation tendencies (Figure 5, right)—the one dimensional measure of quality captured by the quality scores is not sufficient to explain this behaviour. In other words, different segments of data along this classifier’s quality spectrum can have strong but varied effects on different domains. It suggests practitioners should move beyond one measurement of quality and consider multiple.
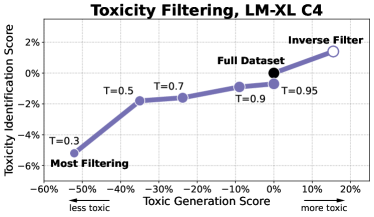
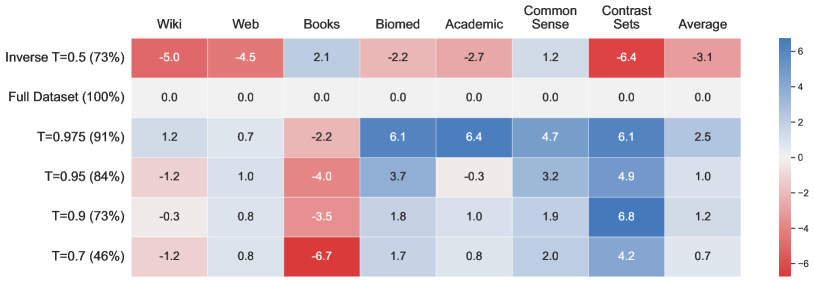
One size does not fit all. Toxicity Filtering leads to a trade-off between toxic identification and toxic generation goals.
Filtering using a toxicity classifier, we find a trade-off: models trained from heavily filtered pretraining datasets have the least toxic generation but also the worst toxicity identification (Figure 5, left). Similarly, Figure 7 shows the performance of QA tasks unrelated to toxicity are hurt by toxicity filtering, though this may be due to the overall decrease in training data. Ultimately, the intended behaviour of the model should inform the filtering strategy, rather than one size fits all. Most interesting of all, the strongest performance on toxicity identification for every dataset comes from the inverse toxicity filter. Practitioners optimizing for performance on toxic domains should intentionally apply inverse filters.
6 Impact of Domain Composition on Pretrained Models
As shown in Table 1, pretraining datasets seek to generalize to a wide array of downstream tasks by combining data from a diverse set of domains. How does the choice of pretraining source domains impact downstream performance? We empirically answer this question by ablating pretraining sources from the Pile one-at-a-time and measuring the downstream performance change in 27 QA tasks from diverse domains.
We first group the Pile data sources into nine domains representing conceptual sources that practitioners could choose to license or scrape more of: Common Crawl (CC), OpenWeb, Wikipedia, Books, PubMed, Academic, Code & Math, Legal, and Social (see Table 8). These are sorted in ascending order by size. We choose to maintain the size disparities in these sources, simply because they reflect reality: curated Wikipedia content is innately finite, while web and books are much more abundant. We then pretrain LM-XL with the full dataset minus each category, yielding nine models, then finetune each for QA using Natural Questions. Finally, we evaluate the model on 27 unique datasets from MRQA (Fisch et al., 2019) and UnifiedQA (Khashabi et al., 2020) that have also been partitioned into domains. Full details are documented in Section C.5.
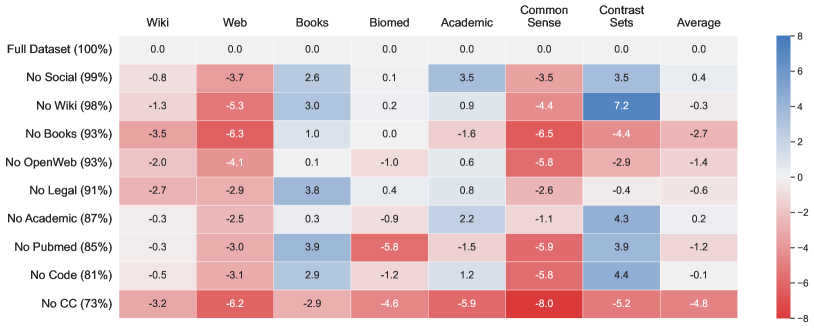
Common Crawl, OpenWeb, and Books have the strongest positive effects on downstream performance.
Figure 8 shows that average downstream performance degrades the most when we remove web-based domains like CC, Books, and OpenWeb, corroborating recent findings by Xie et al. (2023a). In particular, these sources improve performance on challenging Common Sense and Contrast Sets tasks. While CC is the largest chunk of text in the Pile, Books and OpenWeb are smaller but provide the most heterogeneous and predicted-quality content (see Section 3). These results suggest that more data is not necessarily as important a factor as a combination of heterogeneity and quality.
Domain heterogeneity is often more beneficial than targeted data, even for targeted evaluations.
Ablating a pretraining domain has varying effects on downstream QA performance. Predictably, performance degrades when we remove domains with close alignment between the pretraining and downstream data sources: removing PubMed hurts the BioMed QA evaluations, dropping Wikipedia hurts the Wikipedia benchmarks, and removing web content hurts web evaluations. However, removing targeted domains does not necessarily have as significant an effect on related downstream domains as removing the large heterogeneous domains. For instance, removing CC from the pretraining dataset reduces performance on downstream Academic QA tasks to a much greater extent than removing the Academic domain. Our hypothesis is that CC, OpenWeb and Books contain extensive coverage of many topics, so removing the Academic-specific category of sources does not remove all relevant academic information.
The best performing models use all the pretraining data sources.
Despite the importance of data heterogeneity, the best mean performance still comes from models that train on all, or nearly all, the data. The exceptions are the removal of targeted source domains like the Pile’s Code or Academic (advanced science and math journals) domains. These are both large but perhaps not well matched with the QA evaluation sets, which do not require coding skills or scientific rigour beyond that found on Wikipedia and from web-based sources. This finding suggests that both the quantity and diversity of open source data remain a bottleneck for current pretraining methods.
Web and Books domains cause the biggest trade-off between toxic identification and generation.
We next consider whether reducing a model’s pretraining exposure to toxic content affects either its propensity to generate toxic language or its ability to identify toxic language. Table 3 shows that the largest decreases in both toxicity generation and identification were caused by removing CC (26.9% of the data), OpenWeb (6.9%), and Books (6.9%). This is consistent with the observation that Web and Books data had the highest concentration of text predicted to be toxic Section 3. These results suggest a trade-off: better performance on QA (Section 6) and toxicity identification comes at the cost of more toxic generation.
| Filter | % Data | Toxicity Identification () | Toxic Generation () | |||||||
| SBF | Toxigen | DH R3 | DH R4 | Score | RTP-T | RTP-NT | RepBias | Score | ||
| Full Dataset | 100.0 | 90.7 | 90.8 | 88.7 | 84.1 | 0.0 | 88.9 | 45.4 | 4.60.7 | 0.0 |
| No Social | 98.8 | 90.9 | 91.0 | 87.8 | 84.9 | +0.1 | 85.4 | 47.2 | 4.70.8 | +0.4 |
| No Wiki | 97.9 | 90.6 | 90.8 | 88.1 | 83.6 | -0.4 | 89.0 | 49.4 | 4.80.6 | +4.2 |
| No Books | 93.1 | 89.9 | 90.3 | 87.1 | 82.6 | -1.3 | 87.4 | 43.5 | 4.00.8 | -6.2 |
| No OpenWeb | 93.1 | 89.9 | 90.3 | 86.4 | 82.5 | -1.5 | 88.0 | 42.1 | 4.30.6 | -5.2 |
| No Legal | 91.0 | 90.9 | 90.8 | 88.1 | 83.0 | -0.4 | 88.2 | 46.1 | 4.70.8 | +0.8 |
| No Academic | 87.1 | 90.7 | 91.0 | 88.2 | 84.5 | +0.0 | 86.5 | 46.4 | 4.50.7 | -1.2 |
| No Pubmed | 85.1 | 90.6 | 90.8 | 88.0 | 84.3 | -0.2 | 87.6 | 46.3 | 4.60.7 | -0.2 |
| No Code | 80.9 | 91.0 | 91.2 | 88.5 | 84.5 | +0.2 | 87.6 | 46.5 | 4.70.7 | +0.6 |
| No CC | 73.1 | 89.9 | 90.0 | 85.3 | 82.4 | -1.9 | 87.8 | 46.2 | 4.30.6 | -2.1 |
7 Discussion
Guided by intuition: undocumented & unknown
Pretraining dataset curation has been guided by intuitions: collections should be large, diverse, and high quality. Decisions are often driven by the need for something “good enough” or by precedents that may themselves not have been thoroughly evaluated (Sambasivan et al., 2021). Similarly, model developers occasionally neglect to share empirical insights, maintaining a knowledge gap, often referred to as “documentation debt” (Bandy and Vincent, 2021).
Our results show that choices made in pretraining curation affect models in significant ways that cannot be easily erased by subsequent finetuning. We urge both model producers and model users to think of dataset curation policies as a form of hyperparameter, much like learning rates or network dimensions. Exhaustive search methods that work for single scalar values will not, however, scale to curation policies that affect terabytes of data. While our results are necessary to establish that pretraining curation matters, they are not sufficient to answer all questions. In this section we therefore make specific recommendations, but our primary result is that we need better tools for modeling the relationship between data and model capabilities.
Age of the pretraining corpus.
In an ideal world, models would be continuously re-trained on the most up-to-date data available. However, given the expense of data collection and re-training, model creators must make a choice between efficiency and model staleness. More subtly, we also find that using newer data can add a “presentist” bias when evaluating retrospective tasks. The effect of staleness is not overcome even by plentiful finetuning data for the given task, and this effect is worse for the larger, more capable models. This result complements findings by Schulman (2023) that finetuning on newer data can aggravate hallucination for new data that is not well-grounded at pretraining time. These tentative findings suggest the temporal properties of pretraining corpora are increasingly essential to consider for larger models, for more novel tasks (less finetuning data), and for instruction tuning models. Current practice includes augmenting prompts with retrieved, recent data to help overcome stale pretraining data. While this can conceivably help mitigate staleness, retrieving relevant text is a challenge in its own right.
We recommend model creators report the temporal distribution of pretraining data, which is not currently standard practice (Hoffmann et al., 2022; Thoppilan et al., 2022; Anthropic AI, 2023; Cohere AI, 2023). Users should be able to predict otherwise unforeseen performance degradations on much newer datasets, or be aware of the potential side effects of finetuning models on information not covered in pretraining.
Data source composition.
Decisions on the composition of a corpus intended for pretraining can have substantial impacts on downstream performance. Of the two corpora we consider in this paper, C4 contains only one data source, a single scrape of the Common Crawl, while the Pile is a collection of 22 data sources. It is more complex and costly to assemble a corpus which contains diverse sources, writing styles, and thematic areas. Achieving this diversity might also leave models vulnerable to less careful curation or gaps in practitioner knowledge.
In our experiments, we ablate the Pile by systematically omitting each of its constituent datasets before pretraining, and then measuring the impact on standard benchmarks. Our results suggest that practitioners should not omit any data sources if generalization to as many text-to-text tasks is the goal, and that future work should focus on collecting more diverse web and books content, which yield the largest benefits. These findings are somewhat consistent with hypotheses that the volume of training data remains a limiting factor, especially given licensing constraints (Nostalgebraist, 2022).
Filtering for toxicity and quality.
The Common Crawl contains an enormous amount of low quality (advertisements, repetitive, non-human-readable, etc.) and toxic text. Many state-of-the-art language models filter out this text before training, either using bad words lists (Raffel et al., 2020), heuristics, or classifiers (Du et al., 2022; Brown et al., 2020; Chowdhery et al., 2022). Deciding on how much and what kind of text to filter out requires non-trivial normative decisions, and all of these filtering approaches involve the model creator intentionally modifying the bias of their datasets and thus their models.
In our experiments, we expose an implicit trade-off between a model’s generalization abilities and its tendency to generate toxic content. This behavior is modulated by quality and toxicity filters. In fact, over-sampling on more toxic documents leads to the best performance on toxic identification. This observation, coupled with evidence that recent work is using post-hoc methods to curb unwanted toxic generation (e.g. instruction tuning (Chung et al., 2022) or steerable decoders (Dathathri et al., 2020; Welbl et al., 2021)), suggests practitioners should prioritize toxic identification rather than curbing toxic generation abilities during pretraining.
We find that our quality filter (the same used by PaLM, trained to keep content resembling Wikipedia and Books) significantly improves performance across domains, despite removing large portions of the training data. Perplexingly, the Books domain is the one exception to the above observation, as its content ranks among the highest quality. In general, observational quality characteristics of the data are not sufficient to predict which domains will benefit most from quality filtering. Our analysis suggests that performance on a task/domain is not influenced only by how much poor quality data (i.e. that which is unlike Wikipedia/Books) is removed, but also by other aspects of quality, such as how much of the highest or mid-quality data is represented along this specific measurement dimension.
8 Limitations
Compute Expense & Single Shot Experiments
To our knowledge, this is the largest publicly documented LM pretraining data ablation study, spanning 28 1.5B parameter models—training more models with different data variants from scratch than GLaM (Du et al., 2022), miniBertas (Warstadt et al., 2020), MultiBerts (Sellam et al., 2022), and even Pythia (Biderman et al., 2023), which focuses on preserving data composition and order. It is important to acknowledge each of these pretrainings, with their corresponding finetuning and evaluations is computationally and environmentally costly. With this in mind, we made the careful decision on what experiments to pursue—narrowing our list to: age of the corpora, quality filters, toxicity filters, and the choice of source domains. We carefully curated the choice of experiments in advance, without the luxury of multiple rounds of reflection and repetition, common in many NLP experimental settings. As a result, we struck a balance as best we could between the computational costs, and reproducible validity. We hope to justify the merits of our selection and also point out the surprises that motivate future work or a deeper look into the results.
Blackbox APIs
An additional limitation is our use of Perspective’s API for evaluating the toxicity of generations. While most of our toxicity filters and evaluations were in a compressed time period, Pozzobon et al. (2023) have since demonstrated the irreproducibility of black-box APIs, which may have shifting implementations over time. We also believe that while this is the standard procedure for popular toxic generation benchmarks like RealToxicityPrompts, the reliance on APIs and narrow evaluation setting can have limited implications for toxic generation in real applications. For the time being, these are the best proxies we have.
English vs Multilingual Data
Our analysis was limited to two English datasets. It’s important to note that training composition is an even more crucial question for multilingual and non-English models, where optimally balancing corpora from different languages and finding large-enough high-quality corpora can be very challenging (Chung et al., 2023).
Relevance to Zero- & Few-Shot Prompted Settings
Our experiments focus on finetuned settings rather than zero- or few-shot prompting. This choice is motivated by finetuning being more applicable for 1.5B parameter models and also in many applied settings. We cannot establish how well these findings translate to prompted settings (without finetuning), but suspect they are strong correlated.
9 Related Work
Pretraining Dataset Curation
There have been dozens of general-purpose models trained for natural language understanding and generation tasks. Early models in this space, such as ELMO (Peters et al., 2018), BERT (Devlin et al., 2019), and BERT’s various descendants (Liu et al., 2019; Lan et al., 2020), focused on strong finetuning performance for a variety of natural language inference tasks, as well as semantically meaningful language embeddings. These systems were trained on semi-curated datasets such as Wikipedia, BookCorpus (Zhu et al., 2015), and news articles from the One Billion Word Benchmark (Chelba et al., 2013). XLNet (Yang et al., 2019) broke away from this use of curated datasets to include documents from Common Crawl into their pretraining dataset. T5 (Raffel et al., 2020), which introduced the C4 dataset, was one of the first pretrained language models to train exclusively on Common Crawl data. Multilingual versions of T5 (Xue et al., 2021) and BERT were trained on Common Crawl and Wikipedia, respectively.
GPT-2 was one of the first models intended primarily for generation (Radford et al., 2019). Deeming Common Crawl too noisy to be practical for training generative models, they developed WebText, a dataset containing websites linked to from highly-ranked posts on Reddit. Subsequent generative models proposed mixing large amounts of noisy Common Crawl data with smaller corpora perceived as high-quality. The GPT-Neo model family (Black et al., 2022) trained on the Pile, which augments the Common Crawl with ArXiV, Stack Exchange, legal documents, books, Github, and other more curated sourced (Gao et al., 2020). More recently, OPT (Zhang et al., 2022) trained on the Pile augmented with social media data (Baumgartner et al., 2020), and LLaMA (Touvron et al., 2023) trained on C4 augmented with Github, Stack Exchange, books, and other sources. Pythia trained on the Pile, with and without duplication (Biderman et al., 2023). Finally, the BLOOM model family (Scao et al., 2022) trained on the ROOTS Corpus, which crowd-sourced a collection of “identified” datasets, coming from known, high-quality sources in a variety of languages.
All of the models mentioned so far are publicly available. However, companies are increasingly training their best models on proprietary datasets, with only limited hints as to the data composition. At Alphabet, models such as Gopher (Rae et al., 2021), GLaM (Du et al., 2022) , LaMDA (Thoppilan et al., 2022), and PaLM (Chowdhery et al., 2022) have been trained on mixtures of web text, books, news, code, Wikipedia, and dialog data. At OpenAI, GPT-3 (Brown et al., 2020) was trained on Common Crawl, WebText (GPT-2’s training set), books, and Wikipedia. Subsequent versions of their model have also included code. Most of these models have acknowledged using various forms of filtering techniques to improve the quality of web-derived training data. These include classifiers designed to exclude content which looks least like “high-quality” sources such as books or Wikipedia (Chowdhery et al., 2022; Ouyang et al., 2022), using Google’s SafeSearch for identifying toxic content (Rae et al., 2021), and various heuristics based on document length and the presence or absence of certain words or characters.
Pretraining Dataset Analysis
Dodge et al. (2021) find significant amounts of low-quality patent, military, and machine-generated text in C4, and a dearth of English text from American minority communities as well as from non-Western communities like India or Nigeria post-filtering, and so recommend against filtering. In contrast, Luccioni and Viviano (2021) recommend more robust filtering practices to curb the significant presence of hate speech and sexually explicit content they find in C4 even after filtering. Similarly, Kreutzer et al. (2022) find that multilingual pretraining corpora are also dominated by low-quality text, particularly for lower resource languages. Lee et al. (2022); Kaddour (2023) show the benefits of deduplicating pretraining datasets, which often contain a great deal of repeated content. Lastly, Zhao et al. (2023) reviews pretraining data sources, strategies for quality filtering, and the importance of data distribution. Their summary corroborates our findings regarding domain composition and quality filtering, in particular.
Data, Toxicity, & Quality
Research into the quality and toxicity of datasets and their resulting models has seen mixed findings. All of the major models report using significant data pre-processing and toxicity/quality filters, including BERT, T5, BLOOM, OPT, ChinChilla, PaLM, LaMDA, and the GPT-3 series, with the largest of these now using classifiers. This widespread adoption suggests there are significant implicit benefits, even though they not often externally reported. GLaM does empirically report performance improvements from filtering, particularly on Natural Language Generation (NLG) tasks (Du et al., 2022).
However, in academia, a few works caution against the use of detoxification techniques, including data filters, which can reduce model perplexity on underrepresented communities (Xu et al., 2021; Welbl et al., 2021). Welbl et al. (2021) also reports that a toxicity classifier reduces toxicity more than than applying data toxicity data filters, but Xu et al. (2021) show this yields the worst perplexity on underrepresented communities. Meade et al. (2022) further corroborates that improvements on bias benchmarks correlates with deteriorations in general language modeling abilities. Furthermore, investigating GPT-3’s described quality filter, Gururangan et al. (2022) find its quality judgments are unaligned with factuality or literary acclaim but are instead aligned with some notion of langauge ideology more correlated with wealthier zip codes. Works in the vision domain show data filtering has important detoxification benefits but can reduce performance (Nichol et al., 2022) or introduce other biases (Nichol, 2022). In summary, pretraining data filters are ubiquitous in the development of non-toxic and high-quality models, but they are prone to reducing their abilities to serve underrepresented communities and may introduce new biases.
Data & Time
Natural language is known to evolve and change over time (Altmann et al., 2009; Labov, 2011; Eisenstein et al., 2014; Jaidka et al., 2018). As language’s distribution shifts, the ability of models to perform well on new test sets has also been shown to degrade, due to their static knowledge of recent events, syntactic and semantic practices (Lazaridou et al., 2021; Agarwal and Nenkova, 2022; Longpre et al., 2021). Luu et al. (2021); Lazaridou et al. (2021); Liska et al. (2022); Yao et al. (2022); Zhang and Choi (2021); Jang et al. (2022) offer evaluation sets to measure this phenomena. Proposed remedies include finetuning on more recent data (Luu et al., 2021), adaptive/continuous pretraining (Lazaridou et al., 2021; Röttger and Pierrehumbert, 2021), data augmentation (Singh and Ortega, 2022), modeling text with its timpestamps (Dhingra et al., 2022). To our knowledge, no work has thoroughly investigated the effects of temporal degradation when pretraining from scratch.
Data & Domains
The composition of public datasets, like C4 and the Pile, is guided mostly by licensing, which severely restricts availability. Even so, Villalobos et al. (2022); Nostalgebraist (2022); Hoffmann et al. (2022) suggest we are imminently exhausting high-quality text data on the web to train compute-optimal larger LMs, at least with existing training efficiency. This poses a challenge, given the demonstrated importance of high quality and diverse training data to strong generalization (Gao et al., 2020; Papadimitriou and Jurafsky, 2020). A great deal of literature has dedicated itself to adapting static pretrained models to new downstream domains, using domain adaptive pretraining (Gururangan et al., 2020), finding intermediate finetuning tasks (Pruksachatkun et al., 2020), dynamically balancing data sources (Wang et al., 2020), data selection (Iter and Grangier, 2021; Albalak et al., 2023), augmentation (Longpre et al., 2019), and active learning (Longpre et al., 2022). Another line of work demonstrates the potential of pretraining on carefully crafted synthetic data (Wu et al., 2022).
Most similar to this section of our work, Xie et al. (2023a) re-balance mixtures of the Pile to achieve more performant and efficient convergence. Xie et al. (2023b) use importance sampling to select subsets of the Pile most useful for target downstream tasks, in lieu of quality filters, to achieve 2% improvement on downstream tasks. Pruksachatkun et al. (2020) systematically benchmark the effects of intermediate finetuning tasks, similar to how we benchmark different compositions of pretraining tasks.
Model & Data Scaling
Prior work has explored scaling model size (Kaplan et al., 2020; Tay et al., 2022; Du et al., 2022), the amount of pretraining data or the number of pretraining steps (Liu et al., 2019; Chowdhery et al., 2022; Brown et al., 2020). Chinchilla investigated and reported optimal compute scaling laws, expressing a relationship between model and data size (Nostalgebraist, 2022). Recent work has demonstrated that new abilities emerge at greater scale (Wei et al., 2022), but also that many of these benefits can be distilled or compressed into smaller models (Taori et al., 2023; Movva et al., 2022). In this work, we investigate how temporal pretraining misalignment varies on different model sizes, which to our knowledge was previously unanswered.
10 Conclusion
The relative age of documents, content filters, and data sources each have significant effects on downstream model behaviour. These effects can be reduced, but not eliminated, by finetuning. We recommend that model developers and users pay close attention to these details in designing/selecting the model most relevant to their needs, as each decision has a specific, quantifiable trade-off profile. For instance, it may be important to decide between improving toxicity identification or reducing toxic generation, performance on brand new or older data sources, and biomedical or books text domains. These countless choices are inherent in curating any pretraining dataset. While we are only able to evaluate a small fraction of these, we are able to show which choices matter and by how much, and we hope to inspire further work evaluating dataset composition and predicting behaviors of models given pretraining datasets.
Acknowledgements
We would like to thank Daniel Smilkov for his technical assistance in characterizing large corpora, Maarten Bosma and Jacob Andreas for their early guidance on this project, Tom Small for his visual design support, and Noah Constant for feedback on the paper. This work is supported by NSF #1652536.
References
- Abadi et al. (2016) Martín Abadi, Ashish Agarwal, Paul Barham, Eugene Brevdo, Zhifeng Chen, Craig Citro, Greg S Corrado, Andy Davis, Jeffrey Dean, Matthieu Devin, et al. TensorFlow: Large-scale machine learning on heterogeneous distributed systems. arXiv preprint arXiv:1603.04467, 2016.
- Agarwal and Nenkova (2022) Oshin Agarwal and Ani Nenkova. Temporal effects on pre-trained models for language processing tasks. Transactions of the Association for Computational Linguistics, 10:904–921, 2022.
- Albalak et al. (2023) Alon Albalak, Colin Raffel, and William Yang Wang. Improving few-shot generalization by exploring and exploiting auxiliary data. arXiv preprint arXiv:2302.00674, 2023.
- Altmann et al. (2009) Eduardo G Altmann, Janet B Pierrehumbert, and Adilson E Motter. Beyond word frequency: Bursts, lulls, and scaling in the temporal distributions of words. PLOS one, 4(11):e7678, 2009.
- Anthropic AI (2023) Anthropic AI. Introducing Claude, 2023. URL https://www.anthropic.com/index/introducing-claude.
- Bai et al. (2022) Yuntao Bai, Saurav Kadavath, Sandipan Kundu, Amanda Askell, Jackson Kernion, Andy Jones, Anna Chen, Anna Goldie, Azalia Mirhoseini, Cameron McKinnon, et al. Constitutional AI: Harmlessness from ai feedback. arXiv preprint arXiv:2212.08073, 2022.
- Bandy and Vincent (2021) Jack Bandy and Nicholas Vincent. Addressing “documentation debt” in machine learning research: A retrospective datasheet for bookcorpus. arXiv preprint arXiv:2105.05241, 2021.
- Baumgartner et al. (2020) Jason Baumgartner, Savvas Zannettou, Brian Keegan, Megan Squire, and Jeremy Blackburn. The Pushshift Reddit dataset. In Proceedings of the international AAAI conference on web and social media, volume 14, pages 830–839, 2020.
- Bender (2013) Emily M Bender. Linguistic fundamentals for natural language processing: 100 essentials from morphology and syntax. Synthesis lectures on human language technologies, 6(3):1–184, 2013.
- Bender and Friedman (2018) Emily M. Bender and Batya Friedman. Data statements for natural language processing: Toward mitigating system bias and enabling better science. Transactions of the Association for Computational Linguistics, 6:587–604, 2018. doi: 10.1162/tacl_a_00041. URL https://aclanthology.org/Q18-1041.
- Biderman et al. (2023) Stella Biderman, Hailey Schoelkopf, Quentin Anthony, Herbie Bradley, Kyle O’Brien, Eric Hallahan, Mohammad Aflah Khan, Shivanshu Purohit, USVSN Sai Prashanth, Edward Raff, et al. Pythia: A suite for analyzing large language models across training and scaling. arXiv preprint arXiv:2304.01373, 2023.
- Black et al. (2022) Sid Black, Stella Biderman, Eric Hallahan, Quentin Anthony, Leo Gao, Laurence Golding, Horace He, Connor Leahy, Kyle McDonell, Jason Phang, et al. GPT-NeoX-20B: An open-source autoregressive language model. Challenges & Perspectives in Creating Large Language Models, page 95, 2022.
- Brown et al. (2020) Tom B. Brown, Benjamin Mann, Nick Ryder, Melanie Subbiah, Jared Kaplan, Prafulla Dhariwal, Arvind Neelakantan, Pranav Shyam, Girish Sastry, Amanda Askell, Sandhini Agarwal, Ariel Herbert-Voss, Gretchen Krueger, Tom Henighan, Rewon Child, Aditya Ramesh, Daniel M. Ziegler, Jeffrey Wu, Clemens Winter, Christopher Hesse, Mark Chen, Eric Sigler, Mateusz Litwin, Scott Gray, Benjamin Chess, Jack Clark, Christopher Berner, Sam McCandlish, Alec Radford, Ilya Sutskever, and Dario Amodei. Language models are few-shot learners, 2020.
- Chelba et al. (2013) Ciprian Chelba, Tomas Mikolov, Mike Schuster, Qi Ge, Thorsten Brants, Phillipp Koehn, and Tony Robinson. One billion word benchmark for measuring progress in statistical language modeling. arXiv preprint arXiv:1312.3005, 2013.
- Chen et al. (2021) Mark Chen, Jerry Tworek, Heewoo Jun, Qiming Yuan, Henrique Ponde de Oliveira Pinto, Jared Kaplan, Harri Edwards, Yuri Burda, Nicholas Joseph, Greg Brockman, et al. Evaluating large language models trained on code. arXiv preprint arXiv:2107.03374, 2021. URL https://arxiv.org/abs/2107.03374.
- Chowdhery et al. (2022) Aakanksha Chowdhery, Sharan Narang, Jacob Devlin, Maarten Bosma, Gaurav Mishra, Hyung Won Chung, Charles Sutton, Sebastian Gehrmann, Parker Schuh, et al. PaLM: Scaling language modeling with Pathways. arXiv preprint arXiv:2204.02311, 2022. URL https://arxiv.org/abs/2204.02311.
- Chung et al. (2022) Hyung Won Chung, Le Hou, Shayne Longpre, Barret Zoph, Yi Tay, William Fedus, Eric Li, Xuezhi Wang, Mostafa Dehghani, Siddhartha Brahma, et al. Scaling instruction-finetuned language models. arXiv preprint arXiv:2210.11416, 2022.
- Chung et al. (2023) Hyung Won Chung, Xavier Garcia, Adam Roberts, Yi Tay, Orhan Firat, Sharan Narang, and Noah Constant. Unimax: Fairer and more effective language sampling for large-scale multilingual pretraining. In The Eleventh International Conference on Learning Representations, 2023.
- Cohere AI (2023) Cohere AI. Cohere command nightly, 2023. URL https://docs.cohere.com/docs/command-beta.
- Cortes and Lawrence (2021) Corinna Cortes and Neil D Lawrence. Inconsistency in conference peer review: Revisiting the 2014 NeurIPS experiment. arXiv preprint arXiv:2109.09774, 2021.
- Dathathri et al. (2020) Sumanth Dathathri, Andrea Madotto, Janice Lan, Jane Hung, Eric Frank, Piero Molino, Jason Yosinski, and Rosanne Liu. Plug and play language models: A simple approach to controlled text generation. In International Conference on Learning Representations, 2020.
- Devlin et al. (2019) Jacob Devlin, Ming-Wei Chang, Kenton Lee, and Kristina Toutanova. BERT: Pre-training of deep bidirectional transformers for language understanding. NAACL, 2019. URL https://aclanthology.org/N19-1423.
- Dhingra et al. (2022) Bhuwan Dhingra, Jeremy R Cole, Julian Martin Eisenschlos, Daniel Gillick, Jacob Eisenstein, and William W Cohen. Time-aware language models as temporal knowledge bases. Transactions of the Association for Computational Linguistics, 10:257–273, 2022.
- Dodge et al. (2021) Jesse Dodge, Maarten Sap, Ana Marasović, William Agnew, Gabriel Ilharco, Dirk Groeneveld, Margaret Mitchell, and Matt Gardner. Documenting large webtext corpora: A case study on the Colossal Clean Crawled Corpus. In Proceedings of the 2021 Conference on Empirical Methods in Natural Language Processing, pages 1286–1305, 2021.
- Du et al. (2022) Nan Du, Yanping Huang, Andrew M. Dai, Simon Tong, Dmitry Lepikhin, Yuanzhong Xu, Maxim Krikun, Yanqi Zhou, Adams Wei Yu, Orhan Firat, Barret Zoph, Liam Fedus, Maarten Bosma, Zongwei Zhou, Tao Wang, Yu Emma Wang, Kellie Webster, Marie Pellat, Kevin Robinson, Kathleen Meier-Hellstern, Toju Duke, Lucas Dixon, Kun Zhang, Quoc V Le, Yonghui Wu, Zhifeng Chen, and Claire Cui. GLaM: Efficient Scaling of Language Models with Mixture-of-Experts. ICML, 2022. URL https://arxiv.org/abs/2112.06905.
- Eisenstein et al. (2014) Jacob Eisenstein, Brendan O’Connor, Noah A Smith, and Eric P Xing. Diffusion of lexical change in social media. PloS one, 9(11):e113114, 2014.
- Endrédy and Novák (2013) István Endrédy and Attila Novák. More effective boilerplate removal-the goldminer algorithm. Polibits, 48:79–83, 2013.
- Fisch et al. (2019) Adam Fisch, Alon Talmor, Robin Jia, Minjoon Seo, Eunsol Choi, and Danqi Chen. Mrqa 2019 shared task: Evaluating generalization in reading comprehension. In Proceedings of the 2nd Workshop on Machine Reading for Question Answering, pages 1–13, 2019.
- Friedl (2023) Paul Friedl. Dis/similarities in the design and development of legal and algorithmic normative systems: the case of perspective api. Law, Innovation and Technology, pages 1–35, 2023.
- Gao et al. (2020) Leo Gao, Stella Biderman, Sid Black, Laurence Golding, Travis Hoppe, Charles Foster, Jason Phang, Horace He, Anish Thite, Noa Nabeshima, et al. The Pile: An 800GB dataset of diverse text for language modeling. arXiv preprint arXiv:2101.00027, 2020.
- Gao et al. (2021) Tianyu Gao, Adam Fisch, and Danqi Chen. Making pre-trained language models better few-shot learners. ACL, 2021. doi: 10.18653/v1/2021.acl-long.295. URL https://aclanthology.org/2021.acl-long.295.
- Gardner et al. (2020) Matt Gardner, Yoav Artzi, Victoria Basmov, Jonathan Berant, Ben Bogin, Sihao Chen, Pradeep Dasigi, Dheeru Dua, Yanai Elazar, Ananth Gottumukkala, et al. Evaluating models’ local decision boundaries via contrast sets. In Findings of the Association for Computational Linguistics: EMNLP 2020, pages 1307–1323, 2020.
- Gargee et al. (2022) SK Gargee, Pranav Bhargav Gopinath, Shridhar Reddy SR Kancharla, CR Anand, and Anoop S Babu. Analyzing and addressing the difference in toxicity prediction between different comments with same semantic meaning in Google’s Perspective API. In ICT Systems and Sustainability: Proceedings of ICT4SD 2022, pages 455–464. Springer, 2022.
- Gebru et al. (2021) Timnit Gebru, Jamie Morgenstern, Briana Vecchione, Jennifer Wortman Vaughan, Hanna Wallach, Hal Daumé III au2, and Kate Crawford. Datasheets for datasets, 2021.
- Gehman et al. (2020) Samuel Gehman, Suchin Gururangan, Maarten Sap, Yejin Choi, and Noah A Smith. RealToxicityPrompts: Evaluating neural toxic degeneration in language models. In Findings of the Association for Computational Linguistics: EMNLP 2020, pages 3356–3369, 2020.
- Gokaslan* et al. (2019) Aaron Gokaslan*, Vanya Cohen*, Ellie Pavlick, and Stefanie Tellex. OpenWebText corpus, 2019. URL http://Skylion007.github.io/OpenWebTextCorpus.
- Google (2023) Google. PaLM 2 technical report, 2023. URL https://ai.google/static/documents/palm2techreport.pdf.
- Google Cloud NLP (2023a) Google Cloud NLP. Google Cloud infotype detector, 2023a. URL https://cloud.google.com/dlp/docs/infotypes-reference.
- Google Cloud NLP (2023b) Google Cloud NLP. Google Cloud analyzing sentiment, 2023b. URL https://cloud.google.com/natural-language/docs/analyzing-sentiment.
- Gururangan et al. (2020) Suchin Gururangan, Ana Marasović, Swabha Swayamdipta, Kyle Lo, Iz Beltagy, Doug Downey, and Noah A Smith. Don’t stop pretraining: Adapt language models to domains and tasks. In Proceedings of the 58th Annual Meeting of the Association for Computational Linguistics, pages 8342–8360, 2020.
- Gururangan et al. (2022) Suchin Gururangan, Dallas Card, Sarah K Drier, Emily K Gade, Leroy Z Wang, Zeyu Wang, Luke Zettlemoyer, and Noah A Smith. Whose language counts as high quality? Measuring language ideologies in text data selection. arXiv preprint arXiv:2201.10474, 2022.
- Hartvigsen et al. (2022) Thomas Hartvigsen, Saadia Gabriel, Hamid Palangi, Maarten Sap, Dipankar Ray, and Ece Kamar. Toxigen: A large-scale machine-generated dataset for adversarial and implicit hate speech detection. In Proceedings of the 60th Annual Meeting of the Association for Computational Linguistics (Volume 1: Long Papers), pages 3309–3326, 2022.
- Hoffmann et al. (2022) Jordan Hoffmann, Sebastian Borgeaud, Arthur Mensch, Elena Buchatskaya, Trevor Cai, Eliza Rutherford, Diego de Las Casas, Lisa Anne Hendricks, Johannes Welbl, Aidan Clark, et al. Training compute-optimal large language models. arXiv preprint arXiv:2203.15556, 2022.
- Iter and Grangier (2021) Dan Iter and David Grangier. On the complementarity of data selection and fine tuning for domain adaptation. arXiv preprint arXiv:2109.07591, 2021.
- Jaidka et al. (2018) Kokil Jaidka, Niyati Chhaya, and Lyle Ungar. Diachronic degradation of language models: Insights from social media. In Proceedings of the 56th Annual Meeting of the Association for Computational Linguistics (Volume 2: Short Papers), pages 195–200, Melbourne, Australia, July 2018. Association for Computational Linguistics. doi: 10.18653/v1/P18-2032. URL https://aclanthology.org/P18-2032.
- Jang et al. (2022) Joel Jang, Seonghyeon Ye, Changho Lee, Sohee Yang, Joongbo Shin, Janghoon Han, Gyeonghun Kim, and Minjoon Seo. TemporalWiki: A lifelong benchmark for training and evaluating ever-evolving language models. arXiv preprint arXiv:2204.14211, 2022.
- Kaddour (2023) Jean Kaddour. The minipile challenge for data-efficient language models. arXiv preprint arXiv:2304.08442, 2023.
- Kaplan et al. (2020) Jared Kaplan, Sam McCandlish, Tom Henighan, Tom B Brown, Benjamin Chess, Rewon Child, Scott Gray, Alec Radford, Jeffrey Wu, and Dario Amodei. Scaling laws for neural language models. arXiv preprint arXiv:2001.08361, 2020. URL https://arxiv.org/abs/2001.08361.
- Khashabi et al. (2020) Daniel Khashabi, Sewon Min, Tushar Khot, Ashish Sabharwal, Oyvind Tafjord, Peter Clark, and Hannaneh Hajishirzi. UnifiedQA: Crossing format boundaries with a single QA system. In Findings of the Association for Computational Linguistics: EMNLP 2020, 2020. URL https://aclanthology.org/2020.findings-emnlp.171.
- Kincaid et al. (1975) J Peter Kincaid, Robert P Fishburne Jr, Richard L Rogers, and Brad S Chissom. Derivation of new readability formulas (automated readability index, fog count and flesch reading ease formula) for navy enlisted personnel. Technical report, Naval Technical Training Command Millington TN Research Branch, 1975.
- Kreutzer et al. (2022) Julia Kreutzer, Isaac Caswell, Lisa Wang, Ahsan Wahab, Daan van Esch, Nasanbayar Ulzii-Orshikh, Allahsera Tapo, Nishant Subramani, Artem Sokolov, Claytone Sikasote, et al. Quality at a glance: An audit of web-crawled multilingual datasets. Transactions of the Association for Computational Linguistics, 10:50–72, 2022.
- Kwiatkowski et al. (2019) Tom Kwiatkowski, Jennimaria Palomaki, Olivia Redfield, Michael Collins, Ankur Parikh, Chris Alberti, Danielle Epstein, Illia Polosukhin, Jacob Devlin, Kenton Lee, et al. Natural Questions: a benchmark for question answering research. Transactions of the Association for Computational Linguistics, 7:453–466, 2019.
- Labov (2011) William Labov. Principles of linguistic change, volume 3: Cognitive and cultural factors, volume 3. John Wiley & Sons, 2011.
- Lan et al. (2020) Zhenzhong Lan, Mingda Chen, Sebastian Goodman, Kevin Gimpel, Piyush Sharma, and Radu Soricut. ALBERT: A lite BERT for self-supervised learning of language representations. In International Conference on Learning Representations, 2020.
- Laurençon et al. (2022) Hugo Laurençon, Lucile Saulnier, Thomas Wang, Christopher Akiki, Albert Villanova del Moral, Teven Le Scao, Leandro Von Werra, Chenghao Mou, Eduardo González Ponferrada, Huu Nguyen, et al. The BigScience ROOTS Corpus: A 1.6TB composite multilingual dataset. In Thirty-sixth Conference on Neural Information Processing Systems Datasets and Benchmarks Track, 2022.
- Lazaridou et al. (2021) Angeliki Lazaridou, Adhi Kuncoro, Elena Gribovskaya, Devang Agrawal, Adam Liska, Tayfun Terzi, Mai Gimenez, Cyprien de Masson d’Autume, Tomas Kocisky, Sebastian Ruder, et al. Mind the gap: Assessing temporal generalization in neural language models. Advances in Neural Information Processing Systems, 34:29348–29363, 2021.
- Lee et al. (2022) Katherine Lee, Daphne Ippolito, Andrew Nystrom, Chiyuan Zhang, Douglas Eck, Chris Callison-Burch, and Nicholas Carlini. Deduplicating training data makes language models better. In Proceedings of the 60th Annual Meeting of the Association for Computational Linguistics (Volume 1: Long Papers), pages 8424–8445, 2022.
- Lees et al. (2022) Alyssa Lees, Vinh Q Tran, Yi Tay, Jeffrey Sorensen, Jai Gupta, Donald Metzler, and Lucy Vasserman. A new generation of Perspective API: Efficient multilingual character-level transformers. arXiv preprint arXiv:2202.11176, 2022. URL http://perspectiveapi.com.com.
- Liska et al. (2022) Adam Liska, Tomas Kocisky, Elena Gribovskaya, Tayfun Terzi, Eren Sezener, Devang Agrawal, Cyprien De Masson D’Autume, Tim Scholtes, Manzil Zaheer, Susannah Young, Ellen Gilsenan-Mcmahon, Sophia Austin, Phil Blunsom, and Angeliki Lazaridou. StreamingQA: A benchmark for adaptation to new knowledge over time in question answering models. In Proceedings of the 39th International Conference on Machine Learning, pages 13604–13622, 2022. URL https://proceedings.mlr.press/v162/liska22a/liska22a.pdf.
- Liu et al. (2019) Yinhan Liu, Myle Ott, Naman Goyal, Jingfei Du, Mandar Joshi, Danqi Chen, Omer Levy, Mike Lewis, Luke Zettlemoyer, and Veselin Stoyanov. RoBERTa: A robustly optimized bert pretraining approach. arXiv preprint arXiv:1907.11692, 2019.
- Longpre et al. (2019) Shayne Longpre, Yi Lu, Zhucheng Tu, and Chris DuBois. An exploration of data augmentation and sampling techniques for domain-agnostic question answering. In Proceedings of the 2nd Workshop on Machine Reading for Question Answering, pages 220–227, 2019.
- Longpre et al. (2021) Shayne Longpre, Kartik Perisetla, Anthony Chen, Nikhil Ramesh, Chris DuBois, and Sameer Singh. Entity-based knowledge conflicts in question answering. In Proceedings of the 2021 Conference on Empirical Methods in Natural Language Processing, pages 7052–7063, 2021.
- Longpre et al. (2022) Shayne Longpre, Julia Rachel Reisler, Edward Greg Huang, Yi Lu, Andrew Frank, Nikhil Ramesh, and Christopher DuBois. Active learning over multiple domains in natural language tasks. In NeurIPS 2022 Workshop on Distribution Shifts: Connecting Methods and Applications, 2022.
- Longpre et al. (2023) Shayne Longpre, Le Hou, Tu Vu, Albert Webson, Hyung Won Chung, Yi Tay, Denny Zhou, Quoc V Le, Barret Zoph, Jason Wei, et al. The Flan collection: Designing data and methods for effective instruction tuning. arXiv preprint arXiv:2301.13688, 2023.
- Luccioni and Viviano (2021) Alexandra Sasha Luccioni and Joseph D Viviano. What’s in the box? a preliminary analysis of undesirable content in the Common Crawl corpus. arXiv preprint arXiv:2105.02732, 2021.
- Luu et al. (2021) Kelvin Luu, Daniel Khashabi, Suchin Gururangan, Karishma Mandyam, and Noah A Smith. Time waits for no one! analysis and challenges of temporal misalignment. arXiv preprint arXiv:2111.07408, 2021.
- Madaan et al. (2022) Aman Madaan, Shuyan Zhou, Uri Alon, Yiming Yang, and Graham Neubig. Language models of code are few-shot commonsense learners, 2022.
- Meade et al. (2022) Nicholas Meade, Elinor Poole-Dayan, and Siva Reddy. An empirical survey of the effectiveness of debiasing techniques for pre-trained language models. In Proceedings of the 60th Annual Meeting of the Association for Computational Linguistics (Volume 1: Long Papers), pages 1878–1898, 2022.
- Movva et al. (2022) Rajiv Movva, Jinhao Lei, Shayne Longpre, Ajay Gupta, and Chris DuBois. Combining compressions for multiplicative size scaling on natural language tasks. In Proceedings of the 29th International Conference on Computational Linguistics, pages 2861–2872, 2022.
- Nichol (2022) Alex Nichol. DALL-E 2 pre-training mitigations, 2022. URL https://openai.com/research/dall-e-2-pre-training-mitigations.
- Nichol et al. (2022) Alexander Quinn Nichol, Prafulla Dhariwal, Aditya Ramesh, Pranav Shyam, Pamela Mishkin, Bob Mcgrew, Ilya Sutskever, and Mark Chen. Glide: Towards photorealistic image generation and editing with text-guided diffusion models. In International Conference on Machine Learning, pages 16784–16804. PMLR, 2022.
- Nostalgebraist (2022) Nostalgebraist. Chinchilla’s wild implications. AI Alignment Forum, 2022. URL https://www.alignmentforum.org/posts/6Fpvch8RR29qLEWNH/chinchilla-s-wild-implications.
- NYT (2020) The Open Team NYT. To apply machine learning responsibly, we use it in moderation, 2020. URL https://open.nytimes.com/to-apply-machine-learning-responsibly-we-use-it-in-moderation-d001f49e0644.
- OpenAI (2023) OpenAI. GPT-4 technical report. arXiv preprint arxiv:2303.08774, 2023. URL https://arxiv.org/pdf/2303.08774.pdf.
- Ouyang et al. (2022) Long Ouyang, Jeff Wu, Xu Jiang, Diogo Almeida, Carroll L. Wainwright, Pamela Mishkin, Chong Zhang, Sandhini Agarwal, Katarina Slama, Alex Ray, et al. Training language models to follow instructions with human feedback. arXiv preprint arXiv:2203.02155, 2022. URL https://arxiv.org/abs/2203.02155.
- Papadimitriou and Jurafsky (2020) Isabel Papadimitriou and Dan Jurafsky. Learning music helps you read: Using transfer to study linguistic structure in language models. In Proceedings of the 2020 Conference on Empirical Methods in Natural Language Processing (EMNLP), pages 6829–6839, 2020.
- Peters et al. (2018) Matthew E. Peters, Mark Neumann, Mohit Iyyer, Matt Gardner, Christopher Clark, Kenton Lee, and Luke Zettlemoyer. Deep contextualized word representations. NAACL, 2018. URL https://aclanthology.org/N18-1202.
- Pozzobon et al. (2023) Luiza Amador Pozzobon, Beyza Ermis, Patrick Lewis, and Sara Hooker. On the challenges of using black-box APIs for toxicity evaluation in research. In ICLR 2023 Workshop on Trustworthy and Reliable Large-Scale Machine Learning Models, 2023.
- Pruksachatkun et al. (2020) Yada Pruksachatkun, Jason Phang, Haokun Liu, Phu Mon Htut, Xiaoyi Zhang, Richard Yuanzhe Pang, Clara Vania, Katharina Kann, and Samuel Bowman. Intermediate-task transfer learning with pretrained language models: When and why does it work? In Proceedings of the 58th Annual Meeting of the Association for Computational Linguistics, pages 5231–5247, 2020.
- Radford et al. (2019) Alec Radford, Jeffrey Wu, Rewon Child, David Luan, Dario Amodei, Ilya Sutskever, et al. Language models are unsupervised multitask learners. OpenAI blog, 1(8):9, 2019. URL https://d4mucfpksywv.cloudfront.net/better-language-models/language_models_are_unsupervised_multitask_learners.pdf.
- Rae et al. (2021) Jack W. Rae, Sebastian Borgeaud, Trevor Cai, Katie Millican, Jordan Hoffmann, Francis Song, John Aslanides, Sarah Henderson, Roman Ring, Susannah Young, et al. Scaling language models: Methods, analysis & insights from training Gopher. arXiv preprint arXiv:2112.11446, 2021. URL https://arxiv.org/abs/2112.11446.
- Raffel et al. (2020) Colin Raffel, Noam Shazeer, Adam Roberts, Katherine Lee, Sharan Narang, Michael Matena, Yanqi Zhou, Wei Li, and Peter J Liu. Exploring the limits of transfer learning with a unified text-to-text transformer. Journal of Machine Learning Research, 21:1–67, 2020. URL https://arxiv.org/abs/1910.10683.
- Roberts et al. (2022) Adam Roberts, Hyung Won Chung, Anselm Levskaya, Gaurav Mishra, James Bradbury, Daniel Andor, Sharan Narang, Brian Lester, Colin Gaffney, Afroz Mohiuddin, Curtis Hawthorne, Aitor Lewkowycz, Alex Salcianu, Marc van Zee, Jacob Austin, Sebastian Goodman, Livio Baldini Soares, Haitang Hu, Sasha Tsvyashchenko, Aakanksha Chowdhery, Jasmijn Bastings, Jannis Bulian, Xavier Garcia, Jianmo Ni, Andrew Chen, Kathleen Kenealy, Jonathan H. Clark, Stephan Lee, Dan Garrette, James Lee-Thorp, Colin Raffel, Noam Shazeer, Marvin Ritter, Maarten Bosma, Alexandre Passos, Jeremy Maitin-Shepard, Noah Fiedel, Mark Omernick, Brennan Saeta, Ryan Sepassi, Alexander Spiridonov, Joshua Newlan, and Andrea Gesmundo. Scaling up models and data with t5x and seqio. arXiv preprint arXiv:2203.17189, 2022. URL https://arxiv.org/abs/2203.17189.
- Rogers (2021) Anna Rogers. Changing the world by changing the data. In Proceedings of the 59th Annual Meeting of the Association for Computational Linguistics and the 11th International Joint Conference on Natural Language Processing (Volume 1: Long Papers), pages 2182–2194, 2021.
- Röttger and Pierrehumbert (2021) Paul Röttger and Janet Pierrehumbert. Temporal adaptation of BERT and performance on downstream document classification: Insights from social media. In Findings of the Association for Computational Linguistics: EMNLP 2021, pages 2400–2412, Punta Cana, Dominican Republic, November 2021. Association for Computational Linguistics. doi: 10.18653/v1/2021.findings-emnlp.206. URL https://aclanthology.org/2021.findings-emnlp.206.
- Sambasivan et al. (2021) Nithya Sambasivan, Shivani Kapania, Hannah Highfill, Diana Akrong, Praveen Paritosh, and Lora M Aroyo. “Everyone wants to do the model work, not the data work”: Data cascades in high-stakes AI. In CHI, CHI ’21, New York, NY, USA, 2021. Association for Computing Machinery. ISBN 9781450380966. doi: 10.1145/3411764.3445518. URL https://doi.org/10.1145/3411764.3445518.
- Sap et al. (2020) Maarten Sap, Saadia Gabriel, Lianhui Qin, Dan Jurafsky, Noah A. Smith, and Yejin Choi. Social bias frames: Reasoning about social and power implications of language. In Proceedings of the 58th Annual Meeting of the Association for Computational Linguistics, pages 5477–5490, Online, July 2020. Association for Computational Linguistics. doi: 10.18653/v1/2020.acl-main.486. URL https://aclanthology.org/2020.acl-main.486.
- Scao et al. (2022) Teven Le Scao, Angela Fan, Christopher Akiki, Ellie Pavlick, Suzana Ilić, Daniel Hesslow, Roman Castagné, Alexandra Sasha Luccioni, François Yvon, Matthias Gallé, et al. BLOOM: A 176b-parameter open-access multilingual language model. arXiv preprint arXiv:2211.05100, 2022.
- Schulman (2023) John Schulman. Reinforcement learning from human feedback: Progress and challenges. Berkeley EECS, 2023. URL https://www.youtube.com/watch?v=hhiLw5Q_UFg.
- Sellam et al. (2022) Thibault Sellam, Steve Yadlowsky, Ian Tenney, Jason Wei, Naomi Saphra, Alexander D’Amour, Tal Linzen, Jasmijn Bastings, Iulia Raluca Turc, Jacob Eisenstein, et al. The MultiBERTs: BERT reproductions for robustness analysis. In International Conference on Learning Representations, 2022.
- Singh and Ortega (2022) Ayush Singh and John E Ortega. Addressing distribution shift at test time in pre-trained language models. arXiv preprint arXiv:2212.02384, 2022.
- Singh (2019) Spandana Singh. Everything in moderation: An analysis of how internet platforms are using artificial intelligence to moderate user-generated content. New America, 2019. URL https://www.newamerica.org/oti/reports/everything-moderation-analysis-how-internet-platforms-are-using-artificial-intelligence-moderate-user-generated-content/.
- Taori et al. (2023) Rohan Taori, Ishaan Gulrajani, Tianyi Zhang, Yann Dubois, Xuechen Li, Carlos Guestrin, Percy Liang, and Tatsunori B. Hashimoto. Stanford Alpaca: An instruction-following LLaMA model. https://github.com/tatsu-lab/stanford_alpaca, 2023.
- Tay et al. (2022) Yi Tay, Mostafa Dehghani, Samira Abnar, Hyung Won Chung, William Fedus, Jinfeng Rao, Sharan Narang, Vinh Q Tran, Dani Yogatama, and Donald Metzler. Scaling laws vs model architectures: How does inductive bias influence scaling? arXiv preprint arXiv:2207.10551, 2022.
- Thoppilan et al. (2022) Romal Thoppilan, Daniel De Freitas, Jamie Hall, Noam Shazeer, Apoorv Kulshreshtha, Heng-Tze Cheng, Alicia Jin, Taylor Bos, Leslie Baker, Yu Du, et al. LaMDA: Language models for dialog applications. arXiv preprint arXiv:2201.08239, 2022. URL https://arxiv.org/abs/2201.08239.
- Touvron et al. (2023) Hugo Touvron, Thibaut Lavril, Gautier Izacard, Xavier Martinet, Marie-Anne Lachaux, Timothée Lacroix, Baptiste Rozière, Naman Goyal, Eric Hambro, Faisal Azhar, et al. LLaMA: Open and efficient foundation language models. arXiv preprint arXiv:2302.13971, 2023.
- Vidgen et al. (2021) Bertie Vidgen, Tristan Thrush, Zeerak Waseem, and Douwe Kiela. Learning from the worst: Dynamically generated datasets to improve online hate detection. In Proceedings of the 59th Annual Meeting of the Association for Computational Linguistics and the 11th International Joint Conference on Natural Language Processing (Volume 1: Long Papers), pages 1667–1682, Online, August 2021. Association for Computational Linguistics. doi: 10.18653/v1/2021.acl-long.132. URL https://aclanthology.org/2021.acl-long.132.
- Villalobos et al. (2022) Pablo Villalobos, Jaime Sevilla, Lennart Heim, Tamay Besiroglu, Marius Hobbhahn, and Anson Ho. Will we run out of data? an analysis of the limits of scaling datasets in machine learning. arXiv preprint arXiv:2211.04325, 2022.
- Wang et al. (2022) Thomas Wang, Adam Roberts, Daniel Hesslow, Teven Le Scao, Hyung Won Chung, Iz Beltagy, Julien Launay, and Colin Raffel. What language model architecture and pretraining objective work best for zero-shot generalization? ICML, 2022. URL https://arxiv.org/abs/2204.05832.
- Wang et al. (2020) Xinyi Wang, Yulia Tsvetkov, and Graham Neubig. Balancing training for multilingual neural machine translation. In Proceedings of the 58th Annual Meeting of the Association for Computational Linguistics, pages 8526–8537, 2020.
- Warstadt et al. (2020) Alex Warstadt, Yian Zhang, Haau-Sing Li, Haokun Liu, and Samuel R Bowman. Learning which features matter: RoBERTa acquires a preference for linguistic generalizations (eventually). arXiv preprint arXiv:2010.05358, 2020.
- Wei et al. (2022) Jason Wei, Yi Tay, Rishi Bommasani, Colin Raffel, Barret Zoph, Sebastian Borgeaud, Dani Yogatama, Maarten Bosma, Denny Zhou, Donald Metzler, et al. Emergent abilities of large language models. TMLR, 2022. URL https://openreview.net/forum?id=yzkSU5zdwD.
- Welbl et al. (2021) Johannes Welbl, Amelia Glaese, Jonathan Uesato, Sumanth Dathathri, John Mellor, Lisa Anne Hendricks, Kirsty Anderson, Pushmeet Kohli, Ben Coppin, and Po-Sen Huang. Challenges in detoxifying language models. In Findings of the Association for Computational Linguistics: EMNLP 2021, pages 2447–2469, 2021.
- Wu et al. (2022) Yuhuai Wu, Felix Li, and Percy Liang. Insights into pre-training via simpler synthetic tasks. In Advances in Neural Information Processing Systems, 2022.
- Xie et al. (2023a) Sang Michael Xie, Hieu Pham, Xuanyi Dong, Nan Du, Hanxiao Liu, Yifeng Lu, Percy Liang, Quoc V Le, Tengyu Ma, and Adams Wei Yu. DoReMi: Optimizing data mixtures speeds up language model pretraining. arXiv preprint arXiv:2305.10429, 2023a.
- Xie et al. (2023b) Sang Michael Xie, Shibani Santurkar, Tengyu Ma, and Percy Liang. Data selection for language models via importance resampling. arXiv preprint arXiv:2302.03169, 2023b.
- Xu et al. (2021) Albert Xu, Eshaan Pathak, Eric Wallace, Suchin Gururangan, Maarten Sap, and Dan Klein. Detoxifying language models risks marginalizing minority voices. In Proceedings of the 2021 Conference of the North American Chapter of the Association for Computational Linguistics: Human Language Technologies, pages 2390–2397, Online, June 2021. Association for Computational Linguistics. doi: 10.18653/v1/2021.naacl-main.190. URL https://aclanthology.org/2021.naacl-main.190.
- Xue et al. (2021) Linting Xue, Noah Constant, Adam Roberts, Mihir Kale, Rami Al-Rfou, Aditya Siddhant, Aditya Barua, and Colin Raffel. mT5: A massively multilingual pre-trained text-to-text transformer. In Proceedings of the 2021 Conference of the North American Chapter of the Association for Computational Linguistics: Human Language Technologies, pages 483–498, 2021.
- Yang et al. (2019) Zhilin Yang, Zihang Dai, Yiming Yang, Jaime Carbonell, Russ R Salakhutdinov, and Quoc V Le. XLNet: Generalized autoregressive pretraining for language understanding. Advances in neural information processing systems, 32, 2019.
- Yao et al. (2022) Huaxiu Yao, Caroline Choi, Bochuan Cao, Yoonho Lee, Pang Wei Koh, and Chelsea Finn. Wild-Time: A benchmark of in-the-wild distribution shift over time. In Thirty-sixth Conference on Neural Information Processing Systems Datasets and Benchmarks Track, 2022.
- Zhang and Choi (2021) Michael Zhang and Eunsol Choi. SituatedQA: Incorporating extra-linguistic contexts into qa. In Proceedings of the 2021 Conference on Empirical Methods in Natural Language Processing, pages 7371–7387, 2021.
- Zhang et al. (2022) Susan Zhang, Stephen Roller, Naman Goyal, Mikel Artetxe, Moya Chen, Shuohui Chen, Christopher Dewan, Mona Diab, Xian Li, Xi Victoria Lin, et al. OPT: Open pre-trained transformer language models. arXiv preprint arXiv:2205.01068, 2022.
- Zhao et al. (2023) Wayne Xin Zhao, Kun Zhou, Junyi Li, Tianyi Tang, Xiaolei Wang, Yupeng Hou, Yingqian Min, Beichen Zhang, Junjie Zhang, Zican Dong, et al. A survey of large language models. arXiv preprint arXiv:2303.18223, 2023.
- Zhu et al. (2015) Yukun Zhu, Ryan Kiros, Rich Zemel, Ruslan Salakhutdinov, Raquel Urtasun, Antonio Torralba, and Sanja Fidler. Aligning books and movies: Towards story-like visual explanations by watching movies and reading books. In Proceedings of the IEEE international conference on computer vision, pages 19–27, 2015.
Appendix
Appendix A Contributions
-
•
Shayne Longpre Project lead and primary coder. Led experiment design, implementation, pretraining, evaluation, and analysis.
- •
-
•
Emily Reif Core contributor. Led the analysis of data characteristics pre- and post-curation (Section 3). Also supported writing and analysis.
-
•
Katherine Lee Core contributor. Supported infrastructure implementation, debugging, overall analysis and framing, especially for Section 4.
-
•
David Mimno Core contributor. A primary advisor, supporting analysis, framing, writing, and particularly discussion of key take-aways and recommendations (Section 7).
-
•
Daphne Ippolito Core contributor. The primary advisor and also a coding contributor, supporting both the analysis, framing, and writing as well as running many of the experiments and evaluations.
-
•
Adam Roberts Supporting advisor, especially on modeling choice and pretraining infrastructure.
-
•
Barret Zoph Supporting advisor on experiment design.
-
•
Denny Zhou Supporting advisor on writing and framing.
-
•
Jason Wei Supporting advisor on experiment design, writing and framing.
-
•
Kevin Robinson Supporting advisor on toxicity evaluations and their implementation.
Appendix B Expanded Literature Review
Table 4 lists popular and well-known models trained in the last several years and a summary of the available information about their training data.
| Model | Filtering Details |
| Bert | “ignore lists, tables, and headers” |
| GPT-2 | removed Wikipedia |
| RoBerta | CC filtered to news and Winograd-like subsets |
| XLNet | “heuristics to aggressively filter out short or low-quality articles” |
| T5 | Heuristic quality, toxicity, and length filters; code removed |
| GPT-3 | Filtered based on similarity to high-quality reference corpora. |
| GPT-J/Neo | Uses fasttext classifier on Pile-CC, with OpenWebText2 as the high-quality reference. |
| GLaM | Classifier with Wikipedia, books and selected websites as positive examples |
| LaMDA | “LaMDA SSI and safety discriminators are also used to score and filter 2.5M turns of dialog data sampled from the pre-training dataset”, which are then trained on. |
| AlphaCode | Filtering heuristics to exclude automatically generated code |
| CodeGen | Heuristic filters for code quality |
| Chinchilla | Heuristic-based quality filtering, SafeSearch filter |
| Minerva | Same as PaLM for non-academic data |
| BLOOM | heuristic-based quality and porn filtering |
| PaLM | Same as GlaM |
| Galactica | Apply several quality filters: exclude papers from journals with certain keywords or low journal impact factor |
| LLaMA | Classifier to filter out low-quality and un-Wikipedia-like text |
Appendix C Experimental Details
This section provides further details on the methodology and hyperparameter settings used for pretraining, finetuning, and evaluation.
To allow for a model that can generate without finetuning but also perform well after finetuning, we rely on the extensive experiments of Wang et al. (2022). Their empirical results suggest these criteria are met with a Causal Decoding architecture with a Full Language Modeling pretraining objective (“CD-FLM”), which permits generation without finetuning, followed by a Prefix Language Modeling objective (PLM) for finetuning, where the causal attention mask is removed from the original prompt.
C.1 Pretraining Details
Our two pretraining datasets are C4 (Raffel et al., 2020) and the Pile (Gao et al., 2021). We use the same vocabulary for both as used in the original T5 from Raffel et al. (2020). All training is conducted using T5X (Roberts et al., 2022) and Tensorflow (Abadi et al., 2016) on TPUs. Specific hyperparameters for LM-XL and LM-Small pretraining are detailed in Table 5.
| Parameter | LM-XL | LM-Small |
| TPUs | 8x8x8 | 8x8 |
| Batch Size | 4096 | 4096 |
| Sequence Length | 512 | 512 |
| Training Steps | 88,064 | 88,064 |
| Dropout | 0.0 | 0.0 |
| Base Learning Rate | 0.5 | |
| Decay Factor | 0.5 | |
| Warmup Steps | 1000 | |
| Steps per Decay | 20000 | |
C.2 Finetuning Details
Unless otherwise noted, evaluation was performed by finetuning on the train set for each benchmark task, and then evaluating on either the validation or test set (specified in each section). Finetuning hyperparameters are given in Table 6.
| Parameter | Tox-Identify | Natural Qs | SuperGLUE | Time |
| LM-XL | ||||
| TPUs | 8x8 | 8x8 | 8x8 | 8x8 |
| Sequence Length | 128 | 512 | 512 | 128 |
| Batch Size | 128 | 128 | 128 | 128 |
| Dropout | 0.1 | 0.1 | 0.1 | 0.1 |
| Training Steps | 10k | 50k | 100k | See Table 7 |
| Learning Rate | 1e-3 | 1e-3 | 1e-3 | See Table 7 |
| Eval Metric | AUC-ROC | Acc | (By Dataset) | See Table 7 |
| LM-Small (where different) | ||||
| Training Steps | 30k | 50k | 100k | See Table 7 |
C.3 Toxicity Evaluation Details
In this section we describe the evaluation details for the results presented in Section 5.
Toxicity Identification
For toxicity identification evaluation, we finetune separately on each of the following datasets: Social Bias Frames (SBF, Sap et al., 2020), DynaHate (DH, Vidgen et al., 2021), and Toxigen (Hartvigsen et al., 2022). We then evaluate on their respective test sets, using AUC-ROC, which computes the error rates over different classification thresholds. Note that each of these datasets has a slightly different version of toxicity they are evaluating for: biases and offensive stereotypes implied in language for Social Bias Frames, types of hateful speech like animosity, dehumanization, and derogation for DynaHate, and adversarial, subtle and implicit forms of toxicity towards minority groups (e.g., stereotyping, microaggressions), for Toxigen. We average over them to understand a model’s capabilities in identifying toxicity broadly.
Toxic Generation
For toxic generation, we do not do any finetuning. Instead, we evaluate how often each model generates toxic continuations. To measure a model’s propensity to generate sexual, profane, or toxic responses to a mix of benign and malicious inputs, we use prompts from the RealToxicityPrompts (Gehman et al., 2020) dataset, as well as the prompt set developed to explore representational bias in PaLM (Chowdhery et al., 2022).
For each model, we generate 25 responses per prompt, using top- sampling (), with a temperature of . Following Chowdhery et al. (2022), we use the Perspective API to score responses, labeling those with a toxicity score as toxic. We compute the probability one of these generations per prompt is toxic, for two evaluation splits, one with non-toxic inputs, and one with toxic inputs. The resulting evaluation metrics are denoted RPT-T (for Toxic inputs) and RPT-NT (for Non-Toxic inputs).
The Representational Bias benchmark was constructed from the identity terms in (Rae et al., 2021) and is described in more detail in Chowdhery et al. (2022). It uses templates constructed for several identity markers, for which we use the subset related to gender, race, and religion. Following the practice with RealToxicityPrompts, we sample 50 responses per prompt, use top- sampling (), and then classify a response as toxic if Perspective API evaluates its toxicity score . We average the toxicity rates per identity marker and per example to compute the overall RepBias score, where higher indicates more toxic responses were produced on average. We also compute the 95% confidence interval to show where changes in mean are significant.
C.4 Time Evaluation Details
This section describes the evaluation details for the results presented in Section 4. In applied settings, the available training data (either for pretraining or finetuning) may be from different years than the test-time data. To mimic these situations, Luu et al. (2021) construct several datasets segmented by the year they are collected from in order to measure the performance impact of differences in the time of collection of finetuning and evaluation splits. As described in Section 2.3, we select 5 of the datasets that are shown to be quite sensitive to these temporal misalignments, and that cover different tasks and data sources. These tasks are summarization, named entity recognition, classifying political affiliation, classifying academic topic, and classifying the news source.
Due to the unique nature of each of these tasks in the temporal degradation experiments, we simply finetune on each task individually, before evaluating on their respective test sets. For each dataset, we finetune using 4x4 TPUs with a batch size of , a maximum sequence length of , and we validate every 500 training steps. We select the test set score with the highest validation accuracy across training. The best learning rate and the total number of steps required to reach convergence varied by model and model size, and are reported in Table 7. These hyperparameters are chosen based on initial experiments attempting to produce stable learning curves which peak near the values observed in Luu et al. (2021).
| LM-XL | LM-Small | |||||
| Domain | Task | Metric | LR | Steps | LR | Steps |
| News | PubCLS | Acc | 1e-4 | 30k | 1e-3 | 30k |
| NewSum | Rouge-L | 5e-4 | 40k | 1e-3 | 40k | |
| PoliAff | Acc | 1e-4 | 15k | 1e-4 | 15k | |
| TwiERC | Acc | 1e-4 | 30k | 1e-3 | 30k | |
| Science | AIC | Acc | 1e-4 | 30k | 1e-3 | 60k |
We follow Luu et al. (2021)’s exact prescription in calculating Temporal Degradation (TD), as well as their reported Pearson correlation measurements (). Temporal degradation can be interpreted as the average rate of deterioration in performance for a time period, measured in years. Since a temporal deterioration score is calculated per evaluation year, we average over all evaluation years to compute a final TD score for a dataset. Furthermore, each dataset has a different span of available training and evaluation years. To account for this, we follow Luu et al. (2021) in presenting the Pearson correlation coefficient, which presents the strenght of the relationship between time differences and performance deterioration. We also replicate the Wald test with null hypothesis that the slope is zero.
For evaluating the temporal degradation of pretraining, TDp, we modify Luu et al. (2021)’s original formula to measure the different where is now the pretraining year. However, in this setting, performance samples are represented with different finetuning years. To account for this, we only compare the relative performance changes of the pretraining year , against models with the same finetuning and evaluation years . In other words, given , we will only compare its performance to where , but and are fixed to their respective values.
In some edge cases, there is no evaluation year equivalent to a pretraining year, , and so the term does not exist. In this case, we set this term to be the one where and are closest. And, as before, the precise term used will depend on which version of is being calculated for.
C.5 Evaluating Domains with Question Answering Datasets
This section describes the evaluation details for the results presented in Section 6. These experiments involve pretraining models with different subsets of the corpora from the Pile (Gao et al., 2020) and seeing the effects on a variety of downstream evaluation domains, represented by question answering datasets. As such, we are able to map the effects of pretraining domains to evaluation domains.
First, we discuss the construction of the pretraining domains. We partition the Pile’s source datasets into categories representing thematically similar sources of data, as seen in Table 8. We refer to these categories as Domains. These domain partitions are subjective and cannot perfectly separate out text into these categories. For instance, Wikipedia, Books, and Common Crawl data inevitably contain some Academic information, but overall these partitions represent distinct features (see Section 3) that we have attempted to delineate by areas of interest to practitioners and researchers. Prior work has attempted to measure, emphasize, or target (either for inclusion or exclusion) the particular categories of data we’ve used in our partitions, such as more books and structured data (Brown et al., 2020; Chowdhery et al., 2022), code data (Chen et al., 2021), and legal data (Dodge et al., 2021), among others.
| Category | Components | Size | Description |
| CC | Pile-CC | 227 GB | A filtered set of Common Crawl websites, scraped with JusText (Endrédy and Novák, 2013). |
| OpenWeb | OpenWebText2 | 63GB | Scraped OpenWebTextCorpus using upvoted Reddit outgoing links. |
| Wikipedia | Wikipedia (en) | 6 GB | The English scrape of Wikipedia. |
| Books | Books3, BookCorpus2, Gutenberg (PG-19) | 118 GB | The Bibliotik general literature collection, PG-19’s pre-1919 western classics, and BookCorpus’s set of yet unpublished works. |
| PubMed | PubMed Central, PubMed Abstracts | 109 GB | Biomedical articles from 1946 to present |
| Academic | ArXiv, PhilPapers, NIH ExPorter | 60 GB | Preprint academic papers in Math, Computer Science, Physics, and Philosophy. |
| Code & Math | Github, StackExchange, DM Mathematics | 135 GB | Code repositories, documentation, coding questions and answers, and mathematical problems. |
| Legal | FreeLaw, USPTO Backgrounds | 74 GB | Court filings, judicial opinions, and patents |
| Social | Ubuntu IRC, EuroParl, Enron Emails, HackerNews, OpenSubtitles, YoutubeSubtitles | 33 GB | Movie and video subtitles, chat logs, emails, and text from social news websites. |
| Base | All | 825 GB | A wide mix of online text from the web, wikipedia, books, academic articles, code, legal, and social sources. |
The Domains of the Pile were then each separately ablated from pretraining to understand the effect of their absence. To evaluate their absence on the performance of downstream domains, we chose to use the question answering task expressly because there is a wide variety of similarly formatted evaluation datasets available. For these question answering datasets we train only on Natural Questions (Kwiatkowski et al., 2019), a popular QA dataset, to teach the model the general task. For evaluation, as described in Section 2.3, we use UnifiedQA (Khashabi et al., 2020) and MRQA (Fisch et al., 2019)’s collection of datasets to evaluate how each pretrained model performs on a given “domain”, or set of datasets with similar source characteristics. We partition the question answering datasets from UnifiedQA and MRQA into five categories. Datasets with Wikipedia documents represented in their collection are assigned to the Wiki category, datasets with scraped web documents or news are assigned to the Web category, and so on. Datasets may belong to multiple categories, depending on how they were constructed. The question answering evaluation partitions are shown in Table 9. Finally, we evaluate on each question answering dataset and report the average F1 score for each category.
| Category | Datasets | Description |
| Wiki | AmbigQA, DROP, HotpotQA, NaturalQuestions, Quoref, RelationExtraction, ROPES, SearchQA, SQuAD-1, SQuAD-2, TriviaQA | Datasets with Wikipedia text. |
| Web | AmbigQA, CommonsenseQA, DuoRC, NaturalQuestions, NewsQA, SearchQA, TriviaQA | Datasets partially sourced or collected from the web, including user logs and news. |
| Books | NarrativeQA | A dataset sourced from books. |
| BioMed | ARC-Easy, ARC-Hard, BioASQ, TextbookQA | Datasets with high-school or graduate level scientific or medical content. |
| Academic | AI2-Elementary-Science, ARC-Easy, ARC-Hard, RACE, ROPES, TextbookQA | General academic data and exams. |
| Common Sense | CommonsenseQA, PhysicalIQA, SocialIQA | Datasets which test common sense reasoning. |
| Contrast Sets | Contrast-Set-DROP, Contrast-Set-Quoref, Contrast-Set-ROPES | Datasets re-configured as Contrast Sets (Gardner et al., 2020), which are manual perturbations to make examples more challenging. |
Appendix D Impact of Data Curation on Data Composition: Further Analysis
D.1 Feature Definitions
As discussed in Section 3, we calculated a set of features across all datapoints to better understand the distribution shifts for each ablation. The full list of features is as follows:
-
•
Profanity, Toxicity, and Sexually Explicit The Perspective API classifies text as violating or passing each of these categories, as described in Section 2.2.
-
•
Text Quality The same bag-of-words-based linear classifier as used in PaLM (Chowdhery et al., 2022) and GLaM (Du et al., 2022), is used to distinguish between text that looks like Wikipedia and books from other text, as described in Section 2.2.
-
•
Personally Identifiable Information (PII) A basic classifier, similar to Google Cloud NLP (2023a), detects the presence of four categories of personally identifiable information: names, phone numbers, addresses, and emails.
-
•
Readability The Flesch–Kincaid readability test (Kincaid et al., 1975) is applied to each document, assigning documents a grade level based on the number of words per sentence and number of syllables per word.
-
•
Average Word Length Measured in characters.
-
•
Document Length Measured in characters.
-
•
Non-ASCII Characters Measured as a percentage of all characters in the document.
-
•
All-caps Words Measured as a percentage of all words in the document.
-
•
Type-Token Ratio A measure of the lexical diversity, or the ratio of unique tokens to total tokens (Bender, 2013).
-
•
Sentiment The score assigned by a classifier similar to Google Cloud NLP (2023b), evaluating the overall sentiment of the text along a spectrum from positive to negative.
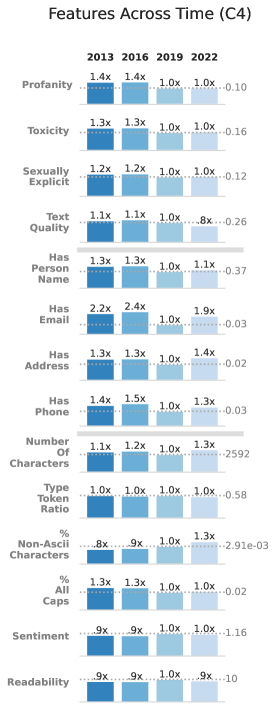
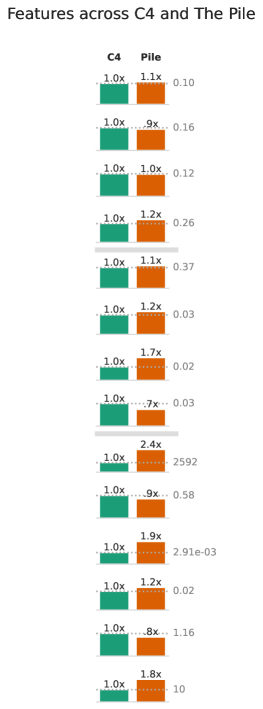
Temporal information in pretraining data
While we collected versions of C4 at four different years, each of these versions may also contain data from prior years. We estimate the temporal information in the pretraining data by counting instances of dates from 2000 to 2025 in each corpus. We do see that there are many mentions of the year of collection, with a quick dropoff of about 5 years earlier (see Figure 11). This is necessarily a limited experiment as an article written in 2016 may still mention something occurring in the future in 2019. However, since website creation dates are not part of the web-scrape, we use this as a proxy to estimate website creation dates.
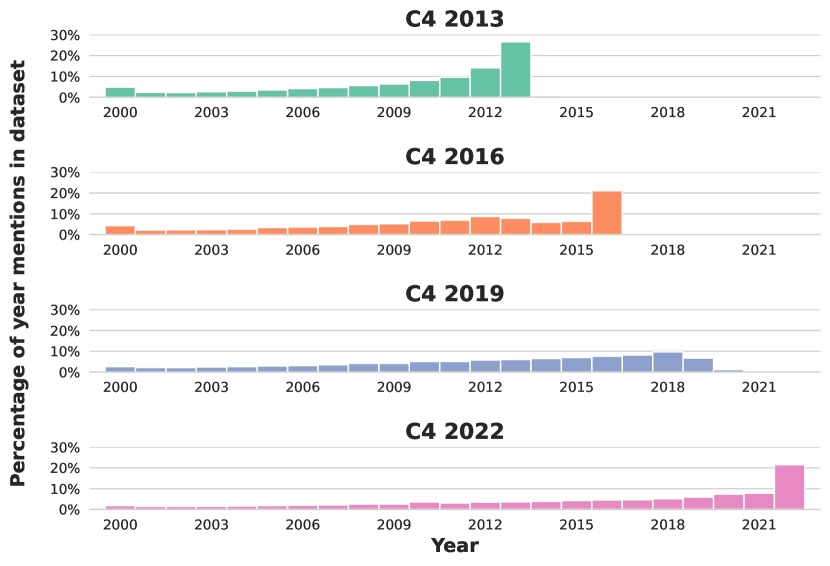
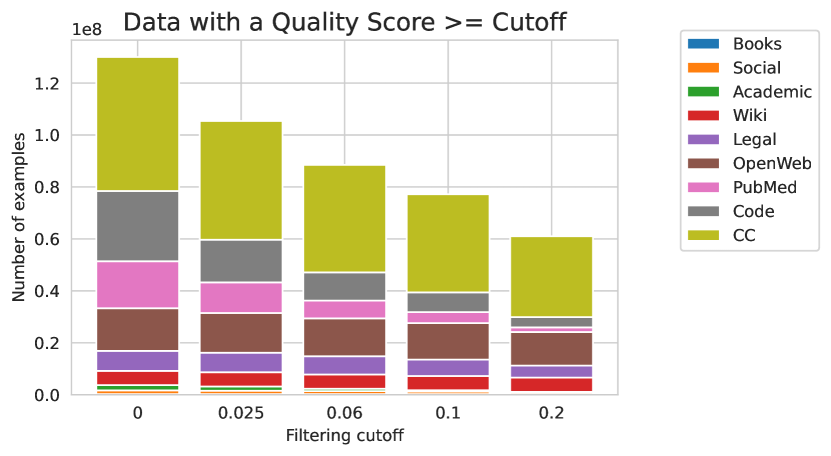
D.2 Breakdown of the Quality Filter on Pile Domains
While the quality filters are typically applied to large, heterogeneous datasets such as C4, we also ran the quality classifier on the Pile to get a better understanding of what types of datapoints actually passed the quality filtering thresholds. The results are shown in Figure 11.
Appendix E Experimental Results
In this section, we lay out the raw results for our toxicity, quality, and temporal degradation evaluations, spanning several evaluation datasets.
E.1 Temporal Degradation Results
Luu et al. (2021) measure the temporal degradation due to finetuning and evaluation misalignment. Before attempting to evaluate misalignment effects specifically for pretraining, we mimic their finetuning experiments. Figure 12 shows our results, which corroborate the findings of (Luu et al., 2021).
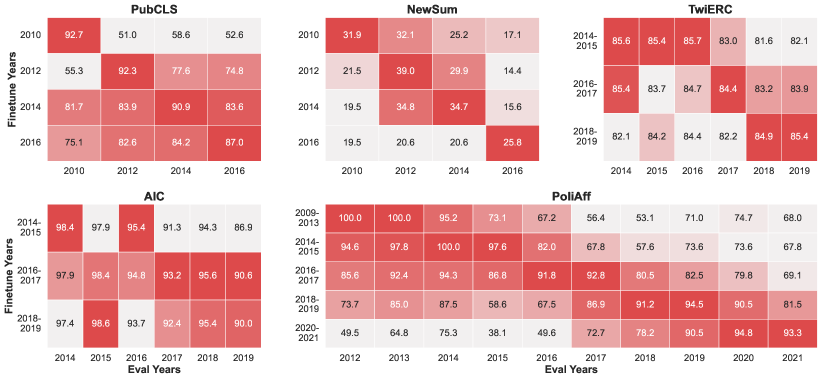
Next we share the original evaluation results from which we computed the temporal degradation values for both finetuning and pretraining. These contain a cross-section of the scores produced using a given pretraining year (-axis), finetuning year(s) (-axis), for an evaluation year (-axis). These results, Tables 12, 10, 13, 12 and 10, are provided for both LM-XL and LM-Small, for comparison.
| Pretrain | Finetune | Eval Time | |||
| Time | Time | 2010 | 2012 | 2014 | 2016 |
| LM-XL | |||||
| 2013 | 2010 | 93.7 | 51.9 | 58.4 | 52.5 |
| 2012 | 60.2 | 94.6 | 78.4 | 75.6 | |
| 2014 | 83.1 | 85.6 | 90.8 | 84.8 | |
| 2016 | 78.7 | 84.7 | 86.2 | 87.6 | |
| 2016 | 2010 | 93.8 | 51.6 | 59.2 | 53.2 |
| 2012 | 55.2 | 93.9 | 79.5 | 77.0 | |
| 2014 | 81.5 | 86.2 | 92.8 | 85.6 | |
| 2016 | 76.9 | 82.9 | 84.3 | 89.6 | |
| 2019 | 2010 | 92.9 | 50.6 | 58.6 | 52.2 |
| 2012 | 53.4 | 90.5 | 75.9 | 72.9 | |
| 2014 | 81.3 | 83.2 | 90.6 | 82.8 | |
| 2016 | 72.3 | 81.1 | 83.4 | 84.8 | |
| 2022 | 2010 | 90.5 | 49.9 | 58.4 | 52.4 |
| 2012 | 52.4 | 90.4 | 76.4 | 73.9 | |
| 2014 | 80.9 | 80.7 | 89.3 | 81.1 | |
| 2016 | 72.3 | 81.7 | 83.0 | 86.1 | |
| LM-Small | |||||
| 2013 | 2010 | 92.9 | 51.9 | 60.2 | 54.1 |
| 2012 | 55.4 | 93.3 | 75.7 | 75.9 | |
| 2014 | 78.2 | 81.9 | 89.9 | 82.5 | |
| 2016 | 70.5 | 80.0 | 80.7 | 87.4 | |
| 2016 | 2010 | 93.0 | 51.8 | 58.8 | 53.2 |
| 2012 | 56.7 | 92.9 | 77.7 | 75.5 | |
| 2014 | 77.3 | 80.2 | 89.6 | 81.4 | |
| 2016 | 69.9 | 80.1 | 82.1 | 87.7 | |
| 2019 | 2010 | 92.9 | 51.3 | 59.2 | 53.0 |
| 2012 | 58.9 | 93.3 | 76.4 | 75.6 | |
| 2014 | 78.4 | 82.1 | 90.2 | 82.7 | |
| 2016 | 69.8 | 81.4 | 80.8 | 87.7 | |
| 2022 | 2010 | 93.3 | 51.6 | 59.1 | 53.2 |
| 2012 | 56.2 | 93.2 | 75.6 | 75.1 | |
| 2014 | 76.4 | 81.0 | 90.1 | 81.7 | |
| 2016 | 67.8 | 80.4 | 80.1 | 86.8 | |
| Pretrain | Finetune | Eval Time | |||
| Time | Time | 2010 | 2012 | 2014 | 2016 |
| LM-XL | |||||
| 2013 | 2010 | 33.3 | 32.8 | 24.6 | 16.8 |
| 2012 | 21.4 | 39.5 | 30.0 | 14.1 | |
| 2014 | 19.9 | 35.0 | 35.1 | 14.9 | |
| 2016 | 19.9 | 21.2 | 21.1 | 25.7 | |
| 2016 | 2010 | 31.9 | 33.3 | 27.1 | 17.8 |
| 2012 | 21.4 | 39.0 | 30.1 | 15.3 | |
| 2014 | 20.2 | 35.0 | 34.5 | 17.2 | |
| 2016 | 19.6 | 20.8 | 20.0 | 26.1 | |
| 2019 | 2010 | 31.8 | 31.6 | 24.8 | 16.7 |
| 2012 | 21.4 | 39.1 | 29.3 | 13.6 | |
| 2014 | 18.6 | 33.8 | 34.0 | 15.7 | |
| 2016 | 19.5 | 20.1 | 21.4 | 26.2 | |
| 2022 | 2010 | 30.7 | 30.8 | 24.4 | 17.2 |
| 2012 | 21.6 | 38.2 | 30.1 | 14.3 | |
| 2014 | 19.5 | 35.5 | 35.0 | 14.7 | |
| 2016 | 19.1 | 20.4 | 19.9 | 25.2 | |
| LM-Small | |||||
| 2013 | 2010 | 22.7 | 25.0 | 20.1 | 13.5 |
| 2012 | 14.0 | 24.5 | 19.5 | 9.9 | |
| 2014 | 13.1 | 21.8 | 21.3 | 9.6 | |
| 2016 | 14.1 | 17.8 | 17.5 | 18.4 | |
| 2016 | 2010 | 22.1 | 25.5 | 20.7 | 14.0 |
| 2012 | 14.0 | 23.8 | 19.7 | 9.6 | |
| 2014 | 13.5 | 22.8 | 21.5 | 10.0 | |
| 2016 | 14.1 | 19.5 | 19.1 | 18.5 | |
| 2019 | 2010 | 23.5 | 26.4 | 21.4 | 14.3 |
| 2012 | 14.5 | 25.4 | 20.6 | 10.1 | |
| 2014 | 14.0 | 23.6 | 22.5 | 10.5 | |
| 2016 | 15.1 | 20.1 | 19.2 | 18.5 | |
| 2022 | 2010 | 23.4 | 26.2 | 21.1 | 14.1 |
| 2012 | 13.9 | 24.4 | 19.4 | 9.5 | |
| 2014 | 13.6 | 23.2 | 21.7 | 9.7 | |
| 2016 | 14.3 | 19.3 | 18.3 | 18.2 | |
| Pretrain | Finetune | Eval Time | |||||||||||
| Time | Time | 2014 | 2015 | 2016 | 2017 | 2018 | 2019 | 2014 | 2015 | 2016 | 2017 | 2018 | 2019 |
| LM-XL | LM-Small | ||||||||||||
| 2013 | 2014-2015 | 98.0 | 97.7 | 94.6 | 88.0 | 93.1 | 83.4 | 86.1 | 85.5 | 85.7 | 83.2 | 80.5 | 81.9 |
| 2016-2017 | 98.2 | 96.6 | 94.4 | 91.6 | 94.0 | 88.2 | 86.1 | 84.0 | 84.7 | 83.9 | 84.0 | 83.7 | |
| 2018-2019 | 97.4 | 97.6 | 94.0 | 91.5 | 95.4 | 87.9 | 82.9 | 85.2 | 84.2 | 81.2 | 84.6 | 85.0 | |
| 2016 | 2014-2015 | 98.4 | 98.3 | 95.1 | 87.5 | 92.5 | 82.7 | 86.2 | 85.7 | 86.2 | 82.7 | 81.5 | 81.7 |
| 2016-2017 | 97.8 | 97.5 | 94.6 | 91.9 | 93.3 | 86.7 | 86.7 | 84.1 | 86.0 | 85.1 | 83.2 | 83.4 | |
| 2018-2019 | 96.7 | 98.0 | 94.1 | 91.3 | 95.7 | 87.6 | 82.7 | 84.6 | 85.5 | 81.5 | 85.5 | 85.0 | |
| 2019 | 2014-2015 | 98.3 | 97.7 | 94.4 | 88.4 | 93.7 | 82.1 | 85.6 | 85.4 | 85.3 | 83.1 | 82.2 | 83.2 |
| 2016-2017 | 97.7 | 97.5 | 93.5 | 89.6 | 94.3 | 88.6 | 85.7 | 83.8 | 83.8 | 85.4 | 83.5 | 84.8 | |
| 2018-2019 | 96.4 | 97.9 | 93.5 | 90.3 | 95.9 | 88.1 | 82.4 | 83.9 | 84.7 | 83.5 | 85.6 | 86.0 | |
| 2022 | 2014-2015 | 98.4 | 98.1 | 95.1 | 88.1 | 94.1 | 84.6 | 84.4 | 84.8 | 85.6 | 83.0 | 82.0 | 81.7 |
| 2016-2017 | 97.9 | 97.2 | 93.8 | 89.4 | 94.6 | 88.3 | 83.2 | 83.1 | 84.5 | 83.1 | 82.2 | 83.6 | |
| 2018-2019 | 96.5 | 97.6 | 93.9 | 90.7 | 96.3 | 87.9 | 80.5 | 83.1 | 83.2 | 82.6 | 84.0 | 85.7 | |
| Pretrain | Finetune | Eval Time | |||||||||||
| Time | Time | 2014 | 2015 | 2016 | 2017 | 2018 | 2019 | 2014 | 2015 | 2016 | 2017 | 2018 | 2019 |
| LM-XL | LM-Small | ||||||||||||
| 2013 | 2014-2015 | 98.7 | 97.5 | 95.6 | 89.0 | 94.0 | 86.0 | 74.5 | 75.3 | 80.4 | 74.0 | 71.9 | 69.5 |
| 2016-2017 | 98.2 | 98.0 | 95.0 | 93.1 | 95.2 | 90.2 | 74.3 | 74.0 | 77.0 | 75.4 | 74.7 | 70.9 | |
| 2018-2019 | 97.7 | 98.5 | 94.4 | 91.8 | 94.0 | 89.9 | 68.1 | 70.2 | 76.2 | 71.2 | 75.4 | 75.0 | |
| 2016 | 2014-2015 | 98.5 | 98.4 | 95.6 | 92.0 | 94.3 | 86.3 | 74.9 | 75.9 | 81.7 | 74.4 | 71.0 | 70.7 |
| 2016-2017 | 98.0 | 98.1 | 95.4 | 94.0 | 95.1 | 89.7 | 74.1 | 72.9 | 78.9 | 74.0 | 74.1 | 70.0 | |
| 2018-2019 | 97.6 | 98.2 | 94.6 | 93.4 | 95.8 | 89.4 | 69.5 | 70.3 | 76.7 | 72.1 | 75.3 | 75.3 | |
| 2019 | 2014-2015 | 98.2 | 98.5 | 95.0 | 93.6 | 94.8 | 88.0 | 74.9 | 75.9 | 79.4 | 76.8 | 70.3 | 69.7 |
| 2016-2017 | 97.9 | 98.8 | 94.0 | 94.0 | 96.4 | 91.4 | 73.9 | 74.5 | 78.4 | 75.0 | 74.9 | 69.7 | |
| 2018-2019 | 97.3 | 98.9 | 92.7 | 92.5 | 96.7 | 92.0 | 67.8 | 69.8 | 77.5 | 73.9 | 75.4 | 76.2 | |
| 2022 | 2014-2015 | 98.2 | 97.4 | 95.3 | 90.6 | 94.2 | 87.3 | 72.8 | 78.6 | 78.3 | 72.6 | 70.7 | 69.5 |
| 2016-2017 | 97.5 | 98.9 | 94.7 | 91.7 | 95.8 | 90.9 | 71.9 | 73.4 | 77.6 | 74.4 | 72.6 | 69.0 | |
| 2018-2019 | 97.0 | 98.8 | 93.1 | 91.9 | 95.1 | 88.7 | 66.8 | 71.6 | 74.6 | 73.9 | 74.7 | 72.7 | |
| Pretrain | Finetune | Eval Time | |||||||||
| Time | Time | 2012 | 2013 | 2014 | 2015 | 2016 | 2017 | 2018 | 2019 | 2020 | 2021 |
| LM-XL | |||||||||||
| 2013 | 2009-2013 | 100.0 | 100.0 | 95.5 | 73.5 | 65.4 | 56.5 | 51.1 | 70.1 | 74.2 | 67.2 |
| 2014-2015 | 95.1 | 97.9 | 100.0 | 97.4 | 81.9 | 65.2 | 56.7 | 72.6 | 73.0 | 66.4 | |
| 2016-2017 | 88.2 | 92.8 | 95.0 | 87.2 | 92.3 | 92.8 | 80.4 | 82.6 | 79.0 | 69.3 | |
| 2018-2019 | 76.8 | 86.0 | 88.4 | 58.9 | 66.2 | 87.0 | 91.3 | 94.5 | 90.2 | 79.9 | |
| 2020-2021 | 53.6 | 68.4 | 77.0 | 39.2 | 48.1 | 72.0 | 77.9 | 90.2 | 94.7 | 91.9 | |
| 2016 | 2009-2013 | 100.0 | 100.0 | 94.9 | 72.9 | 67.8 | 55.8 | 53.7 | 70.3 | 73.7 | 67.5 |
| 2014-2015 | 94.9 | 98.2 | 100.0 | 97.3 | 82.5 | 68.4 | 58.7 | 73.0 | 73.4 | 67.9 | |
| 2016-2017 | 85.0 | 92.6 | 94.6 | 87.8 | 91.8 | 93.1 | 80.7 | 83.0 | 79.9 | 69.2 | |
| 2018-2019 | 73.1 | 85.2 | 87.9 | 58.3 | 68.5 | 88.1 | 91.3 | 94.4 | 90.4 | 81.5 | |
| 2020-2021 | 49.0 | 64.3 | 75.5 | 38.0 | 50.8 | 73.4 | 78.6 | 90.5 | 94.6 | 93.7 | |
| 2019 | 2009-2013 | 100.0 | 100.0 | 95.5 | 73.3 | 68.0 | 57.9 | 55.2 | 71.8 | 74.3 | 68.4 |
| 2014-2015 | 93.8 | 97.4 | 100.0 | 97.7 | 82.5 | 69.7 | 59.1 | 74.6 | 73.9 | 67.9 | |
| 2016-2017 | 85.0 | 92.7 | 94.6 | 87.1 | 92.0 | 93.1 | 82.0 | 83.4 | 80.4 | 68.3 | |
| 2018-2019 | 73.8 | 84.8 | 87.6 | 58.4 | 68.9 | 86.7 | 91.9 | 94.8 | 90.3 | 81.4 | |
| 2020-2021 | 48.4 | 64.2 | 75.6 | 35.7 | 48.6 | 71.7 | 78.6 | 90.7 | 95.0 | 93.7 | |
| 2022 | 2009-2013 | 100.0 | 100.0 | 94.9 | 72.6 | 67.5 | 55.6 | 52.3 | 72.0 | 76.7 | 69.0 |
| 2014-2015 | 94.4 | 97.9 | 100.0 | 97.9 | 81.0 | 68.0 | 56.1 | 74.3 | 73.9 | 68.8 | |
| 2016-2017 | 84.1 | 91.5 | 93.2 | 85.2 | 90.9 | 92.2 | 78.7 | 80.9 | 79.7 | 69.6 | |
| 2018-2019 | 71.1 | 83.9 | 86.0 | 58.9 | 66.6 | 85.8 | 90.3 | 94.5 | 91.1 | 83.0 | |
| 2020-2021 | 47.2 | 62.4 | 73.0 | 39.6 | 50.8 | 73.6 | 77.5 | 90.6 | 94.9 | 93.8 | |
| LM-Small | |||||||||||
| 2013 | 2009-2013 | 89.1 | 87.5 | 80.2 | 48.5 | 42.3 | 38.9 | 42.4 | 57.0 | 62.9 | 56.4 |
| 2014-2015 | 77.8 | 88.5 | 89.5 | 64.7 | 50.4 | 46.3 | 42.0 | 60.3 | 63.3 | 55.7 | |
| 2016-2017 | 40.9 | 43.4 | 58.2 | 36.1 | 40.0 | 54.7 | 47.4 | 61.2 | 61.2 | 54.4 | |
| 2018-2019 | 41.2 | 39.3 | 44.0 | 21.7 | 23.0 | 42.3 | 49.8 | 63.1 | 67.2 | 56.9 | |
| 2020-2021 | 40.8 | 37.9 | 42.6 | 20.5 | 22.5 | 37.2 | 45.4 | 64.6 | 71.9 | 65.6 | |
| 2016 | 2009-2013 | 89.9 | 89.2 | 80.5 | 51.7 | 45.7 | 39.9 | 42.6 | 57.7 | 62.6 | 55.4 |
| 2014-2015 | 78.2 | 87.8 | 87.4 | 63.9 | 49.6 | 45.6 | 41.8 | 59.7 | 61.9 | 54.3 | |
| 2016-2017 | 51.3 | 49.3 | 57.9 | 37.4 | 38.1 | 51.1 | 46.3 | 60.2 | 60.2 | 53.6 | |
| 2018-2019 | 49.8 | 43.1 | 46.5 | 24.4 | 26.8 | 42.6 | 48.3 | 62.9 | 66.3 | 56.2 | |
| 2020-2021 | 51.7 | 43.0 | 42.5 | 22.7 | 24.8 | 36.3 | 40.8 | 61.5 | 70.1 | 63.3 | |
| 2019 | 2009-2013 | 89.2 | 87.0 | 77.9 | 48.5 | 39.8 | 38.7 | 41.7 | 57.8 | 64.6 | 55.6 |
| 2014-2015 | 73.3 | 87.7 | 87.9 | 63.8 | 48.7 | 42.8 | 39.5 | 57.4 | 61.8 | 53.8 | |
| 2016-2017 | 34.8 | 45.7 | 55.6 | 36.6 | 36.2 | 50.1 | 44.5 | 59.8 | 60.4 | 53.1 | |
| 2018-2019 | 32.6 | 36.4 | 43.6 | 21.6 | 21.7 | 41.2 | 48.7 | 62.8 | 66.6 | 55.7 | |
| 2020-2021 | 34.8 | 37.6 | 43.7 | 21.3 | 21.3 | 36.0 | 42.4 | 62.7 | 70.9 | 62.0 | |
| 2022 | 2009-2013 | 90.3 | 88.8 | 79.0 | 47.9 | 41.0 | 37.6 | 40.9 | 57.9 | 64.7 | 56.6 |
| 2014-2015 | 76.9 | 89.7 | 90.3 | 67.2 | 54.6 | 45.2 | 41.0 | 60.5 | 63.4 | 56.5 | |
| 2016-2017 | 41.5 | 48.8 | 56.9 | 37.0 | 38.6 | 53.7 | 47.7 | 62.0 | 60.7 | 53.2 | |
| 2018-2019 | 33.0 | 34.3 | 39.2 | 19.9 | 20.5 | 43.2 | 50.9 | 65.5 | 68.8 | 56.4 | |
| 2020-2021 | 39.5 | 37.0 | 38.5 | 19.4 | 19.6 | 33.6 | 41.8 | 65.2 | 72.8 | 66.1 | |
E.2 Toxicity & Quality Filtering Results
We also provide full results for our experiments with toxicity and quality filters, presented in Section 5. The evaluation results of the models with toxicity filters applied to their data are visualized in Figure 5 (left) and Figure 13, with full details in Table 14. The evaluation results of the models with quality filters applied to their data are visualized in Figure 5 (right) and detailed in Table 15.
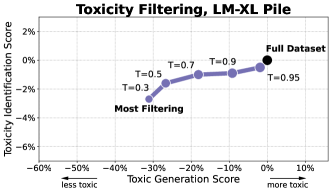
| Filter | % Data | Toxicity Identification () | Toxicity Generation () | |||||||
| SBF | Toxigen | DH R3 | DH R4 | Score | RTP-T | RPT-NT | RepBias | Score | ||
| The Pile | ||||||||||
| Full Dataset | 100.0 | 90.7 | 90.8 | 88.7 | 84.1 | 0.0 | 88.9 | 44.4 | 4.60.7 | 0.0 |
| T=0.95 | 99.1 | 90.6 | 90.9 | 87.8 | 83.5 | -0.5 | 85.6 | 43.9 | 4.60.8 | -1.9 |
| T=0.9 | 97.4 | 90.2 | 90.8 | 86.4 | 83.7 | -0.9 | 80.4 | 41.9 | 4.00.6 | -9.2 |
| T=0.7 | 90.8 | 89.9 | 90.9 | 87.4 | 82.7 | -1.0 | 83.3 | 39.9 | 2.90.5 | -18.1 |
| T=0.5 | 80.7 | 89.4 | 90.4 | 86.0 | 82.8 | -1.6 | 83.3 | 35 | 2.20.4 | -26.7 |
| T=0.3 | 60.1 | 88.4 | 89.9 | 85.3 | 81.3 | -2.7 | 78.5 | 31.4 | 2.20.5 | -31.1 |
| Ngrams | 70.7 | 89.7 | 90.4 | 86.3 | 82.4 | -1.6 | 76.1 | 33.6 | 2.50.6 | -28.0 |
| C4 | ||||||||||
| Inverse T=0.06 | 92.2 | 93.2 | 91.4 | 90.0 | 85.7 | 1.4 | 87.8 | 49.6 | 4.80.8 | 15.6 |
| Full Dataset | 100.0 | 91.2 | 91.1 | 89.0 | 84.2 | 0.0 | 84.6 | 41.8 | 3.90.7 | 0.0 |
| T=0.95 | 97.7 | 90.7 | 91.3 | 87.7 | 83.4 | -0.7 | 84.3 | 41.9 | 3.90.7 | 0.0 |
| T=0.9 | 94.9 | 90.4 | 90.6 | 87.5 | 83.9 | -0.9 | 81.1 | 40.3 | 3.10.6 | -9.0 |
| T=0.7 | 85.8 | 90.5 | 90.5 | 86.1 | 82.8 | -1.6 | 71.3 | 34.8 | 2.40.5 | -23.8 |
| T=0.5 | 75.8 | 89.8 | 90.5 | 86.9 | 81.9 | -1.8 | 65.2 | 30.0 | 1.80.4 | -35.0 |
| T=0.3 | 60.8 | 89.4 | 90.2 | 82.1 | 75.6 | -5.2 | 55.0 | 19.8 | 1.20.3 | -52.1 |
| Ngrams | 78.6 | 89.8 | 90.7 | 87.0 | 81.8 | -1.8 | 74.7 | 31.8 | 2.30.5 | -25.6 |
| Filter | % Data | Toxicity Identification () | Toxicity Generation () | |||||||
| SBF | Toxigen | DH R3 | DH R4 | Score | RTP-T | RPT-NT | RepBias | Score | ||
| C4 | ||||||||||
| Inverse T=0.5 | 73.3 | 91.8 | 90.1 | 86.8 | 82.9 | -0.9 | 86.3 | 44.3 | 4.10.6 | +9.7 |
| Full Dataset | 100.0 | 93.1 | 91.0 | 87.4 | 83.5 | 0.0 | 84.1 | 41.8 | 3.40.6 | 0.0 |
| T=0.975 | 90.6 | 93.1 | 91.3 | 87.8 | 82.7 | -0.1 | 85.4 | 46.0 | 3.80.7 | +7.3 |
| T=0.95 | 83.9 | 93.2 | 91.3 | 89.4 | 85.0 | +1.1 | 86.3 | 44.0 | 4.20.6 | +10.4 |
| T=0.9 | 73.3 | 93.3 | 91.2 | 88.6 | 85.9 | +1.2 | 85.2 | 44.8 | 4.30.7 | +11.1 |
| T=0.7 | 45.6 | 93.3 | 91.4 | 89.9 | 86.6 | +1.8 | 86.5 | 44.7 | 4.00.8 | +9.6 |