\ul
Road Planning for Slums via Deep Reinforcement Learning
Abstract.
Millions of slum dwellers suffer from poor accessibility to urban services due to inadequate road infrastructure within slums, and road planning for slums is critical to the sustainable development of cities. Existing re-blocking or heuristic methods are either time-consuming which cannot generalize to different slums, or yield sub-optimal road plans in terms of accessibility and construction costs. In this paper, we present a deep reinforcement learning based approach to automatically layout roads for slums. We propose a generic graph model to capture the topological structure of a slum, and devise a novel graph neural network to select locations for the planned roads. Through masked policy optimization, our model can generate road plans that connect places in a slum at minimal construction costs. Extensive experiments on real-world slums in different countries verify the effectiveness of our model, which can significantly improve accessibility by 14.3% against existing baseline methods. Further investigations on transferring across different tasks demonstrate that our model can master road planning skills in simple scenarios and adapt them to much more complicated ones, indicating the potential of applying our model in real-world slum upgrading. The code and data are available at https://github.com/tsinghua-fib-lab/road-planning-for-slums.
1. Introduction
With rapid urbanization, currently about 4 billion people around the world live in cities, while 1 billion of them live in over 200,000 slums (UN-Habitat, 2004; Wesolowski and Eagle, 2010). The vast majority of slums suffer from poor accessibility, with internal places not connected to external road systems, and many places not even having addresses (Corburn and Karanja, 2014; Habitat, 2012). Besides being unreachable by motor vehicles, urban services depending on road systems, such as piped services of water and sanitation buried under roads, cannot be delivered to places in slums, which leads to severe problems in public health, urban environment, etc (UN-Habitat, 2004). To tackle these problems, local upgrading of slums has become the primary approach for the sustainable development of cities, rather than moving all the people to cities, due to the massive number of slum dwellers and the socio-economic costs (Weru, 2004; Patel et al., 2012; Habitat, 2012; Andavarapu et al., 2013). Particularly, improving the accessibility by planning roads plays an essential role in slum upgrading (UN-Habitat, 2014; Brelsford et al., 2018).
Different from city-level road planning which grows a road network from the top down and arranges land functionalities accordingly (Farahani et al., 2013), road planning for slums is a bottom-up process in which existing houses determine the possible forms of the road network (UN-Habitat, 2014). Therefore, current city-level approaches cannot handle the micro-level road planning within a slum. Meanwhile, road planning for slums is challenging due to its large solution space. Take a moderate-size slum as an example, the solution space of planning 40 road segments from 80 candidate locations surpasses , which is too large for exhaustive enumeration. In practical slum upgrading, re-blocking (Mitlin and Satterthwaite, 2012; Habitat, 2012) strategy is adopted. It involves negotiations with multiple stakeholders and usually takes a long time for a specific case, thus it can not generalize globally to different slums. Given the enormous number of slums, it is necessary to develop a computational method that can automatically accomplish road plans with superior connectivity at minimal construction costs (Brelsford et al., 2018; UN-Habitat, 2014). Such a model can significantly benefit slum upgrading and eventually help achieve cities without slums (Boonyabancha, 2005; Weru, 2004; Brelsford et al., 2018; Habitat, 2012).
One pioneering work by Brelsford et al. (Brelsford et al., 2018) formulates road planning for slums as a constrained optimization problem, and proposes a heuristic search method to generate road plans. It makes this problem computationally solvable and has been adopted for slums in South Africa and India. Although the heuristic can be applied to different slums, we empirically show that the quality of the obtained plans is not guaranteed, with the accessibility and construction costs far from optimal. Fortunately, with the rapid development of artificial intelligence (AI), it is promising to leverage AI to solve the problem of road planning for slums. First, data-driven parametric models have strong generalization ability, which can adapt to different scenarios (Wang et al., 2022a; Yang et al., 2022; Kawaguchi et al., 2017). In addition, AI models, especially deep reinforcement learning (DRL) algorithms, are good at searching in a large action space to optimize various objectives. The action space can be effectively eliminated by predicting rewards with a value network and sampling actions via a policy network (Konda and Tsitsiklis, 1999; Silver et al., 2016; Haarnoja et al., 2018; Mnih et al., 2016). Particularly, DRL has been deployed in similar planning tasks, such as solving the vehicle routing problem (Nazari et al., 2018; Duan et al., 2020; Zong et al., 2022) and designing circuit chips (Amini et al., 2022; Roy et al., 2021; Mirhoseini et al., 2021).
Inspired by the success of DRL, we propose a DRL-based method to solve this significant real-world problem, road planning for slums. Since slums are diverse in the original geometric space, e.g., existing houses and paths can be in various irregular shapes, we propose a generic graph model to describe a slum, solving the problem from topology instead of geometry. The topology invariance of the graph model makes our method capable of generalizing to different slums of arbitrary forms. We further develop a policy network to select road locations and a value network to predict the performance of road planning based on a novel graph neural network (GNN), overcoming the difficulty of efficient search in the huge action space. We design a topology-aware message passing mechanism for GNN, which first gathers various topological information to edges from nodes, faces, and edges themselves, then broadcasts edge embeddings back to learn effective representations of roads and places in the slum. Furthermore, we develop a masked policy optimization method and connectivity-priority reward functions to optimize various objectives, including accessibility, travel distance, and construction costs. We conduct experiments on real-world slums to verify the effectiveness of our proposed model.
To summarize, the contributions of this paper are as follows,
-
•
We formulate road planning for slums as a sequential decision-making problem, and propose a DRL-based solution.
-
•
We develop a novel GNN and a multi-objective optimization method based on a generic graph model for slums. The proposed model can learn effective representations of places and roads in a slum, which enables superior road planning policy.
-
•
We conduct extensive experiments on slums in different countries, and the results demonstrate the advantage of our proposed method against baseline methods. Our model can generate road plans with both higher accessibility and lower construction costs. Moreover, we also show the transferability of our model from small slums to large slums, indicating the potential of applying our method in real-world slum upgrading.
2. Problem Statement
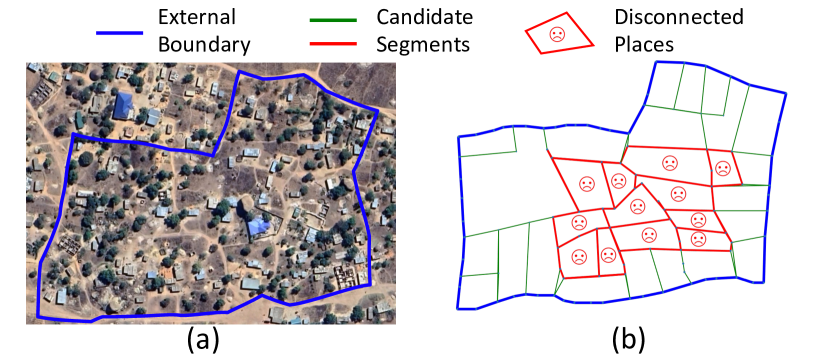
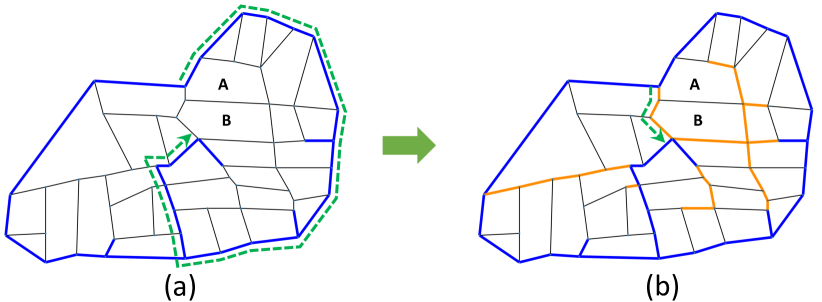
From the perspective of connectivity, a slum can be decomposed into two categories of elements, places and roads (Brelsford et al., 2018). Specifically, places are the houses and internal facilities of the slum, and roads are the street system that connects various external urban services. In most slums, a large fraction of places are disconnected from roads, as shown in Figure 1. Such poor connectivity makes basic urban services inaccessible, e.g., ambulances and fire fighting trucks cannot reach the disconnected places during emergencies; water and sanitation pipes buried under roads cannot be provided. Therefore, it is crucial to upgrade slums by planning more roads. To deliver basic urban services, a minimal road network needs to make all places directly adjacent to roads, which is called universal connectivity (Brelsford et al., 2018). Besides the minimally necessary accesses, more roads are expected to promote internal transportation and reduce travel distance for slum dwellers. To minimize disruption to the slums, new roads are not allowed to pass through the middle of places, thus the candidate locations are restricted to the spacing between places. It is worth noting that each planned road segment also has a corresponding construction cost.
As illustrated in Figure 1(b), to describe the problem in geometric terms, a slum is a two-dimensional planar surface whose exterior boundaries are existing roads. The surface is filled by a tessellation of faces (polygons) , where each polygon is a place in the slum111A planar surface is a graph which can be drawn in the plane without any edges crossing. When a planar graph is drawn with no crossing edges, it divides the plane into a set of regions, called faces.. Polygon boundaries in the interior of the surface represent the spacing between places, which form a collection of segments and serve as the candidate locations for new roads. Road planning is to select a subset of these segments for construction as roads. Therefore, it can be formulated as follows:
Input: A planar surface with exterior boundaries for the slum, a collection of polygons for places in the slum, a collection of segments with their corresponding cost for road construction, and the road planning budget .
Output: A subset of size from for construction as roads.
Objective: (1) Connecting all polygons in to the road system . (2) Minimizing the travel distance between any pair of polygons and over the road network . (3) Minimizing the overall construction cost for the road plan .
3. Method
3.1. Overall Framework
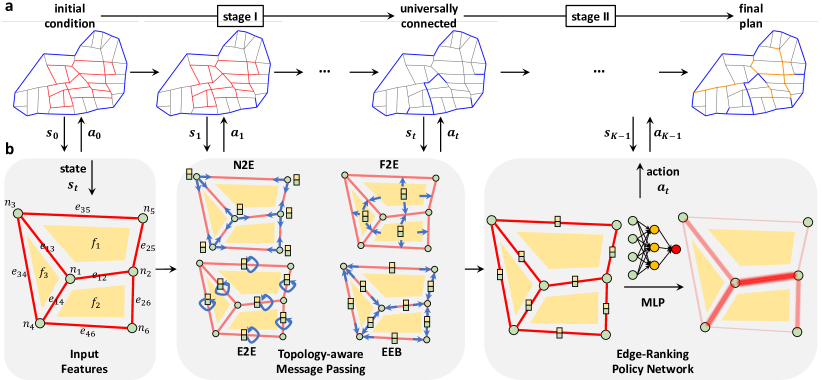
We formulate the road planning for slums as a sequential decision-making problem (see Section A.1 of the appendix for specific definitions of the Markov Decision Process (MDP)). As illustrated in Figure 3a, given the planning budget, which is the total number of road segments, a road plan is accomplished through a sequence of location selection decisions, where at each step of the sequence, one new road segment is planned at a specific location. The goal of the sequential decision-making problem is to improve the connectivity and accessibility of the slum at minimal costs.
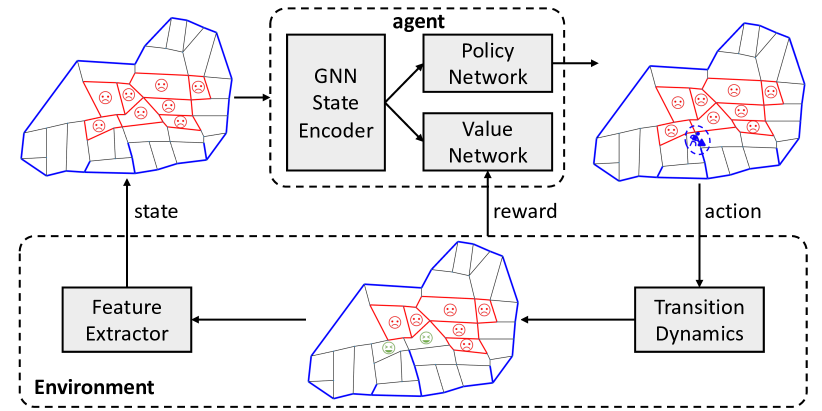
As shown in Figure 2, we develop an agent with a policy network and a value network to take actions and predict returns, respectively, and a shared GNN model as the state encoder. To address the challenge of geometrical diversity, we tackle road planning for slums at the level of topology instead of geometry with a generic graph model (Section 3.2). We then propose a novel GNN model to achieve a decent location selection policy on the graph (Section 3.3). In order to overcome the difficulty of multi-objective optimization in road planning, we further develop a masked policy optimization method with connectivity-priority reward functions (Section 3.4).
3.2. Graph Model
It is challenging to plan roads directly at the geometric level, since slums are very diverse in the original geometric space, e.g., the polygons of places can be in various irregular shapes, and the segments can intersect at almost any angle. In addition, the spatial relationship between different geometries is more important for road planning than the specific shapes of geometries. In contrast to the diverse geometries, there exists certain invariance in the topology of places and roads in cities (Brelsford et al., 2018; Xue et al., 2022), which can support the uniform modeling of different slums. Therefore, we solve the road planning problem from the topological viewpoint instead of the geometric one. Specifically, we construct a planar graph to represent a slum with the contained places and roads, transforming the geometries into elements on the graph, such as nodes, edges, and faces. In this way, we develop a generic graph model which can handle slums of arbitrary geometric forms at different scales with the same logic, solving the challenge of geometrical diversity.
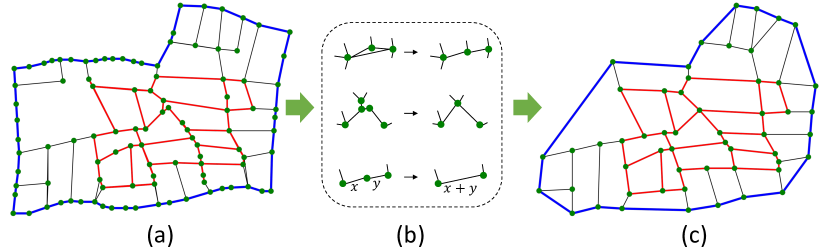
The planar graph is constructed based on the original geometrical descriptions of the slum, including the surface, polygons, and segments. As shown in Figure 4(a), vertices and boundary segments of polygons become nodes and edges on the graph, respectively. Meanwhile, the original polygons naturally become faces surrounded by edges on the planar graph, where each face in the graph represents a place which is usually a house in the slum. Each edge has a road attribute indicating whether it is a road segment or not, and a road segment can be either an existing external road or a planned new road. Moreover, we preprocess the transformed planar graph of the slum to remove redundant information, as illustrated in Figure 4(b-c). First, we merge multiple nodes/edges within a threshold distance as one node/edge, since they are supposed to share the same accessibility in the real space. We then delete nodes with degree 2 and merge the corresponding two edges (construction costs are added) to simplify the graph, which have no influence on road planning. Finally, we normalize the length of edges and align the coordinates, in order to support slums in different scales.
With the above generic graph model, road planning for slums is transformed into a sequential decision-making problem on a dynamic graph. Specifically, states are the information of the current graph, and actions for a road planning policy are edge selections on the graph. The graph also transits accordingly, i.e., the road attribute of the selected edge changes from False to True, which in turn leads to subsequent changes in accessibility and travel distance of the slum. For example, with the newly planned road, some faces (places) are connected to the road system, and the travel distance between several faces is reduced. These changes are also reflected in the reward, which can be directly computed from the graph itself.
3.3. Planning with Graph Neural Networks
With the generic graph model of slums, we now introduce our proposed GNN model which performs road planning on the dynamic graph. As the task is to select edges, a policy needs to decide the probability of choosing different edges at each step. Since the topological information is critical to the effect of road planning, when computing the selection probability of each edge, it is necessary to consider its neighbors and even the whole graph, such as the travel distance of its neighboring faces. Thus, we adopt GNN in our policy because of its strong ability to extract topological information and fuse neighborhood features. As shown in Figure 2, we develop a GNN state encoder, which plays a fundamental role in the road planning agent. The learned representations from GNN are shared between the policy network and the value network, serving as the basis for policy making and return prediction.
Slums exhibit complicated topological structure which can not be well captured by existing GNN models (see discussions in Section A.2 of the appendix). To address the challenge of complex topology in road planning, we propose a novel GNN model which takes nodes, edges and faces into consideration. Figure 3b demonstrates our proposed road planning policy based on GNN. We first design rich features regarding accessibility, travel distance, and construction costs as the input of GNN. We then design a topology-aware message passing mechanism to learn effective representations of topological elements on the graph. Finally, we utilize an edge-ranking policy network to score edges based on the learned edge embeddings, supporting edge selection on the graph.
| Topology | Feature | Dimension | Type |
| Node | Coordinates | 2 | Static |
| Centrality | 4 | Static | |
| On Road | 1 | Dynamic | |
| Road Ratio | 1 | Dynamic | |
| Avg N2N Dis | 1 | Dynamic | |
| Edge | Cost | 1 | Static |
| Road | 1 | Dynamic | |
| Straightness | 1 | Dynamic | |
| Face | Connected | 1 | Dynamic |
| Avg F2F Dis | 1 | Dynamic | |
| F2E Dis | 1 | Dynamic |
Input Features for Topological Elements
Topological features reflect the current state of road planning, serving as the original input for GNN to learn representations of topological elements. As illustrated in Table 1, we incorporate rich information about road planning into the designed features for nodes, edges, and faces. Specifically, there are static features that do not change with the actions of the agent, such as the coordinates and construction cost, while most of the features are dynamic and alter according to actions at each step. These meaningful features describe the current accessibility and travel distance of various places in the slum, which helps to decide which edges to plan as road segments. For example, Connected means whether a face is connected to the road system, thus building a road to an unconnected face can significantly improve the accessibility of the corresponding place to external urban services. Similarly, Straightness is the ratio of road network distance to the Euclidean distance of an edge, which directly indicates the travel distance between two places, and therefore selecting edges with high Straightness can substantially reduce long detours in the slum. These features support effective representation learning and subsequent decision-making, and details of all the designed topological features are introduced in Section A.3 of the appendix.
Topology-aware Message Passing
Since the policy selects edges on the graph to plan roads, we propose an edge-centric GNN to learn representations. We first encode the input topological features to dense embeddings with separate weight matrices as follows,
| (1) |
where , and are input attributes for nodes, edges and faces, , and are learnable embedding matrices.
To address the challenge of complex topological elements, we design a topology-aware message passing mechanism, which first pulls information from diverse topological elements into edges through node-to-edge propagation, face-to-edge propagation, and edge self-propagation, and then pushes aggregated topological information back through edge embedding broadcast, as shown in Figure 3b. The edge embeddings are obtained as follows.
Node2Edge Propagation. For each edge, we take the embeddings of its two connected nodes and propagate them through a linear transformation layer and a non-linear activation layer. The node-to-edge message is computed as follows,
| (2) |
where means concatenation, and is a transformation layer.
Face2Edge Propagation. For each edge, we propagate the embeddings of its adjacent faces, and the face-to-edge message is computed as follows,
| (3) |
where is the number of elements in , the set of adjacent faces for edge , and is a linear transformation layer.
Edge Self-Propagation. Since each edge has its own attributes, we further include the propagation message from the edge itself, which is computed as follows,
| (4) |
where a linear transformation matrix is adopted.
The edge embedding is obtained by integrating the above three propagated messages as follows,
| (5) |
where the three messages are concatenated and transformed with a linear layer .
Edge Embedding Broadcast. We then push the edge embeddings back to nodes to update their embeddings as follows,
| (6) | |||
| (7) |
where for each node, we average the embeddings of its connected edges and add it to the node embedding.
By stacking multiple layers of the above topology-aware message passing, each node or edge can exchange information with neighbors on the graph. We use the obtained embeddings at the last layer, and , as the final representations, where is a hyper-parameter in our model. Through topology-aware message passing, the obtained edge representations can well capture the information about accessibility, travel distance, and construction costs of places and roads from its neighbors, which can effectively support the road planning policy.
Edge-ranking Policy Network
The policy must generate the probability of selecting different edges at each step. Therefore, we develop an edge-ranking policy network to score each edge, based on the obtained edge embeddings from GNN. The score is calculated with a multi-layer perceptron (MLP) as follows,
| (8) |
The action of edge selection is sampled from a probability distribution over different edges according to their corresponding scores estimated by the policy network. Since the obtained edge embeddings contain rich topological information, the road planning action made by the policy network takes into account the accessibility, travel distance, and construction cost of the slum.
3.4. Multi-objective Policy Optimization
Among the three objectives, accessibility, i.e., achieving universal connectivity for all places in the slum, is crucial for residents in the slum to access basic urban services, which is the primary target of road planning. Therefore, it is necessary to prioritize connectivity when optimizing the policy, and further reduce travel distance after universal connectivity is achieved. Meanwhile, for both connectivity and travel distance, it is desirable to optimize them at minimal construction cost. Towards this end, we propose a masked policy optimization method and connectivity-priority reward functions with two stages, as shown in Figure 3a. The optimization method encourages the policy to achieve universal connectivity in stage I, then reduce travel distance in stage II, preferring low construction cost in the whole process.
Stage I
The goal of this stage is to achieve universal connectivity as quickly as possible, making all places in the slum connected to the road system and accessible to urban services. Therefore, each new planned road segment is expected to connect more faces (places) that are not yet connected to any road segments. Meanwhile, since road planning is a gradual extension of the existing road system, a new road segment can not be created as a separate component without touching the already planned roads. We thus design an action mask to indicate feasible actions in this stage for the policy network, and the mask value of each edge is calculated as follows,
| (9) |
where represents all the faces that contain the node . In other words, the action mask requires the selected edge to start from a road node and connect at least one unconnected face The mask value is multiplied over the obtained scores from the policy network in (8), which serves as the selection probability of different edges,
| (10) |
where denotes all the edges on the graph. With the action mask, only those edges that start from existing roads and connect disconnected faces will be considered by the policy.
Besides the action mask, we also design a corresponding reward function in this stage, which is a weighted sum of the number of newly connected faces and the construction cost of the planned road. Given the action at the -th step selecting the edge , the reward is calculated as follows,
| (11) |
where is the construction cost of the road segment specified by , and and are hyper-parameters in our model.
Stage II
As shown in Figure 5(a), after the slum becomes universally connected in stage I, the generated road network looks like a tree with many dead-ends, which is undesirable in reality (Alexander et al., 2019; Barthélemy and Flammini, 2008). Meanwhile, the traffic between some places is still poor and requires long detours, even for some nearby places. Therefore, stage II aims to add more roads to reduce travel distance within the slum, as shown in Figure 5(b). We still require the planned road segments to start from existing road nodes, and the mask value of different edges are calculated as follows,
| (12) |
The action probability is obtained in the same way as (10).
For the reward function given action selecting edge , we compute the pairwise travel distance reduction of the slum, and combine it with construction cost,
| (13) | |||
| (14) |
where denotes the travel distance between two faces, and , over the road network at the -th step.
With the designed action mask and reward functions, the policy is guided to connect unconnected faces and reduce travel distance with low construction costs in the two stages, respectively.
Value Network and Optimization.
Besides the policy network, we follow the actor-critic manner (Konda and Tsitsiklis, 1999) and develop a value network to predict the effect of road planning. Since places and roads are captured with a graph, we compute graph-level representations to summarize the current state of the whole slum. Specifically, we take the average of all the node embeddings and edges embeddings, and also include a one-hot encoding of the stage as follows,
| (15) | |||
| (16) |
where and are the sets of nodes and edges, and is the graph representation. We utilize an MLP model to predict the return,
| (17) |
Finally, we adopt Proximal Policy Optimization (PPO) (Schulman et al., 2017) to update the parameters of the policy network and value network, which encourages the agent to conduct safe and efficient exploration in the action space. Details of model training and inference are introduced in Section A.4 of the appendix.
4. Experiments
4.1. Experiment Settings
Slum Data.
We conduct experiments on slums of different scales from different countries with publicly released data (Brelsford et al., 2018). Table 2 shows the basic information of these slums, where we list the number of places and segments, as well as the size of the solution space. Notably, all the slums suffer from poor accessibility, with over 40% of places disconnected from road systems. More details of the data are introduced in Section B of the appendix.
| Location | Place | Segment | D.R. | Solution |
| Harare, ZWE | 32 | 85 | 37.5% | |
| Cape Town, ZAF | 34 | 91 | 44.1% | |
| Cape Town, ZAF | 59 | 164 | 59.3% | |
| Mumbai, IND | 92 | 208 | 58.7% |
| Method | Harare, ZWE | Cape Town, ZAF (A) | Cape Town, ZAF (B) | Mumbai, IND | ||||||||
| NR | AD | SC | NR | AD | SC | NR | AD | SC | NR | AD | SC | |
| Random | 29 | 1.06 | 6.30 | F | INF | 10.83 | F | INF | 20.76 | F | INF | 26.05 |
| Random (masked) | 10 | 1.00 | 6.13 | 14 | 1.62 | 10.37 | 54 | 2.77 | 19.95 | 42 | 2.50 | 24.92 |
| Greedy-A (masked)∗ | 8∗ | 0.63 | 5.04 | 13∗ | 1.12 | 10.42 | 28∗ | 1.66 | 18.91 | 29∗ | 1.77 | 25.42 |
| Greedy-C∗ | 20 | 0.84 | 3.85∗ | 35 | 1.83 | 7.03∗ | F | INF | 14.10∗ | F | INF | 19.45∗ |
| Greedy-C (masked)∗ | 11 | 0.84 | 3.85∗ | 14 | 1.81 | 7.23∗ | 35 | 2.22 | 14.29∗ | 45 | 2.81 | 19.28∗ |
| GAN (manually adjusted) | - | 0.70 | 5.71 | - | 1.33 | 9.52 | - | 2.05 | 17.72 | - | 1.72 | 24.34 |
| VAE (manually adjusted) | - | 0.71 | 5.14 | - | 1.31 | 10.70 | - | 2.06 | 17.58 | - | 1.68 | 23.84 |
| MST (masked) | 11 | 0.59 | 5.57 | 14 | 1.17 | 8.75 | 35 | 1.54 | 17.16 | 45 | 1.63 | 22.92 |
| GA-G (masked) | 11 | 0.58 | 4.60 | 14 | 1.14 | 8.72 | 34 | 1.99 | 18.95 | 42 | 1.87 | 24.26 |
| GA-S (masked) | - | 0.58 | 5.25 | - | 1.21 | 8.44 | - | 1.89 | 17.72 | - | 1.88 | 23.22 |
| HS-MC (masked) | 13 | 0.62 | 5.31 | 16 | 1.09 | 9.09 | 37 | 1.55 | 16.98 | 43 | 1.61 | 23.00 |
| DRL-MLP (ours, masked) | 11 | 0.52 | 4.38 | 14 | 0.96 | 8.28 | 32 | 1.57 | 15.66 | 31 | 1.52 | 22.93 |
| DRL-GNN (ours, masked) | 9 | 0.50 | 4.60 | 13 | 0.93 | 8.24 | 31 | 1.51 | 15.62 | 29 | 1.51 | 22.82 |
| impr% v.s. HS-MC | -25.0% | -19.4% | -17.5% | -18.8% | -14.7% | 9.8% | -16.2% | -2.6% | -8.0% | -32.6% | -6.21% | -0.8% |
| Build All Roads | - | 0.47 | 11.50 | - | 0.80 | 19.82 | - | 1.21 | 37.55 | - | 1.36 | 49.25 |
| ∗ Although they are equal to or even smaller than the bolded numbers, these methods exhibit imbalanced results with much worse performance on the other two metrics. Thus, the bolded and underlined numbers are assigned to the lowest and the second lowest values, excluding greedy methods. | ||||||||||||
Baselines.
We compare our model with the following methods.
-
•
Random. This method selects road segments randomly.
-
•
Greedy. This method selects new road segments greedily according to accessibility (Greedy-A) and construction cost (Greedy-C).
-
•
Masked. We add our proposed action mask to Random and Greedy baselines. Masked baselines select road segments that are True in the mask randomly (greedily).
-
•
Minimum Spanning Tree (MST). A graph is built where nodes represent slums, edges represent road segments and edge weights represent road construction costs. We use Kruskal’s algorithm (Kruskal, 1956) to grow a minimum spanning tree.
-
•
Genetic Algorithm (GA) (Gad, 2021). This type of method is widely adopted in road planning. We include a generative version (GA-G) that adopts a linear layer as genes and builds one road at one step by multiplying edge features with a linear layer as sampling probability. We also include a swap version (GA-S) that directly uses the selection of road segments as genes and performs swapping between different solutions at each step.
- •
-
•
DRL-MLP. We implement a simplified DRL model by replacing the proposed GNN with an MLP, thus it ignores topological information when planning roads.
It is worthwhile to notice that Greedy-A, MST, GA, HS-MC and our DRL models are all with action masks themselves. We also include two generative models (Fang et al., 2022; Kempinska and Murcio, 2019), based on Generative Adversarial Networks (GAN) (Goodfellow et al., 2020) and Variational Auto-Encoder (VAE) (Kingma and Welling, 2013), though manual adjustments are required for these methods. Details of all the baselines are introduced in Section C.1 of the appendix.
Evaluation Metrics.
As introduced in Section 2, we evaluate a road plan concerning accessibility, travel distance, and construction cost. The specific definitions are as follows,
-
•
For accessibility, it is desired to achieve universal connectivity as early as possible, thus we calculate the number of road segments (NR) consumed to achieve universal connectivity.
-
•
For travel distance, we compute the average distance (AD) between any pair of places in the slum over the road network.
-
•
We define the construction cost of each road segment as its length, and calculate the sum of costs (SC) of all planned roads.
It is worth noting that all the metrics are the lower the better.
Model Implementation.
We implement the proposed model with PyTorch (Paszke et al., 2019), and all the codes and data to reproduce the results in this paper are released at https://github.com/tsinghua-fib-lab/road-planning-for-slums. We implement the greedy and GA baselines and integrate them into our framework. For the heuristic search baseline, we use the codes released in (Brelsford et al., 2018). We carefully tune the hyper-parameters of our model, including learning rate, regu larization, etc. For each road planning task, we collect millions of samples and train our model on a single server with an Nvidia GeForce 2080Ti GPU, which usually takes about 2 hours. A full list of hyper-parameters is provided in Section C.2 of the appendix.
4.2. Performance Comparison
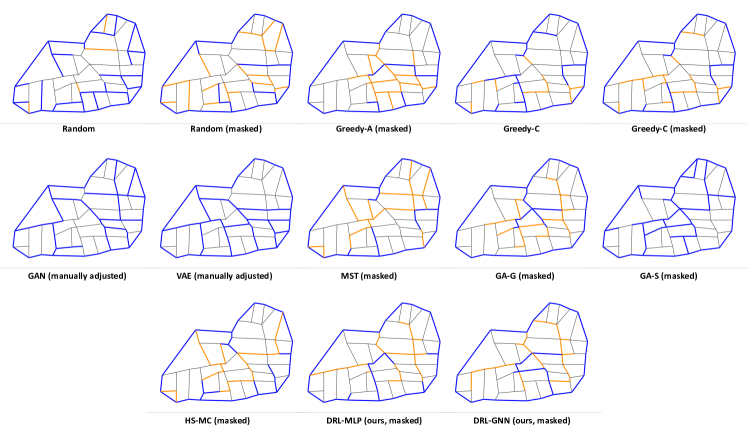
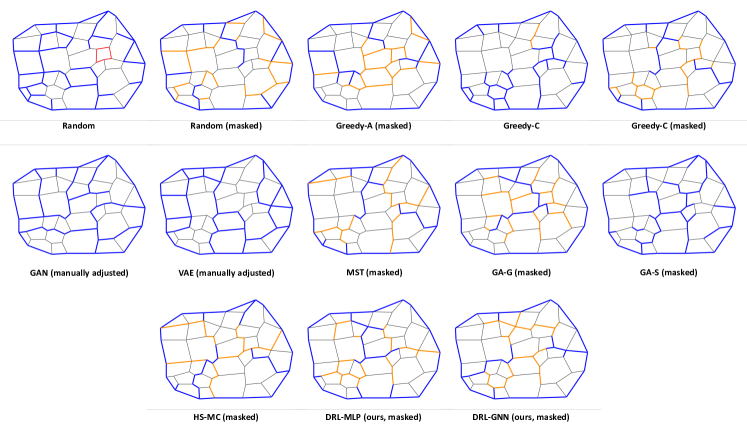
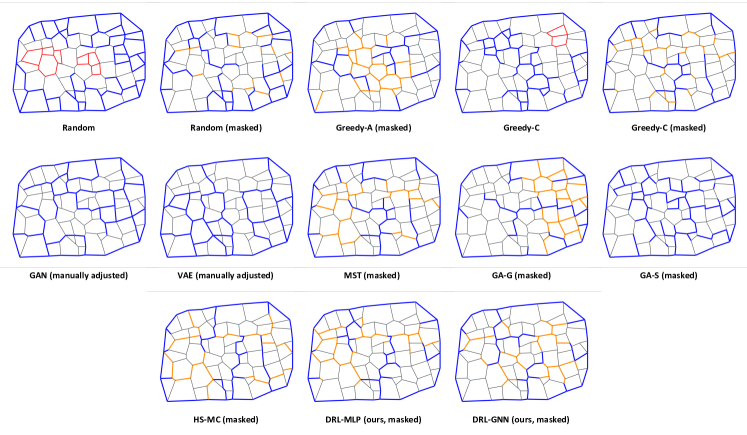
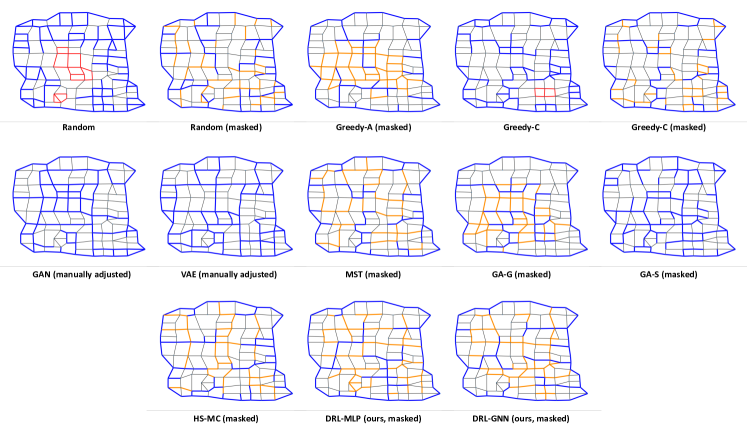
We set the planning budget (episode length) as 50% of the number of candidate segments. Results of our model and baselines are illustrated in Table 3, where we also include a reference model (Build All Roads) that sets 100% of candidate segments as roads. NR is not applicable to GA-S since it is not a generative method. From the results, we have the following observations,
-
•
Random and greedy algorithms are ineffective for road planning. Randomly choosing locations fails to achieve universal connectivity in all slums except for the smallest one. Greedy-C achieves the lowest construction cost for all four slums, while it fails to achieve universal connectivity in the two largest slums. Adding action masks can help these methods to achieve universal connectivity, however, the travel distance is still the worst. Similarly, Greedy-A is the earliest to achieve universal connectivity, however, the construction cost is the worst, and the travel distance is also much worse than other methods. Thus we do not consider these trivial methods in the following comparisons.
-
•
Generative models are not suitable to road planning for slums. As stated in Section C.1 of the appendix, to obtain road plans for slums with the two generative models (Fang et al., 2022; Kempinska and Murcio, 2019), much of the work has to be conducted manually by human labor, which betrayed our original intention to automate the process of road planning. Not surprisingly, since they are not suitable to the sequential decision-making task, the performance of GAN and VAE falls far behind our proposed method and the HS-MC baseline. More discussions can be found at Section D of the appendix.
-
•
DRL-based methods have significant advantages over other approaches. DRL-MLP and DRL-GNN outperform GA-G, GA-S, and HS-MC on all metrics. The two DRL-based methods achieve much better road planning performance, with average reductions of about 23.2%, 10.7%, and 9.0% in NR, AD, and SC over the four slums. Baselines like GA and HS-MC fail to explore the solution space efficiently, making it difficult to obtain high-quality road plans. The performance gap verifies the strong ability of DRL to optimize multiple objectives in a large action space.
-
•
Our proposed model achieves the best performance. Regarding accessibility, our model is the fastest to achieve universal connectivity for all slums, which is critical under tight planning budgets. Compared with HS-MC, our model connects all places with 3 fewer road segments (NR) for slums in Harare and Cape Town, and 14 fewer road segments in the largest slum in Mumbai, IND. Meanwhile, with respect to travel distance and construction cost, our model consistently outperforms baseline methods. Specifically, our method reduces AD by 19.4% and 14.7% for slums in Harare and Cape Town, respectively, and reduces SC by 11.1% for slums in Cape Town. In particular, the road plan obtained by our method achieves a travel distance very close to that of Build All Roads at a much lower cost, making it more economical in real slum upgrading. Our model can capture topological information through the generic graph model and the novel GNN, and perform efficient searches in the large action space via masked policy optimization. These special designs enable our model to achieve superior performance in road planning for slums.
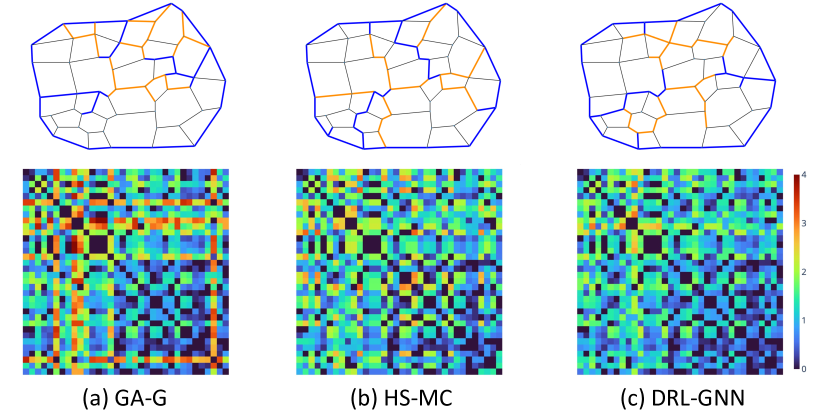
Figure 6 demonstrates the generated road plans of different models for the slum in Cape Town, ZAF, and their corresponding travel distance matrices. Although universal connectivity is achieved in all plans, the travel distance varies significantly across different methods. In the road plans of baselines, slum dwellers in some places have to travel a long detour to reach each other, which corresponds to several hot regions in the travel distance matrices as shown in Figure 6(a-b). In contrast, our method utilizes the progress in travel distance as the reward and optimizes it in stage II. Specifically, the proposed GNN model can detect places that suffer from long detours through topology-aware message passing on the graph, and add targeted roads to reduce travel distance effectively. Thus there are much fewer hot regions as shown in Figure 6(c). In addition, as demonstrated in Figure 6, our model is able to grow a road network in a less costly way, with the total length of planned roads much shorter than baselines by about 10%. We provide the complete road plans of all methods for all slums in Section E.1 of the appendix.
Our proposed model can reach convergence in less than 100 iterations, which usually takes only about 2 hours. We provide a visual plot of the convergence of our model in Section E.2 of the appendix. One alternative way to accomplish road planning for slums is to set the total construction cost as the planning budget, instead of the number of road segments, and we provide the corresponding results in Section E.3 of the appendix.
4.3. Ablation Study
Graph Modeling
The spatial topological relationships between places and roads in a slum are crucial for road planning. The proposed graph modeling and GNN can capture such topological relationships, enabling decent location selection policies. Table 3 illustrates the performance of our method with and without graph modeling, i.e., DRL-GNN and DRL-MLP. Specifically, it is easier for our graph model to perceive the currently disconnected regions, and layout corresponding road segments to connect them, leading to earlier universal connectivity in all 4 slums. The graph model can also capture the neighborhood information on travel distance and construction costs, leading to a more economical policy to reduce travel distance. As shown in Table 3, DRL-GNN outperforms DRL-MLP in AD and SC for 4 and 3 slums, respectively. Furthermore, the graph modeling can also improve sample efficiency and makes our model converge faster (see Section E.4 of the appendix).
Topological Features
We investigate the role that the designed features for nodes, edges, and faces play in our model. We first obtain a well-trained model, then remove different features, i.e., setting the feature values as 0, and evaluate its performance. Figure 7 demonstrate the performance of removing three features (F1: Centrality, F2: Road, F3: Straightness) compared with using all features. We can observe that feature Straightness brings the largest performance deterioration in travel distance, with 22.0% and 49.0% increases in Harare and Cape Town, respectively. This result is reasonable since Straightness is the ratio of road network distance to the Euclidean distance, which directly indicates long detours in the slum, thus this feature is critical to travel distance. In addition, feature Road also plays an important role, and removing it leads to a 20.2% and 13.0% increase in construction cost for the two slums, respectively. Results of removing other features can be found in Section E.5 of the appendix. Our designed rich features describe the topological information of the slum, which is critical when selecting locations for new road segments.
Topology-aware Message Passing
In the proposed GNN model, we design various propagation messages to edges from different sources, including nodes, faces, and edges themselves. In this section, we study the effect of different propagation messages. Specifically, we design multiple variants of our GNN model, each of which blocks one single propagation message. We train these models and evaluate their road planning performance, as shown in Figure 8. We can find that deleting any propagation flow leads to the loss of topological information, and brings about a deterioration in performance. Specifically, deleting Node2Edge propagation makes travel distance worse by 10.2% in Harare and construction cost worse by 8.1% in Cape Town; deleting Edge Self-propagation increases construction cost by 14.8% in Cape Town; and deleting Face2Edge propagation leads to a 3.0% increase in travel distance in Harare. The above results confirm the necessity of topology-aware message passing, which gathers diverse topological information to edges and makes our edge-centric GNN learn meaningful edge representations, enabling decent edge selection policies.
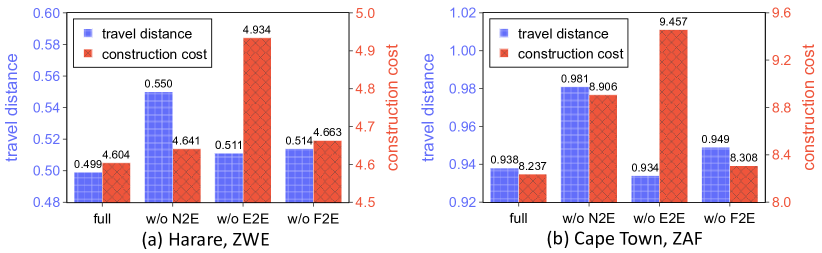
Masked Policy Optimization
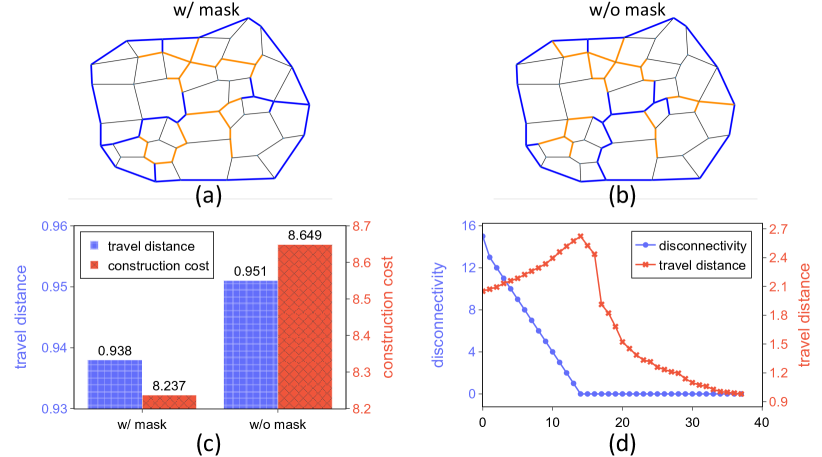
We design a two-stage masked policy optimization method, to make our model first achieve universal connectivity and then reduce travel distance, at minimal costs in both stages. In this section, we study the effect of the action mask, and Figure 9(a-c) shows the generated road plans and the corresponding performance of our model with and without the action mask. We can observe that adding the action mask can guide our model to discover disconnected places, and achieves lower travel distance (-1.4%) with lower cost (-4.8%) than without the mask. Particularly, as in Table 3, even for the simple random model, adding the action mask can make it achieve universal connectivity faster than HS-MC for 3 slums. Meanwhile, we visualize the road planning metrics at each step in Figure 9(d). We can see that in stage I, the number of remaining disconnected places decreases rapidly. The travel distance increases slightly since newly connected places tend to have long travel distances to other places. In stage II, the model adds road segments to places that suffer from long detours, significantly reducing the travel distance. Furthermore, the masked policy optimization design avoids actions of low quality, which helps our model converge faster (see Section E.6 of the appendix). The results verify the effectiveness of the action mask and two-stage design in optimizing multiple objectives of road planning for slums.
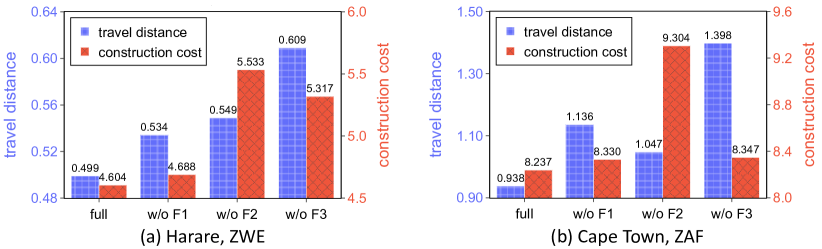
4.4. Analysis on Transferability
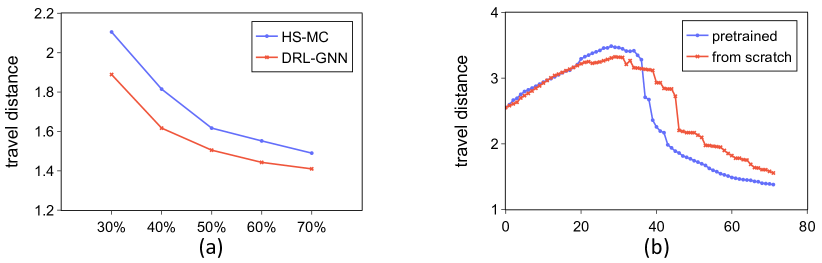
It is beneficial for a road planning model to generalize across different scenarios. On the one hand, the planning budgets may vary. We set the budget as 50% of candidate segments for training, and directly evaluate our model under different budgets. Figure 10(a) shows that DRL-GNN outperforms HS-MC under all different budgets, with more significant improvements under tight budgets, e.g., 10.3% travel distance reduction under 30% budgets, two times larger than 70% budgets. On the other hand, we study the transferability across different slums. We obtain a pretrained model on a small slum (Harare, ZWE), and finetune it on a large slum (Cape Town, ZAF). We compare the pretrained model with a model that is trained from scratch. Figure 10(b) demonstrates the travel distance at each step for the large slum, where the pretrained model is consistently better than the model trained from scratch in stage II. The above results verify that our model can learn universal road planning skills and successfully transfer them to scenarios of different budgets or different slums, which is crucial for practical slum upgrading.
5. Related Work
Deep Reinforcement Learning for Planning. With the development of deep learning (LeCun et al., 2015), utilizing deep neural networks (DNN) to achieve function approximation in reinforcement learning becomes the new state-of-the-art. Since the proposal of DQN (Mnih et al., 2013, 2015), DRL methods have achieved great success in complex planning tasks, such as the game of Go (Silver et al., 2016, 2017), chemical synthesis (Segler et al., 2018), chip design (Amini et al., 2022; Roy et al., 2021; Mirhoseini et al., 2021), VRP (Nazari et al., 2018; Duan et al., 2020; Zong et al., 2022), and solving mathematical problems (Fawzi et al., 2022). Planning tasks usually have a huge action space, which can be effectively reduced by predicting rewards with a value network and sampling actions via a policy network (Konda and Tsitsiklis, 1999; Silver et al., 2016; Haarnoja et al., 2018; Mnih et al., 2016). Recently, several works (Fan et al., 2020; Meirom et al., 2021; Wang et al., 2018; Lei et al., 2020) adopt GNN as policy and value networks to solve planning tasks on the graph (Fan et al., 2020; Meirom et al., 2021). For example, Fan et al. (Fan et al., 2020) combine GNN with DQN to detect key nodes in complex networks. Meirom et al. (Meirom et al., 2021) utilize GNN as a state encoder for DRL to solve the tasks of epidemic control and targeted marketing. In addition, GNN is leveraged to learn representations for road networks (Jepsen et al., 2019; Wu et al., 2020; Xue et al., 2022; Wang et al., 2020b; Hu et al., 2019; Mao et al., 2022; Derrow-Pinion et al., 2021), and support downstream tasks like homogeneity analysis (Xue et al., 2022) and traffic prediction (Wu et al., 2020; Derrow-Pinion et al., 2021). However, they only study tasks on existing built roads, which is quite different from the task of planning new roads. Meanwhile, there have been some works utilizing DRL or generative models to accomplish city configuration and urban planning (Wang et al., 2022b, 2021b, 2023, 2020a, 2021a; Fang et al., 2022; Kempinska and Murcio, 2019; Geng et al., 2021), but they ignore the slums in cities which is an important issue regarding billions of population. In this work, we make the first attempt to plan new roads for slum upgrading with DRL and GNN.
Road Planning for Slums. Given the large number of slum dwellers and the economic costs, upgrading slums in situ has become the primary strategy of urbanization, rather than relocating the population to cities. One primary goal of slum upgrading is to provide service access to every place in a slum by building more roads. The re-blocking method (Mitlin and Satterthwaite, 2012; Habitat, 2012; Weru, 2004; Boonyabancha, 2005; Patel et al., 2012; Mitlin and Satterthwaite, 2012) is widely adopted in practice, which reconfigures the space and adds road segments, to make each place connected to the road system. With more streets constructed, re-blocking has been shown to significantly reduce the cost of service provision for slums (Abiko et al., 2007; Flood, 2004). However, it is not a computational method and requires negotiation with multiple stakeholders, so it is slow and case-by-case. A recent paper by Brelsford et al (Brelsford et al., 2018) formulated road planning for slums as a constrained optimization problem, making it computationally solvable. Specifically, they proposed a heuristic search approach, adding one path at a time to the least connected place, with the help of Monte Carlo sampling. Considering the huge solution space of this problem, it is difficult for heuristic methods to achieve optimal road planning performance. Different from heuristic search, in this work, we leverage the powerful DRL algorithm to search for optimal road plans in a data-driven way, improving accessibility at minimal costs.
6. Conclusion
In this paper, we investigate the problem of road planning for slums, a critical but little-studied issue in sustainable urban development. We formulate it as a sequential decision-making problem with a generic graph model, and propose a novel graph neural network to select locations for new road segments. The model is optimized to improve accessibility and reduce the travel distance of slum dwellers at minimal construction costs. We demonstrate that planning roads for slums through deep reinforcement learning is viable, effective, and can be migrated to real-world, large-scale scenarios. As for future work, we plan to develop a pre-trained model on a large amount of slum data to enable fast inference of road plans, which is beneficial for practical deployment.
Acknowledgements.
We sincerely thank all reviewers for their constructive feedback. We are grateful to Yuming Lin for valuable discussions. This work is supported in part by National Key Research and Development Program of China under grant 2022ZD0116402, National Natural Science Foundation of China under grant U22B2057, U21B2036, 62171260. This work is also supported in part by Beijing National Research Center for Information Science and Technology (BNRist).References
- (1)
- Abiko et al. (2007) Alex Abiko, Luiz Reynaldo de Azevedo Cardoso, Ricardo Rinaldelli, and Heitor Cesar Riogi Haga. 2007. Basic costs of slum upgrading in Brazil. Global Urban Development Magazine 3, 1 (2007), 121–131.
- Alexander et al. (2019) Christopher Alexander et al. 2019. A city is not a tree.
- Amini et al. (2022) Mohammad Amini, Zhanguang Zhang, Surya Penmetsa, Yingxue Zhang, Jianye Hao, and Wulong Liu. 2022. Generalizable Floorplanner through Corner Block List Representation and Hypergraph Embedding. In Proceedings of the 28th ACM SIGKDD Conference on Knowledge Discovery and Data Mining. 2692–2702.
- Andavarapu et al. (2013) Deepika Andavarapu, David J Edelman, et al. 2013. Evolution of slum redevelopment policy. Current urban studies 1, 04 (2013), 185.
- Barthélemy and Flammini (2008) Marc Barthélemy and Alessandro Flammini. 2008. Modeling urban street patterns. Physical review letters 100, 13 (2008), 138702.
- Binder et al. (1993) Kurt Binder, Dieter Heermann, Lyle Roelofs, A John Mallinckrodt, and Susan McKay. 1993. Monte Carlo simulation in statistical physics. Computers in Physics 7, 2 (1993), 156–157.
- Bonacich (1987) Phillip Bonacich. 1987. Power and centrality: A family of measures. American journal of sociology 92, 5 (1987), 1170–1182.
- Boonyabancha (2005) Somsook Boonyabancha. 2005. Baan Mankong: Going to scale with “slum” and squatter upgrading in Thailand. Environment and Urbanization 17, 1 (2005), 21–46.
- Brelsford et al. (2018) Christa Brelsford, Taylor Martin, Joe Hand, and Luís MA Bettencourt. 2018. Toward cities without slums: Topology and the spatial evolution of neighborhoods. Science advances 4, 8 (2018), eaar4644.
- Chen et al. (2020) Deli Chen, Yankai Lin, Wei Li, Peng Li, Jie Zhou, and Xu Sun. 2020. Measuring and relieving the over-smoothing problem for graph neural networks from the topological view. In Proceedings of the AAAI conference on artificial intelligence, Vol. 34. 3438–3445.
- Corburn and Karanja (2014) Jason Corburn and Irene Karanja. 2014. Informal settlements and a relational view of health in Nairobi, Kenya: sanitation, gender and dignity. Health promotion international 31, 2 (2014), 258–269.
- Derrow-Pinion et al. (2021) Austin Derrow-Pinion, Jennifer She, David Wong, Oliver Lange, Todd Hester, Luis Perez, Marc Nunkesser, Seongjae Lee, Xueying Guo, Brett Wiltshire, et al. 2021. Eta prediction with graph neural networks in google maps. In Proceedings of the 30th ACM International Conference on Information & Knowledge Management. 3767–3776.
- Duan et al. (2020) Lu Duan, Yang Zhan, Haoyuan Hu, Yu Gong, Jiangwen Wei, Xiaodong Zhang, and Yinghui Xu. 2020. Efficiently solving the practical vehicle routing problem: A novel joint learning approach. In Proceedings of the 26th ACM SIGKDD international conference on knowledge discovery & data mining. 3054–3063.
- Fan et al. (2020) Changjun Fan, Li Zeng, Yizhou Sun, and Yang-Yu Liu. 2020. Finding key players in complex networks through deep reinforcement learning. Nature machine intelligence 2, 6 (2020), 317–324.
- Fang et al. (2022) Zhou Fang, Ying Jin, and Tianren Yang. 2022. Incorporating planning intelligence into deep learning: A planning support tool for street network design. Journal of Urban Technology 29, 2 (2022), 99–114.
- Farahani et al. (2013) Reza Zanjirani Farahani, Elnaz Miandoabchi, Wai Yuen Szeto, and Hannaneh Rashidi. 2013. A review of urban transportation network design problems. European journal of operational research 229, 2 (2013), 281–302.
- Fawzi et al. (2022) Alhussein Fawzi, Matej Balog, Aja Huang, Thomas Hubert, Bernardino Romera-Paredes, Mohammadamin Barekatain, Alexander Novikov, Francisco J R Ruiz, Julian Schrittwieser, Grzegorz Swirszcz, et al. 2022. Discovering faster matrix multiplication algorithms with reinforcement learning. Nature 610, 7930 (2022), 47–53.
- Flood (2004) Joe Flood. 2004. Cost Estimate for Millennium Development Goal 7, Target 11 on Slums, background report for UN Millennium Project Task Force on Improving the Lives of Slum Dwellers and UN-HABITAT. Urban Resources, Elsternwick, Australia (2004).
- Freeman (1977) Linton C Freeman. 1977. A set of measures of centrality based on betweenness. Sociometry (1977), 35–41.
- Freeman et al. (2002) Linton C Freeman et al. 2002. Centrality in social networks: Conceptual clarification. Social network: critical concepts in sociology. Londres: Routledge 1 (2002), 238–263.
- Gad (2021) Ahmed Fawzy Gad. 2021. PyGAD: An Intuitive Genetic Algorithm Python Library. arXiv:2106.06158 [cs.NE]
- Geng et al. (2021) Yuanzhe Geng, Erwu Liu, Rui Wang, Yiming Liu, Weixiong Rao, Shaojun Feng, Zhao Dong, Zhiren Fu, and Yanfen Chen. 2021. Deep reinforcement learning based dynamic route planning for minimizing travel time. In 2021 IEEE International Conference on Communications Workshops (ICC Workshops). IEEE, 1–6.
- Goodfellow et al. (2020) Ian Goodfellow, Jean Pouget-Abadie, Mehdi Mirza, Bing Xu, David Warde-Farley, Sherjil Ozair, Aaron Courville, and Yoshua Bengio. 2020. Generative adversarial networks. Commun. ACM 63, 11 (2020), 139–144.
- Haarnoja et al. (2018) Tuomas Haarnoja, Aurick Zhou, Pieter Abbeel, and Sergey Levine. 2018. Soft actor-critic: Off-policy maximum entropy deep reinforcement learning with a stochastic actor. In International conference on machine learning. PMLR, 1861–1870.
- Habitat (2012) UN Habitat. 2012. Streets as tools for urban transformation in slums: a street-led approach to citywide slum upgrading. 17 (2012), 2016.
- Hamilton et al. (2017) Will Hamilton, Zhitao Ying, and Jure Leskovec. 2017. Inductive representation learning on large graphs. Advances in neural information processing systems 30 (2017).
- He et al. (2020) Xiangnan He, Kuan Deng, Xiang Wang, Yan Li, Yongdong Zhang, and Meng Wang. 2020. Lightgcn: Simplifying and powering graph convolution network for recommendation. In Proceedings of the 43rd International ACM SIGIR conference on research and development in Information Retrieval. 639–648.
- Hu et al. (2019) Jilin Hu, Chenjuan Guo, Bin Yang, and Christian S Jensen. 2019. Stochastic weight completion for road networks using graph convolutional networks. In 2019 IEEE 35th international conference on data engineering (ICDE). IEEE, 1274–1285.
- Jepsen et al. (2019) Tobias Skovgaard Jepsen, Christian S Jensen, and Thomas Dyhre Nielsen. 2019. Graph convolutional networks for road networks. In Proceedings of the 27th ACM SIGSPATIAL international conference on advances in geographic information systems. 460–463.
- Kawaguchi et al. (2017) Kenji Kawaguchi, Leslie Pack Kaelbling, and Yoshua Bengio. 2017. Generalization in deep learning. arXiv preprint arXiv:1710.05468 (2017).
- Kempinska and Murcio (2019) Kira Kempinska and Roberto Murcio. 2019. Modelling urban networks using Variational Autoencoders. Applied Network Science 4, 1 (2019), 1–11.
- Kingma and Welling (2013) Diederik P Kingma and Max Welling. 2013. Auto-encoding variational bayes. arXiv preprint arXiv:1312.6114 (2013).
- Kipf and Welling (2016) Thomas N Kipf and Max Welling. 2016. Semi-supervised classification with graph convolutional networks. arXiv preprint arXiv:1609.02907 (2016).
- Konda and Tsitsiklis (1999) Vijay Konda and John Tsitsiklis. 1999. Actor-critic algorithms. Advances in neural information processing systems 12 (1999).
- Kruskal (1956) Joseph B Kruskal. 1956. On the shortest spanning subtree of a graph and the traveling salesman problem. Proceedings of the American Mathematical society 7, 1 (1956), 48–50.
- LeCun et al. (2015) Yann LeCun, Yoshua Bengio, and Geoffrey Hinton. 2015. Deep learning. nature 521, 7553 (2015), 436–444.
- Lei et al. (2020) Yu Lei, Hongbin Pei, Hanqi Yan, and Wenjie Li. 2020. Reinforcement learning based recommendation with graph convolutional q-network. In Proceedings of the 43rd international ACM SIGIR conference on research and development in information retrieval. 1757–1760.
- Mao et al. (2022) Zhenyu Mao, Ziyue Li, Dedong Li, Lei Bai, and Rui Zhao. 2022. Jointly Contrastive Representation Learning on Road Network and Trajectory. In Proceedings of the 31st ACM International Conference on Information & Knowledge Management. 1501–1510.
- Meirom et al. (2021) Eli Meirom, Haggai Maron, Shie Mannor, and Gal Chechik. 2021. Controlling graph dynamics with reinforcement learning and graph neural networks. In International Conference on Machine Learning. PMLR, 7565–7577.
- Mirhoseini et al. (2021) Azalia Mirhoseini, Anna Goldie, Mustafa Yazgan, Joe Wenjie Jiang, Ebrahim Songhori, Shen Wang, Young-Joon Lee, Eric Johnson, Omkar Pathak, Azade Nazi, et al. 2021. A graph placement methodology for fast chip design. Nature 594, 7862 (2021), 207–212.
- Mitlin and Satterthwaite (2012) Diana Mitlin and David Satterthwaite. 2012. Urban poverty in the global south: scale and nature. Routledge.
- Mnih et al. (2016) Volodymyr Mnih, Adria Puigdomenech Badia, Mehdi Mirza, Alex Graves, Timothy Lillicrap, Tim Harley, David Silver, and Koray Kavukcuoglu. 2016. Asynchronous methods for deep reinforcement learning. In International conference on machine learning. PMLR, 1928–1937.
- Mnih et al. (2013) Volodymyr Mnih, Koray Kavukcuoglu, David Silver, Alex Graves, Ioannis Antonoglou, Daan Wierstra, and Martin Riedmiller. 2013. Playing atari with deep reinforcement learning. arXiv preprint arXiv:1312.5602 (2013).
- Mnih et al. (2015) Volodymyr Mnih, Koray Kavukcuoglu, David Silver, Andrei A Rusu, Joel Veness, Marc G Bellemare, Alex Graves, Martin Riedmiller, Andreas K Fidjeland, Georg Ostrovski, et al. 2015. Human-level control through deep reinforcement learning. nature 518, 7540 (2015), 529–533.
- Nazari et al. (2018) Mohammadreza Nazari, Afshin Oroojlooy, Lawrence Snyder, and Martin Takác. 2018. Reinforcement learning for solving the vehicle routing problem. Advances in neural information processing systems 31 (2018).
- Paszke et al. (2019) Adam Paszke, Sam Gross, Francisco Massa, Adam Lerer, James Bradbury, Gregory Chanan, Trevor Killeen, Zeming Lin, Natalia Gimelshein, Luca Antiga, et al. 2019. Pytorch: An imperative style, high-performance deep learning library. Advances in neural information processing systems 32 (2019).
- Patel et al. (2012) Sheela Patel, Carrie Baptist, and Celine d’Cruz. 2012. Knowledge is power–informal communities assert their right to the city through SDI and community-led enumerations. Environment and Urbanization 24, 1 (2012), 13–26.
- Roy et al. (2021) Rajarshi Roy, Jonathan Raiman, Neel Kant, Ilyas Elkin, Robert Kirby, Michael Siu, Stuart Oberman, Saad Godil, and Bryan Catanzaro. 2021. Prefixrl: Optimization of parallel prefix circuits using deep reinforcement learning. In 2021 58th ACM/IEEE Design Automation Conference (DAC). IEEE, 853–858.
- Schlichtkrull et al. (2018) Michael Schlichtkrull, Thomas N Kipf, Peter Bloem, Rianne Van Den Berg, Ivan Titov, and Max Welling. 2018. Modeling relational data with graph convolutional networks. In European semantic web conference. Springer, 593–607.
- Schulman et al. (2017) John Schulman, Filip Wolski, Prafulla Dhariwal, Alec Radford, and Oleg Klimov. 2017. Proximal policy optimization algorithms. arXiv preprint arXiv:1707.06347 (2017).
- Segler et al. (2018) Marwin HS Segler, Mike Preuss, and Mark P Waller. 2018. Planning chemical syntheses with deep neural networks and symbolic AI. Nature 555, 7698 (2018), 604–610.
- Silver et al. (2016) David Silver, Aja Huang, Chris J Maddison, Arthur Guez, Laurent Sifre, George Van Den Driessche, Julian Schrittwieser, Ioannis Antonoglou, Veda Panneershelvam, Marc Lanctot, et al. 2016. Mastering the game of Go with deep neural networks and tree search. nature 529, 7587 (2016), 484–489.
- Silver et al. (2017) David Silver, Julian Schrittwieser, Karen Simonyan, Ioannis Antonoglou, Aja Huang, Arthur Guez, Thomas Hubert, Lucas Baker, Matthew Lai, Adrian Bolton, et al. 2017. Mastering the game of go without human knowledge. nature 550, 7676 (2017), 354–359.
- UN-Habitat (2004) UN-Habitat. 2004. The challenge of slums: global report on human settlements 2003. Management of Environmental Quality: An International Journal 15, 3 (2004), 337–338.
- UN-Habitat (2014) UN-Habitat. 2014. A Practical Guide to Designing, Planning, and Executing Citywide Slum Upgrading Programmes.
- Vaswani et al. (2017) Ashish Vaswani, Noam Shazeer, Niki Parmar, Jakob Uszkoreit, Llion Jones, Aidan N Gomez, Łukasz Kaiser, and Illia Polosukhin. 2017. Attention is all you need. Advances in neural information processing systems 30 (2017).
- Veličković et al. (2018) Petar Veličković, Guillem Cucurull, Arantxa Casanova, Adriana Romero, Pietro Liò, and Yoshua Bengio. 2018. Graph Attention Networks. In International Conference on Learning Representations.
- Wang et al. (2023) Dongjie Wang, Yanjie Fu, Kunpeng Liu, Fanglan Chen, Pengyang Wang, and Chang-Tien Lu. 2023. Automated urban planning for reimagining city configuration via adversarial learning: quantification, generation, and evaluation. ACM Transactions on Spatial Algorithms and Systems 9, 1 (2023), 1–24.
- Wang et al. (2020a) Dongjie Wang, Yanjie Fu, Pengyang Wang, Bo Huang, and Chang-Tien Lu. 2020a. Reimagining city configuration: Automated urban planning via adversarial learning. In Proceedings of the 28th international conference on advances in geographic information systems. 497–506.
- Wang et al. (2021a) Dongjie Wang, Kunpeng Liu, Pauline Johnson, Leilei Sun, Bowen Du, and Yanjie Fu. 2021a. Deep human-guided conditional variational generative modeling for automated urban planning. In 2021 IEEE international conference on data mining (ICDM). IEEE, 679–688.
- Wang et al. (2021b) Dongjie Wang, Pengyang Wang, Kunpeng Liu, Yuanchun Zhou, Charles E Hughes, and Yanjie Fu. 2021b. Reinforced imitative graph representation learning for mobile user profiling: An adversarial training perspective. In Proceedings of the AAAI Conference on Artificial Intelligence, Vol. 35. 4410–4417.
- Wang et al. (2022b) Dongjie Wang, Lingfei Wu, Denghui Zhang, Jingbo Zhou, Leilei Sun, and Yanjie Fu. 2022b. Human-instructed Deep Hierarchical Generative Learning for Automated Urban Planning. arXiv preprint arXiv:2212.00904 (2022).
- Wang et al. (2020b) Meng-Xiang Wang, Wang-Chien Lee, Tao-Yang Fu, and Ge Yu. 2020b. On representation learning for road networks. ACM Transactions on Intelligent Systems and Technology (TIST) 12, 1 (2020), 1–27.
- Wang et al. (2022a) Song Wang, Kaize Ding, Chuxu Zhang, Chen Chen, and Jundong Li. 2022a. Task-adaptive few-shot node classification. In Proceedings of the 28th ACM SIGKDD Conference on Knowledge Discovery and Data Mining. 1910–1919.
- Wang et al. (2018) Tingwu Wang, Renjie Liao, Jimmy Ba, and Sanja Fidler. 2018. Nervenet: Learning structured policy with graph neural networks. In Proceedings of the International Conference on Learning Representations, Vancouver, BC, Canada, Vol. 30.
- Weru (2004) Jane Weru. 2004. Community federations and city upgrading: the work of Pamoja Trust and Muungano in Kenya. Environment and Urbanization 16, 1 (2004), 47–62.
- Wesolowski and Eagle (2010) Amy Wesolowski and Nathan Eagle. 2010. Parameterizing the dynamics of slums. In 2010 AAAI Spring Symposium Series.
- Wu et al. (2019) Felix Wu, Amauri Souza, Tianyi Zhang, Christopher Fifty, Tao Yu, and Kilian Weinberger. 2019. Simplifying graph convolutional networks. In International conference on machine learning. PMLR, 6861–6871.
- Wu et al. (2020) Ning Wu, Xin Wayne Zhao, Jingyuan Wang, and Dayan Pan. 2020. Learning effective road network representation with hierarchical graph neural networks. In Proceedings of the 26th ACM SIGKDD international conference on knowledge discovery & data mining. 6–14.
- Xue et al. (2022) Jiawei Xue, Nan Jiang, Senwei Liang, Qiyuan Pang, Takahiro Yabe, Satish V Ukkusuri, and Jianzhu Ma. 2022. Quantifying the spatial homogeneity of urban road networks via graph neural networks. Nature Machine Intelligence 4, 3 (2022), 246–257.
- Yang et al. (2022) Rui Yang, Jie Wang, Zijie Geng, Mingxuan Ye, Shuiwang Ji, Bin Li, and Feng Wu. 2022. Learning Task-relevant Representations for Generalization via Characteristic Functions of Reward Sequence Distributions. arXiv preprint arXiv:2205.10218 (2022).
- Ying et al. (2018) Rex Ying, Ruining He, Kaifeng Chen, Pong Eksombatchai, William L Hamilton, and Jure Leskovec. 2018. Graph convolutional neural networks for web-scale recommender systems. In Proceedings of the 24th ACM SIGKDD international conference on knowledge discovery & data mining. 974–983.
- Yun et al. (2019) Seongjun Yun, Minbyul Jeong, Raehyun Kim, Jaewoo Kang, and Hyunwoo J Kim. 2019. Graph transformer networks. Advances in neural information processing systems 32 (2019).
- Zong et al. (2022) Zefang Zong, Hansen Wang, Jingwei Wang, Meng Zheng, and Yong Li. 2022. RBG: Hierarchically Solving Large-Scale Routing Problems in Logistic Systems via Reinforcement Learning. In Proceedings of the 28th ACM SIGKDD Conference on Knowledge Discovery and Data Mining. 4648–4658.
Appendix
Appendix A Research Methods
A.1. Markov Decision Process
We propose a DRL model to solve the sequential decision-making problem, where an intelligent agent learns to automatically select locations for road segments by interacting with a slum planning environment, as shown in Figure 2. From the perspective of DRL, the problem can be expressed as a Markov Decision Process (MDP), which contains the following critical components:
-
•
States describe the current conditions of the slum, including both static and dynamic features for places and roads.
-
•
Actions indicate the selected locations of new road segments.
-
•
Rewards provide feedback for road planning actions, which consider the connectivity, travel distance, and construction cost to obtain a comprehensive evaluation.
-
•
Transitions express the dynamic changes of the slum, such as the changes of segments from candidates to roads, and the resulting changes in accessibility and travel distance.
A.2. GNN for Road Planning
Existing tasks in which GNN has been proven successful tend to focus more on nodes of the graph, such as learning node representations for node classification (Kipf and Welling, 2016; Hamilton et al., 2017; Veličković et al., 2018; Wu et al., 2019) and link prediction (Schlichtkrull et al., 2018; He et al., 2020; Ying et al., 2018). However, in road planning for slums, not only nodes but also edges and faces need to be taken into consideration, and these topological elements are interdependent with each other. Specifically, the directly operated decision objects are edges on the graph, which are planned as roads to connect different parts of the slum and have different construction costs. In addition, the effect of road planning is reflected in the faces of the graph, since they represent places in the slum, of which the accessibility and travel distance are optimized. Furthermore, both of the above two metrics are calculated on the planned road network, which mainly consists of pathways between nodes. Consequently, existing node-oriented GNN models are not suitable for road planning, due to their insufficient modeling of the complicated topological structure. In this paper, we propose topology-aware GNN, which can effectively handle the complex topology of slums.
A.3. Definitions of Topological Features
We design rich features for topological elements on the graph, including nodes, edges and faces. These features are used as input of the proposed GNN model to learn representations. We include 11 categories of features as illustrated in Table 1. We now introduce the specific definitions of these features.
Node Features
Nodes represent junctions in a slum, which are points in the original geometric space. We include the following features,
-
•
Coordinates: the Cartesian coordinates indicating the location of the junction in the slum.
- •
-
•
On Road: a boolean feature indicating whether the junction is on a road, either external or planned.
-
•
Road Ratio: the ratio of the number of adjacent road edges to the total number of adjacent edges. It is 0 when On Road is False.
-
•
Avg N2N Dis: the average distance from the node to all other nodes over the constructed road network. It is set as a very large value if the node is not on a road.
Edge Features
Edges represent paths in a slum, which are line segments in the original geometric space. We include the following features,
-
•
Cost: the construction cost of building the segment as a road, which is set as the length of the path.
-
•
Road: a boolean feature indicating whether the path is a road or not. A road can be an existing external one or a newly planned one.
-
•
Straightness: the ratio of the road network distance to the euclidean distance between the two endpoints.
Face Features
Faces represent places in a slum, which are polygons in the original geometric space. We include the following features,
-
•
Connected: a boolean feature indicating whether the place is connected to the road system.
-
•
Avg F2F Dis: the average distance from the place to all other places over the constructed road network. It is set as a very large value if the face is not connected to the road system.
-
•
F2E Dis: the distance from the place to the external boundaries of the slum.
A.4. Model Training and Inference
A.4.1. Model Training
We collect hundreds of rollout trajectories in the replay buffer, and utilize PPO (Schulman et al., 2017) to train our policy and value networks. Specifically, the loss function is composed of policy loss, entropy loss, and value loss.
Policy loss clips the objective to control the change of the policy at each iteration, which encourages the policy to conduct safe exploration. The loss function is calculated as follows,
| (18) | |||
| (19) |
where is the parameters of the policy network, is the ratio of action probability of the new policy to the old policy, is the advantage value calculated according to rewards at each step, and clip controls the update not to be too large.
Entropy loss is included to balance between exploitation and exploration, which is calculated as follows,
| (20) |
where is the total number of edges, and Prob is obtained by the policy network according to (10).
We adopt mean squared error (MSE) between the predicted return and the groundtruth return as the value loss to supervise the value network, which is calculated as follow,
| (21) |
where is the real return value, and is estimated by the value network according to (17).
We integrate the above loss functions through weighted sum,
| (22) |
where and are hyper-parameters in our model.
A.4.2. Model Inference
During model training, actions are sampled according to the selection probability in (10). Once a well-trained model is obtained, we take actions greedily according to the probability, i.e., the most likely action is taken to layout road segments at each step. Specifically, we use the policy network to compute the probability distribution over different actions and takes the action with the largest probability value,
| (23) |
We perform the above fast model inference to generate road plans.
Appendix B Details of Slum Data
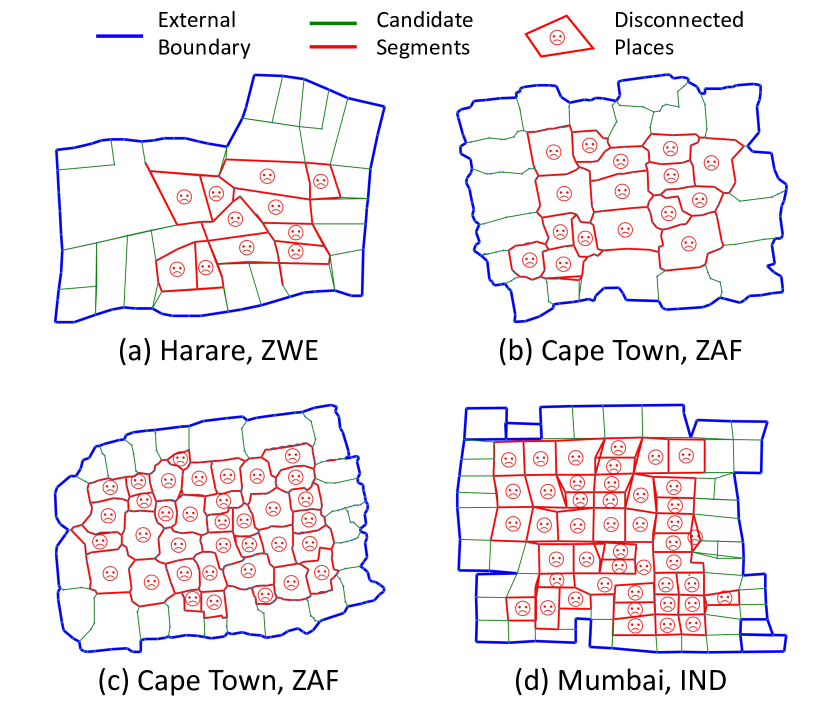
As shown in Table 2, we conduct experiments on four real-world slums from three different countries, including Zimbabwe (ZWE), South Africa (ZAF) and India (IND). The specific locations of the four slums are Epworth (Harare, ZWE), Khayelitsha (Cape Town, ZAF) and Phule Nagar (Mumbai, IND). The digital maps and the geometrical descriptions of places and roads for the four slums are publicly released by (Brelsford et al., 2018). Figure 11 illustrate the geometrical descriptions of the four slums.
Appendix C Implementation Details
C.1. Baselines
We implement Random, Greedy and GA-G methods and integrate it into our framework. Each method outputs the score for each edge that is transformed to selection probability with (10).
Random
The score for each edge is obtained in a fully random way,
| (24) |
Greedy-A
The score of the edge which connects the most disconnected places is set as 1, while others are set as 0,
| (25) |
Greedy-C
The score of the edge with the least construction cost is set as 1, while others are set as 0,
| (26) |
MST
We utilize Kruskal’s algorithm (Kruskal, 1956) to grow a minimum spanning tree on a transformed graph, where nodes represent places in the slum, and edges represent candidate road segments with their weights as construction cost.
GA-G
We utilize a vector and compute inner product between this vector and the edge attributes to obtain the score for each edge,
| (27) |
where is set as the genes. We initialize a random population and perform crossover and mutation to evolve for better road plans.
For the GA-S baseline, we set the gene as the selection of edges,
| (28) |
where the sum of is the road planning budget . We perform crossover which is swapping between different solutions, as well as mutation to evolve the population. The fitness function of a solution is defined as a weighted sum of accessibility, travel distance and construction costs. For the HS-MC (Brelsford et al., 2018) baseline, we use the original codes222https://github.com/brelsford/topology released by the authors.
Generative models are not applicable to the problem of road planning for slums, due to the significant differences in planning constraints, planning targets, planning budget, and data representation. Still, we exhausted all efforts to adapt two typical generative models (Fang et al., 2022; Kempinska and Murcio, 2019) based on GAN (Goodfellow et al., 2020) and VAE (Kingma and Welling, 2013) to accomplish the task of road planning for slums. Specifically, we have to conduct the following tedious adaptions which make the road planning process far from automation.
-
•
First, we have to manually move the generated roads to their nearest candidate segments to avoid destroying existing houses in the slum.
-
•
Second, we have to manually remove some of the generated roads to avoid breaking the planning budget.
-
•
Third, we have to manually transform the generated raster representation to a vector representation to obtain a faithful solution.
C.2. Hyper-parameters of Our Model
We implement the proposed model with PyTorch (Paszke et al., 2019), and release the codes at at https://github.com/tsinghua-fib-lab/road-planning-for-slums. We tune the hyper-parameters of our model carefully and list the adopted values in Table 4.
| Category | Hyper-parameter | Value |
| Network | GNN layer | 2 |
| GNN node dimension | 16 | |
| Policy Head | [32, 1] | |
| Value Head | [32, 32, 1] | |
| PPO | gamma | 0.995 |
| tau | 0 | |
| Entropy Loss | 0.01 | |
| Value Loss | 0.5 | |
| Train | optimizer | Adam |
| weight decay | 0 | |
| learning rate | 0.0004 |
Appendix D Differences with Road Planning for Common Regions
In the paper, we explained why current city-level approaches cannot handle the micro-level road planning within a slum. In this section, we would like to further clarify the differences between road planning for common regions and slums, as well as why generative models are not applicable for this problem.
First, the planning constraints make road planning for slums a problem quite different from road planning for common regions. Specifically, road planning for common regions is more like painting on a white paper, where roads can grow at almost anywhere since there are no existing land functionalities in the planned region. As a consequence, a street network can be generated in a process similar to image generation, and generative models such as GAN (Goodfellow et al., 2020) can be adopted. However, slum is not a white paper, where existing houses determine the possible forms of the road network. As stated in Section 2, planned roads are not allowed to pass through the middle of places to minimize disruption to the slums, thus the candidate locations are restricted to the spacing between places. In other words, road planning for slums is more a decision-making task than a generation task, where the road plans are actually obtained by choosing a fraction of segments from a candidate set of segments, rather than painting on a white paper. Therefore, it is quite different from road planning for common regions, and generative models such as GAN (Goodfellow et al., 2020) and VAE (Kingma and Welling, 2013) are not applicable in road planning for slums.
Second, the planning targets of road planning for slums are very different from road planning for common regions. In road planning for slums, as stated in Section 2, we aim to make every place in the slum connected to the road system (universal connectivity), reduce travel distance between different places, and maintain a affordable construction cost. On the contrary, in road planning for common regions, especially through generative methods such as (Fang et al., 2022; Kempinska and Murcio, 2019), the target is to learn the patterns of street network based on surrounding context. Meanwhile, for a given slum, we need to add roads in it instead of recovering a masked region as in (Fang et al., 2022). For the model design, as the planning process is to select a fraction of segments from a candidate set to improve accessibility rather than learning certain road network patterns, generative models are not appropriate for the task of road planning for slums.
Third, the planning budget also makes road planning for slums a different problem. Specifically, we need to upgrade the slum under a given budget, which can be the number of road segments to be added or the monetary cost of the planned road. Therefore, it is more a sequential decision-making problem, where an agent adds a segment or a path in each step, and terminates the process when it runs out of the budget. Generative models such as (Fang et al., 2022), generate road plans in one pass, which makes it very difficult to satisfy the requirements of planning budgets.
Fourth, with respect to data representation, to obtain a faithful solution to road planning for slums, a slum and roads in it need to be described with an accurate vector representation (points, linestrings and polygons with exact coordinates), rather than a vague raster representation (image pixels). Therefore, for the model design, a model that outputs discrete actions selecting segments is more appropriate than a model that generates an image such as (Fang et al., 2022).
In summary, road planning for slums is a very different problem from road planning for common regions, in terms of planning constraints, planning targets, planning budget, and data representation. These differences all directly influence the model design, making generative models not applicable to this problem.
Appendix E Additional Results
E.1. Generated Road Plans
In Section 4.2, we show the road planning performance of different methods for the four slum, as well as the generated road plans of GA-G, HS-MC and our DRL-GNN for the slum in Cape Town, ZAF. Our proposed model significantly outperforms other baselines for all slums, improving their accessibility and travel distance with lower construction costs. We provide the complete generated road plans of 13 methods on 4 slums in Figure 17-20.
E.2. Convergence of Our Models
With the specially designed multi-objective policy optimization, our proposed models can efficiently learn the skills of road plans within only about 2 hours of training on a single server with a single Nvidia GeForce 2080Ti GPU. We show the normalized episodic reward of our models after each iteration of training for the slums in Harare, ZWE and Cape Town, ZAF in Figure 12. We can observe that both DRL-MLP and DRL-GNN can reach convergence within less than 100 iterations, which is highly efficient.
E.3. Using Cost as Planning Budget
| Budget (SC) | Method | Harare, ZWE | Cape Town, ZAF (A) | Cape Town, ZAF (B) | Mumbai, IND | ||||
| UC | AD | UC | AD | UC | AD | UC | AD | ||
| Low | HS-MC | NO | INF | NO | INF | NO | INF | NO | INF |
| DRL-GNN (ours) | YES | 1.26 | YES | 2.47 | YES | 2.77 | YES | 3.34 | |
| impr% v.s. HS-MC | -100% | -100% | -100% | -100% | -100% | -100% | -100% | -100% | |
| Medium | HS-MC | YES | 0.70 | YES | 1.41 | YES | 1.96 | YES | 2.09 |
| DRL-GNN (ours) | YES | 0.65 | YES | 1.24 | YES | 1.76 | YES | 1.85 | |
| impr% v.s. HS-MC | - | -7.1% | - | -12.1% | - | -10.2% | - | -11.5% | |
| High | HS-MC | YES | 0.64 | YES | 1.21 | YES | 1.68 | YES | 1.71 |
| DRL-GNN (ours) | YES | 0.52 | YES | 1.02 | YES | 1.44 | YES | 1.55 | |
| impr% v.s. HS-MC | - | -18.8% | - | -15.7% | - | -14.3% | - | -9.4% | |
| Method | Harare, ZWE | Cape Town, ZAF (A) | Cape Town, ZAF (B) | Mumbai, IND | ||||
| UC | AD | UC | AD | UC | AD | UC | AD | |
| HS-MC | YES | 0.64 | YES | 1.21 | YES | 1.68 | YES | 1.71 |
| DRL-GNN (ours) | YES | 0.51 | YES | 0.94 | YES | 1.44 | YES | 1.53 |
| impr% v.s. HS-MC | - | -20.3% | - | -22.3% | - | -14.3% | - | -10.5% |
In the paper, we use the number of road segments to be planned, , as the planning budget. In fact, there are other acceptable and feasible budgets for road planning, such as the construction cost. Fortunately, our model is not limited to a designated type of budget and is still applicable if the budget is changed to the construction cost. We will explain it below in detail with experimental results.
In fact, our model can generate decent road plans with optimal accessibility and minimal cost under a budget specified in terms of the number of roads, or the construction cost, or any other types of budget. From the perspective of reinforcement learning where the intelligent road planning agent interacts with a simulated slum environment, the budget is only used by the environment but not the agent. Specifically, the environment uses the budget value to determine whether to continue or terminate the planning process. Under both types of budget, the agent always builds one segment at each step, until the environment claims that it has run out of budget. Therefore, when changing the budget to the construction cost, we only need to redefine the termination logic of the environment, and we can simply keep the model as it is. To show this point, we conducted supplementary experiments by utilizing the trained model under the original budget of the number of road segments, and directly testing it with the different budget of construction cost. We even changed the budget to different values of construction cost without any modification to the model. The results are shown in Table 5. As the construction cost becomes budget now, the SC metric will no longer make sense, thus we only report AD and whether universal connectivity (UC) is achieved.
We can observe that the results under the budget of construction cost is consistent with the results in the paper which is trained under the budget of the number of road segments. With low budget of construction cost, HS-MC can not achieve universal connectivity while our DRL-GNN can successfully connect all places in the slum. For all slums under all different budget of construction cost, the travel distance of our approach is significantly lower than that of HS-MC.
Besides the above results of direct evaluation, we also train a new model with the same high budget of construction cost in Table 5 (we only redefine the termination logic of the environment, and use the same model structure). The results are shown in Table 6. Similarly, we only report UC and AD, because SC does not make sense. We can observe that the results are consistent with previous findings, where our proposed DRL-GNN method significantly outperforms HS-MC with over 10% relative improvements.
In summary, our proposed model can deal with different definitions of the planning budget without any modification. Specifically, we can simply keep the model unchanged, and only redefine the termination logic of the environment. The results under different planning budgets are quite stable, showing the consistent advantages of our proposed method.
E.4. More Results on Graph Modeling
We have shown that DRL-GNN achieves better final road planning performance compared with a DRL model without the generic graph modeling, DRL-MLP, in Table 3. Despite the superior evaluation performance, the graph modeling makes it easier to discover places with poor accessibility, which in turn facilitates more efficient search in the action space. As a consequence, DRL-GNN is much more efficient considering training samples than DRL-MLP. Table 7 illustrates the number of iterations utilized to train DRL-GNN and DRL-MLP until convergence for the four slums. We can observe that DRL-GNN requires much fewer iterations to converge for all slums. Notably, for the largest slum in Mumbai, IND, our DRL-GNN model uses over 70% fewer iterations to achieve better road planning performance than DRL-MLP. The superior sample efficiency of our DRL-GNN model indicate that it can generate decent road plans in a short time, which is critical for real-world slum upgrading with a large solution space.
| Method | DRL-MLP | DRL-GNN | impr% |
| Harare, ZWE | 91 | 57 | -37.4% |
| Cape Town, ZAF | 79 | 31 | -60.8% |
| Cape Town, ZAF | 87 | 40 | -54.0% |
| Mumbai, IND | 82 | 23 | -72.0% |
E.5. More Results on Topological Features
We investigate the effect of different topological features by setting the values as 0 and evaluating their corresponding performance. In Section 4.3, we investigate three typical features, namely Centrality, Road and Straightness. We demonstrate the results of removing other features in Figure 13. We can observe that all features contribute to the effect of road planning with respect to travel distance, and removing any of them will bring about a deterioration. Among these features, Straightness (F8), Centrality (F2), Coordinates (F1), and Connected (F9) are the most important features, and removing them lead to an over 16.7% increase in travel distance. These four features, especially Straightness, directly reflect the current conditions of travel distance, and can be utilized by our model to detect long detours in the slum. In terms of construction cost, the Cost feature (F6) is the most important which is consistent with intuition. All these features contain rich topological information about the accessibility, travel distance and constructions costs of roads and places in the slum. We adopt the 11 categories of features since they reflect topological information and they are all easy to compute. Furthermore, we believe more features can be designed and included into our model, which may lead to better road planning performance.
E.6. More Results on Action Mask
We have shown that the masked policy optimization method can improve the final road planning metrics in Section 4.3. Besides better evaluation performance, the action mask can block out actions of low quality, such as the roads segments which connect places that are already connected. In other words, the action mask guides our model to explore in a sub action space which is smaller and contains much fewer undesirable actions, instead of the original enormous one. Therefore, our model can learn skills of road planning faster with the help of the action mask. We illustrate the convergence curve of accessibility of our DRL-GNN model with and without the action mask in Figure 14, which is the number of road segments (NR) consumed to achieve universal connectivity after each iteration of training. We can observe that although both methods eventually achieve the same lowest NR, using the action mask can make our DRL-GNN model converge much faster than optimizing it without the mask. Specifically, without the action mask, the DRL-GNN model tends to try those actions of low quality in the early stages of training, thus it requires much larger number of road segments to achieve universal connectivity. In the first 20 iterations, the NR is over 20 and 40 for the two slums respectively. On the contrary, adding the action mask help the DRL-GNN model quickly discover road segments that can significantly improve the accessibility. Thus the NR is getting very close to optimal after only 10 iterations of training, which is 3 times faster than not using the action mask.
| Method | Harare, ZWE | Cape Town, ZAF (A) | Cape Town, ZAF (B) | Mumbai, IND | ||||||||
| NR | AD | SC | NR | AD | SC | NR | AD | SC | NR | AD | SC | |
| DRL-MLP (ours, masked) | 11 | 0.52 | 4.38 | 14 | 0.96 | 8.28 | 32 | 1.57 | 15.66 | 31 | 1.52 | 22.93 |
| DRL-GNN (ours, masked) | 9 | 0.50 | 4.60 | 13 | 0.93 | 8.24 | 31 | 1.51 | 15.62 | 29 | 1.51 | 22.82 |
| DRL-GT (ours, masked) | 8 | 0.51 | 4.47 | 13 | 0.93 | 8.64 | 32 | 1.38 | 16.97 | 29 | 1.55 | 21.89 |
E.7. Hyper-parameter Study
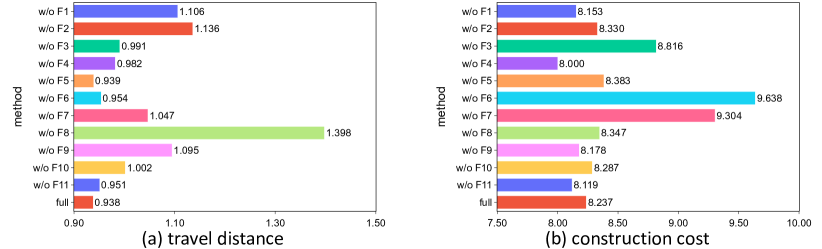
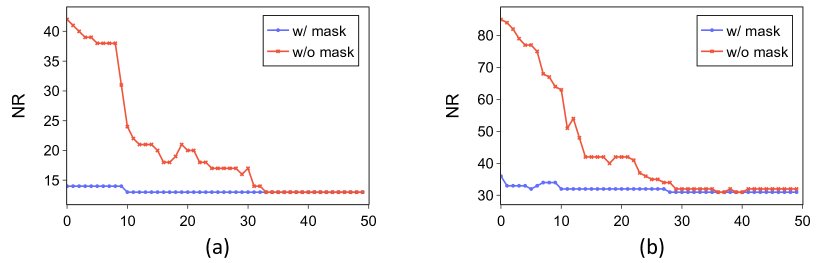
We investigate three key hyper-parameters of our model in this section, which are the number of GNN layers, the dimenstion of GNN representations and the reward weights .
GNN Layers. We design a topology-aware message passing mechanism with node-to-edge propagation, face-to-edge propagation, edge self-propagation and edge embedding broadcast in one GNN layer. Multiple GNN layers can be stacked to expand the perception fields of each node and edge on the graph, making the learned representations absorb information of multi-hop neighbors. However, too many GNN layers may lead to over-smoothing and deteriorate the final performance (Chen et al., 2020). We train our model with different number of GNN layers, and Figure 15(a) demonstrates the results. Consistent with our expectation, using 2 GNN layers achieves the best performance, while using too few (1) or too many (4) GNN layers both fail to achieve effective road planning. Particularly, using 4 GNN layers increase travel distance and construction costs by over 5.5% and 6.1%, respectively, which is even worse than DRL-MLP.
GNN Embedding Dimension. The embedding dimension decides the expressive power of the learned representations. With too low embedding dimension, the representations for roads and places cannot well capture the topological information. On the contrary, with too high embedding dimension, the model may suffer from overfitting. We investigate the performance of of model with different embedding dimensions, as shown in Figure 15(b). Setting embedding dimension as 16 outperforms other variants of our model. Increasing it to 32 will worsen construction costs by about 3.1%, and decreasing it to 4 will make travel distance and construction costs worse by about 0.7% and 8.1%. We thus set embedding dimension as 16 in our experiments.
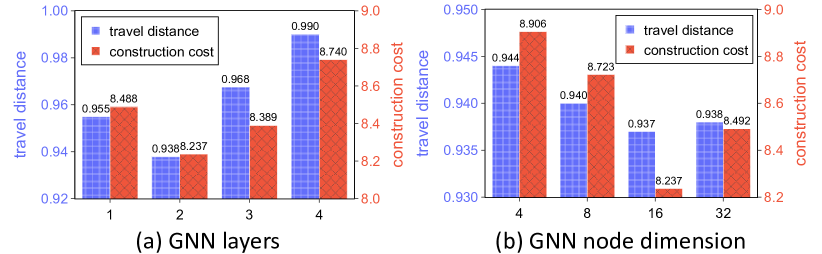
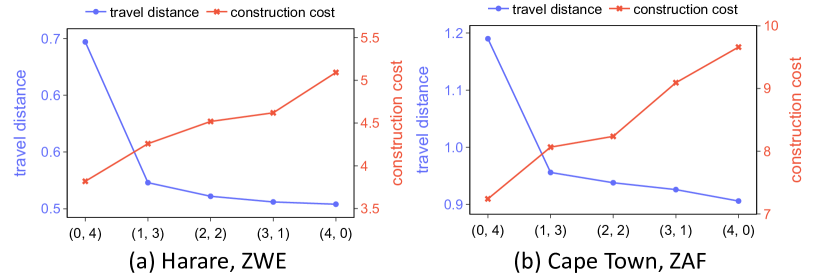
Reward Weight. In (14), we add hyper-parameters, and , which determine the weight for different rewards. By altering the ratio of to , we can easily optimize our model to emphasize travel distance or construction costs. Figure 16 shows the planning performance of our model under different ratios of to . We can observe that using a larger ratio can effectively reduce the travel distance, while requiring higher construction costs. Similarly, a smaller can prioritize construction costs over travel distance. Through changing the value of , our model can achieve smooth trade-off between different metrics, which is much beneficial for practical slum upgrading since it usually involves comparison between different road plans.
E.8. Results of Graph Transformer
In the paper, we chose to use topology-aware GNN for building our DRL-GNN model, which has been shown to be effective for modeling the topological relationships among different elements in the slum. In fact, other graph-based neural network structures can be much useful and deserve thorough exploration. Fortunately, our proposed method is flexible and can be easily integrated with more advanced network structures. In particular, we implement graph transformer (GT) (Yun et al., 2019), which replaces the average pooling in (15) with a self-attention module (Vaswani et al., 2017). The results are shown in Table 8. We can observe that the DRL-GT model achieved competitive performance, indicating the promising potential of our proposed framework to include more advanced neural network structures. For instance, our framework can be further extended by incorporating recent progress made in GNN and RL.