Rethinking Semi-supervised Learning with Language Models
Abstract
Semi-supervised learning (Ssl) is a popular setting aiming to effectively utilize unlabelled data to improve model performance in downstream natural language processing (NLP) tasks. Currently, there are two popular approaches to make use of unlabelled data: Self-training (St) and Task-adaptive pre-training (Tapt). St uses a teacher model to assign pseudo-labels to the unlabelled data, while Tapt continues pre-training on the unlabelled data before fine-tuning. To the best of our knowledge, the effectiveness of Tapt in Ssl tasks has not been systematically studied, and no previous work has directly compared Tapt and St in terms of their ability to utilize the pool of unlabelled data. In this paper, we provide an extensive empirical study comparing five state-of-the-art St approaches and Tapt across various NLP tasks and data sizes, including in- and out-of-domain settings. Surprisingly, we find that Tapt is a strong and more robust Ssl learner, even when using just a few hundred unlabelled samples or in the presence of domain shifts, compared to more sophisticated St approaches, and tends to bring greater improvements in Ssl than in fully-supervised settings. Our further analysis demonstrates the risks of using ST approaches when the size of labelled or unlabelled data is small or when domain shifts exist. We offer a fresh perspective for future Ssl research, suggesting the use of unsupervised pre-training objectives over dependency on pseudo labels.111 Code is available at https://github.com/amzn/pretraining-or-self-training.
1 Introduction
Pre-training (Pt) language models (LMs) Devlin et al. (2019); Liu et al. (2019); Radford et al. (2019) over large amounts of text data (e.g. with masked language modelling) and then fine-tuning on task-specific labelled data offer large performance gains across NLP tasks. Semi-supervised learning (Ssl) Grandvalet and Bengio (2004); Chapelle et al. (2009); Kipf and Welling (2017) is a powerful and effective approach to utilize unlabelled data. A typical Ssl setting assumes access to a (relatively small) labelled training set and an (often large) unlabelled set. The goal of Ssl is to make effective use of the unlabelled data to improve model (i.e. LMs) performance.
In NLP, Self-training (St) approaches have been proposed to produce pseudo labels for unlabelled examples to train the model (e.g. in Yarowsky, 1995; McClosky et al., 2006). With the advent of neural networks, St approaches typically focus on using student-teacher models to assign pseudo-labels to the unlabelled data (e.g. in Artetxe et al., 2018; Cai and Lapata, 2019; Dong and de Melo, 2019; Xie et al., 2020a; Gera et al., 2022). Apart from the sophisticated St approaches, Gururangan et al. (2020) proposed task adaptive pre-training (Tapt), which is a straightforward yet effective method for utilising unlabelled examples. This method involves continuing pre-training the LM on the task-specific data without using labels, before proceeding with fully-supervised fine-tuning. Tapt and St are both motivated by the need for effectively leveraging unlabelled examples, raising the questions of how TAPT performs in Ssl tasks, as well as how these two approaches perform against each other.
In this work, we investigate the performance of Tapt against five state-of-the-art St approaches across five NLP tasks (section 4). We empirically show that Tapt outperforms all state-of-the-art St approaches on several tasks, suggesting that it should serve as a strong baseline for Ssl methods. Previous research Gururangan et al. (2020) has shown that TAPT can improve performance in fully-supervised settings. Our study goes further by showing that TAPT can be even more effective in Ssl settings (section 4).
We next study the impact of using different amounts of labelled and unlabelled data for Ssl (section 5). Our experiments show that St approaches are prone to suffering from insufficient labelled or unlabelled data, while Tapt is more robust across different combinations of labelled and unlabelled data sizes. Contrary to the common assumption that Tapt requires a large amount of data to perform well (e.g. Li et al., 2021b; Hou et al., 2022), our results show that Tapt improves performance with just a hundred unlabelled samples. We conduct further analysis on the impact of domain shifts in labelled or unlabelled data. While St approaches generally suffer from domain shifts, Tapt is more robust and even benefits from domain shifts (section 6).
In summary, the main contributions of this paper are as follows:
-
•
An extensive empirical study to directly compare five state-of-the-art St approaches and Tapt across various NLP tasks in Ssl, with varying amounts of labelled and unlabelled data as well as the effect of domain shifts;
-
•
Practical insights learned about the limitations of St approaches, alongside an exploration of the often-unrecognized yet impressive capacity of Tapt as a simple, stable and powerful Ssl learner;
-
•
A fresh perspective for future Ssl research by demonstrating that leveraging unsupervised signals from unlabelled texts presents a promising and effective approach alternative to dependence on pseudo labels.
2 Preliminaries
2.1 Task Adaptive Pre-training (Tapt)
LMs are adapted to downstream NLP tasks by fine-tuning (Ft) on task-specific data. Tapt introduces a simple additional step before fine-tuning by continuing pre-training with a masked language modelling (Mlm) objective Devlin et al. (2019); Liu et al. (2019) on the task-specific data without requiring labels. The main advantage of Tapt is that it provides a simple way for the LM to explore the task space while it can easily make use of all available labelled and unlabelled data.
2.2 Self-training (St)
The core idea behind St approaches is to utilise a teacher model trained on labelled examples to make predictions for unlabelled examples, and train a new student model with these predictions. Formally, let denote labelled examples and denote unlabelled examples, where usually . The St framework is trained with three main steps as follows.
Step 1.
A teacher model , parameterized by a neural network , is trained via minimizing the cross entropy loss on labelled examples :
| (1) |
Dataset Task Type Train Size Dev. Size Test Size IMDB Maas et al. (2011) Movie Review Sentiment 23,000 2,000 25,000 2 149 SST-2 Wang et al. (2018) Movie Review Sentiment 60,000 7,349 872 2 37 AG News Zhang et al. (2015) News Topic Classification 100,000 10,000 7,600 4 134 Amazon Review McAuley and Leskovec (2013) Product Review Sentiment 250,000 25,000 650,000 5 79 Yahoo! Answer Chang et al. (2008) Topic Classification 500,000 50,000 60,000 10 32
Step 2.
The teacher model is used to make predictions (referred to as “pseudo-labels”) on unlabelled examples :
| (2) |
where can be either the continuous logit or the discrete label induced by an ArgMax operation.
Step 3.
A student model , parameterized by a fresh neural network , is trained to fit labelled and pseudo-labelled examples:
| (3) |
This process is repeated for a given number of times by treating the student as a new teacher to re-predict pseudo-labels as in eq. 2 and then training a new student with eq. 3. In practice, St with techniques such as consistency regularization Miyato et al. (2018); Clark et al. (2018); Berthelot et al. (2019b), strong data augmentation Sohn et al. (2020); Xie et al. (2020b, a), confidence threshold Sohn et al. (2020); Zhang et al. (2021); Berthelot et al. (2022) usually leads to substantial improvements in model performance.
3 Experimental Setup
Datasets.
We experiment with five datasets used in previous related work for Ssl Gururangan et al. (2019); Chen et al. (2020b); Xie et al. (2020a); Li et al. (2021a); Gera et al. (2022), including IMDB Maas et al. (2011), SST-2 Wang et al. (2018), AG News Zhang et al. (2015), Amazon Review McAuley and Leskovec (2013), and Yahoo! Answer Chang et al. (2008). Table 1 shows data statistics. We also provide descriptions and examples of datasets in Appendix §A.1. We show the process for quantifying the similarity between datasets in Appendix §A.2. Adhering to previous work (e.g. Chen et al., 2020b; Wang et al., 2022), we sample the same amount of labelled data per class from the train set, given the labelled size, to form the labelled set. We re-sample the labelled data using the same five seeds for all different approaches and report the average performance with an error bar.
Tapt.
Our approach to task adaptive pre-training (Tapt) using RoBERTa-Base Liu et al. (2019) is to further pre-train on the training text corpus including labelled and unlabelled data (see Table 12 in Appendix for hyperparameter details). The model is then fine-tuned on the labelled data where the [CLS] token representation is passed to an extra feed-forward layer for classification (see Table 13 in Appendix for hyperparameter details). The process of Tapt + Fine-tuning is simply denoted by Tapt henceforth.
St.
We implement five state-of-the-art St approaches, including VAT Miyato et al. (2018), FixMatch Sohn et al. (2020), Dash Xu et al. (2021b), FlexMatch Zhang et al. (2021), and AdaMatch Berthelot et al. (2022) (see descriptions of these approaches in Appendix §B). We use RoBERTa-Base as the backbone, and the [CLS] token representation with an extra feed-forward layer is used for classification (see Table 14 in Appendix for hyperparameter details). Adhering to previous work Xie et al. (2020a); Wang et al. (2022), back-translation Ott et al. (2019) is used for data augmentation.
Baselines.
For reference, we also evaluate two baseline models that are only fine-tuned (from an off-the-shelf RoBERTa-Base checkpoint) on: (1) the same labelled set as Tapt and St (Supervised); and (2) the whole training set (Fully-Supervised).
4 St vs Tapt
| Method | IMDB | SST-2 | AG News | Amazon Review | Yahoo! Answer | |||||
| 20 | 100 | 40 | 100 | 40 | 200 | 250 | 1000 | 500 | 2000 | |
| St Approaches | ||||||||||
| VAT | 90.20.9 | 92.00.4. | 75.012.0 | 86.23.4 | 87.51.0 | 89.50.7 | 52.21.3 | 57.50.2 | 66.90.5 | 68.60.2 |
| FixMatch | 93.40.1 | 93.40.1 | 37.38.5 | 66.421.3 | 75.68.7 | 88.80.6 | 55.91.1 | 59.00.5 | 67.51.0 | 69.60.4 |
| Dash | 93.20.3 | 93.40.2 | 38.210.1 | 73.318.6 | 74.36.6 | 88.50.6 | 56.61.8 | 59.30.2 | 67.61.0 | 69.50.3 |
| FlexMatch | 93.30.1 | 93.40.1 | 40.67.7 | 83.08.3 | 80.64.4 | 88.20.5 | 54.93.9 | 58.80.4 | 66.60.7 | 68.70.4 |
| AdaMatch | 94.40.4. | 94.70.2 | 42.613.3 | 83.14.4 | 82.75.9 | 88.60.4 | 55.52.8 | 59.00.7 | 68.00.7 | 69.50.3 |
| Supervised | 83.37.4 | 88.70.2 | 74.76.1 | 84.02.7 | 84.61.6 | 88.00.8 | 53.10.7 | 57.20.1 | 65.40.3 | 68.50.3 |
| + Tapt | 86.92.8 | 90.90.6 | 82.64.0 | 85.42.4 | 84.01.3 | 88.70.7 | 58.40.7 | 60.60.1 | 68.80.7 | 71.50.3 |
| Fully-Supervised | 93.90.1 | 93.00.6 | 94.80.1 | 65.00.2 | 75.30.2 | |||||
| + Tapt | 94.00.2 | 93.50.3 | 95.00.1 | 65.60.1 | 75.40.1 | |||||
Overview.
Table 2 shows the performance of Tapt against five state-of-the-art St approaches and the baselines (Supervised and Fully-Supervised) across five datasets, each with two different sizes of labelled data for training following Wang et al. (2022). Overall, we observe that: (1) Tapt achieves highly competitive results compared with state-of-the-art St approaches; and (2) Tapt gains more improvement compared to the Supervised baselines when using fewer labelled samples.
For our first finding, the experimental results show that Tapt outperforms all five state-of-the-art St approaches with lower variances on Amazon Review, and Yahoo! Answer, as shown in Table 2. For example, Tapt obtains a score of 68.8% compared to the best St approach’s score of 68.0% (using 500 labelled samples) and 71.5% compared to St’s 69.6% (using 2000 labelled samples) on Yahoo! Answer. For an example of the second finding, Tapt gains 3.6% improvement over Supervised (using 20 labelled samples) compared to 2.2% (using 100 labelled samples) on IMDB. Below we delve deeper into these two findings and discuss them in more detail.
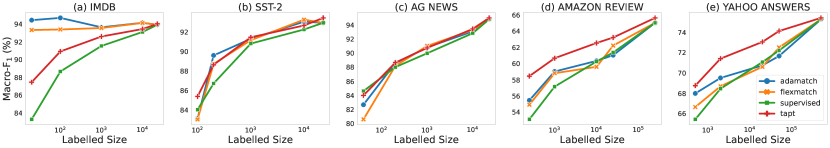
#1. Tapt is a strong semi-supervised learner and can outperform state-of-the-art St approaches.
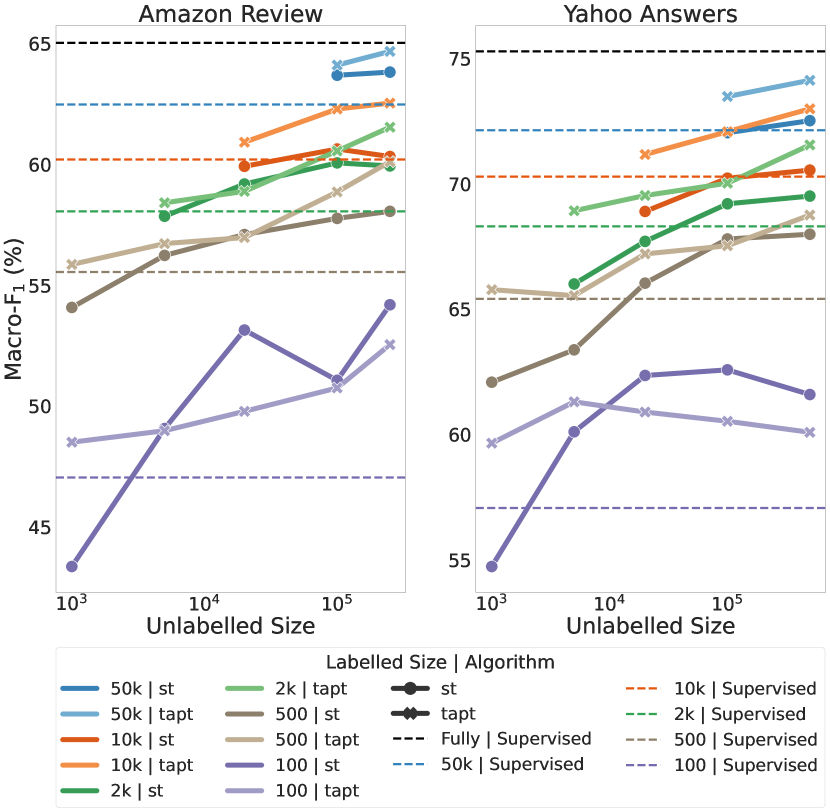
Figure 1 shows how the performance of St, Tapt, and Supervised vary with respect to five different labelled sizes on each dataset, where two latest St approaches (AdaMatch and FlexMatch) are selected as representatives for St. Experimental results further verify that Tapt has a consistent advantage over AdaMatch and FlexMatch across different labelled sizes on Amazon Review and Yahoo! Answer. It is also worth noting that, while Tapt brings a stable improvement over Supervised across all datasets with varying labelled sizes, St can sometimes bring more substantial improvement, for example when only a few hundreds of labelled samples are available from IMDB. However, we do not observe similar phenomena for St on other datasets. Our experimental results demonstrate that Tapt is a simple, effective and strong learner for Ssl tasks, and it should serve as a baseline for Ssl tasks in NLP.
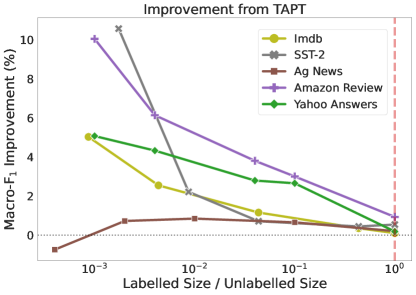
#2. Tapt tends to bring more improvements in Ssl than in Fully-Supervised setting.
We further study the behaviour of Tapt itself under Ssl, where we select Supervised as the baseline rather than St approaches. Figure 1 shows that the differences in performance (in absolute values) between Tapt (red lines) and Supervised (green lines) generally increase as the labelled size decreases. To gain a better understanding of the impact of labelled data sizes, we plot the improvement from Tapt over Supervised (in percentages) against the ratio between labelled size and unlabelled size (unlabelled size is fixed for each dataset) in Figure 2. We see that Tapt improves over Supervised further as the ratio of labelled and unlabelled sizes decreases, highlighting the trends of gaining greater improvement in low-resource Ssl setting. This finding is complementary to prior works (e.g. in Howard and Ruder, 2018; Gururangan et al., 2020) that focus on Tapt’s improvement from the Fully-Supervised perspective, represented by the rightmost red vertical line in Figure 2. The rising trend of the improvement is not monotonic as the labelled size is reduced. Rather it could provide insight into how Tapt improves over Supervised in Ssl and inspire the design of new approaches.
5 Exploring the limits of St and Tapt
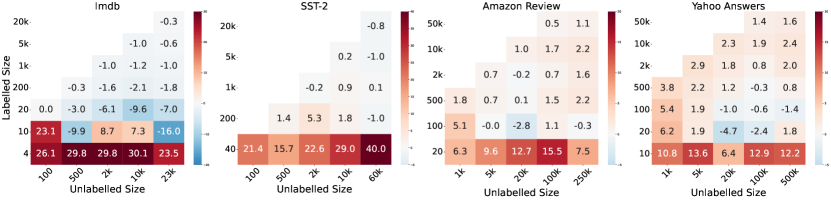
In section 4, our experimental results showed inconsistent results across datasets. For example, St performs better on IMDB while Tapt achieves better results on Amazon Review and Yahoo! Answer. We hypothesize that this might be attributed to the exposure to different sizes of labelled or unlabelled data. To verify this hypothesis and shed light on the differences in performance between datasets, we compare Tapt and St (using AdaMatch and FlexMatch as representatives) by sampling different labelled and unlabelled sizes in IMDB, SST-2, Amazon Review and Yahoo! Answer.
Figure 3 visualizes the differences in performance between Tapt and St, where each cell represents the macro- performance difference of Tapt over St (averaged across five seeds). In each case, the highest performance among FlexMatch and AdaMatch is selected to represent the performance of St. Overall, we observe that: (1) Tapt improves the fine-tuning performance even with a few hundred unlabelled examples; and (2) Tapt performs more stable across the different labelled and unlabelled data sizes than St approaches. Below we provide a comprehensive analysis of the impact of labelled and unlabelled sizes.
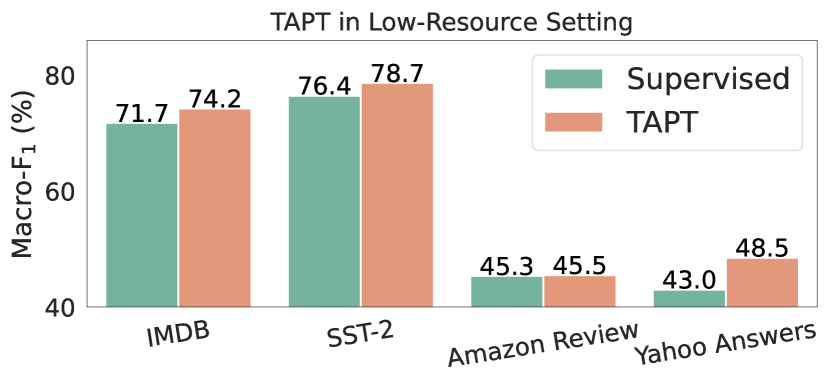
#1. Tapt works even with a few hundred unlabelled samples.
It is generally assumed that Tapt requires a large amount of unlabelled data to perform well (e.g. Li et al., 2021b; Hou et al., 2022). However, we surprisingly observe that Tapt can bring substantial improvement over Supervised baseline even with a relatively small number of unlabelled samples, as shown in Figure 5. To explore the effectiveness of Tapt over Supervised in the low-resource setting of unlabelled data, we select the performance of Tapt and Supervised from the first column (the lowest unlabelled size) for each dataset in Figure 3 and plot their average performance over different labelled sizes. Figure 4 shows that Tapt improves over the Supervised baseline with just one hundred or one thousand samples. For instance, Tapt achieves a 5.5% increase in score compared to the Supervised baseline when using only 1k unlabelled samples on Yahoo! Answer. Additionally, this performance is achieved without the need for large amounts of tokens in each sample, as training samples from SST-2, on average, contain only 9 tokens and training samples from Yahoo! Answer contain about 32 tokens (see examples in Table 6 of Appendix).
#2. Scarce labelled data and adequate unlabelled data.
Tapt appears to be a more favourable choice than St approaches in this setting. The bottom of each sub-figure in Figure 3 shows a clear labelled size boundary, below which FlexMatch and AdaMatch are outperformed by Tapt with a large margin, regardless of datasets and unlabelled size used. This suggests that St might not be able to efficiently handle large amounts of unlabelled data if labelled data do not provide adequate information. This might be attributed to confirmation bias Tarvainen and Valpola (2017); Arazo et al. (2020), which results from the accumulation of errors in the iterative St process caused by incorrect pseudo-labels.
The specific value of adequate labelled size boundary for St approaches depends on the nature of the dataset. For example, even though both IMDB and SST-2 are binary classification tasks for movie review sentiment analysis, the labelled size boundary for SST-2 is higher (), indicating that this boundary tends to increase as the task becomes more challenging. While it may be easy to obtain dozens of labelled data in this case, when the task becomes more intricate or contains noisy weak labels, it is important to be aware of this potential issue with St approaches. Tapt could serve as an alternative in situations where collecting adequate labelled data for training is costly. We provide specific values of the performance of St and Tapt, and further verify that this finding applies to other St approaches in Appendix §D.
#3. Adequate labelled data and scarce unlabelled data.
In this setting, Tapt is more robust, while St has a greater chance of performing worse than the Supervised baseline. In Figure 5, we plot the performance of St approaches and Tapt against five different sizes of unlabelled data, grouped by size (using similar colours). We note that St approaches perform worse than their corresponding Supervised baselines (represented by horizontal lines) until a certain amount of unlabelled data has been reached. For example, when the labelled size is 500, St requires about 20k unlabelled samples to achieve the corresponding Supervised baseline performance on Yahoo! Answer. On the other hand, Tapt generally outperforms Supervised baselines demonstrating its robustness across various unlabelled sizes.
To further quantify the model performance in case of scarce unlabelled and adequate labelled data, we choose the three lowest unlabelled sizes (the first three columns) excluding the lowest labelled size (the last row) in Figure 3 for each dataset. Our analysis shows that St has 67%, 56% and 54% probability of falling below the Supervised baselines on SST-2, Amazon Review, and Yahoo! Answer respectively. Even on IMDB where St generally performs well, it still has a probability of 33% to fall behind Supervised. In contrast, Tapt never performs worse than Supervised in those cases. We provide computation details and comparative statistics in Appendix §C.
The specific value of adequate unlabelled size boundary for St approaches depends on the nature of the dataset as well as the labelled size. Figure 5 illustrates that as the size of the labelled data increases, St approaches require more unlabelled data to surpass the Supervised baselines. For example, on Amazon Review, St trained with 100 labelled samples requires about 5k unlabelled samples to perform better than Supervised, while St trained with 10k labelled samples requires about 100k unlabelled samples. Adjusting the unlabelled size accordingly might be conducive to exploiting the full potential of St approaches.
#Unl. 10 50 100 500 FlexMatch 57.317.9 35.23.4 45.122.5 33.40.1 AdaMatch 53.322.1 36.86.1 33.50.2 33.60.3
| Train (Lab.) | Train (Unl.) | #Lab. | FlexMatch | AdaMatch | Tapt | Supervised |
| IMDB | IMDB | 100 | 93.40.1 | 94.70.2 | 90.90.6 | 88.70.2 |
| SST-2 | 100 | 89.11.2 (4.6) | 87.62.2 (7.5) | 89.90.6 (1.1) | 88.70.2 | |
| Amazon Review | 100 | 92.10.7 (1.4) | 92.40.2 (2.4) | 91.40.3 (0.6) | 88.70.2 | |
| IMDB | IMDB | 200 | 93.50.1 | 93.60.1 | 91.80.3 | 90.30.4 |
| SST-2 | 200 | 89.52.4 (4.3) | 88.91.0 (5.0) | 90.30.4 (1.6) | 90.30.4 | |
| Amazon Review | 200 | 92.50.4 (1.1) | 92.70.5 (1.0) | 92.10.2 (0.3) | 90.30.4 | |
| SST-2 | SST-2 | 100 | 83.08.3 | 83.14.4 | 85.42.4 | 84.02.7 |
| IMDB | 100 | 46.72.1 (43.7) | 49.27.3 (40.8) | 88.50.9 (3.6) | 84.02.7 | |
| Amazon Review | 100 | 46.44.9 (44.1) | 48.211.0 (42.0) | 88.90.9 (4.1) | 84.02.7 | |
| SST-2 | SST-2 | 200 | 87.23.9 | 89.50.9 | 88.60.9 | 86.80.3 |
| IMDB | 200 | 62.77.4 (28.1) | 61.02.8 (31.8) | 89.11.1 (0.6) | 86.80.3 | |
| Amazon Review | 200 | 61.87.7 (29.1) | 56.010.3 (17.4) | 89.41.0 (0.9) | 86.80.3 |
Task Lab. Unl. Semi-supervised Learning Target Target Unsupervised Domain Adaptation Source Target Self-taught Learning Target Source
#4. Scarce labelled and unlabelled data.
When the labelled data is insufficient, increasing unlabelled size is not helpful or even detrimental to St approaches. This finding is well-illustrated in the last row of results on SST-2 shown in Figure 3. In other words, reducing the size of unlabelled data could be beneficial for St approaches when the labelled size is inadequate. We further zoom in on this phenomenon in Table 3 by selecting 4 fixed labelled and 500 unlabelled samples, and gradually removing unlabelled samples on IMDB. This is a stark contrast to the case where more unlabelled data is beneficial for St approaches when adequate labelled data is available. Meanwhile, Tapt generally benefits from training on more in-domain unlabelled data, following the scaling law in LMs Kaplan et al. (2020); Hoffmann et al. (2022).
#5. Adequate labelled and unlabelled data.
Both St and Tapt have demonstrated the ability to exploit unlabelled data in this setting. Figure 3 shows that St dominates in IMDB when more than 10 labelled and 100 unlabelled samples are available. On the other hand, Tapt generally performs better than St on Amazon Review and Yahoo! Answer, indicating that the answer to which approach is better depends on the nature of the dataset and task. As labelled and unlabelled data size increase, the difference between St and Tapt shrinks (colours fade and lines converge in Figures 3 and 5). As the labelled data in size reaches the unlabelled data, the method of St reduces to Fully-Supervised, which is generally outperformed by Tapt Gururangan et al. (2020).
6 Domain Adaptation
We next investigate how St and Tapt compare in the presence of domain shifts between labelled and unlabelled data in two additional settings (refer to Table 5). First, we experiment with the Unsupervised Domain Adaptation (Uda) setting, where domain shifts exist between the labelled data from a source domain and the unlabelled data from the target domain Ben-David et al. (2010); Saito et al. (2018); Ramponi and Plank (2020). Then, we experiment with Self-taught Learning (Stl) Raina et al. (2007) in a domain adaptation setting, where the unlabelled data come from the source domain and the labelled data from the target domain. In both settings, we use the (labelled) validation and test sets from the target domain. Validation and test sets are excluded from any pool of labelled or unlabelled train data.
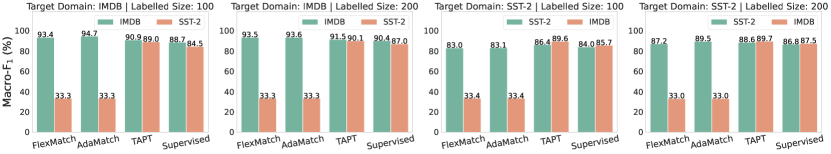
#1. Unsupervised Domain Adaptation (Uda).
In this setting, we use two movie sentiment datasets, IMDB and SST-2, as the source and target domain (and vice versa) with two different sizes of labelled data (i.e. 100 and 200).
Figure 6 depicts the performance of St and Tapt in Uda. In case of domain shifts, we observe that FlexMatch and AdaMatch fail to deliver satisfactory results and their performance drops to the level of random guessing, with a score of 33% across all labelled sizes and datasets. This highlights the vulnerability of St approaches in Uda. In contrast, Tapt demonstrates robust performance even with domain shifts, on par with its own Ssl performance without domain shifts. Additionally, Tapt even benefits from training on the source domain. For instance, training on IMDB (source domain) further improves the performance of Tapt on SST-2 (target domain) from 86.4% to 89.6% with 100 labelled samples and from 88.6% to 89.7% with 200 labelled samples.
#2. Self-taught Learning (Stl).
We select IMDB, SST-2, and Amazon Review for this setting. Although they are all sentiment reviews datasets, IMDB and Amazon Review are more closely related (see the similarity analysis in Table 7 of Appendix) and arguably contain richer language than SST-2 (see examples in Table 6 of Appendix).
Table 4 presents the performance of St and Tapt in Stl setting. We find that domain shifts in unlabelled data consistently hurt the performance of St, depending on the similarity between the source and target domains. The performance of St drops sharply if the source and target domains are vastly different. For example, when SST-2 is used as the labelled data (target domain) and IMDB or Amazon Review is used as unlabelled data (source domain), the performance of St falls from over 80% to around 60% or lower. On the other hand, when using SST-2 and IMDB as the source and target domains, the performance of St drops by a much smaller margin (a few percentage points). This shows the importance of training St approaches using more informative labelled data, which is also consistent with our findings in §5.
Tapt in the Stl setting is in fact a variation of domain adaptive pre-training Beltagy et al. (2019); Gururangan et al. (2020) applied to Ssl tasks. Table 4 shows that the performance of Tapt remains stable when there exist domain shifts in the unlabelled data. Using more informative unlabelled data can further improve the performance of Tapt. For example, using IMDB or Amazon Review as unlabelled data when SST-2 is a target task, we see an improvement of about 4% with 100 labelled samples. However, it is worth noting that St methods can still be competitive compared to Tapt if the source and target domains are relatively similar. For instance, when using Amazon Review and IMDB as the source and target domains, St still achieves better results than Tapt.
7 Related Work
Leveraging unlabelled data by Continuing Pre-training.
Previous work has shown that further pre-training LMs on the unlabelled data of a task (e.g. Alsentzer et al., 2019; Mehri et al., 2020; Margatina et al., 2022) or in-domain data (e.g. Logeswaran et al., 2019; Gururangan et al., 2020; Xue et al., 2021) is beneficial to downstream tasks. However, it is unknown whether this is valid in Ssl settings. Previous studies in computer vision Zoph et al. (2020) and speech recognition Xu et al. (2021a) have compared PT and St. However, our study has a different focus, specifically, we compare Tapt and St in NLP tasks. Concurrently to our work, Shi and Lipani (2023) put forward prompt-based continued pre-training, which primarily aims to enhance the performance of prompt-based fine-tuning techniques Schick and Schütze (2021); Gao et al. (2021). This approach outperforms these state-of-the-art St approaches Sohn et al. (2020); Xu et al. (2021b); Zhang et al. (2021); Berthelot et al. (2022) as well as the conventional CLS-based fine-tuning with Tapt.
Semi-supervised Learning.
Recent work in Ssl has demonstrated great progress in effectively exploiting unlabelled data. A wide range of approaches has been proposed including Pseudo Labeling Lee et al. (2013), Temporal Ensemble Laine and Aila (2017), Mean Teacher Tarvainen and Valpola (2017), Virtual Adversarial Training Miyato et al. (2018), FixMatch Sohn et al. (2020). A major issue for St approaches is confirmation bias, where the student model would accumulate errors from the teacher model when learning with inaccurate pseudo-labels (e.g. Wang et al., 2021; Goel et al., 2022; Chen et al., 2022).
While many efforts towards St (e.g. Ruder and Plank, 2018; Gururangan et al., 2019; Li et al., 2019; Chen et al., 2020b; Meng et al., 2020; Chen et al., 2020a; He et al., 2020; Gera et al., 2022) have been made in NLP, the performance of St approaches across various labelled and unlabelled sizes has yet to be thoroughly explored. Although Mukherjee and Awadallah (2020); Li et al. (2021b) noted that training St approaches from Tapt checkpoints can improve the performance, the performance of Tapt in Ssl tasks has not been either well-researched by previous works or compared with state-of-the-art St approaches.
8 Conclusion
In this work, we shed light on how Tapt performs against state-of-the-art St approaches in various Ssl settings. Our experiments reveal that Tapt achieves strong and robust performance, even with just a few hundred unlabelled examples. We further demonstrate that the St approaches are vulnerable to small amounts of either labelled or unlabelled data. We also find that Tapt is more robust than St approaches in joint domain adaptation and Ssl settings. Overall, our empirical study demonstrates that Tapt is a strong Ssl learner, competitive to more sophisticated St approaches. In future work, we plan to further explore the potential of Tapt with unsupervised learning signals.
Limitations
For easier comparison with previous work, we only focus on text classification tasks, while St can also be applied to a variety of NLP tasks, such as language generation, conversational systems and commonsense reasoning Kedzie and McKeown (2019); He et al. (2020); Shi et al. (2022a, b); Hendriksen et al. (2022). We also assume that the datasets are roughly balanced. However, real-world datasets are usually class-imbalanced Li et al. (2011), which might impact the performance of Tapt and St. While this is out of the scope of this paper, we believe that this is an interesting avenue for future work. Additionally, different labelled and unlabelled sizes may impact the performance of St approaches in the domain shift setting. However, this doesn’t alter our conclusion that the effectiveness of St approaches significantly fluctuates across different scenarios.
References
- Alsentzer et al. (2019) Emily Alsentzer, John Murphy, William Boag, Wei-Hung Weng, Di Jindi, Tristan Naumann, and Matthew McDermott. 2019. Publicly available clinical BERT embeddings. In Proceedings of the 2nd Clinical Natural Language Processing Workshop, pages 72–78, Minneapolis, Minnesota, USA. Association for Computational Linguistics.
- Arazo et al. (2020) Eric Arazo, Diego Ortego, Paul Albert, Noel E O’Connor, and Kevin McGuinness. 2020. Pseudo-labeling and confirmation bias in deep semi-supervised learning. In 2020 International Joint Conference on Neural Networks (IJCNN), pages 1–8. IEEE.
- Artetxe et al. (2018) Mikel Artetxe, Gorka Labaka, and Eneko Agirre. 2018. A robust self-learning method for fully unsupervised cross-lingual mappings of word embeddings. In Proceedings of the 56th Annual Meeting of the Association for Computational Linguistics (Volume 1: Long Papers), pages 789–798, Melbourne, Australia. Association for Computational Linguistics.
- Beltagy et al. (2019) Iz Beltagy, Kyle Lo, and Arman Cohan. 2019. SciBERT: A pretrained language model for scientific text. In Proceedings of the 2019 Conference on Empirical Methods in Natural Language Processing and the 9th International Joint Conference on Natural Language Processing (EMNLP-IJCNLP), pages 3615–3620, Hong Kong, China. Association for Computational Linguistics.
- Ben-David et al. (2010) Shai Ben-David, John Blitzer, Koby Crammer, Alex Kulesza, Fernando Pereira, and Jennifer Wortman Vaughan. 2010. A theory of learning from different domains. Machine learning, 79(1):151–175.
- Bengio et al. (2009) Yoshua Bengio, Jérôme Louradour, Ronan Collobert, and Jason Weston. 2009. Curriculum learning. In Proceedings of the 26th Annual International Conference on Machine Learning, ICML ’09, page 41–48, New York, NY, USA. Association for Computing Machinery.
- Berthelot et al. (2019a) David Berthelot, Nicholas Carlini, Ekin D Cubuk, Alex Kurakin, Kihyuk Sohn, Han Zhang, and Colin Raffel. 2019a. Remixmatch: Semi-supervised learning with distribution alignment and augmentation anchoring. arXiv preprint arXiv:1911.09785.
- Berthelot et al. (2019b) David Berthelot, Nicholas Carlini, Ian J. Goodfellow, Nicolas Papernot, Avital Oliver, and Colin Raffel. 2019b. Mixmatch: A holistic approach to semi-supervised learning. In Advances in Neural Information Processing Systems 32: Annual Conference on Neural Information Processing Systems 2019, NeurIPS 2019, December 8-14, 2019, Vancouver, BC, Canada, pages 5050–5060.
- Berthelot et al. (2022) David Berthelot, Rebecca Roelofs, Kihyuk Sohn, Nicholas Carlini, and Alexey Kurakin. 2022. Adamatch: A unified approach to semi-supervised learning and domain adaptation. In International Conference on Learning Representations.
- Cai and Lapata (2019) Rui Cai and Mirella Lapata. 2019. Semi-supervised semantic role labeling with cross-view training. In Proceedings of the 2019 Conference on Empirical Methods in Natural Language Processing and the 9th International Joint Conference on Natural Language Processing (EMNLP-IJCNLP), pages 1018–1027, Hong Kong, China. Association for Computational Linguistics.
- Chang et al. (2008) Ming-Wei Chang, Lev Ratinov, Dan Roth, and Vivek Srikumar. 2008. Importance of semantic representation: dataless classification. In Proceedings of the 23rd national conference on Artificial intelligence-Volume 2, pages 830–835.
- Chapelle et al. (2009) Olivier Chapelle, Bernhard Scholkopf, and Alexander Zien. 2009. Semi-supervised learning (chapelle, o. et al., eds.; 2006)[book reviews]. IEEE Transactions on Neural Networks, 20(3):542–542.
- Chen et al. (2022) Baixu Chen, Junguang Jiang, Ximei Wang, Pengfei Wan, Jianmin Wang, and Mingsheng Long. 2022. Debiased self-training for semi-supervised learning. In Advances in Neural Information Processing Systems, NIPS’22.
- Chen et al. (2020a) Jiaao Chen, Zhenghui Wang, Ran Tian, Zichao Yang, and Diyi Yang. 2020a. Local additivity based data augmentation for semi-supervised NER. In Proceedings of the 2020 Conference on Empirical Methods in Natural Language Processing (EMNLP), pages 1241–1251, Online. Association for Computational Linguistics.
- Chen et al. (2020b) Jiaao Chen, Zichao Yang, and Diyi Yang. 2020b. MixText: Linguistically-informed interpolation of hidden space for semi-supervised text classification. In Proceedings of the 58th Annual Meeting of the Association for Computational Linguistics, pages 2147–2157, Online. Association for Computational Linguistics.
- Clark et al. (2018) Kevin Clark, Minh-Thang Luong, Christopher D. Manning, and Quoc Le. 2018. Semi-supervised sequence modeling with cross-view training. In Proceedings of the 2018 Conference on Empirical Methods in Natural Language Processing, pages 1914–1925, Brussels, Belgium. Association for Computational Linguistics.
- Devlin et al. (2019) Jacob Devlin, Ming-Wei Chang, Kenton Lee, and Kristina Toutanova. 2019. BERT: Pre-training of deep bidirectional transformers for language understanding. In Proceedings of the 2019 Conference of the North American Chapter of the Association for Computational Linguistics: Human Language Technologies, Volume 1 (Long and Short Papers), Minneapolis, Minnesota. Association for Computational Linguistics.
- Dong and de Melo (2019) Xin Dong and Gerard de Melo. 2019. A robust self-learning framework for cross-lingual text classification. In Proceedings of the 2019 Conference on Empirical Methods in Natural Language Processing and the 9th International Joint Conference on Natural Language Processing (EMNLP-IJCNLP), pages 6306–6310, Hong Kong, China. Association for Computational Linguistics.
- Gao et al. (2021) Tianyu Gao, Adam Fisch, and Danqi Chen. 2021. Making pre-trained language models better few-shot learners. In Proceedings of the 59th Annual Meeting of the Association for Computational Linguistics and the 11th International Joint Conference on Natural Language Processing (Volume 1: Long Papers), pages 3816–3830, Online. Association for Computational Linguistics.
- Gera et al. (2022) Ariel Gera, Alon Halfon, Eyal Shnarch, Yotam Perlitz, Liat Ein-Dor, and Noam Slonim. 2022. Zero-shot text classification with self-training. In Proceedings of the 2022 Conference on Empirical Methods in Natural Language Processing. Association for Computational Linguistics.
- Goel et al. (2022) Arushi Goel, Yunlong Jiao, and Jordan Massiah. 2022. Pars: Pseudo-label aware robust sample selection for learning with noisy labels. arXiv preprint arXiv:2201.10836.
- Grandvalet and Bengio (2004) Yves Grandvalet and Yoshua Bengio. 2004. Semi-supervised learning by entropy minimization. Advances in neural information processing systems, 17.
- Gururangan et al. (2019) Suchin Gururangan, Tam Dang, Dallas Card, and Noah A. Smith. 2019. Variational pretraining for semi-supervised text classification. In Proceedings of the 57th Annual Meeting of the Association for Computational Linguistics, pages 5880–5894, Florence, Italy. Association for Computational Linguistics.
- Gururangan et al. (2020) Suchin Gururangan, Ana Marasović, Swabha Swayamdipta, Kyle Lo, Iz Beltagy, Doug Downey, and Noah A. Smith. 2020. Don’t stop pretraining: Adapt language models to domains and tasks. In Proceedings of the 58th Annual Meeting of the Association for Computational Linguistics, pages 8342–8360, Online. Association for Computational Linguistics.
- He et al. (2020) Junxian He, Jiatao Gu, Jiajun Shen, and Marc’Aurelio Ranzato. 2020. Revisiting self-training for neural sequence generation. In International Conference on Learning Representations.
- Hendriksen et al. (2022) Mariya Hendriksen, Maurits Bleeker, Svitlana Vakulenko, Nanne van Noord, Ernst Kuiper, and Maarten de Rijke. 2022. Extending clip for category-to-image retrieval in e-commerce. In Advances in Information Retrieval: 44th European Conference on IR Research, ECIR 2022, Stavanger, Norway, April 10–14, 2022, Proceedings, Part I, page 289–303, Berlin, Heidelberg. Springer-Verlag.
- Hoffmann et al. (2022) Jordan Hoffmann, Sebastian Borgeaud, Arthur Mensch, Elena Buchatskaya, Trevor Cai, Eliza Rutherford, Diego de Las Casas, Lisa Anne Hendricks, Johannes Welbl, Aidan Clark, et al. 2022. Training compute-optimal large language models. arXiv preprint arXiv:2203.15556.
- Hou et al. (2022) Zejiang Hou, Julian Salazar, and George Polovets. 2022. Meta-Learning the Difference: Preparing Large Language Models for Efficient Adaptation. Transactions of the Association for Computational Linguistics, 10:1249–1265.
- Howard and Ruder (2018) Jeremy Howard and Sebastian Ruder. 2018. Universal language model fine-tuning for text classification. In Proceedings of the 56th Annual Meeting of the Association for Computational Linguistics (Volume 1: Long Papers), pages 328–339, Melbourne, Australia. Association for Computational Linguistics.
- Kaplan et al. (2020) Jared Kaplan, Sam McCandlish, Tom Henighan, Tom B Brown, Benjamin Chess, Rewon Child, Scott Gray, Alec Radford, Jeffrey Wu, and Dario Amodei. 2020. Scaling laws for neural language models. arXiv preprint arXiv:2001.08361.
- Kedzie and McKeown (2019) Chris Kedzie and Kathleen McKeown. 2019. A good sample is hard to find: Noise injection sampling and self-training for neural language generation models. In Proceedings of the 12th International Conference on Natural Language Generation, pages 584–593, Tokyo, Japan. Association for Computational Linguistics.
- Kipf and Welling (2017) Thomas N. Kipf and Max Welling. 2017. Semi-supervised classification with graph convolutional networks. In International Conference on Learning Representations (ICLR).
- Laine and Aila (2017) Samuli Laine and Timo Aila. 2017. Temporal ensembling for semi-supervised learning. In 5th International Conference on Learning Representations, ICLR 2017, Toulon, France, April 24-26, 2017, Conference Track Proceedings. OpenReview.net.
- Lee et al. (2013) Dong-Hyun Lee et al. 2013. Pseudo-label: The simple and efficient semi-supervised learning method for deep neural networks. In Workshop on challenges in representation learning, ICML, page 896.
- Li et al. (2021a) Changchun Li, Ximing Li, and Jihong Ouyang. 2021a. Semi-supervised text classification with balanced deep representation distributions. In Proceedings of the 59th Annual Meeting of the Association for Computational Linguistics and the 11th International Joint Conference on Natural Language Processing (Volume 1: Long Papers), pages 5044–5053, Online. Association for Computational Linguistics.
- Li et al. (2021b) Shiyang Li, Semih Yavuz, Wenhu Chen, and Xifeng Yan. 2021b. Task-adaptive pre-training and self-training are complementary for natural language understanding. In Findings of the Association for Computational Linguistics: EMNLP 2021, pages 1006–1015, Punta Cana, Dominican Republic. Association for Computational Linguistics.
- Li et al. (2011) Shoushan Li, Zhongqing Wang, Guodong Zhou, and Sophia Yat Mei Lee. 2011. Semi-supervised learning for imbalanced sentiment classification. In Proceedings of the Twenty-Second International Joint Conference on Artificial Intelligence - Volume Volume Three, IJCAI’11, page 1826–1831. AAAI Press.
- Li et al. (2019) Zhenghua Li, Xue Peng, Min Zhang, Rui Wang, and Luo Si. 2019. Semi-supervised Domain Adaptation for Dependency Parsing. In Proceedings of the 57th Annual Meeting of the Association for Computational Linguistics, pages 2386–2395, Florence, Italy. Association for Computational Linguistics.
- Liu et al. (2019) Yinhan Liu, Myle Ott, Naman Goyal, Jingfei Du, Mandar Joshi, Danqi Chen, Omer Levy, Mike Lewis, Luke Zettlemoyer, and Veselin Stoyanov. 2019. Roberta: A robustly optimized bert pretraining approach. arXiv preprint arXiv:1907.11692.
- Logeswaran et al. (2019) Lajanugen Logeswaran, Ming-Wei Chang, Kenton Lee, Kristina Toutanova, Jacob Devlin, and Honglak Lee. 2019. Zero-shot entity linking by reading entity descriptions. In Proceedings of the 57th Annual Meeting of the Association for Computational Linguistics, pages 3449–3460, Florence, Italy. Association for Computational Linguistics.
- Maas et al. (2011) Andrew L. Maas, Raymond E. Daly, Peter T. Pham, Dan Huang, Andrew Y. Ng, and Christopher Potts. 2011. Learning word vectors for sentiment analysis. In Proceedings of the 49th Annual Meeting of the Association for Computational Linguistics: Human Language Technologies, pages 142–150, Portland, USA. Association for Computational Linguistics.
- Margatina et al. (2022) Katerina Margatina, Loic Barrault, and Nikolaos Aletras. 2022. On the importance of effectively adapting pretrained language models for active learning. In Proceedings of the 60th Annual Meeting of the Association for Computational Linguistics (Volume 2: Short Papers), pages 825–836, Dublin, Ireland. Association for Computational Linguistics.
- McAuley and Leskovec (2013) Julian McAuley and Jure Leskovec. 2013. Hidden factors and hidden topics: Understanding rating dimensions with review text. In Proceedings of the 7th ACM Conference on Recommender Systems, RecSys ’13, page 165–172, New York, NY, USA. Association for Computing Machinery.
- McClosky et al. (2006) David McClosky, Eugene Charniak, and Mark Johnson. 2006. Effective self-training for parsing. In Proceedings of the Human Language Technology Conference of the NAACL, Main Conference, pages 152–159, New York City, USA. Association for Computational Linguistics.
- Mehri et al. (2020) Shikib Mehri, Mihail Eric, and Dilek Z. Hakkani-Tür. 2020. Dialoglue: A natural language understanding benchmark for task-oriented dialogue. ArXiv, abs/2009.13570.
- Meng et al. (2020) Yu Meng, Yunyi Zhang, Jiaxin Huang, Chenyan Xiong, Heng Ji, Chao Zhang, and Jiawei Han. 2020. Text classification using label names only: A language model self-training approach. In Proceedings of the 2020 Conference on Empirical Methods in Natural Language Processing (EMNLP), pages 9006–9017, Online. Association for Computational Linguistics.
- Miyato et al. (2018) Takeru Miyato, Shin-ichi Maeda, Masanori Koyama, and Shin Ishii. 2018. Virtual adversarial training: a regularization method for supervised and semi-supervised learning. IEEE transactions on pattern analysis and machine intelligence, 41:1979–1993.
- Mukherjee and Awadallah (2020) Subhabrata Mukherjee and Ahmed Awadallah. 2020. Uncertainty-aware self-training for few-shot text classification. In Advances in Neural Information Processing Systems, volume 33, pages 21199–21212. Curran Associates, Inc.
- Ott et al. (2019) Myle Ott, Sergey Edunov, Alexei Baevski, Angela Fan, Sam Gross, Nathan Ng, David Grangier, and Michael Auli. 2019. fairseq: A fast, extensible toolkit for sequence modeling. In Proceedings of NAACL-HLT 2019: Demonstrations.
- Radford et al. (2019) Alec Radford, Jeffrey Wu, Rewon Child, David Luan, Dario Amodei, Ilya Sutskever, et al. 2019. Language models are unsupervised multitask learners. OpenAI blog, 1(8).
- Raina et al. (2007) Rajat Raina, Alexis Battle, Honglak Lee, Benjamin Packer, and Andrew Y. Ng. 2007. Self-taught learning: Transfer learning from unlabeled data. In Proceedings of the 24th International Conference on Machine Learning, ICML ’07, page 759–766, New York, NY, USA. Association for Computing Machinery.
- Ramponi and Plank (2020) Alan Ramponi and Barbara Plank. 2020. Neural Unsupervised Domain Adaptation in NLP—A Survey. In Proceedings of the 28th International Conference on Computational Linguistics, pages 6838–6855, Barcelona, Spain (Online). International Committee on Computational Linguistics.
- Ruder and Plank (2018) Sebastian Ruder and Barbara Plank. 2018. Strong Baselines for Neural Semi-Supervised Learning under Domain Shift. In Proceedings of the 56th Annual Meeting of the Association for Computational Linguistics (Volume 1: Long Papers), pages 1044–1054, Melbourne, Australia. Association for Computational Linguistics.
- Saito et al. (2018) Kuniaki Saito, Kohei Watanabe, Yoshitaka Ushiku, and Tatsuya Harada. 2018. Maximum classifier discrepancy for unsupervised domain adaptation. In Proceedings of the IEEE conference on computer vision and pattern recognition, pages 3723–3732.
- Schick and Schütze (2021) Timo Schick and Hinrich Schütze. 2021. Exploiting cloze-questions for few-shot text classification and natural language inference. In Proceedings of the 16th Conference of the European Chapter of the Association for Computational Linguistics: Main Volume, pages 255–269, Online. Association for Computational Linguistics.
- Shi et al. (2022a) Zhengxiang Shi, Yue Feng, and Aldo Lipani. 2022a. Learning to execute actions or ask clarification questions. In Findings of the Association for Computational Linguistics: NAACL 2022, pages 2060–2070, Seattle, United States. Association for Computational Linguistics.
- Shi and Lipani (2023) Zhengxiang Shi and Aldo Lipani. 2023. Don’t stop pretraining? make prompt-based fine-tuning powerful learner. arXiv preprint arXiv:2305.01711.
- Shi et al. (2022b) Zhengxiang Shi, Qiang Zhang, and Aldo Lipani. 2022b. Stepgame: A new benchmark for robust multi-hop spatial reasoning in texts. In Proceedings of the AAAI Conference on Artificial Intelligence, volume 36, pages 11321–11329.
- Sohn et al. (2020) Kihyuk Sohn, David Berthelot, Chun-Liang Li, Zizhao Zhang, Nicholas Carlini, Ekin D. Cubuk, Alex Kurakin, Han Zhang, and Colin Raffel. 2020. Fixmatch: Simplifying semi-supervised learning with consistency and confidence. In Proceedings of the 34th International Conference on Neural Information Processing Systems, NIPS’20, Red Hook, NY, USA. Curran Associates Inc.
- Tarvainen and Valpola (2017) Antti Tarvainen and Harri Valpola. 2017. Mean teachers are better role models: Weight-averaged consistency targets improve semi-supervised deep learning results. In Proceedings of the 31st International Conference on Neural Information Processing Systems, NIPS’17, page 1195–1204, Red Hook, NY, USA. Curran Associates Inc.
- Wang et al. (2018) Alex Wang, Amanpreet Singh, Julian Michael, Felix Hill, Omer Levy, and Samuel Bowman. 2018. GLUE: A multi-task benchmark and analysis platform for natural language understanding. In Proceedings of the 2018 EMNLP Workshop BlackboxNLP: Analyzing and Interpreting Neural Networks for NLP, pages 353–355, Brussels, Belgium. Association for Computational Linguistics.
- Wang et al. (2021) Ximei Wang, Jinghan Gao, Mingsheng Long, and Jianmin Wang. 2021. Self-tuning for data-efficient deep learning. In International Conference on Machine Learning (ICML).
- Wang et al. (2022) Yidong Wang, Hao Chen, Yue Fan, Wang SUN, Ran Tao, Wenxin Hou, Renjie Wang, Linyi Yang, Zhi Zhou, Lan-Zhe Guo, Heli Qi, Zhen Wu, Yu-Feng Li, Satoshi Nakamura, Wei Ye, Marios Savvides, Bhiksha Raj, Takahiro Shinozaki, Bernt Schiele, Jindong Wang, Xing Xie, and Yue Zhang. 2022. USB: A unified semi-supervised learning benchmark for classification. In Thirty-sixth Conference on Neural Information Processing Systems Datasets and Benchmarks Track.
- Xie et al. (2020a) Qizhe Xie, Zihang Dai, Eduard Hovy, Minh-Thang Luong, and Quoc V. Le. 2020a. Unsupervised data augmentation for consistency training. In Proceedings of the 34th International Conference on Neural Information Processing Systems, NIPS’20, Red Hook, NY, USA. Curran Associates Inc.
- Xie et al. (2020b) Qizhe Xie, Minh-Thang Luong, Eduard Hovy, and Quoc V Le. 2020b. Self-training with noisy student improves imagenet classification. In Proceedings of the IEEE/CVF conference on computer vision and pattern recognition, pages 10687–10698.
- Xu et al. (2021a) Qiantong Xu, Alexei Baevski, Tatiana Likhomanenko, Paden Tomasello, Alexis Conneau, Ronan Collobert, Gabriel Synnaeve, and Michael Auli. 2021a. Self-training and pre-training are complementary for speech recognition. In ICASSP 2021-2021 IEEE International Conference on Acoustics, Speech and Signal Processing (ICASSP), pages 3030–3034. IEEE.
- Xu et al. (2021b) Yi Xu, Lei Shang, Jinxing Ye, Qi Qian, Yu-Feng Li, Baigui Sun, Hao Li, and Rong Jin. 2021b. Dash: Semi-supervised learning with dynamic thresholding. In International Conference on Machine Learning, pages 11525–11536. PMLR.
- Xue et al. (2021) Linting Xue, Noah Constant, Adam Roberts, Mihir Kale, Rami Al-Rfou, Aditya Siddhant, Aditya Barua, and Colin Raffel. 2021. mT5: A massively multilingual pre-trained text-to-text transformer. In Proceedings of the 2021 Conference of the North American Chapter of the Association for Computational Linguistics: Human Language Technologies, pages 483–498, Online. Association for Computational Linguistics.
- Yarowsky (1995) David Yarowsky. 1995. Unsupervised word sense disambiguation rivaling supervised methods. In 33rd Annual Meeting of the Association for Computational Linguistics, pages 189–196, Cambridge, Massachusetts, USA. Association for Computational Linguistics.
- Zhang et al. (2021) Bowen Zhang, Yidong Wang, Wenxin Hou, Hao Wu, Jindong Wang, Manabu Okumura, and Takahiro Shinozaki. 2021. Flexmatch: Boosting semi-supervised learning with curriculum pseudo labeling. In Proceedings of the 35th International Conference on Neural Information Processing Systems, volume 34.
- Zhang et al. (2015) Xiang Zhang, Junbo Zhao, and Yann LeCun. 2015. Character-level convolutional networks for text classification. In Proceedings of the 28th International Conference on Neural Information Processing Systems - Volume 1, NIPS’15, page 649–657, Cambridge, MA, USA. MIT Press.
- Zoph et al. (2020) Barret Zoph, Golnaz Ghiasi, Tsung-Yi Lin, Yin Cui, Hanxiao Liu, Ekin D. Cubuk, and Quoc V. Le. 2020. Rethinking pre-training and self-training. In Proceedings of the 34th International Conference on Neural Information Processing Systems, NIPS’20, Red Hook, NY, USA. Curran Associates Inc.
Appendix Overview
The appendix is structured as follows:
Appendix §A
Appendix §B
presents a brief description of state-of-the-art St approaches.
Appendix §C
includes a supplementary Table that examines the effect of low unlabelled data sizes.
Appendix §D
presents additional experiments to verify our findings using other St approaches.
Appendix §E
includes additional experiments to train St approaches using Tapt checkpoints.
Appendix §F
provides implementation details and hyperparameters for Tapt, St, and Ft methods used in our experiments.
Appendix A Datasets
In this section, we briefly introduce the datasets used in our work and provide additional analysis of the similarity among them. Specifically, we provide four examples to demonstrate the overlap between IMDB and Amazon Review, as a supplement to our domain adaptation analysis (§6).
A.1 Description
In this section, we briefly introduce IMDB, SST-2, AG News, Amazon Review, and Yahoo! Answer datasets. Table 6 list examples for each dataset.
IMDB.
The IMDB dataset Maas et al. (2011) contains a collection of reviews from the Internet Movie Database, with no more than 30 reviews per movie. This dataset contains an equal number of positive and negative reviews, yielding a 33% Marco- score for random guessing. There are and for training and testing, respectively. We follow Wang et al. (2022) to split the dataset by selecting samples and samples per class from the train set to form a train and validation set, respectively.
SST-2.
The SST-2 dataset Wang et al. (2018) consists of sentences from movie reviews and human annotations of their sentiment. The task is to predict the sentiment of a given sentence. Similar to IMDB, this is also a binary classification task. There are and for training and testing. We select and samples from the train set to form a train and validation set, respectively, where the validation set contains and samples for two classes, respectively.
AG News.
The AG News topic classification dataset is constructed by Zhang et al. (2015), where 4 classes are used. Each class contains training samples and test samples. We follow Wang et al. (2022) to split the dataset by selecting samples and samples per class from the train set samples to form a train and validation set, respectively.
Amazon Review.
The Amazon Review dataset McAuley and Leskovec (2013) is a sentiment classification dataset, with five classes. There are train samples and test samples per class. We follow Wang et al. (2022) to split the dataset by selecting samples and samples per class from the train set samples to form a train and validation set, respectively.
Yahoo! Answer.
The Yahoo! Answer dataset Chang et al. (2008) is a topic classification dataset, with ten classes. There are train samples and test samples per class. We follow Wang et al. (2022) to split the dataset by selecting samples and samples per class from the train set samples to form a train and validation set, respectively.
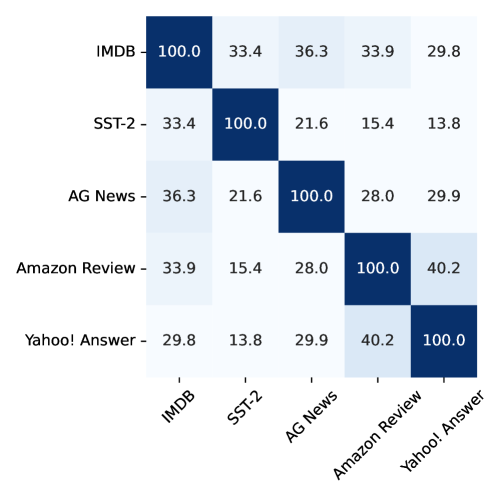
A.2 Dataset Similarity
We provide an analysis of the vocabulary overlap of the datasets, as shown in Figure 7. Additionally, in Table 7, we provide some examples to illustrate the overlap between IMDB and Amazon Review.
As shown in Table 6, although both the SST-2 and IMDB datasets are sentiment analysis tasks for movie reviews, the SST-2 datasets contain shorter and vaguer sentences than the IMDB dataset. This difference could be a potential reason for poor performance of St approaches in the Uda setting (§6). In contrast, the Amazon Review dataset, which is a product review sentiment analysis dataset, is more similar to the IMDB dataset than the SST-2 dataset, as shown in Table 7. This suggests a potential reason for the performance of St and Tapt in the Stl setting (§6).
Appendix B St Frameworks
VAT.
VAT Miyato et al. (2018) proposed a regularization technique that forces pairs of data points that are very close in the input space to be close to each other in the output space. VAT adds small perturbation to the input data and forces the model to produce similar predictions.
FixMatch.
FixMatch Sohn et al. (2020) generates artificial labels using both consistency regularization and pseudo-labelling, where the artificial labels are produced based on weakly-augmented unlabelled data. These artificial labels are then used as targets to train the model on strongly-augmented unlabelled data. FixMatch only retains an artificial label if the model assigns a high probability to one of the possible classes.
Dash.
Dash Xu et al. (2021b) extends FixMatch by introducing a mechanism with a dynamically adjusted threshold of loss to select a subset of training examples from the unlabelled data for performing Ssl.
FlexMatch.
AdaMatch.
AdaMatch Berthelot et al. (2022) aims to solve domain adaptation problems in Ssl and build a high-accuracy model that trains on and tests on different data distributions. AdaMatch builds on FixMatch and introduces a relative confidence threshold and a modified distribution alignment from Berthelot et al. (2019a).
Appendix C Probability of performing worsen than Supervised.
In §5, we discuss that we select the model performance with the three lowest unlabelled sizes (the first three columns in Figure 3) for each dataset and exclude the model performance with the lowest labelled size (the last row in Figure 3). This results in 9 cells in IMDB, 3 cells in SST-2, 9 cells in Amazon Review, and 12 cells in Yahoo! Answer, where Tapt has one run per cell and St (FlexMatch and AdaMatch) has two runs per cell. We consider a run to be a failure if its performance is worse than its corresponding Supervised baseline.
Table 8 lists the probability of St and Tapt of falling below the Supervised baseline with selected combinations of labelled and unlabelled sizes.
Appendix D Further validations with other St approaches
In this section, we conduct additional experiments on St approaches, including VAT, Dash, and FixMatch to demonstrate that our findings are applicable to other St approaches as well.
In Table 9, we select several combinations of labelled and unlabelled sizes on IMDB, SST-2, Amazon Review, and Yahoo! Answer datasets. Our experimental results show that other St approaches do not perform well when the labelled size is low, and that other St approaches have a high probability to perform worsen than Supervised baselines when the unlabelled size is low. This suggests that poor performance when the labelled or unlabelled size is inadequate may be a common problem of state-of-the-art St approaches.
Appendix E Train St approaches with Tapt checkpoints
Previous works Mukherjee and Awadallah (2020); Li et al. (2021b) have suggested that training St approaches from a Tapt checkpoint may be beneficial. Here we also provide some additional experiments to train St approaches with Tapt checkpoints to further corroborate our findings.
Table 10 shows that Tapt outperforms AdaMatch +Tapt or FlexMatch +Tapt with two different labelled sizes on the Yahoo! Answer dataset.
Table 11 shows that training St approaches from Tapt checkpoints could improve the performance of St but cannot solve the issue of St approaches when labelled or unlabelled data is not adequate. Specifically, the performance of St +Tapt is still poor when labelled data is insufficient, as discussed in §5. Meanwhile, in Table 11, the performance of St +Tapt could be outperformed by the Supervised baselines when unlabelled data is inadequate, while Tapt consistently outperforms the Supervised baselines. When the labelled size is 10, the performance of St trained with fewer unlabelled samples tends to be better, indicating that reducing the number of unlabelled data can be helpful, as discussed in §5.
Appendix F Implementation Details
We consistently use five random seeds, ranging from 1 to 5, for all algorithms. The sampled labelled data is the same for all algorithms for a given seed. The development and test sets remain unchanged for all different labelled and unlabelled data sizes.
Our model implementation uses open-source libraries including HuggingFace Transformers222https://huggingface.co, Fairseq333https://github.com/facebookresearch/fairseq, and USB444https://github.com/microsoft/Semi-supervised-learning. Our experiments of Tapt are performed on 8x32GB V100 GPUs, with a batch size of 16 per device and 2 gradient accumulation steps.
Table 12 lists the hyperparameters used for the Tapt phrase. Table 13 lists the hyperparameters used for the fine-tuning phrase. Table 14 lists the hyperparameters used for St approaches.
Dataset Example IMDB I watched this movie after seeing other comments on IMDb, even convincing my wife that it was a "unique horror movie." I wanted to like this movie, but was unable to.The "love story" was good, but the horror aspect was quite bad. If the story was just about a young man who fell in love with a girl suffering from parasomnia, then it would have been a better movie.The care centre stretched credulity well past the limits, in fact it was quite ridiculous. The doctor happily ignors privacy laws and professionalism. A nurse goes into a room for a routine feeding of a dangerous patient (without security escort), and drops the tray and runs out of the room screaming for no apparent reason. The forensic patient (and the film’s villain) is tied up in a standing position fully clothed - apparently for years? None of it makes much sense.The movie even had some actors that I’ve liked in other things, such as the detectives, but still I can’t recommend this movie. SST-2 a rewarding work of art for only the most patient and challenge-hungry moviegoers. AG News Teen flies in plane #39;s landing gearA homeless teenager who hid in the landing gear of a passenger plane survived a 700-kilometre flight across south-western China but his companion fell and probably died, state media reported on Friday. Amazon Review THIS is MUSIC at its BESTRob Dougan has done it. He’s crafted musical perfection, or close to it anyway. I have finally found the music I’ve been waiting for my whole life in this album - Rob D you are a genius. I think a lot of us wanted to know more about this guy as soon as we heard the track playing to the "Woman in the Red Dress" scene. Now I know why the Wachowski brothers have enlisted his musical talents to flesh out their movies.I know I should be trying to write a more helpful, objective review but I can do nothing but wax poetic for Rob Dougan and his debut album. He has mixed classical melodies with awesome electric beats and it all comes together in an audio orgy. Just buy the album already and let’s get Rob some more mainstream recognition. Yahoo! Answer Does anybody know a great deal about angels? I’m looking for names, if they’re good or bad, what they look like, etc. The more detail the better. All religions accepted
| IMDB | Amazon Review |
| I loved this movie since I was 7 and I saw it on the opening day. It was so touching and beautiful. I strongly recommend seeing for all. It’s a movie to watch with your family by far. My MPAA rating: PG-13 for thematic elements, prolonged scenes of disastor, nudity/sexuality and some language. | This is a very touching, spiritual movie! When I first saw this film, […]. I was deeply moved by this motion picture, and the DVD brings the story to your own home. The bonus materials could be better, but the main part of the DVD is the actual movie. Great, great, great film… […] |
| Pacino is over-the-top but to good effect as he’s clearly having loads of fun. Beatty is great […] The lighting, velvet overtones and smog/smoke combine to create a great effect.There are some really funny cameos […] Highly recommended. 4.5/5 stars. […] | Makes a great gift! We bought this book for my dad for Father’s Day this year, and thought he would have fun reading it since he has four granddaughters. He loved it and has even selected stories to read to the girls during over-nights with Grandpa and Grandma. I highly recommend it as a great gift. |
| The late […] scripted this tale of terror and it was absolutely one of the scariest movies I ever saw as a kid. (I had to walk MILES just to see a movie, and it was usually dark when I emerged from the theater; seeing a horror movie was always unnerving […] | Movia … please …. This movie is a masterpiece of terror & suspence & Beautifully filmed & acted.Comparisons to reality are not allowed when reviewing films of this caliber. Your reaction (though it MAY be sarcastic) is EXACT proof of it’s genius! Watch it again…and this time….bask in all it’s glory! |
| Fabulous actors, beautiful scenery, stark reality […] I tried to buy the video for several years, finally bought it used from a video store that went out of business. But Yippee! The DVD is now for sale, I purchased it on amazon.com. Not cheap, but well worth it to me. […] | Well worth the import price. My first impression of this album was a good one, but as time went on it came to grow on me more and more. This is certainly one of the better Costes albums. The mixing is nothing revolutionary, but it is well done and all tracks flow into each other very well. […]. |
Task #Unl. #Lab. Prob. of St Failure Prob. of Tapt Failure IMDB 100, 500, 2k 10, 20, 200, 1k 6/18 (33%) 0/9 (0%) SST-2 100, 500, 2k 40, 200, 1k, 5k 4/6 (67%) 0/3 (0%) Amazon Review 1k, 5k, 20k 100, 500, 2k, 10k 10/18 (56%) 0/9 (0%) Yahoo! Answer 1k, 5k, 20k 20, 100, 500, 2k, 10k 13/24 (54%) 0/12 (0%)
| Dataset | #Unl. | #Lab. | VAT | FixMatch | Dash | FlexMatch | AdaMatch | Tapt | Supervised |
| IMDB | 100 | 4 | 33.50.2 | 33.40.1 | 33.40.1 | 35.74.2 | 34.10.7 | 61.86.7 | 59.44.8 |
| 100 | 10 | 61.620.1 | 45.421.6 | 34.72.2 | 49.019.9 | 52.421.0 | 75.56.9 | 71.88.5 | |
| 100 | 20 | 87.12.2 | 64.616.5 | 67.816.6 | 85.52.9 | 79.17.6 | 85.51.0 | 84.11.9 | |
| 500 | 4 | 33.40.0 | 33.40.1 | 33.40.1 | 33.40.1 | 33.60.3 | 63.47.2 | 58.27.1 | |
| 2k | 4 | 33.30.0 | 33.30.0 | 33.30.0 | 33.30.0 | 33.30.0 | 63.16.2 | 60.95.6 | |
| 10k | 4 | 33.30.0 | 33.50.3 | 33.30.0 | 34.01.2 | 33.60.4 | 64.18.9 | 62.47.9 | |
| 23k | 4 | 33.30.0 | 33.30.0 | 57.429.4 | 45.323.9 | 33.30.0 | 68.85.6 | 65.610.4 | |
| SST-2 | 100 | 40 | 63.310.6 | 46.99.7 | 47.97.0 | 57.24.5 | 51.014.0 | 78.72.5 | 76.43.7 |
| 500 | 40 | 55.716.8 | 53.88.9 | 51.210.0 | 67.710.7 | 59.111.4 | 83.34.8 | 72.97.9 | |
| 500 | 200 | 83.01.6 | 84.52.8 | 82.63.5 | 83.83.0 | 87.41.9 | 88.80.9 | 88.30.9 | |
| 2k | 40 | 55.924.2 | 36.43.0 | 35.32.0 | 56.66.7 | 49.313.8 | 79.35.9 | 71.78.2 | |
| 10k | 40 | 73.520.5 | 38.911.4 | 35.62.6 | 56.912.5 | 36.22.9 | 85.91.0 | 78.57.5 | |
| 60k | 40 | 79.613.4 | 32.61.7 | 33.40.6 | 40.67.7 | 42.613.3 | 82.64.0 | 75.37.2 | |
| Amazon Review | 1k | 20 | 13.55.2 | 14.95.6 | 20.33.0 | 25.83.2 | 20.71.1 | 32.01.8 | 32.52.2 |
| 1k | 100 | 46.12.2 | 36.33.1 | 35.36.2 | 43.41.7 | 40.32.2 | 48.50.9 | 48.22.2 | |
| 1k | 500 | 52.60.2 | 50.81.5 | 49.51.0 | 54.11.0 | 52.81.1 | 55.90.3 | 55.30.5 | |
| 5k | 20 | 15.57.8 | 13.53.3 | 22.25.2 | 23.27.3 | 16.96.9 | 32.83.4 | 32.32.5 | |
| 20k | 20 | 19.37.5 | 15.23.9 | 20.56.4 | 19.110.0 | 19.36.3 | 32.03.2 | 31.63.6 | |
| 100k | 20 | 14.17.3 | 11.92.9 | 20.75.2 | 15.32.6 | 12.53.7 | 30.73.6 | 30.83.9 | |
| 250k | 20 | 10.35.0 | 10.93.6 | 22.05.7 | 22.74.9 | 14.45.6 | 30.22.4 | 32.13.1 | |
| Yahoo! Answer | 1k | 10 | 1.90.1 | 2.00.1 | 4.62.9 | 15.72.6 | 18.87.9 | 29.65.8 | 23.54.5 |
| 1k | 20 | 6.72.8 | 10.14.2 | 9.63.2 | 32.79.1 | 28.85.8 | 38.94.1 | 34.13.6 | |
| 1k | 100 | 55.21.7 | 46.94.4 | 45.33.7 | 54.21.4 | 53.91.3 | 59.70.8 | 57.41.6 | |
| 1k | 500 | 59.20.4 | 61.60.6 | 60.71.3 | 61.91.1 | 61.50.9 | 65.80.3 | 65.50.2 | |
| 5k | 10 | 1.80.0 | 3.22.6 | 3.72.7 | 16.410.8 | 17.811.7 | 31.45.1 | 25.73.9 | |
| 20k | 10 | 2.40.9 | 2.00.3 | 4.93.1 | 7.34.7 | 25.212.2 | 32.45.6 | 27.24.4 | |
| 100k | 10 | 2.30.6 | 3.82.5 | 3.42.9 | 2.91.1 | 17.711.4 | 30.83.8 | 28.05.0 | |
| 500k | 10 | 2.00.4 | 1.80.0 | 2.61.2 | 2.50.9 | 14.36.0 | 27.34.6 | 24.74.8 |
Yahoo! Answer 500 2000 AdaMatch 68.00.7 69.50.3 + Tapt 68.21.0 69.80.3 FlexMatch 66.60.7 68.70.4 + Tapt 66.71.2 69.00.5 Supervised 65.40.3 68.50.3 + Tapt 68.80.7 71.50.3 Fully-Supervised. 75.30.2 + Tapt 75.40.1
| Dataset | #Unl. | #Lab. | FlexMatch + Tapt | FlexMatch | Tapt | Supervised |
| Yahoo! Answer | 1k | 10 | 17.04.9 | 15.72.6 | 29.65.8 | 23.54.5 |
| 1k | 20 | 39.42.0 | 32.79.1 | 38.94.1 | 34.13.6 | |
| 1k | 100 | 55.21.8 | 54.21.4 | 59.70.8 | 57.41.6 | |
| 1k | 500 | 62.00.7 | 61.91.1 | 65.80.3 | 65.50.2 | |
| 20k | 10 | 4.01.4 | 7.34.7 | 32.45.6 | 27.24.4 | |
| 100k | 10 | 5.16.1 | 2.91.1 | 30.83.8 | 28.05.0 | |
| 500k | 10 | 2.51.1 | 2.50.9 | 27.34.6 | 24.74.8 |
| Hyperparameter | Assignment |
| number of steps | 100 epochs |
| batch size | 256 |
| maximum learning rate | 1e-06, 1e-4 |
| learning rate optimizer | AdamW |
| Adam epsilon | 1e-6 |
| Adam beta weights | 0.9, 0.98 |
| learning rate scheduler | Warmup linear |
| Weight decay | 0.01 |
| Warmup proportion | 0.06 |
| learning rate decay | linear |
| Hyperparameter | Assignment |
| number of steps | 10 or 50 epochs |
| batch size | 16 or 32 |
| maximum learning rate | 2e-05 |
| learning rate optimizer | AdamW |
| maximum sequence length | 256 |
| learning rate scheduler | Warmup linear |
| Warmup proportion | 0.06 |
| learning rate decay | linear |
| Hyperparameter | Assignment |
| number of steps | or steps |
| batch size | 16 |
| maximum learning rate | 2e-05 |
| learning rate optimizer | AdamW |
| maximum sequence length | 256 |
| learning rate scheduler | Warmup linear |
| Warmup proportion | 0.05 |
| learning rate decay | linear |