On Bias and Fairness in NLP: How to have fairer text classification?
Abstract
In this paper, we provide a holistic analysis of the different sources of bias, Upstream, Sample and Overampflication biases, in NLP models. We investigate how they impact the fairness of the task of text classification. We also investigate the impact of removing these biases using different debiasing techniques on the fairness of text classification. We found that overamplification bias is the most impactful bias on the fairness of text classification. And that removing overamplification bias by fine-tuning the LM models on a dataset with balanced representations of the different identity groups leads to fairer text classification models. Finally, we build on our findings and introduce practical guidelines on how to have a fairer text classification model.
1 Introduction
Recent research has shown that natural language processing (NLP) models are biased and systematically discriminate between people based on factors like ethnicity, gender, and others Nangia et al. (2020); Elsafoury et al. (2022). The literature suggests four main sources of bias that have an impact on the fairness of NLP models: Label bias, Representation bias, sample bias, and Overamplification bias Shah et al. (2020); Hovy and Prabhumoye (2021). In the NLP literature, these sources of bias are typically categorized as Upstream bias, which includes representation bias, and Downstream bias, which includes Label, Sample and Overampflication bias.
The focus of studying bias in the NLP literature has been mainly on upstream bias and how it impacts the fairness of NLP models Cao et al. (2022); Kaneko et al. (2022); Steed et al. (2022). In this work, we provide a holistic analysis of the different sources of bias and their impact on the fairness of the task of text classification. We first investigate the impact of upstream bias and its removal on the fairness of the task of text classification. Then, we investigate the impact of downstream bias and its removal on the fairness of text classification. We aim to find out the most impactful sources of bias and the most effective bias removal techniques to use to ensure the fairness of the task of text classification. To this end, this work aims to answer the following research questions: (RQ1) What is the impact of upstream bias and its removal on the fairness of text classification? (RQ2) What is the impact of downstream bias on the fairness of text classification? (RQ3) What is the impact of removing downstream bias on the fairness of text classification? (RQ4) What is the most effective downstream debias method?
To answer these questions, we first train three language models (LM) on the task of text classification (section 3). Then, we use group fairness metrics Kusner et al. (2017) to measure the fairness, (section 4). After that, to answer RQ1 and to understand the impact of upstream bias and its removal on the fairness of the task of text classification (section 5), we measure upstream bias, remove it and measure its impact before and after removal on the fairness of the task of text classification. After that, we investigate downstream bias and its impact on the models’ fairness (section 6) to answer RQ2. We then use different methods to remove the downstream bias (section 7) and investigate the impact of these debiasing methods (section 7.3) on the models’ fairness to answer RQ3. Then, we analyse our results section 7.4 to find out the most effective bias removal technique to answer RQ4 and to ensure the fairness of the task of text classification. Finally, to help the NLP community improve the fairness of text classification tasks, we build on our findings and provide practical guidelines (section 8) to follow to ensure the fairness of the downstream task of text classification. We also showcase these practical guidelines by applying them to the task of sentiment analysis (section 8.1).
The main contributions of this paper can be summarized as follows: (1) To the best of our knowledge, this is the first paper to study the impact of different sources of bias on the fairness of the task of text classification. (2) We provide empirical guidelines to have fairer text classification task.
Our findings suggest that the dataset used in measuring fairness impacts the fairness scores, and using a balanced dataset improves the fairness scores. They also show that unlike the findings of previous research, our results suggest that there is a positive correlation between upstream bias and models’ fairness. Our results demonstrate that downstream bias is more impactful than upstream on the fairness of the task of text classification, which is in line with previous research. Our results demonstrate that removing downstream bias improved the models’ fairness. Our results also demonstrate that removing overampflication bias in the training dataset is the most effective downstream debiasing method and led to fairer text classification models. Improving the fairness of the downstream task of toxicity classification is very critical to ensure that the decisions made by the models are not based on sensitive attributes like race or gender.
2 Background
The impact of upstream bias on models’ fairness in NLP models is not clear. Some researchers did not find evidence that upstream bias impacts models’fairness bias in language models Cao et al. (2022); Kaneko et al. (2022); Steed et al. (2022). However, there are some limitations with those studies. For example, Steed et al. (2022) used upstream bias metrics that depend on sentences templates, these metrics have been criticized as they may not be semantically bleached May et al. (2019). This means that the upstream bias scores measured in those studies are not reliable, and hence their findings are inconclusive. Different methods have been proposed for removing upstream bias from language models Liang et al. (2020a); Schick et al. (2021). Kaneko et al. (2022) investigated the effectiveness of different upstream debiasing methods on the fairness of downstream tasks and found no positive impact. However, they do not investigate the effectiveness of removing downstream bias on the fairness of downstream NLP tasks. On the other hand, Prabhakaran et al. (2019); Fryer et al. (2022); Qian et al. (2022) use counterfactuals to remove downstream bias and improve the fairness of the text classification task. These methods fall short on understanding downstream bias and its impact on the fairness of text classification. As they do not investigate downstream bias and the impact of different debiasing methods to remove it on the fairness of text classification.
In this work, we aim to fill the gaps in the literature by investigating different sources of bias and their impact on the models’ fairness in the downstream task of text classification. We also aim to overcome the limitations of previous research on investigating the impact of upstream (intrinsic) bias on the models’ fairness (extrinsic bias) by using different metrics to measure them. Moreover, we investigate the impact of different debiasing techniques, to remove upstream and downstream biases, on the models’ fairness. We also provide practical guidelines to ensure the fairness of the downstream task of text classification.
3 Text classification
Jigsaw-Toxicity Dataset: We use the Jigsaw dataset Jigsaw (2021). The dataset contains almost 2M comments, labelled as toxic or not, along with labels on the identity of the target of the toxicity, e.g. religion, gender, and race. The identity labels provided in the dataset are both crowdsourced and automatically labelled. We keep only the data items with crowdsourced identity labels and follow the same data pre-processing steps used in Elsafoury et al. (2021), where the authors train a BERT model for the task of cyberbullying detection. The final dataset after pre-processing contains 400K data items, and we split them into training 40%, validation 30% and test 30% sets.
We only use the Jigsaw dataset because, to the best of our knowledge, it is the only available toxicity dataset that contains information on both marginalized and non-marginalized identities, which is important to the way we measure fairness, as explained in Section 4. Other datasets, like ToxiGen Hartvigsen et al. (2022), SocialFrame Sap et al. (2020), HateExplain Mathew et al. (2021), the Ethos dataset Mollas et al. (2022), and the MLM data Ousidhoum et al. (2019) contain information only about marginalized groups, and thus cannot be used in our study.
Models: For our investigation, we inspected three language models, BERT-base-uncased Devlin et al. (2019), RoBERTa-base Liu et al. (2019), and ALBERT-base Lan et al. (2020) models. We fine-tuned them on the Jigsaw-toxicity training dataset. Following the experimental setting from Elsafoury et al. (2021), the models were trained for 3 epochs, using a batch size of 32, a learning rate of , and a maximum text length of 61 tokens.
Text classification results indicate that ALBERT-base is the best-performing model, followed by RoBERTa-base and Bert-base with AUC-scores of 0.911, 0.908, and 0.902 respectively. The fine-tuned models are used to measure fairness.
4 Fairness (extrinsic bias)
4.1 Fairness evaluation
To evaluate the fairness of the examined models on the task of text classification, we used two sets of extrinsic metrics: (i) Threshold-based Steed et al. (2022); De-Arteaga et al. (2019), which use the absolute difference () in the false positive rates () and true positive rates () between marginalized group and non-marginalized group , as shown in Equations 1 and 2, and (ii) Threshold-agnostic metrics Borkan et al. (2019), which measure the absolute difference in the area under the curve (AUC) scores between marginalized group and non-marginalized group , as shown in Equation 3.
| (1) |
| (2) |
| (3) |
These scores express the amount of unfairness in the models, with higher scores denoting unfair models and lower scores denoting fairer models. These metrics are measured between two groups, marginalized and non-marginalized, similar to the approach used by Elsafoury et al. (2022). We limit our study to 3 sensitive attributes, i.e. gender, religion, and race. In cases where there is more than one identity group in the marginalized group for a sensitive attribute, e.g. Asian and Black vs. White, we then measure the mean of the FPR, TPR, and AUC scores of the two groups and then use that score to represent the marginalized group ().
| Model | Dataset | FPR_gap | TPR_gap | AUC_gap | |
|---|---|---|---|---|---|
| Gender | ALBERT | Original | 0.001 | 0.081 | 0.025 |
| Balanced | |||||
| BERT | Original | 0.002 | 0.111 | 0.026 | |
| Balanced | |||||
| RoBERTa | Original | 0.007 | 0.084 | 0.017 | |
| Balanced | |||||
| Race | ALBERT | Original | 0.007 | 0.044 | 0.003 |
| Balanced | |||||
| BERT | Original | 0.008 | 0.017 | 0.048 | |
| Balanced | |||||
| RoBERTa | Original | 0.014 | 0.127 | 0.028 | |
| Balanced | |||||
| Religion | ALBERT | Original | 0.019 | 0.060 | 0.042 |
| Balanced | |||||
| BERT | Original | 0.016 | 0.027 | 0.051 | |
| Balanced | |||||
| RoBERTa | Original | 0.027 | 0.030 | 0.0369 | |
| Balanced |
4.2 Fairness dataset
To measure fairness, we use the fine-tuned models to predict the labels of the test set. However, We found imbalanced representations of the different identity groups in our test set. For example, we found differences in the number of sentences that are targeted at the different groups, with different ratios of positive examples. We hypothesize that this imbalance in the dataset might have an impact on the measured fairness scores.
To test our hypothesis, we created a balanced toxicity fairness dataset and used it to measure fairness in the task of text classification. To create this balanced toxicity fairness dataset, we used lexical word replacement to create perturbations of existing sentences using regular expressions. That was possible with the Jigsaw dataset because after inspecting the most common nouns and adjectives used in each subset that targets a certain identity, we found that the most common words are words that describe that identity. For example, among the most common nouns to describe the samples that are targeted at Black people are the words \sayblack and \sayblacks. A similar pattern was found for religion and gender identities.
We created perturbations for each item in our datasets. So for the identity of Black people, in addition to the subset of sentences that are targeted at Black people, we create perturbations from the sentences that are targeted at white and Asian identities, replacing any references to white or Asian identities with Black identities. Then we do the same with the sentences that are targeted at White and Asian people. This way, we make sure that all the different racial identities in our dataset are represented in the same way. We repeat the same process for the identity groups in the gender and religion-sensitive attributes. However, this approach is not suitable for gender perturbations, as pronouns also change between males and females. To this end, perturbations for the male and female identity groups we created using the AugLy tool, which swaps gender information including pronouns Papakipos and Bitton (2022). The balanced toxicity fairness dataset contains 55,476 samples and has the same ratio between the positive and the negative samples for each identity group within the same sensitive attribute. When we used the balanced dataset, we found that the fairness scores of the different models, measured by the different extrinsic metrics, improved on the balanced toxicity fairness dataset in comparison to the original fairness dataset (Table 1).
5 Upstream bias
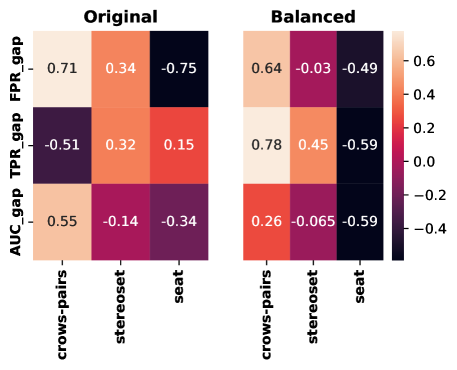
Upstream bias, also known as intrinsic bias, describes the societal stereotypes that language models encoded during pre-training Shah et al. (2020). We use three metrics to measure upstream bias, CrowS-Pairs Nangia et al. (2020), StereoSet Nadeem et al. (2021), and SEAT May et al. (2019) to measure three types of social bias: gender, religion, and race.
5.1 What is the impact of upstream bias and its removal on the fairness of text classification?
Similar to Steed et al. (2022), we use Pearson correlation between the extrinsic bias scores measured by the different extrinsic bias metrics on the balanced toxicity-fairness-dataset and the upstream bias scores measured by the different intrinsic bias metrics (fig. 1) (Balanced). We found a consistent positive correlation between the CrowS-Pairs intrinsic bias scores with the extrinsic bias scores measured by all our three metrics (FPR_gap. TPR_gap and AUC_gap) for all our models and all the sensitive attributes. There is also a consistent negative correlation between SEAT scores and all extrinsic bias metrics. On the other hand, there is inconsistent correlation with the StereoSet scores.
This finding is different from previous research that suggested that there is no correlation between intrinsic bias and extrinsic bias Cao et al. (2022); Kaneko et al. (2022). We hypothesize that previous research did not use a balanced fairness dataset, which is why they did not find a consistent positive correlation with extrinsic bias metrics. To test our hypothesis, we calculate the Pearson correlation between intrinsic bias scores and extrinsic bias scores measured on the original unbalanced toxicity fairness dataset. In that case, we found no consistent correlation between intrinsic and extrinsic bias, which supports our hypothesis as shown in fig. 1 (Original).
We, then, used SentDebias Liang et al. (2020b) to remove biased representations from the models by making the representations orthogonal to the bias subspace. We remove gender, racial and religious bias from our models, following the same approach as Meade et al. (2022). We fine-tuned our three debiased models on the Jigsaw training dataset and measured the fairness of the models. The results, table 3 (+upstream-sentDebias), indicate that removing upstream bias did not change the AUC scores much, but removing gender information increased slightly the AUC scores, especially for Bert and Roberta. This is because the debiased models tend to predict more positive examples, leading to more true positives. For most of the models, the majority of the extrinsic bias metrics show that removing a certain type of bias from the model representation did not improve fairness for the corresponding sensitive attribute. The same findings are made by Kaneko et al. (2022). This could be because the current measures used to remove upstream bias are superficial Gonen and Goldberg (2019). So For the rest of the paper, we focus only on downstream bias.
6 Downstream bias
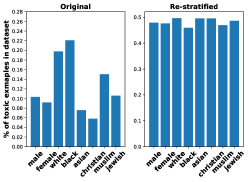
According to Shah et al. (2020), there are three sources of downstream bias: label bias, sample bias, and overampflication bias. Since we do not have information on the annotators of the Jigsaw dataset, we focus only on the other two sources of downstream bias. The first is sample bias, which is a result of non-representative observations in the datasets Shah et al. (2020). For the task of text classification, we interpret sample bias as the over-representation of a certain identity group with the positive (toxic) class, as shown in Figure 2 (Original). We measure the sample bias in our training dataset by measuring the difference in the ratios of the positive examples, Equation 4, between the marginalized and non-marginalised groups. We found that the highest sample bias scores are in the sensitive attribute of religion (0.077), followed by race (0.53) and finally gender(0.027).
| (4) |
| (5) |
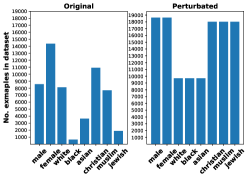
The second source of downstream bias is overampflication bias, which happens during the training of the NLP models. As the models rely on small differences between sensitive attributes regarding an objective function and amplify these differences to be more pronounced in the predicted outcomes. For example, marginalized groups co-occur with hateful contexts more often than non-marginalized groups in most hate speech datasets, which leads to NLP models to learn spurious correlations and associate between hate and marginalized groups regardless of the content Dixon et al. (2018). In this paper, we aim to measure the overampflication bias in the training dataset before it gets amplified, as shown in Figure 3 (Original). To measure the overampflication bias, in the jigsaw training dataset, Equation 5, we measure the differences between the number of examples targeted at marginalized () vs. non-marginalized groups (). Then the scores are normalized to the range using max normalization. The different sizes mean that certain identity groups appear in more semantic contexts than others. These contexts could be positive or negative. The highest overampflication bias scores were found in the sensitive attributes of religion (1), followed by race (0.97), and finally gender (0.94).
6.1 What is the impact of the downstream bias on the fairness of text classification?
To answer this research question, we investigate the impact of the two sources of downstream bias, sample and overampflication, on the fairness of text classification. We follow the work of Kaneko et al. (2022); Steed et al. (2022) and use the correlation between bias scores and fairness scores to measure that impact.
Sample bias: To measure the impact the sample bias has on the fairness of the Text classification task (extrinsic bias), we use Pearson correlation to correlate between the extrinsic bias scores measured by the different metrics and the sample bias scores in the Jigsaw training dataset. We found that, for Albert-base and Roberta-base, the extrinsic bias scores correlate positively with the sample bias when measured by the TPR_gap , the AUC_gap and by FPR_gap. As for BERT-base we found almost no correlation between sample bias and FPR_gap. These results suggest that the sample bias in the training dataset has a direct effect on the fairness of our models, as evident by the positive correlations with the different extrinsic bias metrics.
For the impact of overampflication bias on the models’ fairness (extrinsic) bias, we measure the Pearson correlation between the overampflication bias and the extrinsic bias scores using threshold-based and threshold-agnostic metrics. For Albert-base and Roberta-base, we found a positive correlation between overampflication bias scores and the fairness scores measured by TPR_gap, FPR_gap and AUC_gap. As for Bert-base, we also found no correlation between the overampflicaitn bias scores and the FPRgap. These results suggest that overampflication bias in the training dataset has a direct effect on the fairness of our models.
To summarize our findings and to answer our research question, our results indicate that the two sources of downstream bias, sample and overampflication, have an impact on the fairness of the task of text classification. Overampflication bias seems to have slightly stronger impact than sample bias, as evidenced by the stronger correlation scores as shown in Table 2. It is important to mention that these correlations are not significant, but that is because we have only a few data points.
| Albert Model | |||
|---|---|---|---|
| Fairness | |||
| Source of bias | FPR_gap | TPR_gap | AUC_gap |
| Sample | 0.984 | 0.633 | 0.911 |
| Overampflication | 0.988 | 0.613 | 0.921 |
| Bert-Model | |||
| Fairness | |||
| Source of bias | FPR_gap | TPR_gap | AUC_gap |
| Sample | -0.037 | 0.418 | 0.150 |
| Overampflication | -0.01 | 0.395 | 0.175 |
| Roberta-Model | |||
| Fairness | |||
| Source of bias | FPR_gap | TPR_gap | AUC_gap |
| Sample | 0.809 | 0.785 | 0.992 |
| Overampflication | 0.794 | 0.770 | 0.995 |
7 Downstream bias removal
7.1 Sample bias removal
According to Shah et al. (2020), to remove sample bias, we need to realign the sample distribution to minimize the mismatch in the class representation between the different identities. To achieve that, we follow the same methodology used in Zmigrod et al. (2019) to use data augmentation to add slightly altered sentences to balance the class representation in our training dataset. Since the percentages of the positive examples for the different identity groups are small, ranging from 0.05 to 0.2 as shown in Figure 2 (Original), we had to generate synthetic positive examples using existing positive examples in our dataset but with word substitutions using the NLPAUG tool that uses contextual word embeddings to generate word substitutions Ma (2019). The newly generated training dataset contains balanced class representation, as shown in Figure 2 (Re-stratified). The size of the dataset after adding the synthesized data is, 443046 data items with the difference in the ratios of positive examples between the identity groups being 0.002 for gender, 0.019 for race and 0.017 for religion. We then, fine-tune our models, AlBERT, BERT, and RoBERTa, on the new balanced dataset. Removing sample bias in the training dataset led to a reduction in the performance, AUC scores, of all three models (+downstream-stratified-data), as shown in Table 3. This reduction in the AUC scores is a result of predicting more positive examples.
We analysed the fairness scores for all the sensitive attributes, using the different extrinsic bias metrics in all our models. We found that for the AUC_gap metric, the fairness improved for all models and most of the sensitive attributes as evident in Albert (race, religion), Bert (gender, race, religion), and Roberta (gender, race, religion), Table 3. However, the results are inconsistent for the TPR_gap or FPR_gap.
7.2 Overampflication bias removal
To remove overampflication bias, we need to make sure that there is no difference between the different groups regarding the semantic context in our dataset. To achieve that, we follow the work proposed in Webster et al. (2020b) to have each of our identities, marginalized and non-marginalized, in similar semantic contexts so that the models would not associate certain contexts with certain groups.
To create the perturbations, we first fine-tuned a Text-to-text model Raffel et al. (2020) on the PANDA dataset Qian et al. (2022) to automatically generate perturbations. We used the same values for the hyperparameters as Raffel et al. (2020) and our Text-to-text model achieved a Rougu-2 score of 0.9 which is the same score reported in the original paper. However, upon inspection of the perturbed text, we found that the perturbed text is not consistently changing identity keywords and that it does not perform well on religious or racial attributes. Upon further inspection, we realised that the perturbed text in the PANDA dataset is inconsistent, and sometimes the perturbations are not correct.
So instead, we used the same method described in Section 4 to create the balanced toxicity fairness dataset. The size of the training dataset after perturbations is, 382,212 and the ratio between the positive and the negative examples for each identity group within the same sensitive attribute is the same as in Figure 3 (Perturbed). For example, in the gender attribute, the ratio of the positive (toxic) examples in the male and female identity groups is 0.10, in the race attribute, the ratio of the positive examples for the Black, white and Asian groups is 0.2 and for the religion attribute, the ratio of the positive examples for the Muslim, Christian and Jewish groups is 0.10. Finally, we use the new perturbed dataset to fine-tune our models.
Another method proposed in the literature to remove bias is by removing biased subspaces in trained models. As an alternative to fine-tuning our models on perturbed text, we used SentDebias Liang et al. (2020b) to remove the biased subspaces from our models after fine-tuning them on the Jigsaw dataset. To investigate the impact of removing overampflication bias on the fairness of the toxicity detention task, we use the threshold-based and threshold-agnostic metrics to measure the impact on models’ fairness of the task of Text classification.
| Attribute | Model | AUC | FPR_gap | TPR_gap | AUC_gap |
| Gender | ALBERT | 0.847 | 0.006 | 0.039 | 0.004 |
| + upstream-sentDebias-gender | 0.840 | 0.006 | 0.004 | ||
| + downstream-sentDebias-gender | 0.524 | ||||
| + downstream-perturbed-data | 0.848 | 0.004 | |||
| + downstream-stratified-data | 0.816 | ||||
| + downstream-stratified-perturbed-data | 0.803 | ||||
| BERT | 0.83 | 0.09 | 0.036 | 0.01 | |
| + upstream-sentDebias-gender | 0.841 | ||||
| + downstream-sentDebias-gender | 0.478 | ||||
| + downstream-perturbed-data | 0.837 | ||||
| + downstream-stratified-data | 0.817 | ||||
| + downstream-stratified-perturbed-data | 0.810 | ||||
| RobERTa | 0.851 | 0.005 | 0.032 | 0.011 | |
| + upstream-sentDebias-gender | 0.856 | ||||
| + downstream-sentDebias-gender | 0.520 | ||||
| + downstream-perturbed-data | 0.873 | ||||
| + downstream-stratified-data | 0.842 | ||||
| + downstream-stratified-perturbed-data | 0.825 | ||||
| Race | ALBERT | 0.847 | 0.008 | 0.002 | 0.019 |
| + upstream-sentDebias-race | 0.838 | ||||
| + downstream-sentDebias-race | 0.421 | ||||
| + downstream-perturbed-data | 0.848 | ||||
| + downstream-stratified-data | 0.816 | ||||
| + downstream-stratified-perturbed-data | 0.803 | 0.002 | |||
| BERT | 0.83 | 0.016 | 0.002 | 0.026 | |
| + upstream-sentDebias-race | 0.829 | ||||
| + downstream-sentDebias-race | 0.504 | ||||
| + downstream-perturbed-data | 0.837 | ||||
| + downstream-stratified-data | 0.817 | ||||
| + downstream-stratified-perturbed-data | 0.810 | 0.002 | |||
| RobERTa | 0.851 | 0.003 | 0.011 | 0.021 | |
| + upstream-sentDebias-race | 0.854 | 0.021 | |||
| + downstream-sentDebias-race | 0.561 | ||||
| + downstream-perturbed-data | 0.873 | ||||
| + downstream-stratified-data | 0.842 | 0.011 | |||
| + downstream-stratified-perturbed-data | 0.825 | 0.003 | |||
| Religion | ALBERT | 0.847 | 0.01 | 0.109 | 0.02 |
| + upstream-sentDebias-religion | 0.837 | ||||
| + downstream-sentDebias-religion | 0.507 | ||||
| + downstream-perturbed-data | 0.848 | ||||
| + downstream-stratified-data | 0.816 | ||||
| + downstream-stratified-perturbed-data | 0.803 | ||||
| BERT | 0.83 | 0.008 | 0.063 | 0.012 | |
| + upstream-sentDebias-religion | 0.833 | ||||
| + downstream-sentDebias-religion | 0.447 | ||||
| + downstream-perturbed-data | 0.837 | ||||
| + downstream-stratified-data | 0.817 | ||||
| + downstream-stratified-perturbed-data | 0.810 | ||||
| RobERTa | 0.851 | 0.022 | 0.16 | 0.027 | |
| + upstream-sentDebias-religion | 0.843 | ||||
| + downstream-sentDebias-religion | 0.523 | ||||
| + downstream-perturbed-data | 0.873 | ||||
| + downstream-stratified-data | 0.842 | ||||
| + downstream-stratified-perturbed-data | 0.825 |
Downstream-SentDebias: Starting with the impact of removing the biased subspaces from the fine-tuned models. We find that the performance of the models after removing the biased representation (+downstream-sentDebias) is much worse, almost random with the AUC scores close to 0.5 as shown in Table 3, which is expected since the model lost a lot of information related to the task of text classification along with the biased subspaces after fine-tuning. To simplify the result’s analysis, we investigate the impact of removing a certain type of bias on the fairness of the matching sensitive attribute. The results show that removing the biased subspaces after fine-tuning led to reduced fairness in all our models according to all our extrinsic bias metrics for almost all the sensitive attributes. However, these results come with a big loss in performance.
Data perturbation As for the impact of fine-tuning the models on perturbed datasets, the results (+ downstream-perturbed-data) in Table 3 show that the performance slightly improved in all our models. Fine-tuning the models on the perturbed data made the models predict more positives, TPs and FPs without hurting the TNs much, which was the case with the other inspected debiasing methods. When we investigate the fairness scores after fine-tuning the models of the perturbed dataset, we find that the different extrinsic bias metrics agree, in almost all the models for most of the sensitive attributes, that fairness improved.
Removing both sample and overampflication biases: we investigate the impact of removing both biases to remove downstream bias. So, we re-stratify the perturbed data, as we explained in sections 7.1 and 7.2. The new stratified-perturbed dataset contains 841,814 sentences, where the ratio of the positive examples for all identity groups ranges from 0.47 to 0.49. then we fine-tune our models on the re-stratified-perturbed dataset to measure fairness (+downstream-stratified-perturbed-data).
When we fine-tuned the models on the re-stratified perturbed data, we found that the performance is slightly worse for all three models, as shown in Table 3 (+ downstream-stratified-perturbed-data). Like most of the other debiasing techniques, fine-tuning the re-stratified perturbed data caused the model to predict more positives, but especially more FPs in Albert and Roberta. When we investigated the fairness scores, we found that the AUC_gap consistently improved across all models and for almost all the sensitive attributes, Albert (race, religion), BERT (gender, race, religion), and Roberta (gender, race, religion). The results for FPR_gap and TPR_gap are not as consistent, but still improved for most of the sensitive attributes and models.
| Albert-base | Bert-base | Roberta-base | |||||||
| Debias approach | gender | race | religion | gender | race | religion | gender | race | religion |
| Downstream-SentDebias | ✗ | ✗ | ✓ | ✓ | ✓ | ✗ | ✗ | ✓ | ✓ |
| Downstream-perturbed-data | ✓ | ✓ | ✓ | ✓ | ✗ | ✓ | ✓ | ✗ | ✓ |
| Downstream-stratified-data | ✗ | ✗ | ✗ | ✓ | ✗ | ✗ | ✗ | ✗ | ✓ |
| Downstream-stratified-perturbed-data | ✗ | ✗ | ✓ | ✓ | ✗ | ✓ | ✓ | ✗ | ✓ |
7.3 What is the impact of downstream bias removal on fairness of text classification?
To answer this research question, we summarize our findings on the impact of the different debias approaches on the models’ fairness. We accumulate the debiasing techniques that improved the bias according to all our extrinsic bias metrics for each sensitive attribute in all our models. The results in Table 4 show that the most effective debiasing method that improved the fairness according to all the extrinsic bias metrics in most of the models and sensitive attributes is removing overampflication bias. These results are in line with our early findings that overampflication bias is the most impactful on the fairness of the downstream task. The results also show that using perturbed data is more effective than training on re-stratified perturbed data. Removing the biased subspaces after fine-tuning (+downstream-SentDebias) is effective in some cases, like Albert (religion), Bert (gender, race), and Roberta (religion). However, using this technique leads to bad performance. So, We do not recommend using this debiasing technique, as it is important to find the right trade-off between performance and fairness.
Removing sample bias by fine-tuning the models on re-stratified data improved fairness in some cases, like Bert (gender) and Roberta (religion), but not as effective as removing overampflication bias. We speculate that this is the case because removing sample bias led to a balanced ratio between the positive and negative classes () for all identity groups. This resulted in the model predicting more FPs and fewer TNs which we can see in the lower AUC scores for the different models when training on re-stratified data. On the other hand, removing overampflication bias by training the model on perturbed data ensured balanced positive class representation between the different identity groups, but the ratio between the positive to negative class stayed low (). This made the model predict more positives, especially TPs, without hurting the number of TNs.
7.4 What is the most effective downstream debias method?
The answer to the previous research question suggests that the best technique to improve the fairness of the task of text classification is to remove overampflication bias. So in this section, and to confirm that this is the most effective downstream debias technique to follow and to answer this research question, we use the counterfactual fairness methods Kusner et al. (2017). We use the Perturbation sensitivity score () proposed in Prabhakaran et al. (2019) to inspect closely the models’ prediction probabilities of the different identity groups within each sensitive attribute. Then, we report the absolute value of for easier comparison between the different debiasing methods.
| (6) |
is an indicator of how the model treats different groups of people, since the sentence is the same with only the identity group being different. The bigger the score, the less fair the model is, since it means the model treats the different groups differently. On the contrary, the smaller the score, the more fair the model is. This analysis is possible because our balanced toxicity fairness dataset contains perturbed examples. We carried out this analysis for the downstream debaising techniques that we found the most effective and impactful on the model’s fairness without hurting the models’ performance, which are: re-stratification (+downstream-stratified-data), perturbation (+downstream-perturbed-data), and re-stratification and perturbation (+downstream-stratified-perturbed-data).
|
||
|
| SenseScore | |||
| Model | Gender | Race | Religion |
| Albert-base | 0.032 | 0.006 | |
| + downstream-perturbed-data | |||
| + downstream-stratified-data | 0.032 | ||
| + downstream- stratified-perturbed-data | |||
| BERT-base | 0.001 | 0.03 | 0.001 |
| + downstream-perturbed-data | 0.001 | ||
| + downstream-stratified-data | |||
| + downstream- stratified-perturbed-data | |||
| Roberta-base | 0.001 | 0.024 | 0.003 |
| + downstream-perturbed-data | |||
| + downstream-stratified-data | 0.003 | ||
| + downstream- stratified-perturbed-data | |||
We inspect the difference in the prediction probabilities for the different sensitive attributes. For the gender sensitive attribute, we study the sentences that were targeted at the Male group and that were perturbed to change the identity to the Female group. We also inspected the sentences that were targeted at the Female group and were perturbed to change the identity to the male group, as shown in Table 5. Then, we measured the between the same sentences with the Male and the Female identities swapped. For the race sensitive attribute, we inspected the sentences that were targeted at the Black group and that were perturbed to change the identity to the White group. We also inspected the sentences that were targeted at the White group and were perturbed to change the identity to the Black group. For the religion sensitive attribute, we inspected the sentences that were targeted at the Christian group and that were perturbed to change the identity to the Muslim group. We also inspected the sentences that were targeted at Muslims and were perturbed to change the identity to Christians.
The prediction sensitivity scores (), in table 6, show that removing overampflication bias is the most effective debiasing method. Fine-tuning the different models on a perturbed balanced dataset (+ downstream-perturbed-data) improved the fairness, lower , for almost all the sensitive attributes as evident in Albert (gender, race, religion), BERT (gender, race), and Roberta (gender, race, religion). The next most effective debiasing method is removing both sample and overampflication bias. Since fine-tuning the different models on a re-stratified-perturbed balanced dataset (+ downstream-stratified-perturbed-data) improved the fairness for all the models but only for the race and the religion sensitive attributes as evident in Albert (race, religion), BERT (race, religion), and Roberta (race, religion). On the other hand, removing only sample bias by fine-tuning the models on re-stratified data (+ downstream-stratified-data), was the least effective on the models’ fairness as it improved only BERT (race) and led to worse fairness than the original models as evident in Albert (gender, religion), BERT (gender, religion), and Roberta (gender, race).
To answer our research question, the results in this section, show that the most effective method to remove downstream bias is by training the models on datasets with balanced semantic representation and balanced ratios of the positive examples between the different identity groups.
8 Practical fairness guidelines
We build on our findings and recommend a list of guidlines to follow to ensure the fairness of the downstream task of text classification. To showcase these guidelines, we apply them to ensure the fairness of the downstream task of sentiment analysis.
| Female |
|
|||
|---|---|---|---|---|
| Male |
|
|||
| Neutral | they, them, theirs, parent, child, sibling, person, spouse |
8.1 Sentiment Analysis
To train a sentiment analysis model that is fair, we need first a dataset that contains information about sensitive attributes. Since there is no such dataset, we filtered the IMDB sentiment dataset IMDB to make sure that our dataset contains gender information similar to the work done in Webster et al. (2020a). We use the keywords in table 7 to filter the data items and make sure that gendered information is present in our IMDB training dataset.The IMDB dataset after the keyword filter contains 50K data items. We chose only the data items that are labelled \sayMale or, \sayFemale and we call the filtered dataset IMDB-gendered. The dataset contains, 9790 sentences with 72% targeted at males and 27% targeted at females. The ratio of the positive examples in the Male subset is 0.55 and 0.52 in the female subset. Then, we pre-processed and split the IMDB-gendered dataset as explained in Section 3. We trained three models, Albert-base, Bert-base, and Roberta-base on the IMDB-gendered dataset. The AUC scores of the models are 0.899, 0.912, and 0.914, respectively.
8.2 Sentiment analysis fairness dataset:
We used the SST-sentiment-fairness dataset gero et al. (2023) which contains 462 data items with the target of the sentiment labelled by 3 annotators with an inter-annotation agreement of 0.65. 41% of the dataset is targeted at females (ratio of positive examples = 0.61) and 58% is targeted at males (ratio of positive examples= 0.5). We used the fine-tuned models on IMDB-genderd dataset, to predict the labels of this fairness dataset and to measure their fairness. The performance of the trained models on the SST-sentiment-fairness dataset is good with AUC scores of 0.865, 0.860, and 0.878 for AlBERT-base, Bert-base, and RoBERTa-base.
8.3 Recommendations
In this section, we provide recommendations to follow to ensure the fairness of the downstream task of text classification, and we showcase them on the downstream task of sentiment analysis.
-
1.
know the data: The first recommendation is to know the data and understand the biases in our dataset. We recommend measuring the selection bias and overampflication bias in the training dataset. When we apply this to the IMDB-gendered dataset, using the methods proposed in section 6 to measure selection and overampflication biases, we find that the selection bias is 0.03 and the overampflication bias is 0.309.
-
2.
Remove overampflication bias: We recommend removing the overampflication bias since it is the most impactful debiasing method on the models’ fairness, as we showed in Section 7.4. We recommend removing overampflication bias as described in Section 4.2. We applied this technique to the IMDB-gendered dataset, and fine-tuned our models on the perturbed-IMDB-gendered dataset. The AUC scores of the models on the perturbed-IMDB-gendered dataset are 0.869, 0.860, and 0.877 for Albert, Bert, and Roberta respectively.
-
3.
Balance the fairness data: We recommend using a balanced fairness dataset to make sure that the measured fairness scores are reliable, as discussed in Section 4.2. We use the same method used in the section 4.2 to create a perturbed SST-fairness dataset. 50% of the dataset is targeted at women (ratio of positive examples = 0.54) and 50% is targeted at men (ratio of positive examples = 0.54). The data after perturbation contain 924 data items.
-
4.
Measure counterfactual fairness: We recommend using counterfactual fairness metrics. For our case study, we measure the of our fine-tuned models, on the perturbed SST-sentiment-fairness dataset. We found that the between the same sentences with the Male and the Female identities swapped for ALBERT-base is 0.005, BERT-base is 0.0005, and Roberta-base is 0.009.
-
5.
Decide: The results indicate that after removing overampflication bias, we find that the model that discriminates the least between the male and the female groups in our sentiment analysis task is BERT. So, based on that, we decided that Bert is the most fair model to use. This decision comes with a trade-off as the performance score, on the perturbed-gendered-IMDB dataset, of Roberta (+ downstream-perturbed-data) is 0.877 which slightly outperforms BERT (+ downstream-perturbed-data) with an AUC score of 0.860.
9 Limitations
It is important to point out that our work is limited to the examined models and datasets. Our work studies bias and fairness from a Western perspective regarding the language, English and culture in which identities are from the marginalized and the non-marginalised groups may differ. We recognize that the provided recommendations to have a fairer text classification task rely on creating perturbations for the training and the fairness dataset. Which might be challenging for some datasets.
10 Conclusion
In this work, we provide a holistic investigation on the impact of the different sources of bias on the fairness of the task of text classification. Then, we investigated the impact of removing them on improving the models’ fairness. We found that downstream sources of bias are more impactful on the models’ fairness and that removing them, especially overampflication bias, makes the models fairer. Finally, we provide practical guidelines to ensure the fairness of the task of text classification.
References
- Borkan et al. (2019) Daniel Borkan, Lucas Dixon, Jeffrey Sorensen, Nithum Thain, and Lucy Vasserman. 2019. Nuanced metrics for measuring unintended bias with real data for text classification. In WWW ’19: Companion Proceedings of The 2019 World Wide Web Conference, pages 491–500.
- Cao et al. (2022) Yang Cao, Yada Pruksachatkun, Kai-Wei Chang, Rahul Gupta, Varun Kumar, Jwala Dhamala, and Aram Galstyan. 2022. On the intrinsic and extrinsic fairness evaluation metrics for contextualized language representations. In Proceedings of the 60th Annual Meeting of the Association for Computational Linguistics (Volume 2: Short Papers), pages 561–570, Dublin, Ireland. Association for Computational Linguistics.
- De-Arteaga et al. (2019) Maria De-Arteaga, Alexey Romanov, Hanna Wallach, Jennifer Chayes, Christian Borgs, Alexandra Chouldechova, Sahin Geyik, Krishnaram Kenthapadi, and Adam Tauman Kalai. 2019. Bias in bios: A case study of semantic representation bias in a high-stakes setting. In Proceedings of the Conference on Fairness, Accountability, and Transparency, FAT* ’19, page 120–128, New York, NY, USA. Association for Computing Machinery.
- Devlin et al. (2019) Jacob Devlin, Ming-Wei Chang, Kenton Lee, and Kristina Toutanova. 2019. BERT: Pre-training of deep bidirectional transformers for language understanding. In Proceedings of the 2019 Conference of the North American Chapter of the Association for Computational Linguistics: Human Language Technologies, Volume 1 (Long and Short Papers), pages 4171–4186, Minneapolis, Minnesota. Association for Computational Linguistics.
- Dixon et al. (2018) Lucas Dixon, John Li, Jeffrey Sorensen, Nithum Thain, and Lucy Vasserman. 2018. Measuring and mitigating unintended bias in text classification. In Proceedings of the 2018 AAAI/ACM Conference on AI, Ethics, and Society, AIES ’18, page 67–73, New York, NY, USA. Association for Computing Machinery.
- Elsafoury et al. (2021) Fatma Elsafoury, Stamos Katsigiannis, Steven R. Wilson, and Naeem Ramzan. 2021. Does bert pay attention to cyberbullying? In Proceedings of the 44th International ACM SIGIR Conference on Research and Development in Information Retrieval, SIGIR ’21, page 1900–1904, New York, NY, USA. Association for Computing Machinery.
- Elsafoury et al. (2022) Fatma Elsafoury, Steve R. Wilson, Stamos Katsigiannis, and Naeem Ramzan. 2022. SOS: Systematic offensive stereotyping bias in word embeddings. In Proceedings of the 29th International Conference on Computational Linguistics, pages 1263–1274, Gyeongju, Republic of Korea. International Committee on Computational Linguistics.
- Fryer et al. (2022) Zee Fryer, Vera Axelrod, Ben Packer, Alex Beutel, Jilin Chen, and Kellie Webster. 2022. Flexible text generation for counterfactual fairness probing. In Proceedings of the Sixth Workshop on Online Abuse and Harms (WOAH), pages 209–229, Seattle, Washington (Hybrid). Association for Computational Linguistics.
- gero et al. (2023) Katy gero, Nathan Butters, Anna Bethke, and Fatma Elsafoury. 2023. A dataset to measure fairness in the sentiment analysis task. https://github.com/efatmae/SST_sentiment_fairness_data.
- Gonen and Goldberg (2019) Hila Gonen and Yoav Goldberg. 2019. Lipstick on a pig: Debiasing methods cover up systematic gender biases in word embeddings but do not remove them. arXiv preprint arXiv:1903.03862.
- Hartvigsen et al. (2022) Thomas Hartvigsen, Saadia Gabriel, Hamid Palangi, Maarten Sap, Dipankar Ray, and Ece Kamar. 2022. ToxiGen: A large-scale machine-generated dataset for adversarial and implicit hate speech detection. In Proceedings of the 60th Annual Meeting of the Association for Computational Linguistics (Volume 1: Long Papers), pages 3309–3326, Dublin, Ireland. Association for Computational Linguistics.
- Hovy and Prabhumoye (2021) Dirk Hovy and Shrimai Prabhumoye. 2021. Five sources of bias in natural language processing. Language and Linguistics Compass, 15(8):e12432.
- Jigsaw (2021) Jigsaw. 2021. Detecting toxic behaviour in wikipedia talk pages. https://www.kaggle.com/c/jigsaw-toxic-comment-classification-challenge/data. Accessed: 2021-04-07.
- Kaneko et al. (2022) Masahiro Kaneko, Danushka Bollegala, and Naoaki Okazaki. 2022. Debiasing isn’t enough! – on the effectiveness of debiasing MLMs and their social biases in downstream tasks. In Proceedings of the 29th International Conference on Computational Linguistics, pages 1299–1310, Gyeongju, Republic of Korea. International Committee on Computational Linguistics.
- Kusner et al. (2017) Matt J Kusner, Joshua Loftus, Chris Russell, and Ricardo Silva. 2017. Counterfactual fairness. Advances in neural information processing systems, 30.
- Lan et al. (2020) Zhenzhong Lan, Mingda Chen, Sebastian Goodman, Kevin Gimpel, Piyush Sharma, and Radu Soricut. 2020. ALBERT: A lite BERT for self-supervised learning of language representations. In 8th International Conference on Learning Representations, ICLR 2020, Addis Ababa, Ethiopia, April 26-30, 2020. OpenReview.net.
- Liang et al. (2020a) Paul Pu Liang, Irene Mengze Li, Emily Zheng, Yao Chong Lim, Ruslan Salakhutdinov, and Louis-Philippe Morency. 2020a. Towards debiasing sentence representations. In Proceedings of the 58th Annual Meeting of the Association for Computational Linguistics, pages 5502–5515, Online. Association for Computational Linguistics.
- Liang et al. (2020b) Paul Pu Liang, Irene Mengze Li, Emily Zheng, Yao Chong Lim, Ruslan Salakhutdinov, and Louis-Philippe Morency. 2020b. Towards debiasing sentence representations. arXiv preprint arXiv:2007.08100.
- Liu et al. (2019) Yinhan Liu, Myle Ott, Naman Goyal, Jingfei Du, Mandar Joshi, Danqi Chen, Omer Levy, Mike Lewis, Luke Zettlemoyer, and Veselin Stoyanov. 2019. Roberta: A robustly optimized BERT pretraining approach. CoRR, abs/1907.11692.
- Ma (2019) Edward Ma. 2019. Nlp augmentation. https://github.com/makcedward/nlpaug.
- Mathew et al. (2021) Binny Mathew, Punyajoy Saha, Seid Muhie Yimam, Chris Biemann, Pawan Goyal, and Animesh Mukherjee. 2021. Hatexplain: A benchmark dataset for explainable hate speech detection. Proceedings of the AAAI Conference on Artificial Intelligence, 35(17):14867–14875.
- May et al. (2019) Chandler May, Alex Wang, Shikha Bordia, Samuel R. Bowman, and Rachel Rudinger. 2019. On measuring social biases in sentence encoders. In Long and Short Papers, NAACL HLT 2019 - 2019 Conference of the North American Chapter of the Association for Computational Linguistics: Human Language Technologies - Proceedings of the Conference, pages 622–628. Association for Computational Linguistics (ACL). Funding Information: CM is funded by IARPA MATERIAL; RR is funded by DARPA AIDA; AW is funded by an NSF fellowship. The U.S. Government is authorized to reproduce and distribute reprints for Governmental purposes. The views and conclusions contained in this publication are those of the authors and should not be interpreted as representing official policies or endorsements of IARPA, DARPA, NSF, or the U.S. Government. Publisher Copyright: © 2019 Association for Computational Linguistics; 2019 Conference of the North American Chapter of the Association for Computational Linguistics: Human Language Technologies, NAACL HLT 2019 ; Conference date: 02-06-2019 Through 07-06-2019.
- Meade et al. (2022) Nicholas Meade, Elinor Poole-Dayan, and Siva Reddy. 2022. An empirical survey of the effectiveness of debiasing techniques for pre-trained language models. In Proceedings of the 60th Annual Meeting of the Association for Computational Linguistics (Volume 1: Long Papers), pages 1878–1898, Dublin, Ireland. Association for Computational Linguistics.
- Mollas et al. (2022) Ioannis Mollas, Zoe Chrysopoulou, Stamatis Karlos, and Grigorios Tsoumakas. 2022. ETHOS: a multi-label hate speech detection dataset. Complex & Intelligent Systems.
- Nadeem et al. (2021) Moin Nadeem, Anna Bethke, and Siva Reddy. 2021. StereoSet: Measuring stereotypical bias in pretrained language models. In Proceedings of the 59th Annual Meeting of the Association for Computational Linguistics and the 11th International Joint Conference on Natural Language Processing (Volume 1: Long Papers), pages 5356–5371, Online. Association for Computational Linguistics.
- Nangia et al. (2020) Nikita Nangia, Clara Vania, Rasika Bhalerao, and Samuel R. Bowman. 2020. CrowS-pairs: A challenge dataset for measuring social biases in masked language models. In Proceedings of the 2020 Conference on Empirical Methods in Natural Language Processing (EMNLP), pages 1953–1967, Online. Association for Computational Linguistics.
- Ousidhoum et al. (2019) Nedjma Ousidhoum, Zizheng Lin, Hongming Zhang, Yangqiu Song, and Dit-Yan Yeung. 2019. Multilingual and multi-aspect hate speech analysis. In Proceedings of EMNLP. Association for Computational Linguistics.
- Papakipos and Bitton (2022) Zoe Papakipos and Joanna Bitton. 2022. Augly: Data augmentations for robustness.
- Prabhakaran et al. (2019) Vinodkumar Prabhakaran, Ben Hutchinson, and Margaret Mitchell. 2019. Perturbation sensitivity analysis to detect unintended model biases. In Proceedings of the 2019 Conference on Empirical Methods in Natural Language Processing and the 9th International Joint Conference on Natural Language Processing (EMNLP-IJCNLP), pages 5740–5745, Hong Kong, China. Association for Computational Linguistics.
- Qian et al. (2022) Rebecca Qian, Candace Ross, Jude Fernandes, Eric Michael Smith, Douwe Kiela, and Adina Williams. 2022. Perturbation augmentation for fairer NLP. In Proceedings of the 2022 Conference on Empirical Methods in Natural Language Processing, pages 9496–9521, Abu Dhabi, United Arab Emirates. Association for Computational Linguistics.
- Raffel et al. (2020) Colin Raffel, Noam Shazeer, Adam Roberts, Katherine Lee, Sharan Narang, Michael Matena, Yanqi Zhou, Wei Li, and Peter J Liu. 2020. Exploring the limits of transfer learning with a unified text-to-text transformer. The Journal of Machine Learning Research, 21(1):5485–5551.
- Sap et al. (2020) Maarten Sap, Saadia Gabriel, Lianhui Qin, Dan Jurafsky, Noah A. Smith, and Yejin Choi. 2020. Social bias frames: Reasoning about social and power implications of language. In Proceedings of the 58th Annual Meeting of the Association for Computational Linguistics, pages 5477–5490, Online. Association for Computational Linguistics.
- Schick et al. (2021) Timo Schick, Sahana Udupa, and Hinrich Schütze. 2021. Self-diagnosis and self-debiasing: A proposal for reducing corpus-based bias in nlp. Transactions of the Association for Computational Linguistics, 9:1408–1424.
- Shah et al. (2020) Deven Santosh Shah, H. Andrew Schwartz, and Dirk Hovy. 2020. Predictive biases in natural language processing models: A conceptual framework and overview. In Proceedings of the 58th Annual Meeting of the Association for Computational Linguistics, pages 5248–5264, Online. Association for Computational Linguistics.
- Steed et al. (2022) Ryan Steed, Swetasudha Panda, Ari Kobren, and Michael Wick. 2022. Upstream Mitigation Is Not All You Need: Testing the Bias Transfer Hypothesis in Pre-Trained Language Models. In Proceedings of the 60th Annual Meeting of the Association for Computational Linguistics (Volume 1: Long Papers), pages 3524–3542, Dublin, Ireland. Association for Computational Linguistics.
- Webster et al. (2020a) Kellie Webster, Xuezhi Wang, Ian Tenney, Alex Beutel, Emily Pitler, Ellie Pavlick, Jilin Chen, Ed Chi, and Slav Petrov. 2020a. Measuring and reducing gendered correlations in pre-trained models. arXiv preprint arXiv:2010.06032.
- Webster et al. (2020b) Kellie Webster, Xuezhi Wang, Ian Tenney, Alex Beutel, Emily Pitler, Ellie Pavlick, Jilin Chen, Ed H. Chi, and Slav Petrov. 2020b. Measuring and reducing gendered correlations in pre-trained models. Technical report.
- Zmigrod et al. (2019) Ran Zmigrod, Sabrina J. Mielke, Hanna Wallach, and Ryan Cotterell. 2019. Counterfactual data augmentation for mitigating gender stereotypes in languages with rich morphology. In Proceedings of the 57th Annual Meeting of the Association for Computational Linguistics, pages 1651–1661, Florence, Italy. Association for Computational Linguistics.