Extreme Variability in a Long Duration Gamma-ray Burst Associated with a Kilonova
Abstract
The recent discovery of a kilonova from the long duration gamma-ray burst, GRB 211211A, challenges classification schemes based on temporal information alone. Gamma-ray properties of GRB 211211A reveal an extreme event, which stands out among both short and long GRBs. We find very short variations (few ms) in the lightcurve of GRB 211211A and estimate 1000 for the Lorentz factor of the outflow. We discuss the relevance of the short variations in identifying similar long GRBs resulting from compact mergers. Our findings indicate that in future gravitational wave follow-up campaigns, some long duration GRBs should be treated as possible strong gravitational wave counterparts.
1 Introduction
Gamma-ray bursts (GRBs) are typically classified into long or short groups based on the duration of the active gamma-ray episode. Such a classification has historical origins (Kouveliotou et al., 1993), and the physical understanding behind this picture has matured over the following decades: short GRBs (sGRBs) are predominantly from binary neutron star mergers (Duncan & Thompson, 1992; Usov, 1992; Thompson, 1994; Goldstein et al., 2017; Abbott et al., 2017) or possibly from black hole - neutron star mergers (Narayan et al., 1992), while long GRBs (lGRBs) originate from the core collapse of massive stars (Woosley, 1993; Paczyński, 1998; MacFadyen & Woosley, 1999; Woosley & Bloom, 2006). There is an overlap between the duration distributions of short and long classes. For this reason, the classification based on the burst duration is complemented by rudimentary spectral information, the hardness ratio (HR), available for all GRBs. Classifications based on two parameters provide better separation between the classes. On average, sGRBs are harder, while lGRBs are softer (Paciesas et al., 1999; Bhat et al., 2016; von Kienlin et al., 2020). In some cases even two parameters are not sufficient to derive a reliable classification and further observations are needed to hone in on the physical origin of the GRBs (see e.g. the Type I/II classification scheme by Zhang et al. (2009) and refer to Kann et al. (2011) for a discussion of controversial scenarios). LGRBs also include Ultra-long GRBs (ULGRBs) with a duration longer than thousands of seconds (Gendre et al., 2013; Levan et al., 2014; Piro et al., 2014; Greiner et al., 2015; Kann et al., 2018), and lGRBs associated with Supernovae (SNe) Ic (Hjorth et al., 2003). Additionally giant flares from extragalactic magnetars (Roberts et al., 2021) can masquerade as sGRBs at a rate of approximately one event per year (Burns et al., 2021) further complicating the picture.
At first glance, GRB 211211A is a bright, but otherwise typical lGRB suggesting a collapsar origin, based on the gamma-ray properties. However, Rastinejad et al. (2022); Troja et al. (2022) report a possible kilonova counterpart to GRB 211211A suggesting a compact merger origin, at odds with the gamma-ray classification. GRB 211211A represents one of the clearest breaks with the usual short/long classification. Some sGRB pulses are followed by a longer, extended gamma-ray emission, without associated supernovae (Gehrels et al., 2006). It is possible that GRB 211211A also belongs to this class.
One of the most intriguing features of GRBs is the short variations in their lightcurves. The observed variability could originate from the variations in the central engine with contributions from the jet interacting with the progenitor (Sari & Piran, 1997a; Morsony et al., 2010). This variability is imprinted on the emission processes (e.g. internal shocks Sari & Piran, 1997b), or alternatively can be ascribed to intrinsic variations in the emitting volume (e.g. by turbulence Narayan & Kumar, 2009). Typical variations can be as short as 10 ms, with a handful of examples of sub 10 ms variability. The most extreme case for a GRB is a 200 s variation (Bhat et al., 1992). On average, sGRBs have shorter variability than lGRBs (Bhat et al., 2012; Golkhou et al., 2015a). The variability timescale constrains the size of the emitting region based on causality arguments (Rybicki & Lightman, 1979).
Here, we place GRB 211211A in the context of Fermi Gamma-ray Burst Monitor (GBM) GRBs and report on the implications for future gravitational wave (GW) or kilonova searches associated with GRBs. We provide a detailed analysis of the gamma-ray lightcurve highlighting the extreme variability and discuss this the possible association of this GRB with the class of short GRBs with extended emission.
We present gamma-ray observations of GRB 211211A in Section 2, focusing on the minimum variability timescale (Section 3). We present GRB 211211A as a GRB with extended emission, and provide physical parameters of the outflow in Section 4. We end with discussing our results in Section 5. We use the convention in c.g.s. units for quantity and refer to physical constants using their common notations.
2 Data analysis
GRB 211211A (Mangan et al., 2021) triggered Fermi-GBM (Meegan et al., 2009) at 13:09:59.65 UT on December 11th, 2021 (). It showed significant emission in all 12 of GBM’s NaI and both the BGO detectors, up to an energy 20 MeV. At trigger time the location of the GRB was outside of the LAT field of view, however Mei et al. (2022) reported detection of photons in the GeV range at . Swift-BAT (D’Ai et al., 2021), CALET (Tamura et al., 2021), INTEGRAL-SPI/ACS (Minaev et al., 2021) and Insight-HXMT (Zhang et al., 2021) also detected GRB 211211A.
The duration calculated as the central percentile of the cumulative energy flux in the 50-300 keV range using the RMfit111https://fermi.gsfc.nasa.gov/ssc/data/analysis/rmfit software. The hardness ratio over the T90 duration, defined as the ratio of fluxes between 50-300 keV and 10-50 keV energy ranges is . These two parameters place GRB 211211A on the duration-hardness plane with high probability in the long population (Rastinejad et al., 2022; Bhat et al., 2016; von Kienlin et al., 2020; Rouco Escorial et al., 2021). For spectral analysis we use NaI detectors n2 and na and BGO detector b0. For temporal analysis we can use additional NaI detectors with significant flux: n0, n1, n2, n5, n9, na and nb.
2.1 Lightcurve
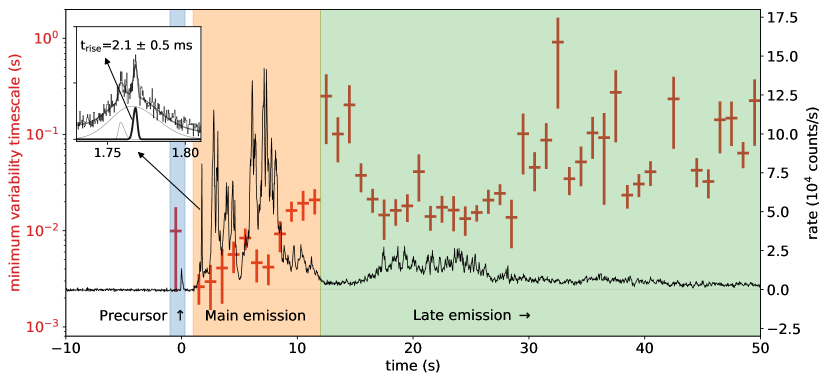
Morphologically, the lightcurve can be separated into three parts. This GRB starts with a brief standalone pulse, a precursor, lasting about 0.2 s. Interestingly Xiao et al. (2022), reported tentative quasi-periodic oscillations for this pulse. The second part is the brightest and we refer to it as the main emission episode. It starts at T0+1 s and lasts until T0+13 s. It consists of a large number of short peaks. The third part starts around +13 s, and we refer to it as late emission. It contains less variability than the main emission, it can be detected until about +70 s and it fades smoothly into the background (see Figure 1).
Taken by itself, with duration of , even the main emission episode would be classified as a lGRB. It is significantly longer than the s limit separating the short and long classes of GBM (von Kienlin et al., 2020). This limit represents the duration of equal probability between the long and short classes when we model the duration distribution using two log-normal components (see e.g. section 4.4 and the associated figure).
2.2 Spectrum
To compare GRB 211211A with other GRBs, we perform a spectral analysis of the brightest peak and the time integrated emission. We note that the time integrated analysis, with fluence does not capture the evolving trends observed in this burst by e.g. Gompertz et al. (2023) but it is suitable to determine the gamma-ray energetics. The peak flux, commonly reported on 64 ms (sGRBs) and 1.024 s (lGRBs) timescales is and , respectively. Both the time integrated and the peak spectra are best fit by Band functions (Band et al., 1993) with parameters presented in Table 2.
The redshift reported for the host galaxy is z=0.076 (Malesani et al., 2021), corresponding to a luminosity distance of =346 Mpc (using and (Planck Collaboration et al., 2020)). The isotropic-equivalent gamma-ray energy of GRB 211211A calculated in the 1-10,000 keV range is , the peak luminosity, calculated on a 64 ms and 1.024 s timescale is and respectively (see Table 2).
2.3 GRB 211211A in context of other GRBs
GRB 211211A has higher energy fluence (units of erg cm-2) than all but 4 GRBs in the GBM catalog (von Kienlin et al., 2020) (GRBs 130427A, 161625B, 171010A and 160821A), corresponding to 99.9th percentile among Fermi GBM GRBs (Poolakkil et al., 2021). The peak energy flux (units of erg cm-2 s-1) of GRB 211211A calculated for the brightest 64 ms is brighter than all short GRBs in the catalog. The 1.024 s peak energy flux of GRB 211211A is brighter than all but two long GRBs prior to GRB 211211A (GRB 130427A (Preece et al., 2014), and GRB 131014A (Guiriec et al., 2015)).
During the writing of this paper, Fermi-GBM detected GRB 221009A (Lesage et al., 2023) and GRB 230307A (Dalessi & Fermi GBM Team, 2023b) with peak fluxes and fluence larger than GRB 211211A. While GRB 221009A is clearly not from a compact binary merger (Fulton et al., 2023), GRB 230307A does bear some resemblance to GRB 211211A (see section 4.5).
The peak energy (Epeak) measured for the brightest 1 s (1030 keV) is 94.9 percentile among lGRBs and 84.9 percentile among sGRBs.
We conclude that GRB 211211A is at the bright end of peak flux and fluence distributions among both short and the long classes, making it an exceptional GRB in the Fermi GBM sample.
3 Minimum variability timescale
The minimum variability timescale (MVT) of a GRB lightcurve represents the shortest timescales, at which coherent changes can be identified. In practice it coincides with the typical timescale (e.g. the rise time) of the shortest pulse in the lightcurve. There are multiple mathematical methods in the literature to derive the MVT. Here we use the methods of Bhat et al. (2012); Bhat (2013) and Golkhou et al. (2015a), but see also MacLachlan et al. (2013).
We binned our lightcurve to s and searched for the shortest coherent variations. The variability using the method of Bhat et al. (2012) is ms. The Golkhou et al. (2015b) method gives a variability of ms. The two methods are independent, and they give consistent MVT values, strengthening the confidence that this is indeed the minimum variability timescale of this burst.
In addition, we identify a pulse with rise time of ms in Figure 1 (inset) that determines the MVT: we fit the high resolution (400 s) lightcurve in the range 1.73 to 1.81 s, (region of the lightcurve where the variability time is the shortest) with the pulse model of Norris et al. (2005), using 3 pulses plus a long term emission modeled as a first degree polynomial. The rise time of the shortest pulse is consistent with minimum variability timescale, as expected (Bhat et al., 2012). This ms timescale is significantly lower than the 16 ms variability reported by Yang et al. (2022) and the 10 ms reported by Xiao et al. (2022)
We also performed a time resolved variability analysis. We calculate the MVT in each 1 s bin (Figure 1) and find that the separation of the lightcurve into main and late emission is also reflected in the evolution of the variability timescale: the main emission episode has a clearly shorter variability than the late emission.
3.1 Long duration GRBs with short MVT
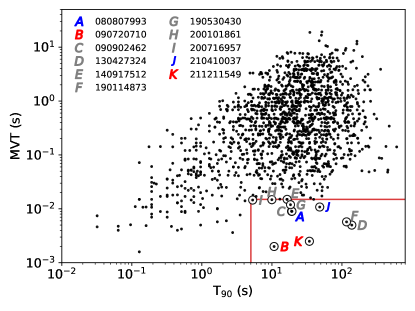
GRB 211211A, with MVT ms is a clear outlier in the distribution of the MVTs presented in Golkhou et al. (2015a) (see Figure 2, where we plot MVT values that have an uncertainty smaller than the value itself). We have searched for other GRBs that have long duration (T), and short variability. The sample of Golkhou et al. (2015a) contained MVT values only until 2012. We extended their sample with bursts up to 2022, by additional 2124 Fermi-GBM GRBs.
Because the MVT calculation depends on multiple input parameters, that can affect the final value (e.g. detector selection, background, foreground interval, method, etc.), we allow a limit of MVT15 ms and in searching for GRB similar to GRB 211211A (see Figure 2).
Applying the above limit, we found 10 potentially interesting GRBs in our sample (see Figure 2). Many of the selected bursts are known, bright GRBs with associated supernovae (e.g. GRB 130427A (Preece et al., 2014) and GRB 190114C (Ajello et al., 2020)), or their lightcurve does not resemble that of GRB 211211A. We inspected each GRB lightcurve visually, looking for similar lightcurve morphology to GRB 211211A, namely an initial bright, variable phase followed by a longer, less luminous emission episode. After visual inspection of the candidates, we find 3 additional cases with similar lightcurves as GRB 211211A. Among these three, only GRB 090720B has comparable variability timescale ( 2 ms), while other similar GRBs: 210410A and 080807 have 10 ms variability. We thus conclude that bursts with long duration and short variability are rare, especially those GRBs that exhibit a short pulse followed by softer, extended emission. We further conclude that GRB 211211A lies at the extreme low end of the variability timescale distribution of Fermi-GRBs.
| GRB | T90(s) | MVT(s) |
|---|---|---|
| 120712571 | ||
| 120716577 | ||
| 120728934 | ||
| 120805706 | ||
| 120806007 | ||
| 120811014 |
| Time (s) | Epeak | Energy Flux | Fluence | Liso | Eiso | ||
|---|---|---|---|---|---|---|---|
| T- (s) | keV | ||||||
| 0-52.2 | - | - | |||||
| 7.104-7.168 | - | - | |||||
| 7.168-8.192 | - | - |
Note. — Spectral parameters for GRB 211211A fitting a Band function and using the standard time intervals: the entire GRB, brightest 1024 ms and 64 ms. The flux and fluence are reported in the 10-1,000 keV range. Liso and Eiso are reported in the 1-10,000 keV (observer) range.
4 Results
4.1 GRB 211211A as a short GRB with extended emission
GRB 060614 (Gehrels et al., 2006), a nearby long event with duration in excess of 100 s has no supernova detection to deep limits, indicating a possible merger origin. Its lightcurve morphology, a short pulse, followed by extended emission established a new category of GRBs (sGRB-EE). GRB 060614 was detected by Swift-BAT. For this GRB we derive an MVT value of ms. Rastinejad et al. (2022); Gompertz et al. (2023); Xiao et al. (2022); Troja et al. (2022) find that GRB 211211A has broadly consistent properties with other sGRB-EE GRBs. We also find that GRB 211211A has consistent features with sGRB-EE. The time-resolved MVT (Figure 1) also clearly delineates the sGRB and the extended emission.
Kaneko et al. (2015) considered a sample of sGRB-EE in the Fermi-GBM sample. We extend their list (see Table 3) and investigate the variability timescale of sGRB-EE (Burns et al. in preparation). We find that GRB 211211A has shorter variability timescale than all the GBM sGRB-EE. This means that the MVT of GRB 211211A is extreme also among the short GRBs with extended emission (including the archetypal GRB 060614). We also note that the MVT of GRB 211211A is close to the short end of even the short duration GRBs (see Figure 2).
| Trigger number | MVT (ms) | T90 (s) |
|---|---|---|
| 081110601 | ||
| 090227772 | ||
| 090510016 | ||
| 090831317 | ||
| 100916779 | ||
| 111221739 | ||
| 140819160 | ||
| 170728961 | ||
| 180618030 | ||
| 190308923 | ||
| 200219317 | ||
| 200313456 | ||
| 201104001 |
4.2 Possible afterglow origin of the late emission
As noted in the previous section, GRB 211211A fits into the category of short GRB with extended emission (Gehrels et al., 2006; Norris et al., 2010). The main emission plays the role of the short GRB, and the late emission episode corresponds to the extended emission.
The origin of the extended emission is unclear, sometimes it is associated with late energy injection into the GRB (e.g. Bucciantini et al., 2012). In many cases, the extended emission has appreciable variability and for this reason its association with afterglow emission is generally disfavored (Norris & Bonnell, 2006). Based on the fact that the late emission (+12 to +70 s in Figure 1) has longer variability timescale than the main emission, we explore the afterglow origin for the late emission. In this scenario the late emission is emitted by the shocked circumstellar medium as it slows down the shells that were responsible for the prompt emission. Detecting the afterglow in the -ray regime has been reported before (e.g. Giblin et al., 1999; Connaughton, 2002; Ajello et al., 2020) and it is common for bright GRBs.
Early afterglow lightcurves, especially in X-ray and GeV sometimes show a rising phase, peak and a decay representing the onset of the afterglow. Here the peak marks the deceleration time. We binned the GBM lightcuve from 13 to 70 s after the trigger into bins with signal to noise ratio of 60. We fit each spectrum with a Comptonized function (power law with exponential utoff) and calculate the flux density at 10 keV (see Figure 3). The flux evolution shows a clear peak. We fit the flux density curve with a smoothly broken power law function, , where is the smoothness parameter, fixed here to 1. We find the index of the rising phase consistent with the expectation of if it originates from the forward shock before deceleration (Sari & Piran, 1999). We note that is sensitive to the choice of the zero point. Here we choose T0 + 9 s, because this is the approximate end time of the highly variable, main emission episode. The peak of the flux occurs at after the trigger time. The temporal decay index after the peak is , which in the forward shock scenario corresponds to , where is the index of shocked electron population’s the power law distribution. In our case we get , which is consistent with the values that are commonly found for afterglows (e.g. Panaitescu & Kumar, 2001).
We thus conclude that the afterglow interpretation is possible at least in some cases of GRBs with extended emission.

4.3 Lorentz factor constraints
The Lorentz factor of the outflow is a basic ingredient of the physical picture. We can provide a lower limit on the Lorentz factor if the highly variable prompt gamma-ray lightcurve is produced by internal shocks (Rees & Mészáros, 1994). In this scenario the emission radius () has to be above the photosphere () where the optical depth is unity. The internal shock radius is , while the photosphere radius is , assuming the photosphere occurs in the coasting phase (i.e. the jet does not accelerate any more, constant). From , we have
| (1) |
Meaningful Lorentz factor constraint using this method is only possible for GRBs with high luminosity and short variability, uniquely relevant for GRB 211211A.
We can calculate the bulk Lorentz factor by identifying the peak of Figure 3 with the onset of the afterglow or the deceleration time. The deceleration radius corresponding to the deceleration time () marks the distance from the central engine where the relativistic outflow has plowed up interstellar matter that is a fraction of the jet mass. Using the expression of , the Lorentz factor evolving a constant-density medium will be:
| (2) | |||||
| (3) |
Here we chose a gamma-ray efficiency of , where is the kinetic isotropic equivalent energy, and the constant interstellar number density, as scaling values, from Mei et al. (2022). If we conservatively measure the peak from the trigger time, instead of the shift that we introduced, the Lorentz factor becomes .
Sonbas et al. (2015) present a correlation between variability timescale and Lorentz factor based on a compilation of Lorentz factor estimates. The relationship they find is for and constant otherwise. Inverting the correlation, and substituting ms, we get , which is consistent with the above estimates. Furthermore, the Lorentz factor estimates from different methods are consistent with the best estimate by Mei et al. (2022) of . In the internal shock scenario the emission radius of the gamma-rays will be:
| (4) |
4.4 Event rate: the tail of the merger distribution
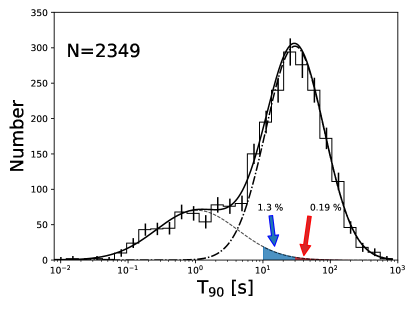
The 10 year GBM GRB catalog (von Kienlin et al., 2020) contains in excess of 2300 GRBs with duration measurements. The distribution of the T90 durations is modeled as the sum of two log-normal functions. The exact reason why the T90 distribution would follow a log-normal distribution is unclear (for a possible explanation see Ioka & Nakamura, 2002), and in reality the distributions could be asymmetrical (Tarnopolski, 2019). Because the two component model provides a good fit to the distribution, we will consider this description to calculate the rate for mergers masquerading as lGRBs (see Figure 4).
We integrate the short model from 10 s, broadly corresponding to the duration of the main emission and the actual of the similarly short MVT GRB 090720B (Section 4.5). We also integrate the short model component for corresponding roughly to the of GRB 211211A. We find about 1.3 % (3 per year) of short Fermi-GBM GRBs will have 10 s and about 0.19 % (0.4 per year) of short GRBs will have 30 s.
4.5 Other examples of long duration and short MVT
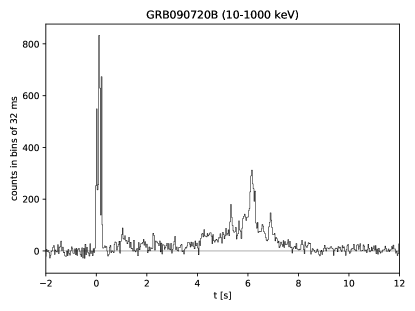
GRB 090720B (GBM trigger 090720710, Burgess et al. (2009)) was a bright GRB, with similar properties as GRB 211211A: an initial bright, highly variable set of overlapping pulses, followed by weaker, less variable emission (Figure 5). We cross-check the short variability measurement by Golkhou et al. (2015a), ms, and consistently find ms with the method of Bhat et al. (2012). The duration of this GRB is . Time resolved variability similarly shows a shorter timescale in the main emission compared to the longer lasting episode. GRB 090720B has no redshift measurement, however it is detected by Fermi-LAT (Rubtsov et al., 2012; Ajello et al., 2019).
Two further examples with larger variability timescale ( 10 ms) are GRB 080807 (von Kienlin et al., 2020) and 210410A (Wood et al., 2021) with of and respectively. Neither have a redshift measurement. Except for GRB 080807, the other 3 selected GRBs have been detected at high energy by LAT. GRB 080807 occurred in a unfavorable geometry for LAT.
GRB 230307A is a recent bright GRB that has tentatively similar properties as GRB 211211A. Despite its long duration (, Dalessi & Fermi GBM Team (2023b)) it shows short variations like GRB 211211A and has tentative kilonova signature (Levan et al., 2023). Because of its extreme brightness the prompt measurement suffers from instrumental effects (Dalessi & Fermi GBM Team, 2023a). A detailed study of GRB 230307A is left for a forthcoming paper.
4.6 Implications for searches for GW counterparts
Having characterized the gamma-ray emission of GRB 211211A, there still remains an intriguing question. How can a merger event give rise to a GRB that has a duration well in excess of the historical 2 s limit between the short and long classes? Even if we place GRB 211211A at a larger distance where only the main emission episode is detectable, its duration will be 10 s and it will be classified as a likely long GRB. This suggests that GRBs with duration 5 s can possibly originate from compact binary mergers and be gravitational wave counterparts. Follow-up decisions should consider this fact.
If a sub-class of long GRBs corresponds to compact binary mergers as their source then this will have implications for the gravitational-wave signal search strategy of LIGO-Virgo-KAGRA (LVK). Currently LVK search for gravitational waves in coincidence with GRBs detected by the Fermi and Swift satellites (Abbott et al., 2021, 2022). In these searches, GRBs are classified as short if s, long if s, or ambiguous for all the other cases. The times coincident with GRBs classified as short or ambiguous are searched for gravitational-wave signals from compact binary mergers using a coherent matched filter analysis, PyGRB (Harry & Fairhurst, 2011; Williamson et al., 2014). The merger time is assumed to fall within a s window, where 0 corresponds to the GRB trigger time.
LVK also use an excess power analysis to search for generic transient signals associated with all GRBs, namely X-Pipeline (Sutton et al., 2010; Was et al., 2012). The search window for gravitational-wave transients begins 600 s before the GRB trigger time, and stops 60 s after trigger time; if s then the end of the search window is .
During observing run O3, times coincident with 49 GRBs were examined targeting compact binary merger signals. The times coincident with 191 GRBs were examined with the generic search pipeline (Abbott et al., 2021, 2022). If only the GRB is considered, as is presently the case for these LVK analyses, then including GRBs such as GRB 211211A will require a significant broadening of the “ambiguous” class, considerably increasing the number of GRBs that will have to be analyzed with the compact binary merger pipeline. This is not an impossible challenge, but would require significantly more human and computing resources, and would increase the chance of a false alarm from the significantly larger sample of GRBs that are not originated by compact binary mergers.
The results of this study motivate the design of a more reliable GRB classification scheme that includes the MVT in addition to . The observation of a kilonova should obviously also be incorporated into this improved classification.
5 Discussion and Conclusion
The observation of GRB 211211A represents one of the clearest examples that defy the duration based GRB classification scheme. We analyzed the gamma-ray properties of GRB 211211A in context of the Fermi-GBM GRB population. We found that GRB 211211A is one of the brightest GRBs among both the merger and collapsar population.
We found indications that the extended emission can be modeled as early afterglow in the gamma-rays, and that leads to an estimate of the Lorentz factor. We calculated the variability timescale with different methods and conclusively found one of the shortest variation among long duration GRBs. The short variability has implications on the emission mechanisms and lets us determine the physical parameters of the source. We found the Lorentz factor consistent with , which puts it among the highest inferred values. agrees well with the value reported by Mei et al. (2022) and it is larger than the values () derived by Gompertz et al. (2023); Rastinejad et al. (2022).
We estimated the fraction of short GRBs based on the best fit to the duration distribution. Even though the extrapolation is uncertain, we can conclude that GRBs per year with merger origin will have , and GRBs per year will have .
The realization that long GRBs can also emanate from binary mergers has profound implications on the follow-up program of future GW observations. First of all, if a GRB presents a spike and extended emission structure, follow-up is warranted. Here we propose that fast variations in the lightcurve may be a distinguishing feature of mergers. It is more likely however that the variations have a continuous distribution and GRB 211211A is special even among the short GRBs with extended emission. Indeed we found that only one long GRB has comparably short MVT. The flux and fluence of GRB 211211A are both extreme among the Fermi-GBM GRBs.
Acknowledgements- UAH co-authors acknowledge NASA funding from cooperative agreement 80MSFC22M0004. NF is grateful to UNAM-DGAPA-PAPIIT for the funding provided by grant IN106521. USRA co-authors acknowledge NASA funding from cooperative agreement 80MSFC17M0022.
References
- Abbott et al. (2017) Abbott, B. P., Abbott, R., Abbott, T. D., et al. 2017, ApJ, 848, L13
- Abbott et al. (2021) Abbott, R., et al. 2021, Astrophys. J., 915, 86
- Abbott et al. (2022) —. 2022, Astrophys. J., 928, 186
- Ajello et al. (2019) Ajello, M., Arimoto, M., Axelsson, M., et al. 2019, ApJ, 878, 52
- Ajello et al. (2020) —. 2020, ApJ, 890, 9
- Band et al. (1993) Band, D., Matteson, J., Ford, L., et al. 1993, ApJ, 413, 281
- Bhat et al. (2016) Bhat, N. P., Meegan, C. A., von Kienlin, A., et al. 2016, ApJS, 223, 28
- Bhat (2013) Bhat, P. N. 2013, arXiv e-prints, arXiv:1307.7618
- Bhat et al. (1992) Bhat, P. N., Fishman, G. J., Meegan, C. A., et al. 1992, Nature, 359, 217
- Bhat et al. (2012) Bhat, P. N., Briggs, M. S., Connaughton, V., et al. 2012, ApJ, 744, 141
- Bucciantini et al. (2012) Bucciantini, N., Metzger, B. D., Thompson, T. A., & Quataert, E. 2012, MNRAS, 419, 1537
- Burgess et al. (2009) Burgess, J. M., Goldstein, A., & van der Horst, A. J. 2009, GRB Coordinates Network, 9698, 1
- Burns et al. (2021) Burns, E., Svinkin, D., Hurley, K., et al. 2021, The Astrophysical Journal Letters, 907, L28
- Connaughton (2002) Connaughton, V. 2002, ApJ, 567, 1028
- D’Ai et al. (2021) D’Ai, A., Ambrosi, E., D’Elia, V., et al. 2021, GRB Coordinates Network, 31202, 1
- Dalessi & Fermi GBM Team (2023a) Dalessi, S., & Fermi GBM Team. 2023a, GRB Coordinates Network, 33551, 1
- Dalessi & Fermi GBM Team (2023b) —. 2023b, GRB Coordinates Network, 33407, 1
- Duncan & Thompson (1992) Duncan, R. C., & Thompson, C. 1992, ApJ, 392, L9
- Fulton et al. (2023) Fulton, M. D., Smartt, S. J., Rhodes, L., et al. 2023, ApJ, 946, L22
- Gehrels et al. (2006) Gehrels, N., Norris, J. P., Barthelmy, S. D., et al. 2006, Nature, 444, 1044
- Gendre et al. (2013) Gendre, B., Stratta, G., Atteia, J. L., et al. 2013, ApJ, 766, 30
- Giblin et al. (1999) Giblin, T. W., van Paradijs, J., Kouveliotou, C., et al. 1999, ApJ, 524, L47
- Goldstein et al. (2017) Goldstein, A., Veres, P., Burns, E., et al. 2017, ApJ, 848, L14
- Golkhou et al. (2015a) Golkhou, V. Z., Butler, N. R., & Littlejohns, O. M. 2015a, ApJ, 811, 93
- Golkhou et al. (2015b) —. 2015b, ApJ, 811, 93
- Gompertz et al. (2023) Gompertz, B. P., Ravasio, M. E., Nicholl, M., et al. 2023, Nature Astronomy, 7, 67
- Greiner et al. (2015) Greiner, J., Mazzali, P. A., Kann, D. A., et al. 2015, Nature, 523, 189
- Guiriec et al. (2015) Guiriec, S., Mochkovitch, R., Piran, T., et al. 2015, ApJ, 814, 10
- Harry & Fairhurst (2011) Harry, I. W., & Fairhurst, S. 2011, Phys. Rev. D, 83, 084002
- Hjorth et al. (2003) Hjorth, J., Sollerman, J., Møller, P., et al. 2003, Nature, 423, 847
- Ioka & Nakamura (2002) Ioka, K., & Nakamura, T. 2002, ApJ, 570, L21
- Kaneko et al. (2015) Kaneko, Y., Bostancı, Z. F., Göğüş, E., & Lin, L. 2015, MNRAS, 452, 824
- Kann et al. (2011) Kann, D. A., Klose, S., Zhang, B., et al. 2011, ApJ, 734, 96
- Kann et al. (2018) Kann, D. A., Schady, P., Olivares, E. F., et al. 2018, A&A, 617, A122
- Kouveliotou et al. (1993) Kouveliotou, C., Meegan, C. A., Fishman, G. J., et al. 1993, ApJ, 413, L101
- Lesage et al. (2023) Lesage, S., Veres, P., Briggs, M. S., et al. 2023, arXiv e-prints, arXiv:2303.14172
- Levan et al. (2014) Levan, A. J., Tanvir, N. R., Starling, R. L. C., et al. 2014, ApJ, 781, 13
- Levan et al. (2023) Levan, A. J., Gompertz, B. P., Malesani, D. B., et al. 2023, GRB Coordinates Network, 33569, 1
- MacFadyen & Woosley (1999) MacFadyen, A. I., & Woosley, S. E. 1999, ApJ, 524, 262
- MacLachlan et al. (2013) MacLachlan, G. A., Shenoy, A., Sonbas, E., et al. 2013, MNRAS, 432, 857
- Malesani et al. (2021) Malesani, D. B., Fynbo, J. P. U., de Ugarte Postigo, A., et al. 2021, GRB Coordinates Network, 31221, 1
- Mangan et al. (2021) Mangan, J., Dunwoody, R., Meegan, C., & Fermi GBM Team. 2021, GRB Coordinates Network, 31210, 1
- Meegan et al. (2009) Meegan, C., Lichti, G., Bhat, P. N., et al. 2009, ApJ, 702, 791
- Mei et al. (2022) Mei, A., Banerjee, B., Oganesyan, G., et al. 2022, Nature, 612, 236
- Minaev et al. (2021) Minaev, P., Pozanenko, A., & GRB IKI FuN. 2021, GRB Coordinates Network, 31230, 1
- Morsony et al. (2010) Morsony, B. J., Lazzati, D., & Begelman, M. C. 2010, ApJ, 723, 267
- Narayan & Kumar (2009) Narayan, R., & Kumar, P. 2009, MNRAS, L193+
- Narayan et al. (1992) Narayan, R., Paczynski, B., & Piran, T. 1992, ApJ, 395, L83
- Norris & Bonnell (2006) Norris, J. P., & Bonnell, J. T. 2006, ApJ, 643, 266
- Norris et al. (2005) Norris, J. P., Bonnell, J. T., Kazanas, D., et al. 2005, ApJ, 627, 324
- Norris et al. (2010) Norris, J. P., Gehrels, N., & Scargle, J. D. 2010, ApJ, 717, 411
- Paciesas et al. (1999) Paciesas, W. S., Meegan, C. A., Pendleton, G. N., et al. 1999, ApJS, 122, 465
- Paczyński (1998) Paczyński, B. 1998, ApJ, 494, L45
- Panaitescu & Kumar (2001) Panaitescu, A., & Kumar, P. 2001, ApJ, 560, L49
- Piro et al. (2014) Piro, L., Troja, E., Gendre, B., et al. 2014, ApJ, 790, L15
- Planck Collaboration et al. (2020) Planck Collaboration, Aghanim, N., Akrami, Y., et al. 2020, A&A, 641, A6
- Poolakkil et al. (2021) Poolakkil, S., Preece, R., Fletcher, C., et al. 2021, ApJ, 913, 60
- Preece et al. (2014) Preece, R., Burgess, J. M., von Kienlin, A., et al. 2014, Science, 343, 51
- Rastinejad et al. (2022) Rastinejad, J. C., Gompertz, B. P., Levan, A. J., et al. 2022, Nature, 612, 223
- Rees & Mészáros (1994) Rees, M. J., & Mészáros, P. 1994, ApJ, 430, L93
- Roberts et al. (2021) Roberts, O. J., Veres, P., Baring, M. G., et al. 2021, Nature, 589, 207
- Rouco Escorial et al. (2021) Rouco Escorial, A., Fong, W., Veres, P., et al. 2021, ApJ, 912, 95
- Rubtsov et al. (2012) Rubtsov, G. I., Pshirkov, M. S., & Tinyakov, P. G. 2012, MNRAS, 421, L14
- Rybicki & Lightman (1979) Rybicki, G. B., & Lightman, A. P. 1979, Radiative processes in astrophysics (New York, Wiley-Interscience, 1979. 393 p.)
- Sari & Piran (1997a) Sari, R., & Piran, T. 1997a, MNRAS, 287, 110
- Sari & Piran (1997b) —. 1997b, ApJ, 485, 270
- Sari & Piran (1999) —. 1999, ApJ, 520, 641
- Sonbas et al. (2015) Sonbas, E., MacLachlan, G. A., Dhuga, K. S., et al. 2015, ApJ, 805, 86
- Sutton et al. (2010) Sutton, P. J., et al. 2010, New J. Phys., 12, 053034
- Tamura et al. (2021) Tamura, T., Yoshida, A., Sakamoto, T., et al. 2021, GRB Coordinates Network, 31226, 1
- Tarnopolski (2019) Tarnopolski, M. 2019, ApJ, 870, 105
- Thompson (1994) Thompson, C. 1994, MNRAS, 270, 480
- Troja et al. (2022) Troja, E., Fryer, C. L., O’Connor, B., et al. 2022, Nature, 612, 228
- Usov (1992) Usov, V. V. 1992, Nature, 357, 472
- von Kienlin et al. (2020) von Kienlin, A., Meegan, C. A., Paciesas, W. S., et al. 2020, arXiv e-prints, arXiv:2002.11460
- Was et al. (2012) Was, M., Sutton, P. J., Jones, G., & Leonor, I. 2012, Phys. Rev. D, 86, 022003
- Williamson et al. (2014) Williamson, A. R., Biwer, C., Fairhurst, S., et al. 2014, Phys. Rev. D, 90, 122004
- Wood et al. (2021) Wood, J., Meegan, C., & Fermi GBM Team. 2021, GRB Coordinates Network, 29788, 1
- Woosley (1993) Woosley, S. E. 1993, ApJ, 405, 273
- Woosley & Bloom (2006) Woosley, S. E., & Bloom, J. S. 2006, ARA&A, 44, 507
- Xiao et al. (2022) Xiao, S., Zhang, Y.-Q., Zhu, Z.-P., et al. 2022, arXiv e-prints, arXiv:2205.02186
- Yang et al. (2022) Yang, J., Zhang, B. B., Ai, S. K., et al. 2022, arXiv e-prints, arXiv:2204.12771
- Zhang et al. (2009) Zhang, B., Zhang, B.-B., Virgili, F. J., et al. 2009, ApJ, 703, 1696
- Zhang et al. (2021) Zhang, Y. Q., Xiong, S. L., Li, X. B., et al. 2021, GRB Coordinates Network, 31236, 1