Revisiting the magnetic structure of Holmium at high pressure: a neutron diffraction study
Abstract
Low-temperature neutron diffraction experiments at GPa have been conducted to investigate the magnetic structures of metallic Holmium at high pressures by employing a long -spacing high-flux diffractometer and a Paris-Edinburgh press cell inside a cryostat. We find that at GPa and K, no nuclear symmetry change is observed, keeping therefore the hexagonal closed packed () symmetry at high pressure. Our neutron diffraction data confirm that the ferromagnetic state does not exist. The magnetic structure corresponding to the helimagnetic order, which survives down to 5 K, is fully described by the magnetic superspace group formalism. These results are consistent with those previously published using magnetization experiments.
I Introduction
Ferromagnetic metals have played an important role in condensed matter physics from the viewpoint of its magnetism originated from itinerant electrons Chikazumi (1997). In the 3-electron ferromagnetic transition metals based on Fe, Co, and Ni, the mechanism responsible for their ferromagnetism can be understood within the Stoner model Stoner (1939).
On the other hand, the ferromagnetism in the 4-electron lanthanide metals, such as Gd, Tb, Dy, Ho, Er, and Tm, is explained by the Ruderman-Kasuya-Kittle-Yosida (RKKY) interaction between localized moments of the -orbital electrons mediated by the conduction electrons Ruderman and Kittel (1954); Kasuya (1956); Yosida (1957). The spatially damped oscillation of the conduction electron spin polarization is responsible of the competition between the ferromagnetic (FM) and antiferromagnetic (AFM) interactions, which often results in an incommensurate helimagnetic structure (HM).
At low temperatures, the subtle lattice contractions modify the RKKY interaction () and the HM state is destabilized giving place to a FM ground state. Hereafter, the magnetic transition temperatures between the FM and HM states and between the HM and the paramagnetic (PM) states are denoted as and , respectively.
All 4-lanthanide FM metals have an hexagonal closed packed, hcp, structure with stacking unit ABA at ambient pressure (AP), and exhibit the structural series of transformations in the sequence hcp (ABA) Sm-type (ABABCBCACA) double-hcp (dhcp) (ABACA) fcc (ABCA) trigonal under increasing pressure. Akella, Smith, and Jephcoat (1988); Grosshans and Holzapfel (1992)
The variation of the magnetic properties with the structural transformations in 4-lanthanide metals has been studied theoretically Hughes et al. (2007) and reported experimentally by magnetic characterization McWhan and Stevens (1965); Iwamoto et al. (2003); Jackson et al. (2005); Mito et al. (2009, 2021), electrical resistivity Thomas et al. (2012); Samudrala et al. (2014a); Thomas et al. (2013); Samudrala et al. (2014b); Lim et al. (2015a, b, 2017), neutron diffraction Umebayashi et al. (1968); Kawano et al. (1992); Thomas et al. (2013, 2012); Perreault et al. (2019, 2022, 2020), X-ray diffraction Cunningham, Qiu, and Vohra (2006), and Mössbauer spectroscopy Bi et al. (2017). In particular, neutron diffraction experiments have been successfully employed to study the magnetic phases of Ho metal at high pressures and variable temperatures, as we briefly summarize in the next paragraph.
The first neutron scattering experiment in this metal was performed at AP by Koehler et al. Koehler et al. (1966). In it, they reported that the Ho magnetic moments form a basal plane helix below K, and a conical configuration was developed below K, with a net magnetic moment parallel to the -axis, in agreement with later neutron experiments Pechan and Stassis (1984); Simpson et al. (1995). In year 1968, Umebayashi et al. Umebayashi et al. (1968) studied Tb and Ho at pressures below 1 GPa and temperatures above 80 K, where the pressure dependences of and the helical turn angle were measured. It was found that the HM ordering occurs at lower temperatures with increasing pressure. In 1988, Achiwa et al. Achiwa et al. (1988) studied the Ho metal up to 2.1 GPa in the temperature range 10 K to . The helical pitch angle evolution with temperature was found in agreement with Ref. Umebayashi et al. (1968) for GPa, while for higher pressures the values of the angle increased, and a lock-in value appeared below 20 K.
Recently, the new available extreme conditions neutron diffractometers have facilitated the study of the high pressure region of Holmium. In 2012, Thomas et al. Thomas et al. (2012) performed neutron diffraction experiments at maximum pressures of 6.6 GPa at 89, 110 and 300 K. They established the incommensurate nature of the HM phase and determined the decrease of from approximately 122 K at AP at a rate of -4.9 K/GPa up to a pressure of 9 GPa, above which the PM to HM transition vanishes, in agreement with Ref. Umebayashi et al. (1968); Achiwa et al. (1988). In 2020, Perreault et al. Perreault et al. (2020) performed neutron diffraction experiments at maximum pressures of 20 GPa and minimum temperatures of 10 K. They observed two magnetic transitions below 10 GPa: one to an incommensurate HM phase and another to a conical FM phase. For pressures above 10 GPa in the Sm-type phase, and above 19 GPa in the phase, the appearance of a magnetic peak at 3 Å and the increase of the intensity of some nuclear peaks were assigned to the presence of a FM ordering below 30 K.
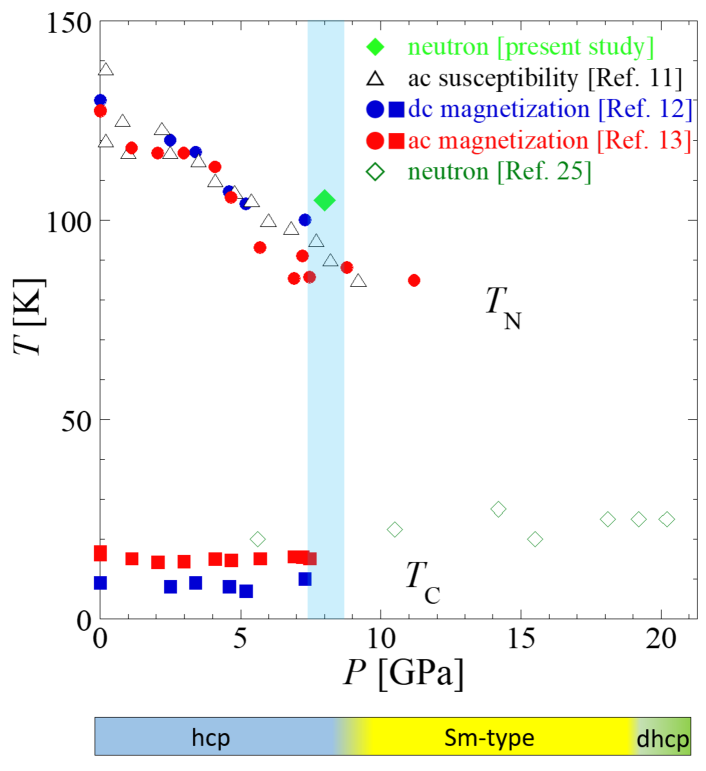
The dependence of and , evaluated with magnetic susceptibility Jackson et al. (2005) (black-empty symbols), a.c and d.c magnetization Mito et al. (2009, 2021) (blue and red filled symbols), and neutron diffraction Perreault et al. (2020) (green-empty symbols) is showed for Ho in the magnetic phase diagram in Fig. 1.
In our recent a.c. magnetization measurements, using a superconducting quantum interference device (SQUID) magnetometer at zero applied magnetic field ( = 0 T), the signal of the FM anomaly was reduced below any detectable level at a pressure between 5.7 and 8.8 GPa Mito et al. (2021). The anomaly at 5.7 GPa suggested a first order phase transition that remained in the range 0.5 - 11.6 GPa after remeasuring the sample by decreasing the pressure from 11.2 GPa (the results in the sequence after 11.2 GPa are not visible in Fig. 1 but details can be found in ref. Mito et al. (2021)). Thus, residual strain influenced the suppression of the FM order.
In our previous d.c. magnetization measurements at = 0.5 T, which is one-third of the critical field to the saturated state, the FM anomaly was still observed at 7.3 GPa, and a broad hump appeared at 9.2 GPa Mito et al. (2009). It suggests that the FM order becomes unstable above 7.3 GPa and a short range order composed of small grains is developed at 9.2 GPa. In different magnetization measurements, using a SQUID vibrating-coil-magnetometer method, the development of a ferromagnetic magnetization was observed at 8.2 GPa, which disappeared at 12 GPa Mito et al. (2021). All these facts together stressed that the region of 8 - 12 GPa is a critical region for the FM ordering.
Thus, different series of magnetic measurements showed that; i) the HM transition was observed at pressures up to 12 GPa, while the FM transition seems to be unstable at approximately 8 GPa, and ii) the ferromagnetic short range ordering could survive until approximately 11 GPa Mito et al. (2009, 2021).
However, previous neutron diffraction experiments, covering a spacing between 1.0 - 3.5 , reported that the FM ordering survives until at least 20 GPa Perreault et al. (2020). Therefore, it seems that a controversy exists between the last neutron diffraction experiments by Perreault et al. Perreault et al. (2020) and the macroscopic magnetic characterization of Ho at high pressures Mito et al. (2009, 2021).
To solve this controversy, in the present study, by performing neutron powder diffraction experiments at low temperatures, but covering a wide -spacing region (), we determined the magnetic structure at 8 GPa, in the temperature range . The magnetic superspace group (MSSG) formalism Janner and Janssen (1980); Perez-Mato et al. (2012); Rodríguez-Carvajal and Villain (2019) has been employed to classify the symmetry of the magnetic structure.
II High Pressure Neutron Diffraction Experiments
Polycrystalline sample of metallic natural Ho with high purity (99.999) was purchased from Sigma-Aldrich. Especial care was taken to manipulate the sample minimizing the exposure time to air.
Neutron powder diffraction experiments were carried out on the high-flux 2-axis neutron diffractometer D1B of the Institut Laue-Langevin (ILL) in Grenoble, France. This instrument has a MWGC 1D-detector spanning an angular range of 128∘ with a definition of 0.1∘. A Radial Oscillating Collimator (ROC) was installed in order to eliminate the spurious signals produced by the sample environment.
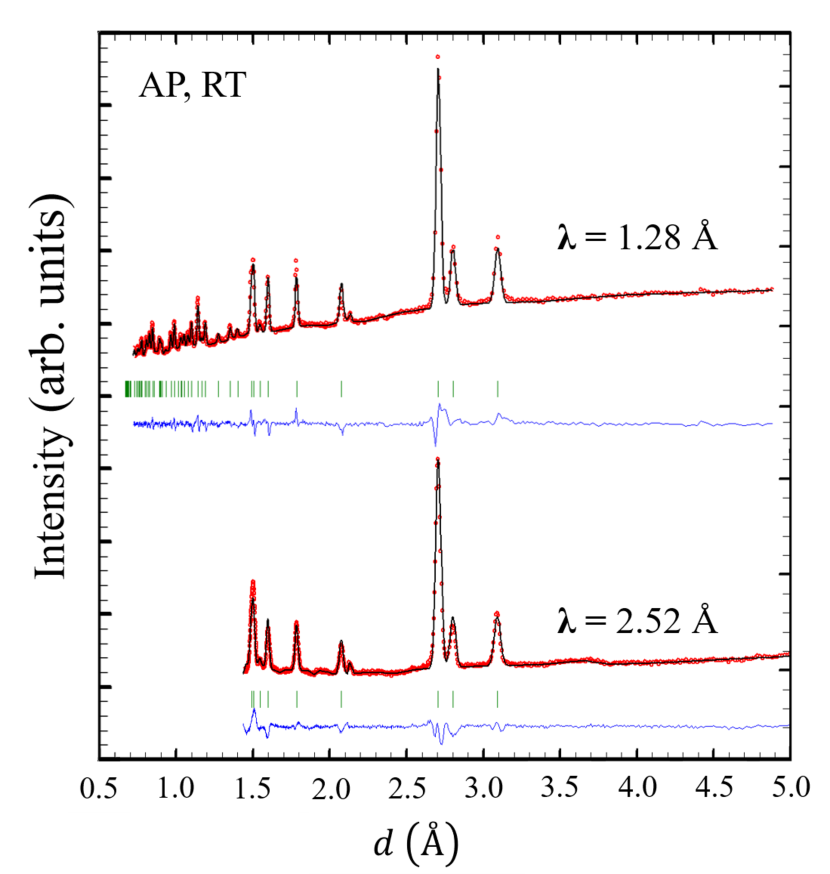
Two data acquisitions were taken at AP and room temperature (RT) for a Ho powder sample inside a 6 mm diameter vanadium can, with neutron wavelengths of Å and 2.52 Å which allowed to explore -spacings, respectively, of 0.7–15.0 Å and 1.4–50 Å.
The data collection at 8 GPa were performed with Å which correspond to the maximum flux configuration of the D1B instrument. For these acquisitions, the powder was placed in a null-scattering TiZr gasket using a deuterated 4:1 ethanol-methanol mix as pressure transmitter medium, (the same that the one employed before by Perreault et al. at 20 GPa Perreault et al. (2020)), which is the typical in all the neutron diffraction experiments. Then, it was introduced inside a VX5/180 Paris-Edinburgh (PE) pressure cell Besson et al. (1992); Klotz et al. (2005) equipped with SINE-type sintered diamond anvils Klotz et al. (2020). A pressure of 0.12 GPa was applied to the PE cell, which for the sample corresponded to 8 GPa, after calibration with a Pb flake placed with the sample. Then the PE cell was cooled using liquid nitrogen and helium from RT to 5 K. At this temperature, a 4.5 hours isotherm acquisition was performed. Then the sample was warmed back to RT in 10 hours and diffractograms were collected every 15 minutes.
It is well known that the 4:1 ethanol-methanol mixture is not the ideal transmitting media at low temperatures but it is a good approach to the hydrostatic behavior at room temperature for pressures below 10 GPa Otto, Vassiliou, and Frommeyer (1998). Furthermore, the fact that we do not detect any remarkable change, with decreasing the temperature, with the sample inside the PE cell, neither in the background of the diffractograms, nor in the width of the Bragg lines (see Fig. 3), suggests that the quality of the pressure at 5 K is good enough in our experimental conditions.
Different crystallographic tools were employed for the determination of the crystal and magnetic structures, which include the FullProf Suite Rodríguez-Carvajal (1993), the ISODISTORT Suite Stokes, Hatch, and Campbell (2017); Campbell et al. (2006), and utilities within the Bilbao Crystallographic Server Aroyo et al. (2011, 2006a, 2006b); Perez-Mato et al. (2015) for the symmetry analysis and visualization.
III Results and Analysis
III.1 = 0 GPa
Figure 2 shows the diffraction patterns collected with wavelengths Å (top) and 2.52 Å (bottom). The peaks observed in the diffraction patterns at AP and RT can be indexed by the paramagnetic MSSG (No. 194.264). This crystal structure corresponds with a hcp structure where the Ho atom is located in the Wyckoff position (WP) , with coordinates (1/3 2/3 1/4). The cell parameters obtained from a multi-pattern refinement of both diffractograms are: ; with RBragg = 15.1 and 11.2, for = 1.28 Å and 2.52 Å, respectively.
III.2 = 8 GPa
Insert of Fig. 3 shows the diffraction pattern collected with Å at GPa and K. The first remarkable fact is the presence of a new high-intensity peak observed at Å that was not present in the diffractograms taken at RT. The low part of the Fig. 3 shows a zoom of the small -spacing region for the diffractograms collected at K (middle part) and RT (bottom part) with the sample inside the PE cell in the cryostat. With this complex sample environment, once the sample is inside the gasket in the PE cell, the intensity is greatly suppressed, and a huge increase of the background is observed, even with the ROC in front of the detector. This is expected since for high pressure experiments, the quantity of sample irradiated by the neutron beam is much smaller.
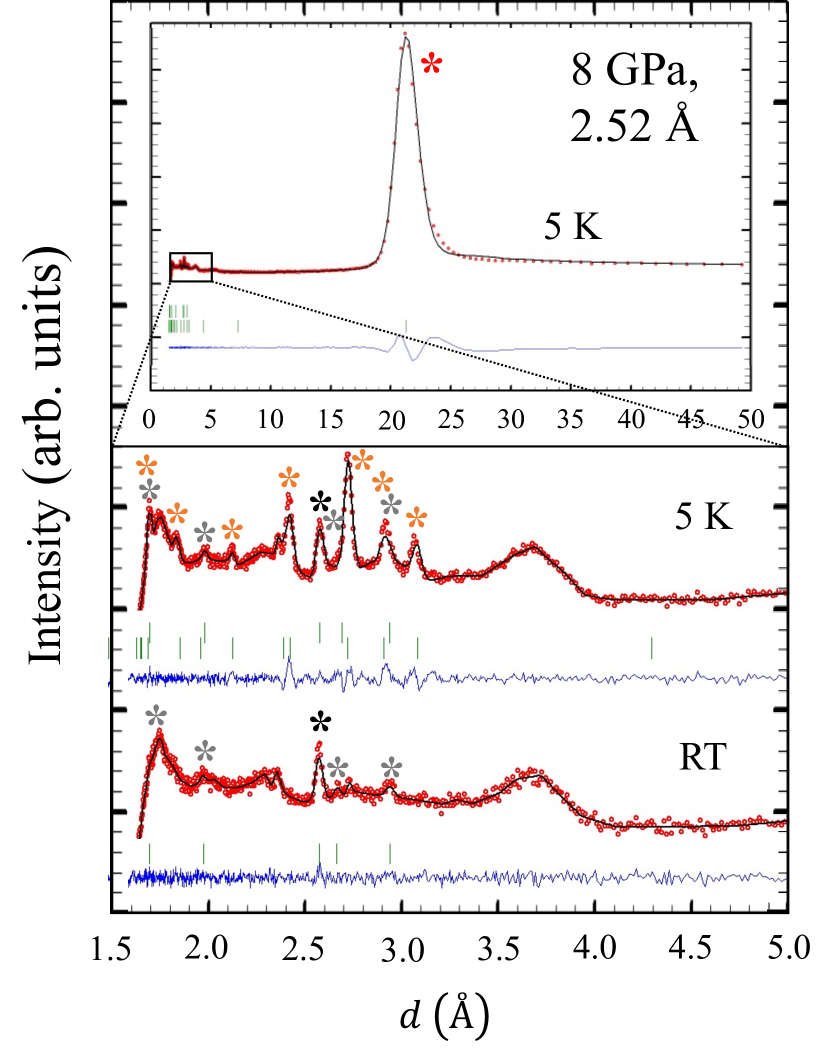
The diffractogram observed at RT inside the PE cell, after warming from 5K, is indexed by the same hcp structure () with shorter cell parameters ( Å, Å, and RBragg = 6.07) that the one observed at AP. Therefore, no structural transition to the Sm-type phase has been observed as the pressure was increased from AP to 8 GPa.
However, at 8 GPa and 5 K, several new magnetic satellites appear, marked with red and orange asterisks in Fig. 3, including the one clearly observed at Å. These satellites are indexed with an incommensurate propagation vector with , in units of , in agreement with Ref. Perreault et al. (2020). The plus or minus sign in the propagation vector indicates a clock-wise or anti clock-wise propagation. The nuclear peaks, marked with black and grey asterisks in Fig. 3, remain unchanged respect to the ones at RT, suggesting that no FM order is present, even at the lowest temperature. The analysis of this new magnetic state will be elucidated in the next subsection.
III.2.1 Symmetry analysis
We use the symmetry analysis to reduce the number of possible magnetic ground states in Ho-hcp compatible with the observed propagation vector . We can decompose the magnetic representation for the Ho atom, located at WP , as a direct sum of Irreducible Representations (irreps) of the parent group for the point, , of the Brillouin zone (BZ) 111We adopted the international notation for the irreps labels and MSSG established in Stokes, Hatch, and Campbell (2017); Campbell et al. (2006); Aroyo et al. (2011), as follows:
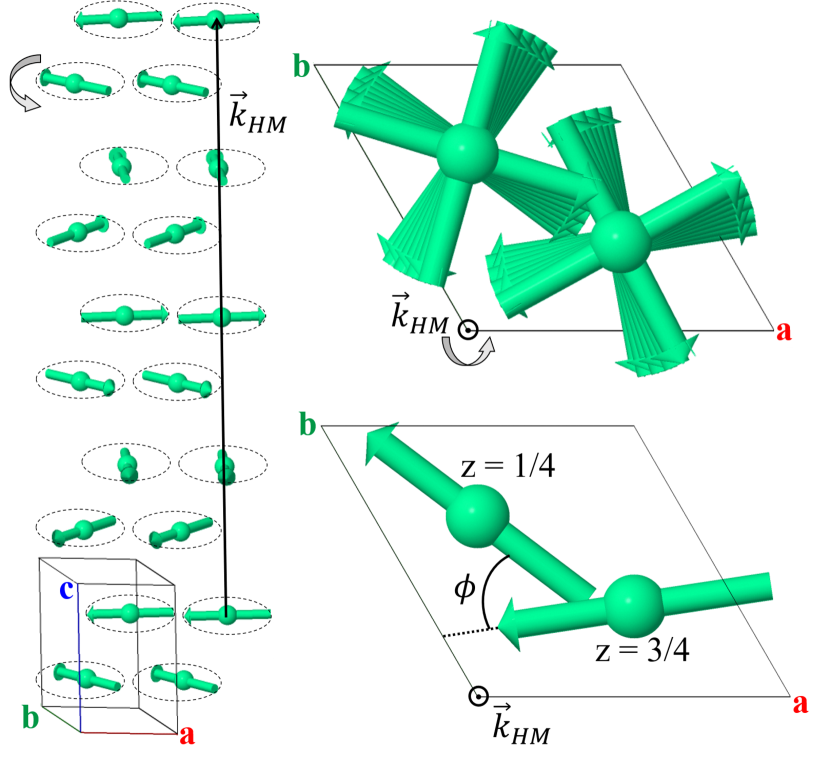
The basis vectors of each irrep are given in Table 1. The magnetic structure described by both, the 1d-irreps m and m consists of a sinusoidal modulation along the -axis. Meanwhile, the 2d-irreps, m and m, describe helices in which the magnetic moments are contained in ferromagnetic planes, and propagate along the -axis. However, both models differ greatly when considering the phase-shift between the Ho atoms in the unit cell. While in the case of m the phase-shift is the same as the pitch angle of the helix: , in m the phase-shift is given by: . Therefore, the magnetic structure given by m can be considered as a single helix, while for m the system is composed of two independent helices, one for each atom in the unit cell. The magnetic structure at 5 K, labelled with m, and the angle are depicted in Fig. 4.
| irrep | BV | Ho 1 (1/3 2/3 1/4) | Ho 2 (2/3 1/3 3/4) |
|---|---|---|---|
| m | |||
| m | |||
| m | |||
| m | |||
After a systematic trial and error procedure, it was observed that m, m and m do not fit the data, since they assign zero intensity for the main magnetic peak indexed as at Å. However, the magnetic satellite reflections (red and orange asterisks in Fig. 3) can be correctly fitted by the 2d-irrep m.
The combination between the parent group and the magnetic modulations for Ho atoms given by the irrep m give as a result the MSSG. Within the MSSG formalism, the magnetic structure is described by a basic structure, related to the nuclear paramagnetic cell, in addition to a series of magnetic modulation functions that describe the variation from the basic structure of the magnetic moments. In our case, with just one propagation vector and no net magnetic moment (i.e. no existence of a propagation vector ), the magnetic structure is described by:
where the internal coordinate is given by the product of the propagation vector and the position of the atom in the -th unit cell ().
The explicit amplitudes of the cosine () and sine () components of the magnetic moment for the MSSG are given in Table 2. In this MSSG, the Ho atom remains in the WP position and the symmetry constraints imposed allow only for 1 free parameter to describe the magnetic structure, which is the modulus of the magnetic moment ().
| Phase | PM | HM |
|---|---|---|
| T (K) | 300 | 5 |
| MSSG | ||
| # | 194.264 | 182.1.24.2.m180.2 |
| 0.2536(1) | ||
| 45.65(2) | ||
| irrep | m | |
| (Å) | 3.4030(7) | 3.3976(6) |
| (Å) | 5.345(2) | 5.390(1) |
| 1.5707(7) | 1.5864(4) | |
| () | 6.94(1) | |
| RBragg | 6.07 | 6.64 |
| RBragg(Mag.) | 1.59 |
III.2.2 Temperature dependence
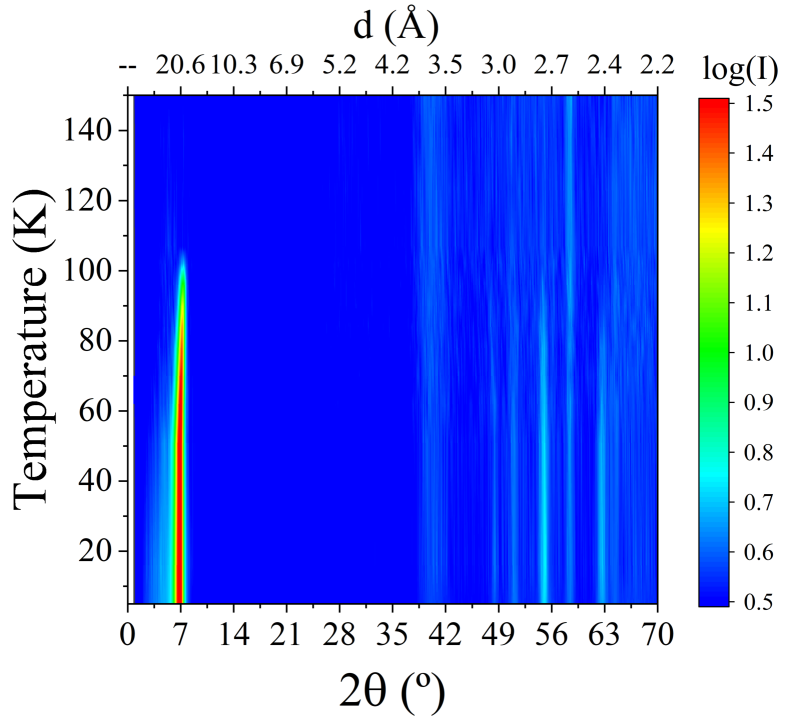
Figure 5 shows a 2D plot of the thermo-diffractograms obtained at 8 GPa as the system was heated from 5 K to RT. From them, the onset of the helical magnetic ordering is estimated to occur around = 105(2) K, with the appearance of a peak at (), which is in agreement with previous studies Mito et al. (2021); Jackson et al. (2005); Mito et al. (2009); Perreault et al. (2020).
The temperature dependence of the intensity for the (1 0 1) nuclear reflection (in black) and the satellite (in red) is shown in Fig. 6(b). The evolution of these two lines allows to quantitatively distinguish between the magnetic phases that can be present, as the nuclear and satellite peaks chosen should be the most sensible if a FM () or HM order (), respectively, should be present. No change is observed neither in the (1 0 1) nuclear reflection, nor other nuclear lines, as the temperature decreases. This fact supports the hypothesis of absence of any FM ordering, or if present, put an upper limit of 0.2 to such contribution.
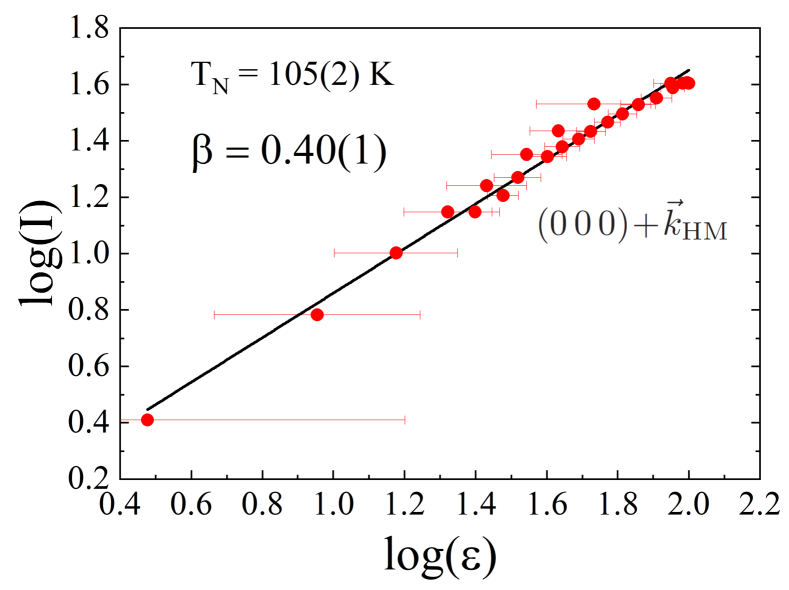
Regarding the evolution with temperature of the satellite , its intensity was fitted to the power law , where is the reduced temperature (see Fig. 7). The obtained value for the critical exponent is , which is in good agreement with the value predicted by Bak and Mukamel Bak and Mukamel (1976), and reported by previous studies for pure helimagnetic phases at AP and 130 K conditions Eckert and Shirane (1976); Thurston et al. (1993, 1994); Plakhty et al. (2001). It constitutes another indication of the absence of any FM component.
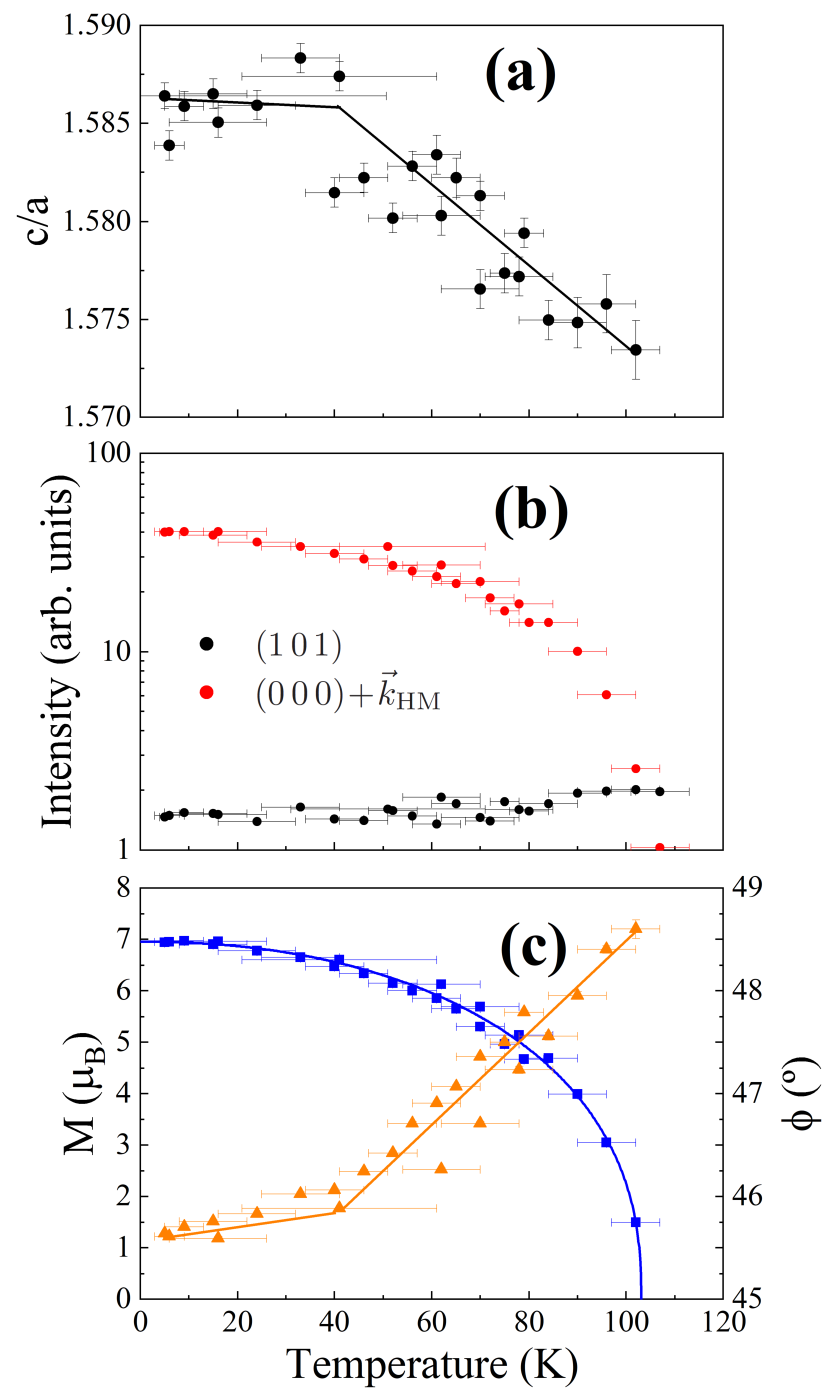
Using the magnetic model labelled by the MSSG to fit the diffraction patterns collected at each temperature, the dependence of the pitch angle, , and modulus, , of the Ho magnetic moment versus temperature was obtained (see Fig. 6(c)).
As the temperature decreases below K, the magnetic moment increases until it saturates at 6.94(1), a value in good agreement with the saturation magnetization obtained at AP and K Mito et al. (2009). Meanwhile, the angle decreases following two linear dependences from 48.6(1)∘ at 105 K to 45.65(2)∘ at 5K, with a change of slope around K. This evolution is also coherent with previous neutron diffraction experiments Perreault et al. (2020), and can be understood if we consider the strong dependence of the helix period with the axial ratio of the hexagonal phase Hughes et al. (2007). Such dependence can also explain the change observed around 40 K, since the ratio is stabilized below that temperature (see Fig. 6(a)).
IV Discussion
In our last study using SQUID magnetization measurements it was reported that the HM order survives up to GPa, while the disappearance of the FM order, or, at least, a remarkable suppression of ferromagnetic net magnetic moments, was observed above 8 GPa Mito et al. (2021). As the intensity of the FM anomaly could not be detected just above the critical pressure for the phase boundary between the hcp and Sm-type phases, it was suggested that the disappearance of the FM order is related to the structural phase transition.
However, the present neutron diffraction experiments, focused on the magnetic structure at GPa, confirm that the hcp structure remains stable until at least 8 GPa. Additionally, an incommensurate HM order is observed below K, which persists down to the lowest temperature measured ( K), while no evidence of FM ordering was observed within the entire temperature range. Therefore, the present results help to clarify that the FM order becomes unstable and disappear just before the structural phase transition. Furthermore, the magnetic structure observed at 8 GPa is consistent with previous magnetic measurements, taking into account the pressure distribution with the order of 0.5 GPa during the high-pressure experiment.
In the neutron diffraction study by Perreault et al., the FM order was reported to survive in both the Sm-type phase at 14.2 GPa and the dhcp phase at 20.2 GPa Perreault et al. (2020). This FM transition was marked by the appearance of a magnetic peak at Å accompanied by an increase in the intensity of all nuclear peaks. However, in those experiments only a small region of -spacing (1.0–3.5 Å) was covered, which made it difficult to elucidate the additional existence of HM order at those pressures, since the expected most intense magnetic signal should appear at larger -spacing (see Fig. 3). Therefore, it would be interesting to confirm these results by performing neutron experiments at such pressures in a long -spacing diffractometer.
V Conclusion
We conducted neutron diffraction experiments to investigate the magnetic structures of Ho at GPa. Our findings indicate that the nuclear symmetry remains unchanged, preserving the hexagonal close-packed () symmetry at GPa. The helimagnetic order persists down to 5 K, and the analysis of its magnetic structure, using the magnetic superspace group formalism, allows to determine the critical exponent , in agreement with previous theoretical model for pure helices. Meanwhile no FM contribution is observed at any temperature. These results are consistent with previously published findings from magnetization experiments.
Acknowledgements.
This work was supported by Grants-in-Aid for Scientific Research, Grant No. 19KK0070, from the Ministry of Education, Culture, Sports, Science and Technology (MEXT), Japan. The authors acknowledge support by Grants No. PID2022-138492NB-I00-XM4 funded by MCIN/AEI/10.13039.501100011033, OTR02223-SpINS from CSIC/MCIN and DGA/M4 from Diputación General de Aragón (Spain). MPS acknowledges a predoctoral research fellowship from Diputación General de Aragón (Spain). Authors acknowledge the SANE service of ILL and in particular to C. Payre for his valuable support during the experiments.References
- Chikazumi (1997) S. Chikazumi, Physics of Ferromagnets (Oxford Univ. Press., New York, 1997).
- Stoner (1939) E. C. Stoner, “Collective electron ferromagnetism II. Energy and specific heat,” Proc. Roy. Soc. (London) A 169, 339 (1939).
- Ruderman and Kittel (1954) M. Ruderman and C. Kittel, “Indirect exchange coupling of nuclear magnetic moments by conduction electrons,” Phys. Rev. 96, 99 (1954).
- Kasuya (1956) T. Kasuya, “A theory of metallic ferro-and antiferromagnetism on Zener’s model,” Prog. Theor. Phys. 16, 45–57 (1956).
- Yosida (1957) K. Yosida, “Magnetic properties of Cu-Mn alloys,” Phys. Rev. 106, 893 (1957).
- Akella, Smith, and Jephcoat (1988) J. Akella, G. S. Smith, and A. P. Jephcoat, “High-pressure phase transformation studies in gadolinium to 106 GPa,” J. Phys. Chem. Solids 49, 573–576 (1988).
- Grosshans and Holzapfel (1992) W. Grosshans and W. Holzapfel, “Atomic volumes of rare-earth metals under pressures to 40 GPa and above,” Phys. Rev. B 45, 5171 (1992).
- Hughes et al. (2007) I. D. Hughes, M. Däne, A. Ernst, W. Hergert, M. Lüders, J. Poulter, J. B. Staunton, A. Svane, Z. Szotek, and W. M. Temmerman, “Lanthanide contraction and magnetism in the heavy rare earth elements,” Nature 446, 650–653 (2007).
- McWhan and Stevens (1965) D. McWhan and A. Stevens, “Effect of pressure on the magnetic properties and crystal structure of Gd, Tb, Dy, and Ho,” Phys. Rev. 139, A682 (1965).
- Iwamoto et al. (2003) T. Iwamoto, M. Mito, M. Hitaka, T. Kawae, and K. Takeda, “Magnetic measurement of rare earth ferromagnet gadolinium under high pressure,” Physica B 329 (2003).
- Jackson et al. (2005) D. D. Jackson, V. Malba, S. T. Weir, P. A. Baker, and Y. K. Vohra, “High-pressure magnetic susceptibility experiments on the heavy lanthanides Gd, Tb, Dy, Ho, Er, and Tm,” Phys. Rev. B 71, 184416 (2005).
- Mito et al. (2009) M. Mito, K. Matsumoto, Y. Komorida, H. Deguchi, S. Takagi, T. Tajiri, T. Iwamoto, T. Kawae, M. Tokita, and K. Takeda, “Volume shrinkage dependence of ferromagnetic moment in the lanthanide ferromagnets gadolinium, terbium, dysprosium, and holmium,” J. Phys. Chem. Solids 70, 1290–1296 (2009).
- Mito et al. (2021) M. Mito, Y. Kimura, K. Yamakata, M. Ohkuma, H. Chayamichi, T. Tajiri, H. Deguchi, and M. Ishizuka, “Relationship of magnetic ordering and crystal structure in lanthanide ferromagnets Gd, Tb, Dy, and Ho at high pressures,” Phys. Rev. B 103, 24444 (2021).
- Thomas et al. (2012) S. A. Thomas, W. O. Uhoya, G. M. Tsoi, L. E. Wenger, Y. K. Vohra, G. N. Chesnut, S. T. Weir, C. A. Tulk, and A. M. dos Santos, “Neutron diffraction and electrical transport studies on the incommensurate magnetic phase transition in holmium at high pressures,” Journal of Physics: Condensed Matter 24, 216003 (2012).
- Samudrala et al. (2014a) G. K. Samudrala, G. M. Tsoi, S. T. Weir, and Y. K. Vohra, “Structural and magnetic phase transitions in gadolinium under high pressures and low temperatures,” High Pressure Res. 34, 385–391 (2014a).
- Thomas et al. (2013) S. A. Thomas, J. M. Montgommery, G. M. Tsoi, Y. K. Vohra, G. N. Chesnut, S. T. Weir, C. A. Tulk, and A. M. dos Santos, “Neutron diffraction and electrical transport studies on magnetic ordering in terbium at high pressures and low temperatures,” High Pressure Res. 33, 555–562 (2013).
- Samudrala et al. (2014b) G. K. Samudrala, G. M. Tsoi, S. T. Weir, and Y. K. Vohra, “Magnetic ordering temperatures in rare earth metal dysprosium under ultrahigh pressures,” High Pressure Res. 34, 266–272 (2014b).
- Lim et al. (2015a) J. Lim, G. Fabbris, D. Haskel, and J. S. Schilling, “Magnetic ordering at anomalously high temperatures in Dy at extreme pressures,” Phys. Rev. B 91, 045116 (2015a).
- Lim et al. (2015b) J. Lim, G. Fabbris, D. Haskel, and J. S. Schilling, “Anomalous pressure dependence of magnetic ordering temperature in Tb revealed by resistivity measurements to 141 GPa: Comparison with Gd and Dy,” Phys. Rev. B 91, 174428 (2015b).
- Lim et al. (2017) J. Lim, G. Fabbris, D. Haskel, and J. S. Schilling, “Record high magnetic ordering temperature in a lanthanide at extreme pressure,” J. Phys: Conference Series 950, 042025 (2017).
- Umebayashi et al. (1968) H. Umebayashi, G. Shirane, B. Frazer, and W. Daniels, “Neutron diffraction study of Tb and Ho under high pressure,” Phys. Rev. 165, 688–692 (1968).
- Kawano et al. (1992) S. Kawano, N. Achiwah, A. Onodera, and Y. Nakaid, “Neutron diffraction studies of pressure effects on magnetic structures of Tb,” Physica B 180 (1992).
- Perreault et al. (2019) C. Perreault, Y. Vohra, A. dos Santos, J. Molaison, and R. Boehler, “Magnetic ordering in rare earth metal dysprosium revealed by neutron diffraction studies in a large-volume diamond anvil cell,” High Pressure Res. 38, 588–597 (2019).
- Perreault et al. (2022) C. S. Perreault, Y. K. Vohra, A. M. dos Santos, and J. J. Molaison, “Magnetic structure of antiferromagnetic high-pressure phases of dysprosium,” J. Magn. Magn. Mater. 545, 168749 (2022).
- Perreault et al. (2020) C. Perreault, Y. Vohra, A. dos Santos, and J. Molaison, “Neutron diffraction study of magnetic ordering in high pressure phases of rare earth metal holmium,” J. Magn. Magn. Mater. 507, 166843 (2020).
- Cunningham, Qiu, and Vohra (2006) N. C. Cunningham, W. Qiu, and Y. K. Vohra, “Observation of complete regular trivalent rare earth sequence in heavy lanthanide metal holmium under high pressure,” High Pressure Research 26, 43–50 (2006).
- Bi et al. (2017) W. Bi, E. Alp, J. Song, Y. Deng, J. Zhao, M. Hu, D. Haskel, and J. M. Schilling, MAR17 Meeting of APS (http://meetings.aps.org/link/BAPS.2017.MAR.B35.15, 2017).
- Koehler et al. (1966) W. C. Koehler, J. W. Cable, M. K. Wilkinson, and E. O. Wollan, “Magnetic structures of Holmium. I. The virgin state,” Physical Review 151, 414–424 (1966).
- Pechan and Stassis (1984) M. J. Pechan and C. Stassis, “Magnetic structure of holmium,” Journal of Applied Physics 55, 1900–1902 (1984).
- Simpson et al. (1995) J. A. Simpson, D. F. McMorrow, R. A. Cowley, and D. A. Jehan, “Trigonal interactions in holmium,” Phys. Rev. B 51, 16073–16082 (1995).
- Achiwa et al. (1988) N. Achiwa, S. Kawano, A. Onodera, and Y. Nakai, “Effects of pressure on the helical turn angle of holmium,” Le Journal de Physique Colloques 49, C8–349–C8–350 (1988).
- Samudrala and Vohra (2013) G. K. Samudrala and Y. K. Vohra, “Structural Properties of Lanthanides at Ultra High Pressure,” in Handbook on the Physics and Chemistry of Rare Earths, Vol. 43 (Elsevier, 2013) pp. 275–319.
- Janner and Janssen (1980) A. Janner and T. Janssen, “Symmetry of incommensurate crystal phases. I. Commensurate basic structures,” Acta Crystallographica Section A 36, 399–408 (1980).
- Perez-Mato et al. (2012) J. M. Perez-Mato, J. L. Ribeiro, V. Petricek, and M. I. Aroyo, “Magnetic superspace groups and symmetry constraints in incommensurate magnetic phases,” Journal of Physics: Condensed Matter 24, 163201 (2012).
- Rodríguez-Carvajal and Villain (2019) J. Rodríguez-Carvajal and J. Villain, “Magnetic structures,” Comptes Rendus Physique 20, 770–802 (2019).
- Besson et al. (1992) J. Besson, R. Nelmes, G. Hamel, J. Loveday, G. Weill, and S. Hull, “Neutron powder diffraction above 10 GPa,” Physica B 180 (1992).
- Klotz et al. (2005) S. Klotz, T. Strässle, G. Rousse, G. Hamel, and V. Pomjakushin, “Angle-dispersive neutron diffraction under high pressure to 10 GPa,” Applied Physics Letters 86, 031917 (2005).
- Klotz et al. (2020) S. Klotz, T. Hansen, E. Lelièvre-Berna, L. Amand, J. Maurice, and C. Payre, “Advances in the use of Paris-Edinburgh presses for high pressure neutron scattering,” Journal of Neutron Research 21, 117–124 (2020).
- Otto, Vassiliou, and Frommeyer (1998) J. W. Otto, J. K. Vassiliou, and G. Frommeyer, “Nonhydrostatic compression of elastically anisotropic polycrystals. I. Hydrostatic limits of 4:1 methanol-ethanol and paraffin oil,” Physical Review B 57, 3253–3263 (1998).
- Rodríguez-Carvajal (1993) J. Rodríguez-Carvajal, “Recent advances in magnetic structure determination by neutron powder diffraction,” Physica B: Condensed Matter 192, 55 – 69 (1993).
- Stokes, Hatch, and Campbell (2017) H. T. Stokes, D. M. Hatch, and B. J. Campbell, “ISODISTORT, ISOTROPY software suite,” iso.byu.edu (2017).
- Campbell et al. (2006) B. J. Campbell, H. T. Stokes, D. E. Tanner, and D. M. Hatch, “ISODISPLACE: a web-based tool for exploring structural distortions,” Journal of Applied Crystallography 39, 607–614 (2006).
- Aroyo et al. (2011) M. I. Aroyo, J. M. Perez-Mato, D. Orobengoa, E. Tasci, G. de la Flor, and A. Kirov, “Crystallography online: Bilbao Crystallographic Server,” Bulgarian Chemical Communications 43, 183–197 (2011).
- Aroyo et al. (2006a) M. I. Aroyo, J. M. Perez-Mato, C. Capillas, E. Kroumova, S. Ivantchev, G. Madariaga, A. Kirov, and H. Wondratschek, “Bilbao Crystallographic Server: I. Databases and crystallographic computing programs,” Zeitschrift für Kristallographie - Crystalline Materials 221 (2006a), 10.1524/zkri.2006.221.1.15.
- Aroyo et al. (2006b) M. I. Aroyo, A. Kirov, C. Capillas, J. M. Perez-Mato, and H. Wondratschek, “Bilbao Crystallographic Server. II. Representations of crystallographic point groups and space groups,” Acta Crystallographica Section A Foundations of Crystallography 62, 115–128 (2006b).
- Perez-Mato et al. (2015) J. Perez-Mato, S. Gallego, E. Tasci, L. Elcoro, G. de la Flor, and M. Aroyo, “Symmetry-based computational tools for magnetic crystallography,” Annual Review of Materials Research 45, 217–248 (2015).
- Note (1) We adopted the international notation for the irreps labels and MSSG established in Stokes, Hatch, and Campbell (2017); Campbell et al. (2006); Aroyo et al. (2011).
- Bak and Mukamel (1976) P. Bak and D. Mukamel, “Physical realizations of n 4-component vector models. III. Phase transitions in Cr, Eu, MnS2, Ho, Dy, and Tb,” Physical Review B 13, 5086–5094 (1976).
- Eckert and Shirane (1976) J. Eckert and G. Shirane, “A neutron diffraction determination of the critical exponent for the n = 4 system holmium,” Solid State Communications 19, 911–912 (1976).
- Thurston et al. (1993) T. R. Thurston, G. Helgesen, D. Gibbs, J. P. Hill, B. D. Gaulin, and G. Shirane, “Observation of two length scales in the magnetic critical fluctuations of holmium,” Physical Review Letters 70, 3151–3154 (1993).
- Thurston et al. (1994) T. R. Thurston, G. Helgesen, J. P. Hill, D. Gibbs, B. D. Gaulin, and P. J. Simpson, “X-ray- and neutron-scattering measurements of two length scales in the magnetic critical fluctuations of holmium,” Physical Review B 49, 15730–15744 (1994).
- Plakhty et al. (2001) V. P. Plakhty, W. Schweika, T. Bruckel, J. Kulda, S. V. Gavrilov, L.-P. Regnault, and D. Visser, “Chiral criticality in helimagnet Ho studied by polarized neutron scattering,” Physical Review B 64 (2001).