Rotation-tunneling spectrum and astrochemical modeling of dimethylamine, CH3NHCH3, and searches for it in space
Abstract
Methylamine has been the only simple alkylamine detected in the interstellar medium for a long time. With the recent secure and tentative detections of vinylamine and ethylamine, respectively, dimethylamine has become a promising target for searches in space. Its rotational spectrum, however, has been known only up to 45 GHz until now. Here we investigate the rotation-tunneling spectrum of dimethylamine in selected regions between 76 and 1091 GHz using three different spectrometers in order to facilitate its detection in space. The quantum number range is extended to and , yielding an extensive set of accurate spectroscopic parameters. To search for dimethylamine, we refer to the spectral line survey ReMoCA carried out with the Atacama Large Millimeter/submillimeter Array toward the high-mass star-forming region Sagittarius B2(N) and a spectral line survey of the molecular cloud G+0.6930.027 employing the IRAM 30 m and Yebes 40 m radio telescopes. We report nondetections of dimethylamine toward the hot molecular cores Sgr B2(N1S) and Sgr B2(N2b) as well as G+0.6930.027 which imply that dimethylamine is at least 14, 4.5 and 39 times less abundant than methylamine toward these sources, respectively. The observational results are compared to computational results from a gas-grain astrochemical model. The modeled methylamine to dimethylamine ratios are compatible with the observational lower limits. However, the model produces too much ethylamine compared with methylamine which could mean that the already fairly low levels of dimethylamine in the models may also be too high.
keywords:
Molecular data – Methods: laboratory: molecular – Techniques: spectroscopic – Line: identification – ISM: abundances – Astrochemistry1 Introduction
Methylamine, CH3NH2, was among the earliest molecules to be discovered by radio-astronomical means; Kaifu et al. (1974) and Fourikis et al. (1974) reported detections toward Sagittarius (Sgr) B2 and Orion A, although the detection toward Orion A was dismissed a few years later (Johansson et al., 1984). Despite being a fairly small molecule, searches for methylamine toward other sources remained fruitless for quite some time. It was ultimately identified in the course of a spectral line survey of a foreground galaxy located in front of the quasar PKS 1830211 (Muller et al., 2011). Surprisingly, CH3NH2 emission was detected toward the peculiar molecule-rich circumstellar environment of the “red nova” CK Vul, thought to be the remnant of a stellar merger (Kamiński et al., 2017), and imaged with the Atacama Large Millimeter/submillimeter Array (ALMA)(Kamiński et al., 2020). Recently, CH3NH2 was detected in the molecular cloud G+0.6930.027 close to Sgr B2(N) (Zeng et al., 2018). Shortly thereafter, it was also found toward the high-mass star forming regions NGC6334I (Bøgelund et al., 2019) and G10.47+0.03 (Ohishi et al., 2019) and later toward several other high-mass protostars (Nazari et al., 2022).
Zeng et al. (2021) detected vinylamine, C2H3NH2, securely and ethylamine, C2H5NH2, tentatively in a spectral line survey of G+0.6930.027. Dimethylamine, CH3NHCH3, (DMA for short) is an isomer of ethylamine and related to methylamine, making it a viable candidate for searches in space. These relationships are similar to the relationships of dimethyl ether, CH3OCH3, with respect to ethanol, C2H5OH, and methanol, CH3OH, all three species being well known interstellar molecules.
Wollrab & Laurie (1968) investigated the rotation-tunneling spectra of several isotopologs of DMA in its ground vibrational state up to 45 GHz with and . They determined hyperfine structure (HFS) parameters, dipole moment components, and structural parameters. Since they did not resolve any splitting caused by the internal rotation of the two equivalent methyl rotors, they studied the spectra of several isotopologs in their two fundamental torsional states (Wollrab & Laurie, 1971).
Very recently, Koziol et al. (2021) analyzed the ground state rotation-tunneling spectrum of the DMA main isotopic species applying microwave Fourier transform spectroscopy. They were able to resolve internal rotation splitting of the order of 0.2 MHz and improved the HFS parameters. But because of the limitations in frequency ( GHz) and the low rotational temperatures, their quantum number range is limited to and .
Since the available data are insufficient to calculate accurate transition frequencies in the millimeter, let alone the submillimeter region, we carried out an extensive study of the ground state rotation-tunneling spectrum of the DMA main isotopolog in sections between 76 and 1091 GHz.
We use the results of this spectroscopic study to search for DMA in the interstellar medium, employing two spectral line surveys performed toward the Sgr B2 molecular cloud complex: a survey obtained with ALMA toward hot molecular cores of the Sgr B2(N) star forming region (e.g., Belloche et al., 2019) and a survey obtained with single-dish telescopes toward the Giant Molecular Cloud G+0.6930.027, also located in the Sgr B2 molecular cloud complex and that is experiencing a cloud-cloud collision (Zeng et al., 2018, 2020; Rivilla et al., 2021a, 2022b).
We also present here the results of astrochemical models under generic hot-core conditions, using a new chemical network that includes DMA. Methylamine was included in the early interstellar grain-surface chemistry network of Allen & Robinson (1977); the radicals CH3 and NH2 could directly recombine to form methylamine, while related atoms and radicals could also react to form the various hydrogenation states CHNH, which could then be further hydrogenated all the way to CH3NH2. Similar schemes have been used in later gas-grain chemical networks, including those intended specifically for hot cores (e.g. Garrod et al., 2008). Although some of the species accessible in the Allen & Robinson (1977) network (e.g. CH2NCH3) came close in structure to DMA, the latter molecule does not appear to be present in any existing astrochemical networks up to now. Here, we adapt the hot-core model and chemical network used by Garrod et al. (2022), which already includes methylamine chemistry, to trace the production of DMA through a small selection of grain-surface/bulk-ice reaction pathways. The network also includes the usual mechanisms for grain-surface and gas-phase destruction of DMA and other associated species.
2 Experimental details
The investigation of the rotation-tunneling spectrum of DMA was carried out with three different spectrometers. All absorption cells were made of Pyrex glass, had an inner diameter of 10 cm, and were kept at room temperature. The cells were filled to a certain nominal pressure from an aqueous solution of DMA; after a few hours to about a day, the sample was pumped off and the cell refilled because of the pressure rise caused by small leakages.
We used two 7 m coupled glass cells in a double path arrangement for measurements in the 76124 GHz region, yielding an optical path length of 28 m. We employed a 5 m double path cell for the 159375 GHz range. The cells of both spectrometers are equipped with Teflon windows. Additional information on these spectrometers is available in Ordu et al. (2012) and Martin-Drumel et al. (2015), respectively. The measurements between 793 and 1091 GHz were carried out in a 5 m long single path cell equipped with high-density polyethylene windows. Additional information on this spectrometer system is available in Xu et al. (2012). All spectrometers utilize Virginia Diode, Inc. (VDI), frequency multipliers driven by Rohde & Schwarz SMF 100A synthesizers as sources. Schottky diode detectors are used up to 375 GHz while a closed cycle liquid He-cooled InSb bolometer (QMC Instruments Ltd) is employed around 1 THz. Frequency modulation is applied to reduce baseline effects with demodulation at twice the modulation frequency. This causes absorption lines to appear approximately as second derivatives of a Gaussian.
We recorded mostly individual transitions in all frequency windows covering 5, 6, and 10 MHz around 100, 250, and 900 GHz, respectively at pressures of about 1, 2, and 35 Pa. Larger sections were also covered, in particular at higher frequencies. Uncertainties were evaluated mostly based on the symmetry of the line shape. The lines around 100 GHz were quite weak because of HFS, internal rotation splitting or intrinsically. Assigned uncertainties were between 5 and 30 kHz in this region. We applied uncertainties of 3 to 10 kHz for lines that were very symmetric or nearly so in the 159375 GHz range and 15 to 50 kHz for moderately to less symmetric lines, lines closer to other lines or fairly weak lines. Similar uncertainties were achieved earlier, for example, in the case of 2-cyanobutane, which has a much richer rotational spectrum (Müller et al., 2017). Uncertainties for very good lines were 510 kHz, and larger uncertainties up to 300 kHz were assigned for example to weaker lines and lines close to other lines in the 7931091 GHz region. Similar uncertainties at these frequencies were achieved for excited vibrational lines of CH3CN (Müller et al., 2021) or for isotopic oxirane (Müller et al., 2022, 2023).
3 Spectroscopic properties of dimethylamine
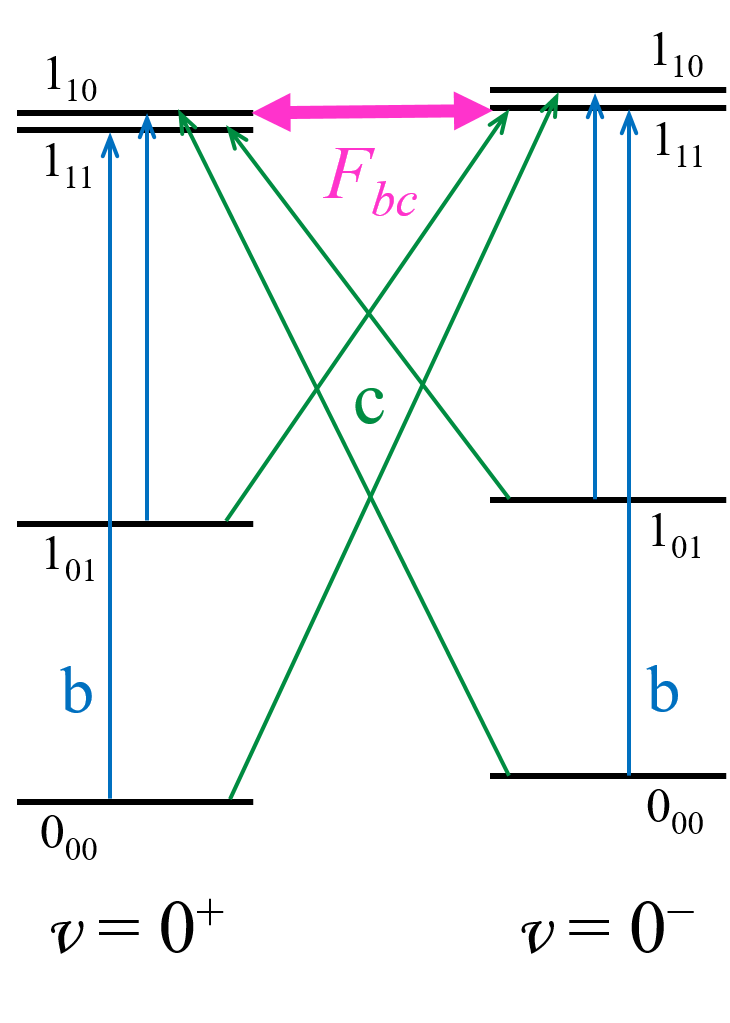
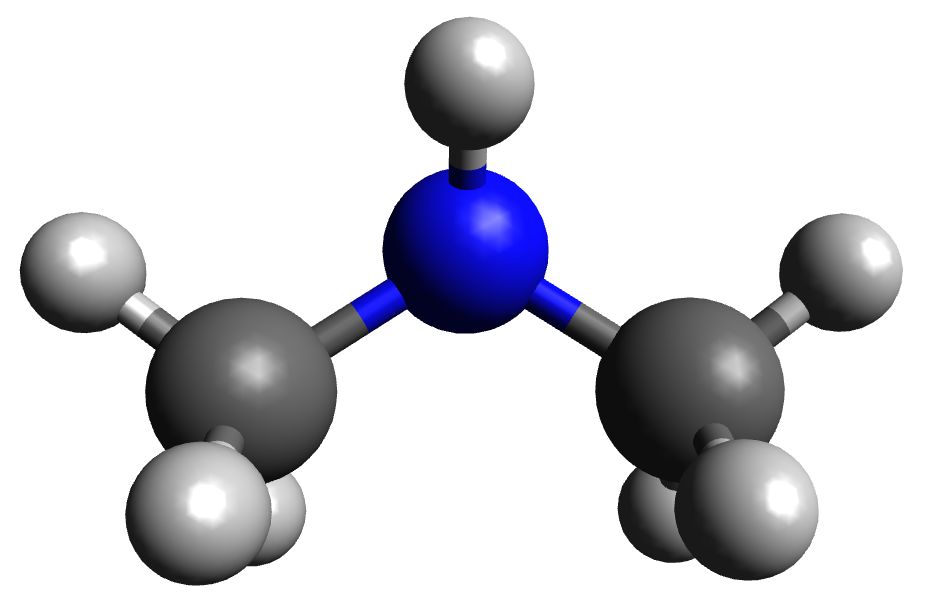
DMA is an asymmetric rotor with close to the prolate limit of 1. Fig. 1 shows that the molecule has symmetry in a static picture; the H atom attached to the N atom can be above or below the CNC plane. However, the barrier to exchange of these two positions is relatively low, such that the H atom is able to tunnel between these equivalent positions. Rotation lifts the degeneracy and causes a symmetric tunneling state frequently labeled with and an antisymmetric tunneling state then labeled with . The symmetry of the molecule in this dynamical picture is , as it is the symmetry of the transition state. The -axis in this configuration is along the NH bond; the pure rotational transitions, those within each tunneling state, obey -type selection rules. The -axis is parallel to the line through the C atoms, and the -axis is perpendicular to the CNC plane. The rotation-tunneling transitions, which connect the two tunneling states, obey -type selection rules as the tunneling of the H atom takes place parallel to the -axis. Wollrab & Laurie (1968) determined the dipole moment components as D and D. Fig. 2 demonstrates possible transitions among the lowest energy levels of DMA.
Coriolis-type interaction occurs between the two tunneling states for levels with equal which differ in and by an even and odd number, respectively. The interaction is strongest (resonant) when the levels are close in energy. The most common interactions in a prolate rotor are those with and . It is also shown in Fig. 2 that the first resonant interaction of this type occurs in DMA at for . The figure demonstrates the general pattern of this type of resonance: the upper asymmetry level of the lower tunneling state interacts with the lower asymmetry level of the upper tunneling state. Since the asymmetry splitting decreases rapidly with increasing for a given , this type of interaction is resonant at increasing for an increase in . The usually one with strongest interaction for a given is listed in Table 1 for . The parameter describes this interaction at lowest order.
The two equivalent methyl groups in DMA (Fig. 1) lead to ortho and para spin-statistics with intensity ratios of 9 : 7. The ortho and para levels are described by being odd and even, respectively in while it is opposite in , see Fig. 3.
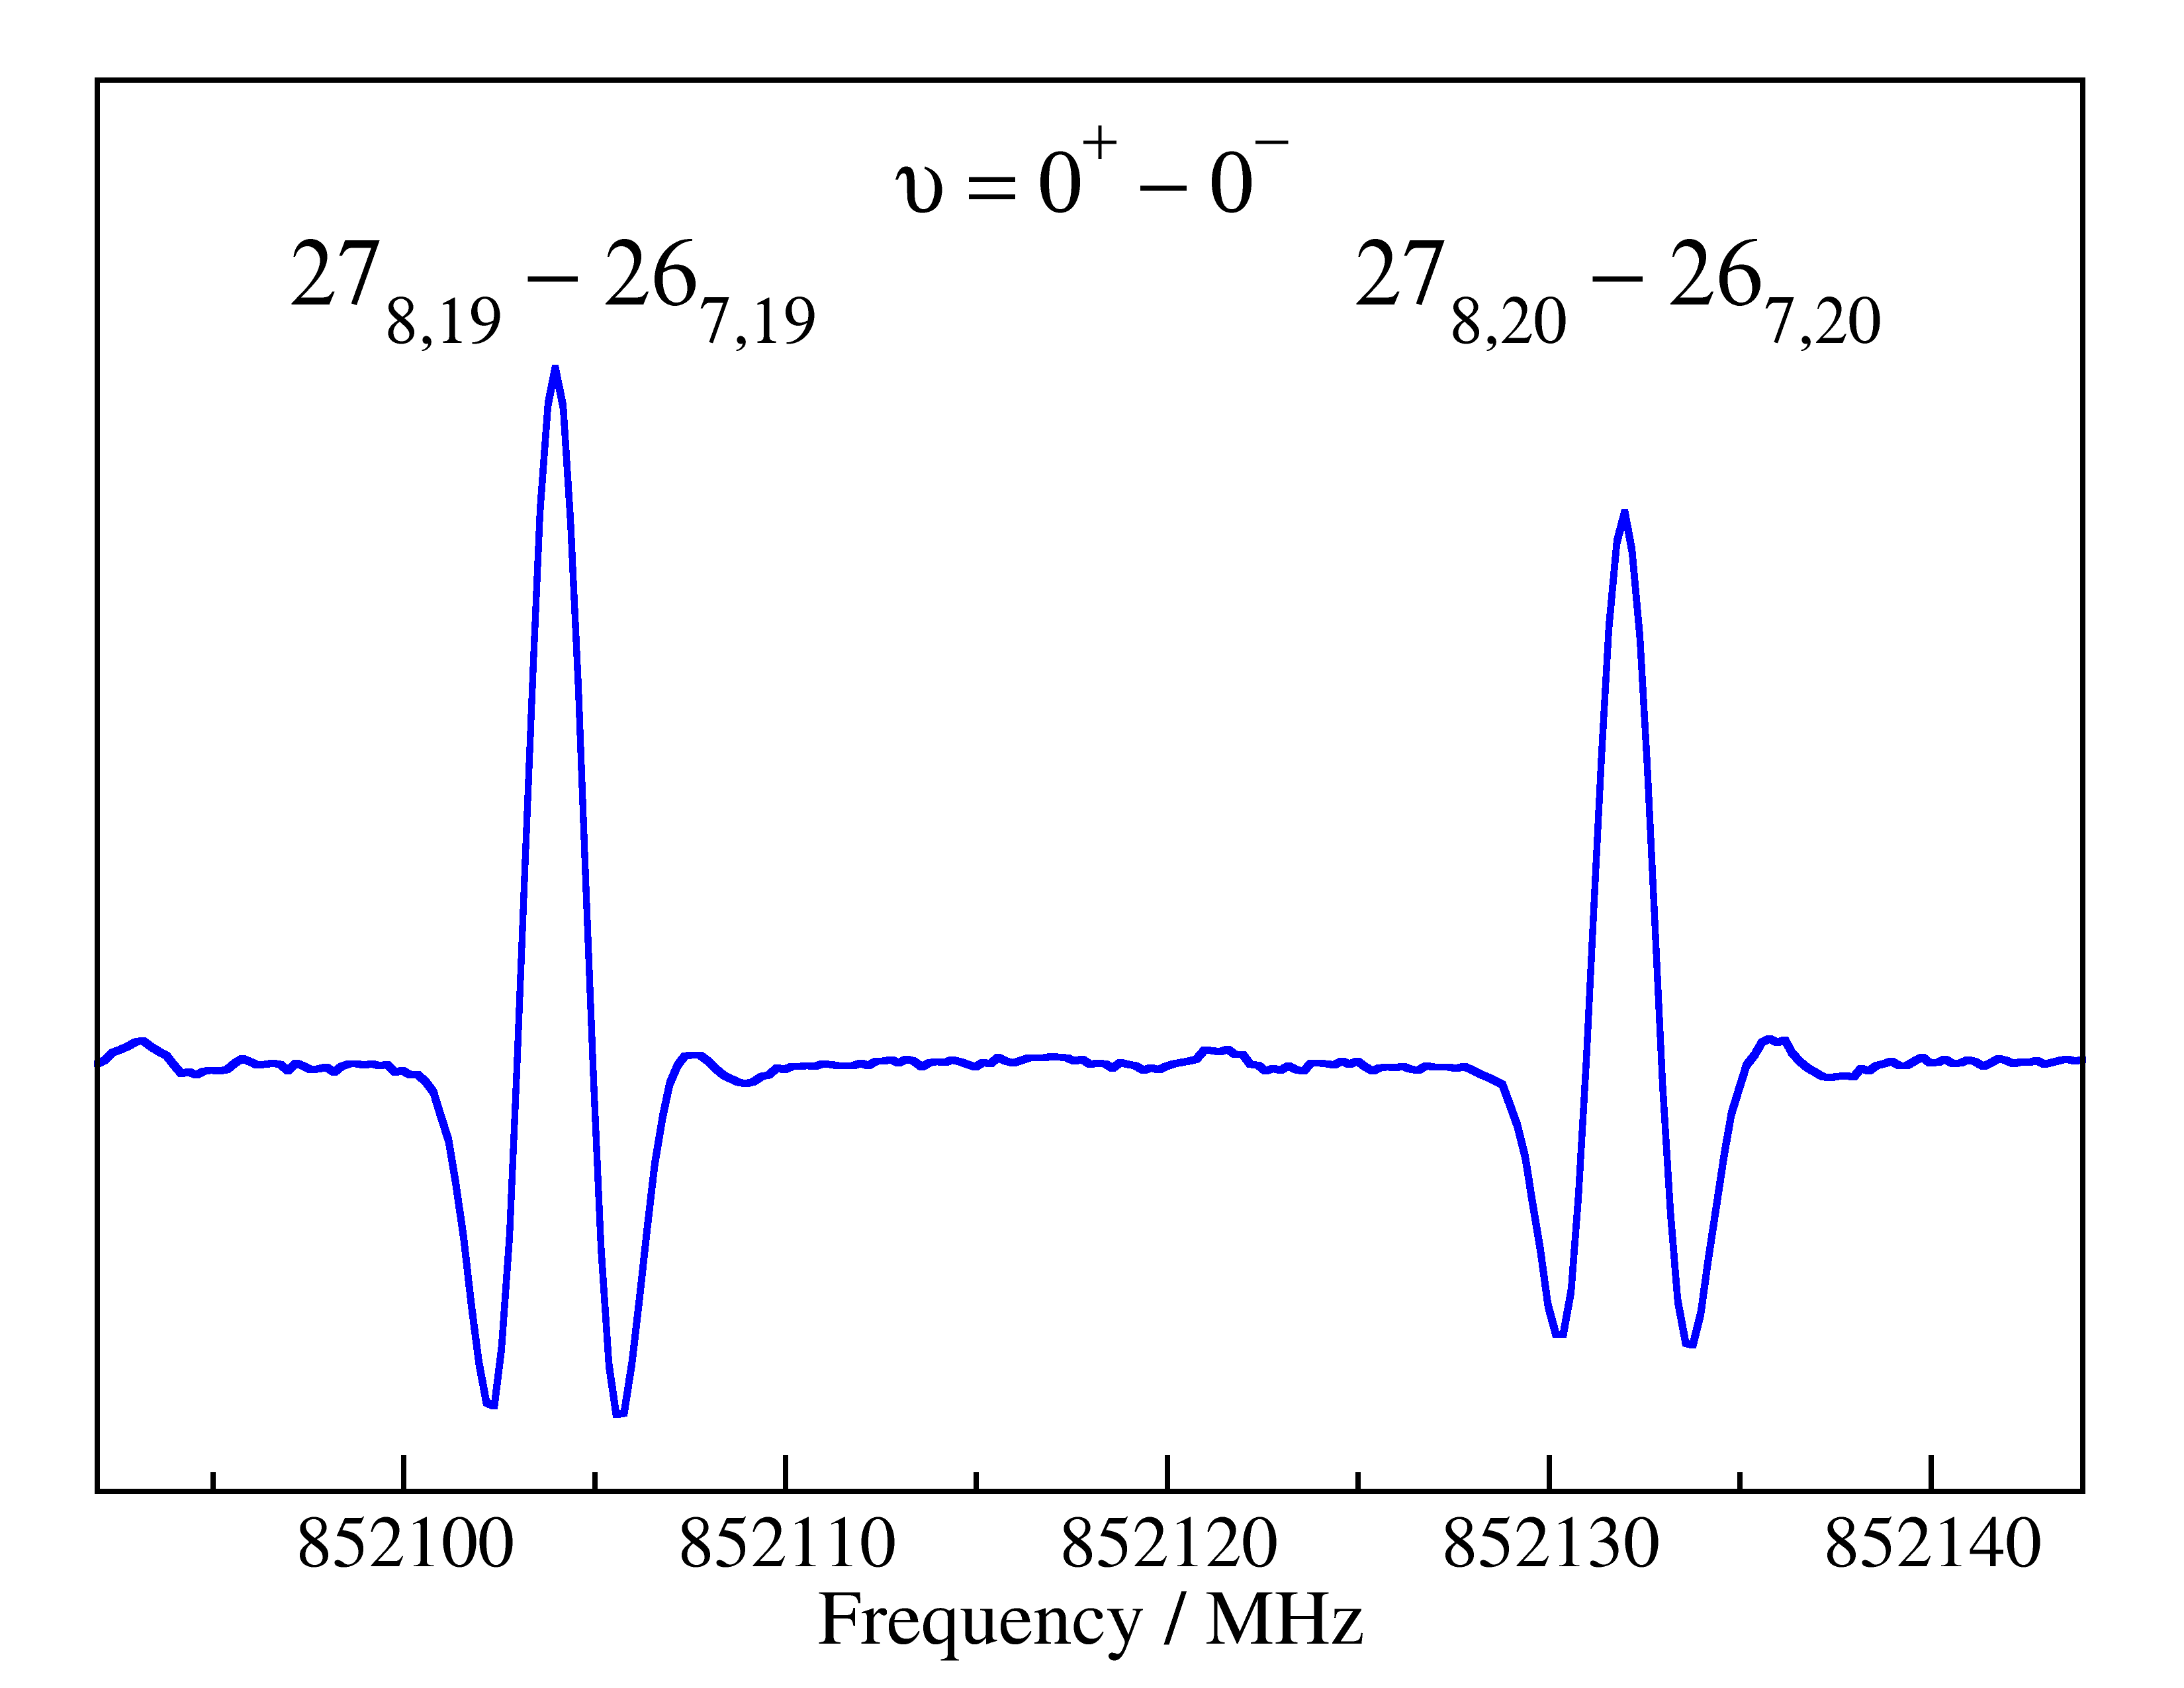
The two methyl groups in DMA carry out hindered internal rotations, but this rotation is so strongly hindered that it was not resolved in the initial microwave study of the ground vibrational state (Wollrab & Laurie, 1968). Fig. 4 shows weaker internal rotation components displaced by about 400 kHz to either side of the stronger central component.
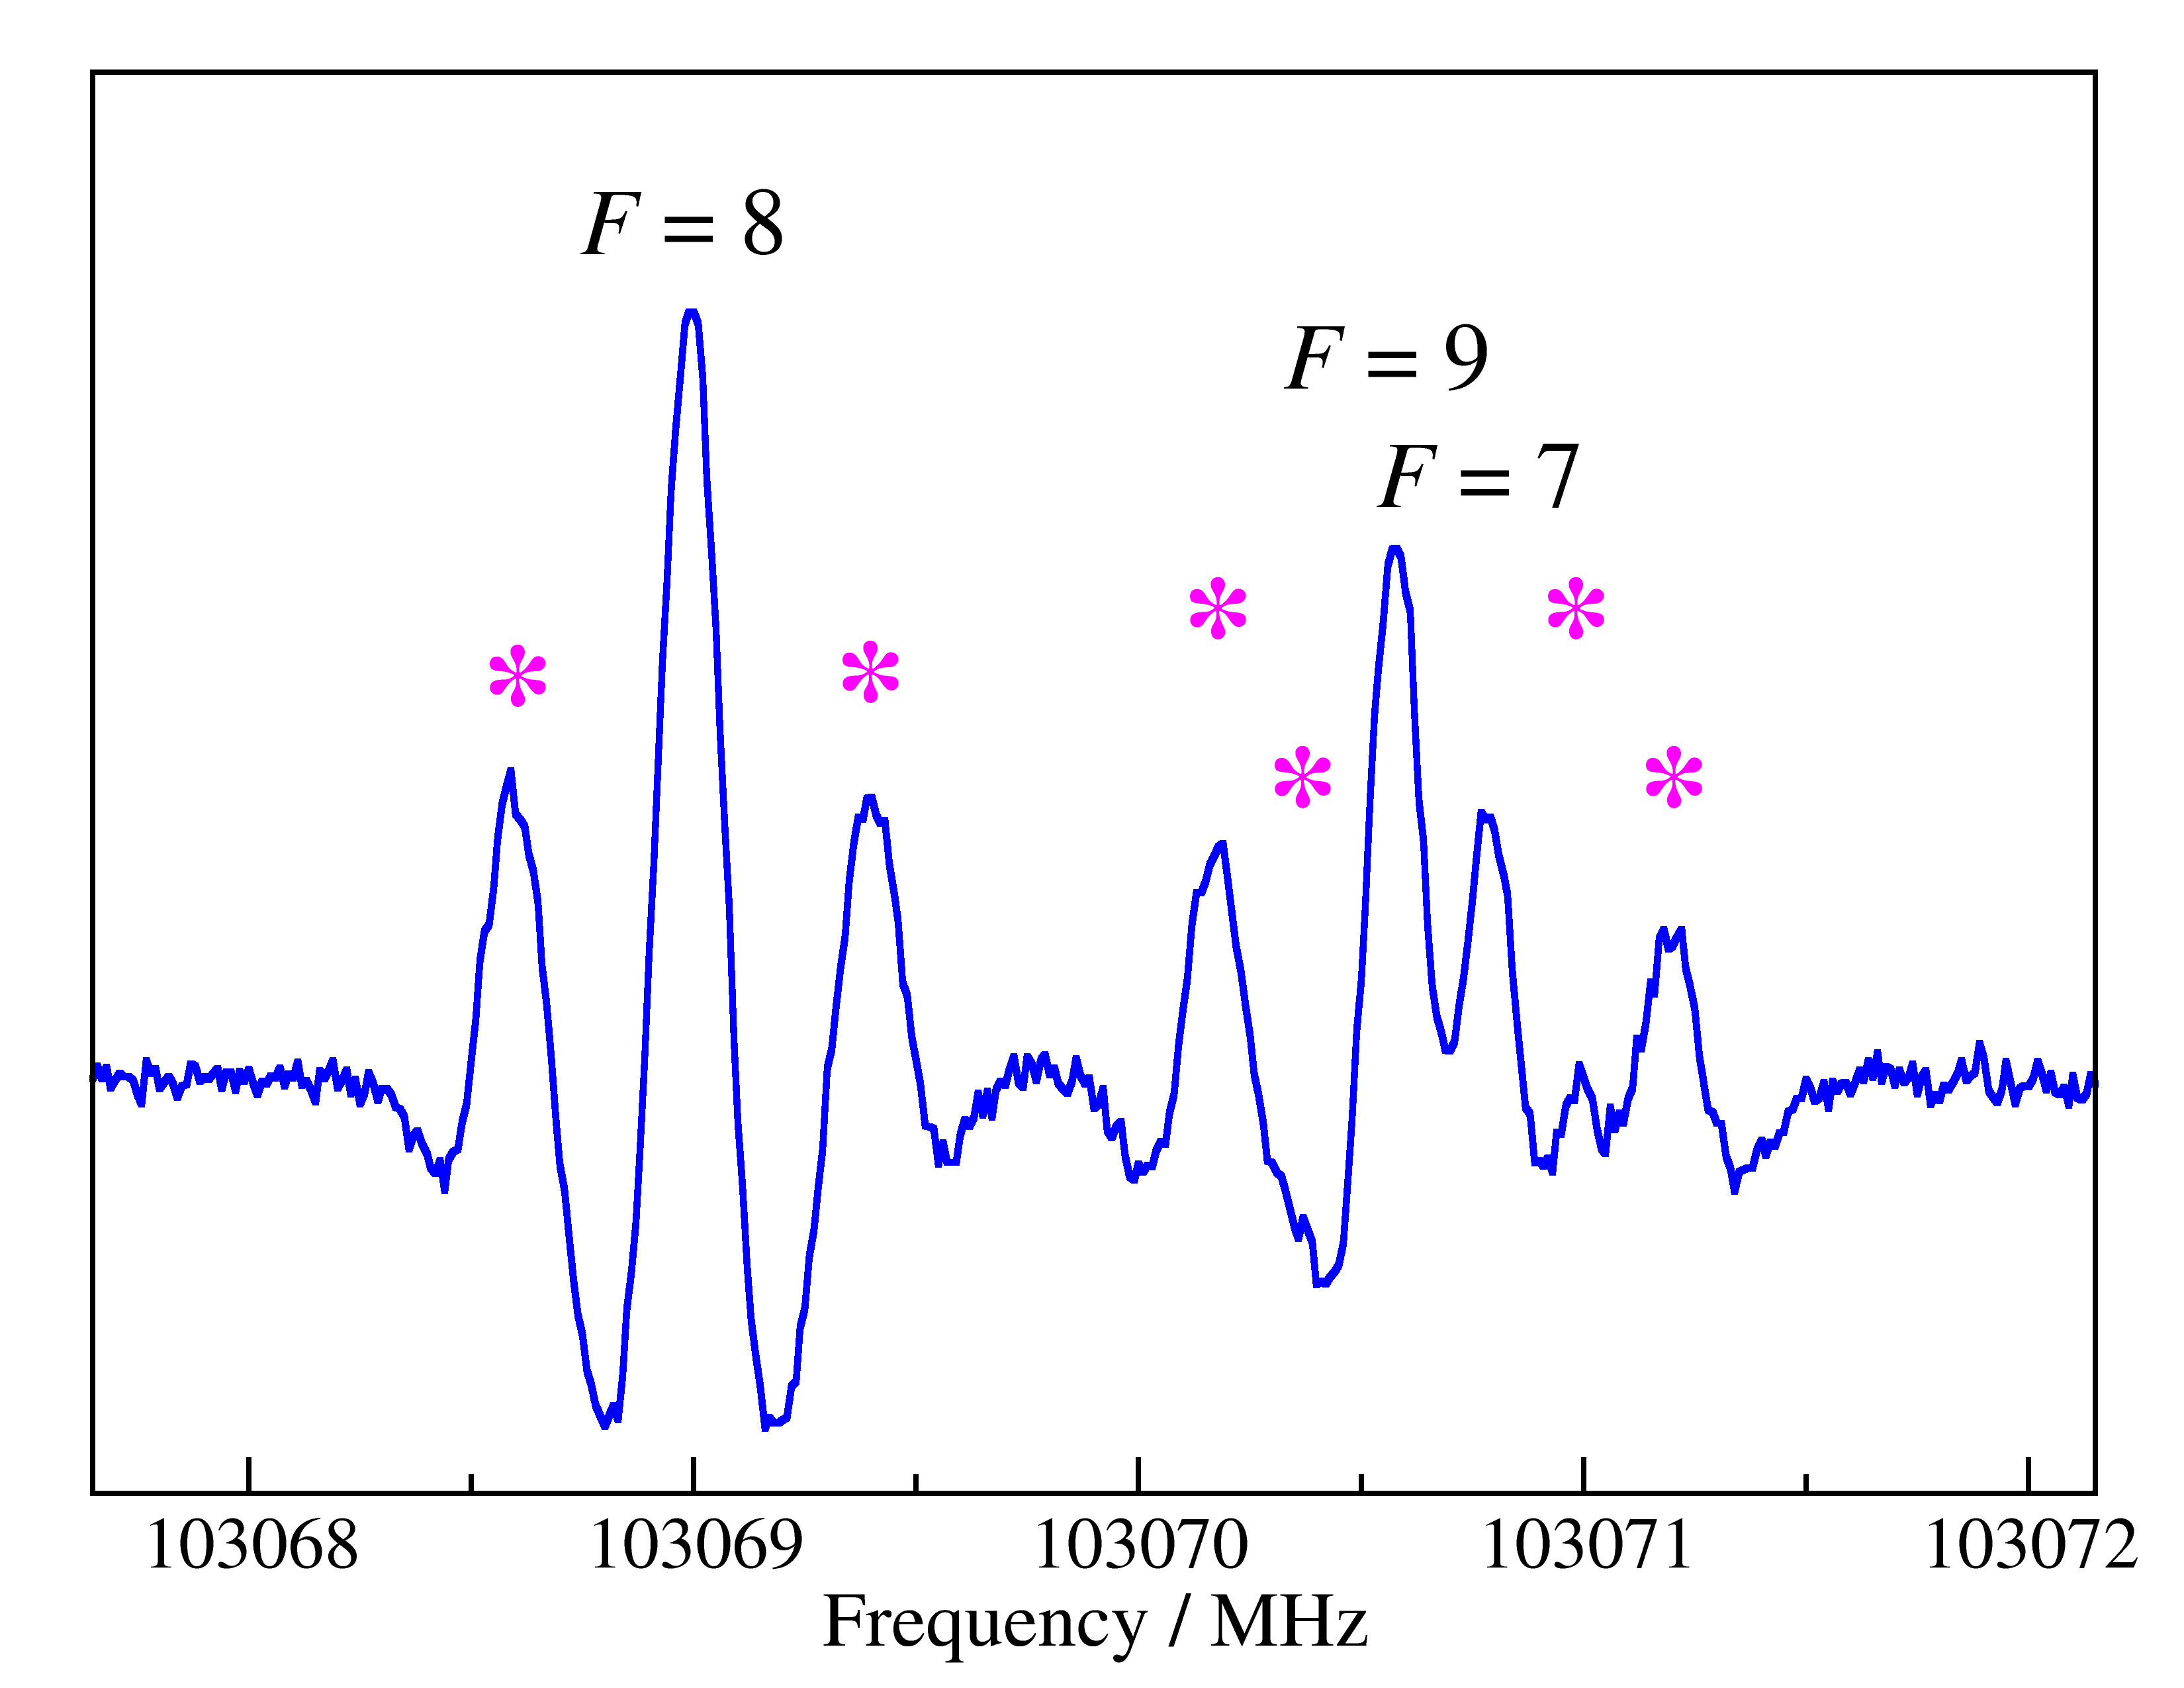
The presence of the 14N nucleus () leads to HFS splitting. Each rotational level with splits into three, and the strongest HFS components are those with , where represents the combination of the rotational and nuclear spin angular momenta. Transitions with are also allowed as long as is fulfilled. These transitions are usually too weak to be observed except for transitions with low rotational quantum numbers or measured with very high signal-to-noise ratios (S/N). An example of HFS splitting is shown in Fig. 4. As one can see, the components nearly coincide in frequency, and the frequency modulation causes a reduction of their intensities because the two components are not completely separated. In fact, the components are frequently completely blended, whereas the component may be separated from these. This causes an asymmetric intensity ratio of about 2 : 1 for partly resolved HFS patterns.
4 Spectroscopic results and determination of spectroscopic parameters
Fitting and calculation of the rotational spectrum of DMA was carried out with the SPFIT and SPCAT programs (Pickett, 1991). The two interacting tunneling states are commonly fit with a Hamiltonian that can be divided into a matrix with the diagonal elements consisting of the usual Watson-type rotational Hamiltonians for and on the diagonal; the one for includes in addition the energy difference. The interaction Hamiltonian is off-diagonal. The treatment of the Coriolis interaction between the and states requires additional consideration. Tanaka & Morino (1970), for example, discussed the need for two low order terms to treat the -type Coriolis interaction between and of ozone: . Additional rotational correction terms to either low order term may be needed if a large range of high quantum numbers is accessed, as in the example of ClClO2 (Müller et al., 2002). Lide (1962) derived that both types of terms are allowed to treat the rotation-tunneling interaction in cyanamide, H2NCN. Harris et al. (1966) showed in the analysis of the ring-puckering in trimethylene sulfide, -C3H6S, that at least under certain circumstances only one type of terms is required and proposed to use the odd order terms with being , , or , depending on the symmetry. Wollrab & Laurie (1968) followed this recommendation in their analysis of the rotation-tunneling spectrum of DMA. Pickett (1972) proposed to use the reduced axis system in which the interaction Hamiltonian consists of appropriate axis-rotation terms with , being , , or and . He showed that this method minimizes the effects of Coriolis coupling and may thus reduce the number of required interaction terms. The reduced axis system was the preferred method to treat tunneling-rotation and related spectra lately and was applied in all examples given below. The only non-zero interaction element in the case of DMA is supplemented with its distortion corrections: . Two separate rotational Hamiltonians are traditionally employed, which is appropriate if the parameters in the two Hamiltonians differ considerably. This approach was applied, e.g., in the case of gauche-propanal (Zingsheim et al., 2022).
Noting that the two tunneling states and together comprise the ground vibrational state , it can be advantageous to rearrange the Hamiltonians and fit average spectroscopic parameters ))/2 and differences )}/2, as was done by Christen & Müller (2003) in their treatment of the lowest energy conformer of ethylene glycol, also known as ethanediol. Christen & Müller (2003) also pointed out that the differences in spectroscopic parameters can be interpreted as rotational corrections to the energy difference, e.g., is defined as , as , as , and so forth. We follow this interpretation in our current work. We should point out that in our definition of the differences, is higher in energy by than . The advantage of this formulation is that an average parameter or its difference can be employed individually in the fit independent of each other. A rotation-tunneling spectrum with a small energy difference may require fewer parameter differences than average parameters. On the other hand, the rotation-tunneling spectrum of a symmetric top molecule, such as NH3, requires many differences in the fit to describe pure tunneling transitions. In addition, the purely axial average parameters (here , , etc.) are not determinable from regular () transitions. Examples applying such rearranged Hamiltonians include the treatments of ethanethiol (Müller et al., 2016), hydroxyacetonitrile (Margulès et al., 2017), the low-energy conformer of ethanediol (Melosso et al., 2020), and isotopic cyanamide (Coutens et al., 2019); the difference between the number of average parameters and their differences is very small in the last example, which may, at least in part, be related to the large energy splitting between the two tunneling states.
The HFS splitting requires appropriate terms to be added to the Hamiltonian; these are the quadrupole coupling parameters with , , on the diagonal and off-diagonal. Since the quadrupole tensor is traceless, only two of the three are independent.
The rotation-tunneling spectrum of DMA is relatively sparse on the level of the strongest transitions. In addition, several of the stronger series of transitions display HFS splitting that is neither well resolved, be it into the three strong components or be it into the and the overlapping components, nor fully collapsed. Such patterns make it more difficult to determine rest frequencies very accurately. And finally, several series of interest are very weak such that their S/N may be insufficient in spectral recordings that cover large frequency regions in a reasonable amount of time. Therefore, we decided to search in most cases only for individual rotation-tunneling transitions.
An initial catalog file was created from the transition frequencies by Wollrab & Laurie (1968) applying 100 kHz as uncertainty for all lines as reported. We carried out exploratory measurements between 76 and 124 GHz to evaluate the quality of the model. The transitions cover almost exclusively low or very low values in (), notably the -branch () transitions with , , , and as well as -branch () transitions with . Most of these transitions displayed fully (Fig. 4) or partially resolved HFS splitting. Internal rotation splitting affected sometimes the positions of the strongest central component; the uncertainty of the corresponding line was increased somewhat as long as the effect appeared to be small, otherwise, the line was not used in the fit.
In the course of the investigation, three of the initial transition frequencies (Wollrab & Laurie, 1968) showed large residuals that were eventually interpreted as typographical errors as two residuals were very close to 1.0 MHz and one very close to 2.0 MHz.
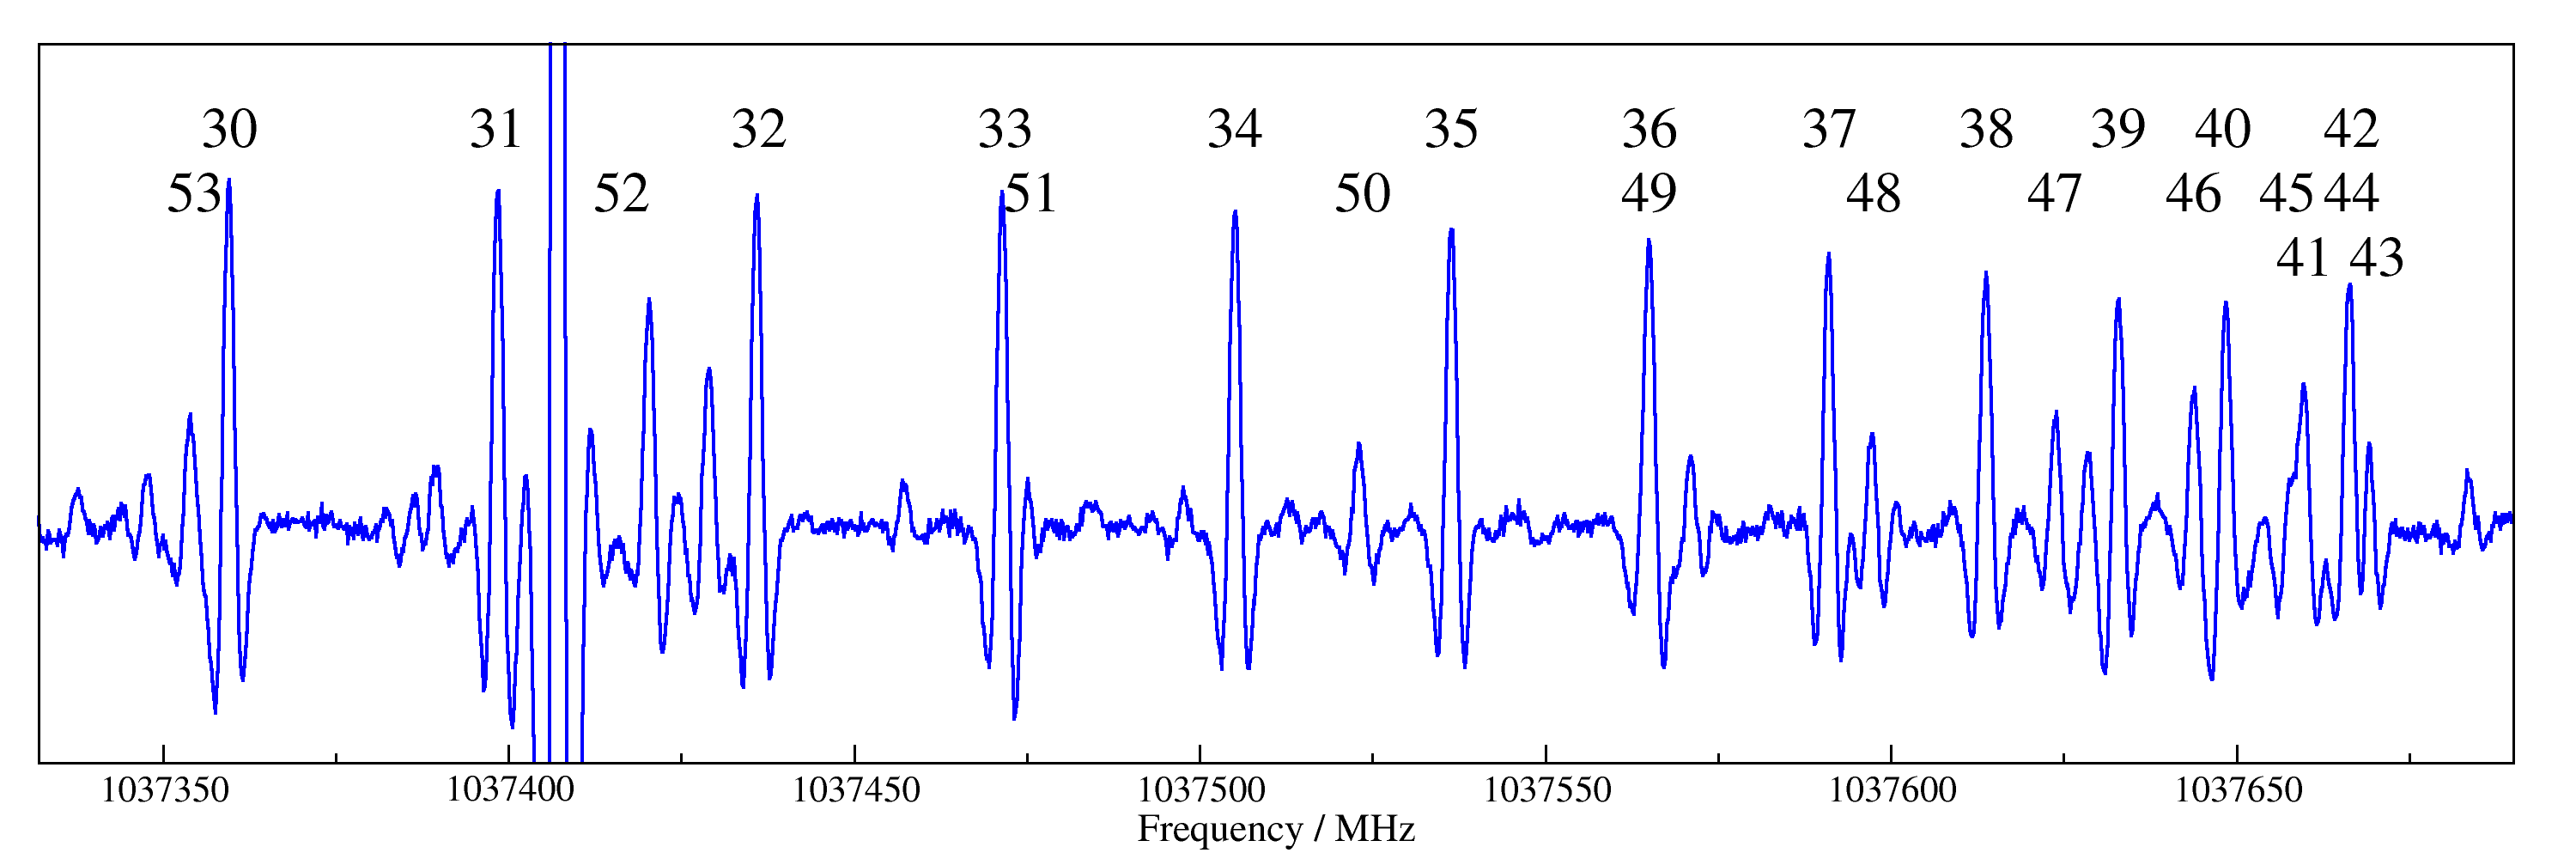
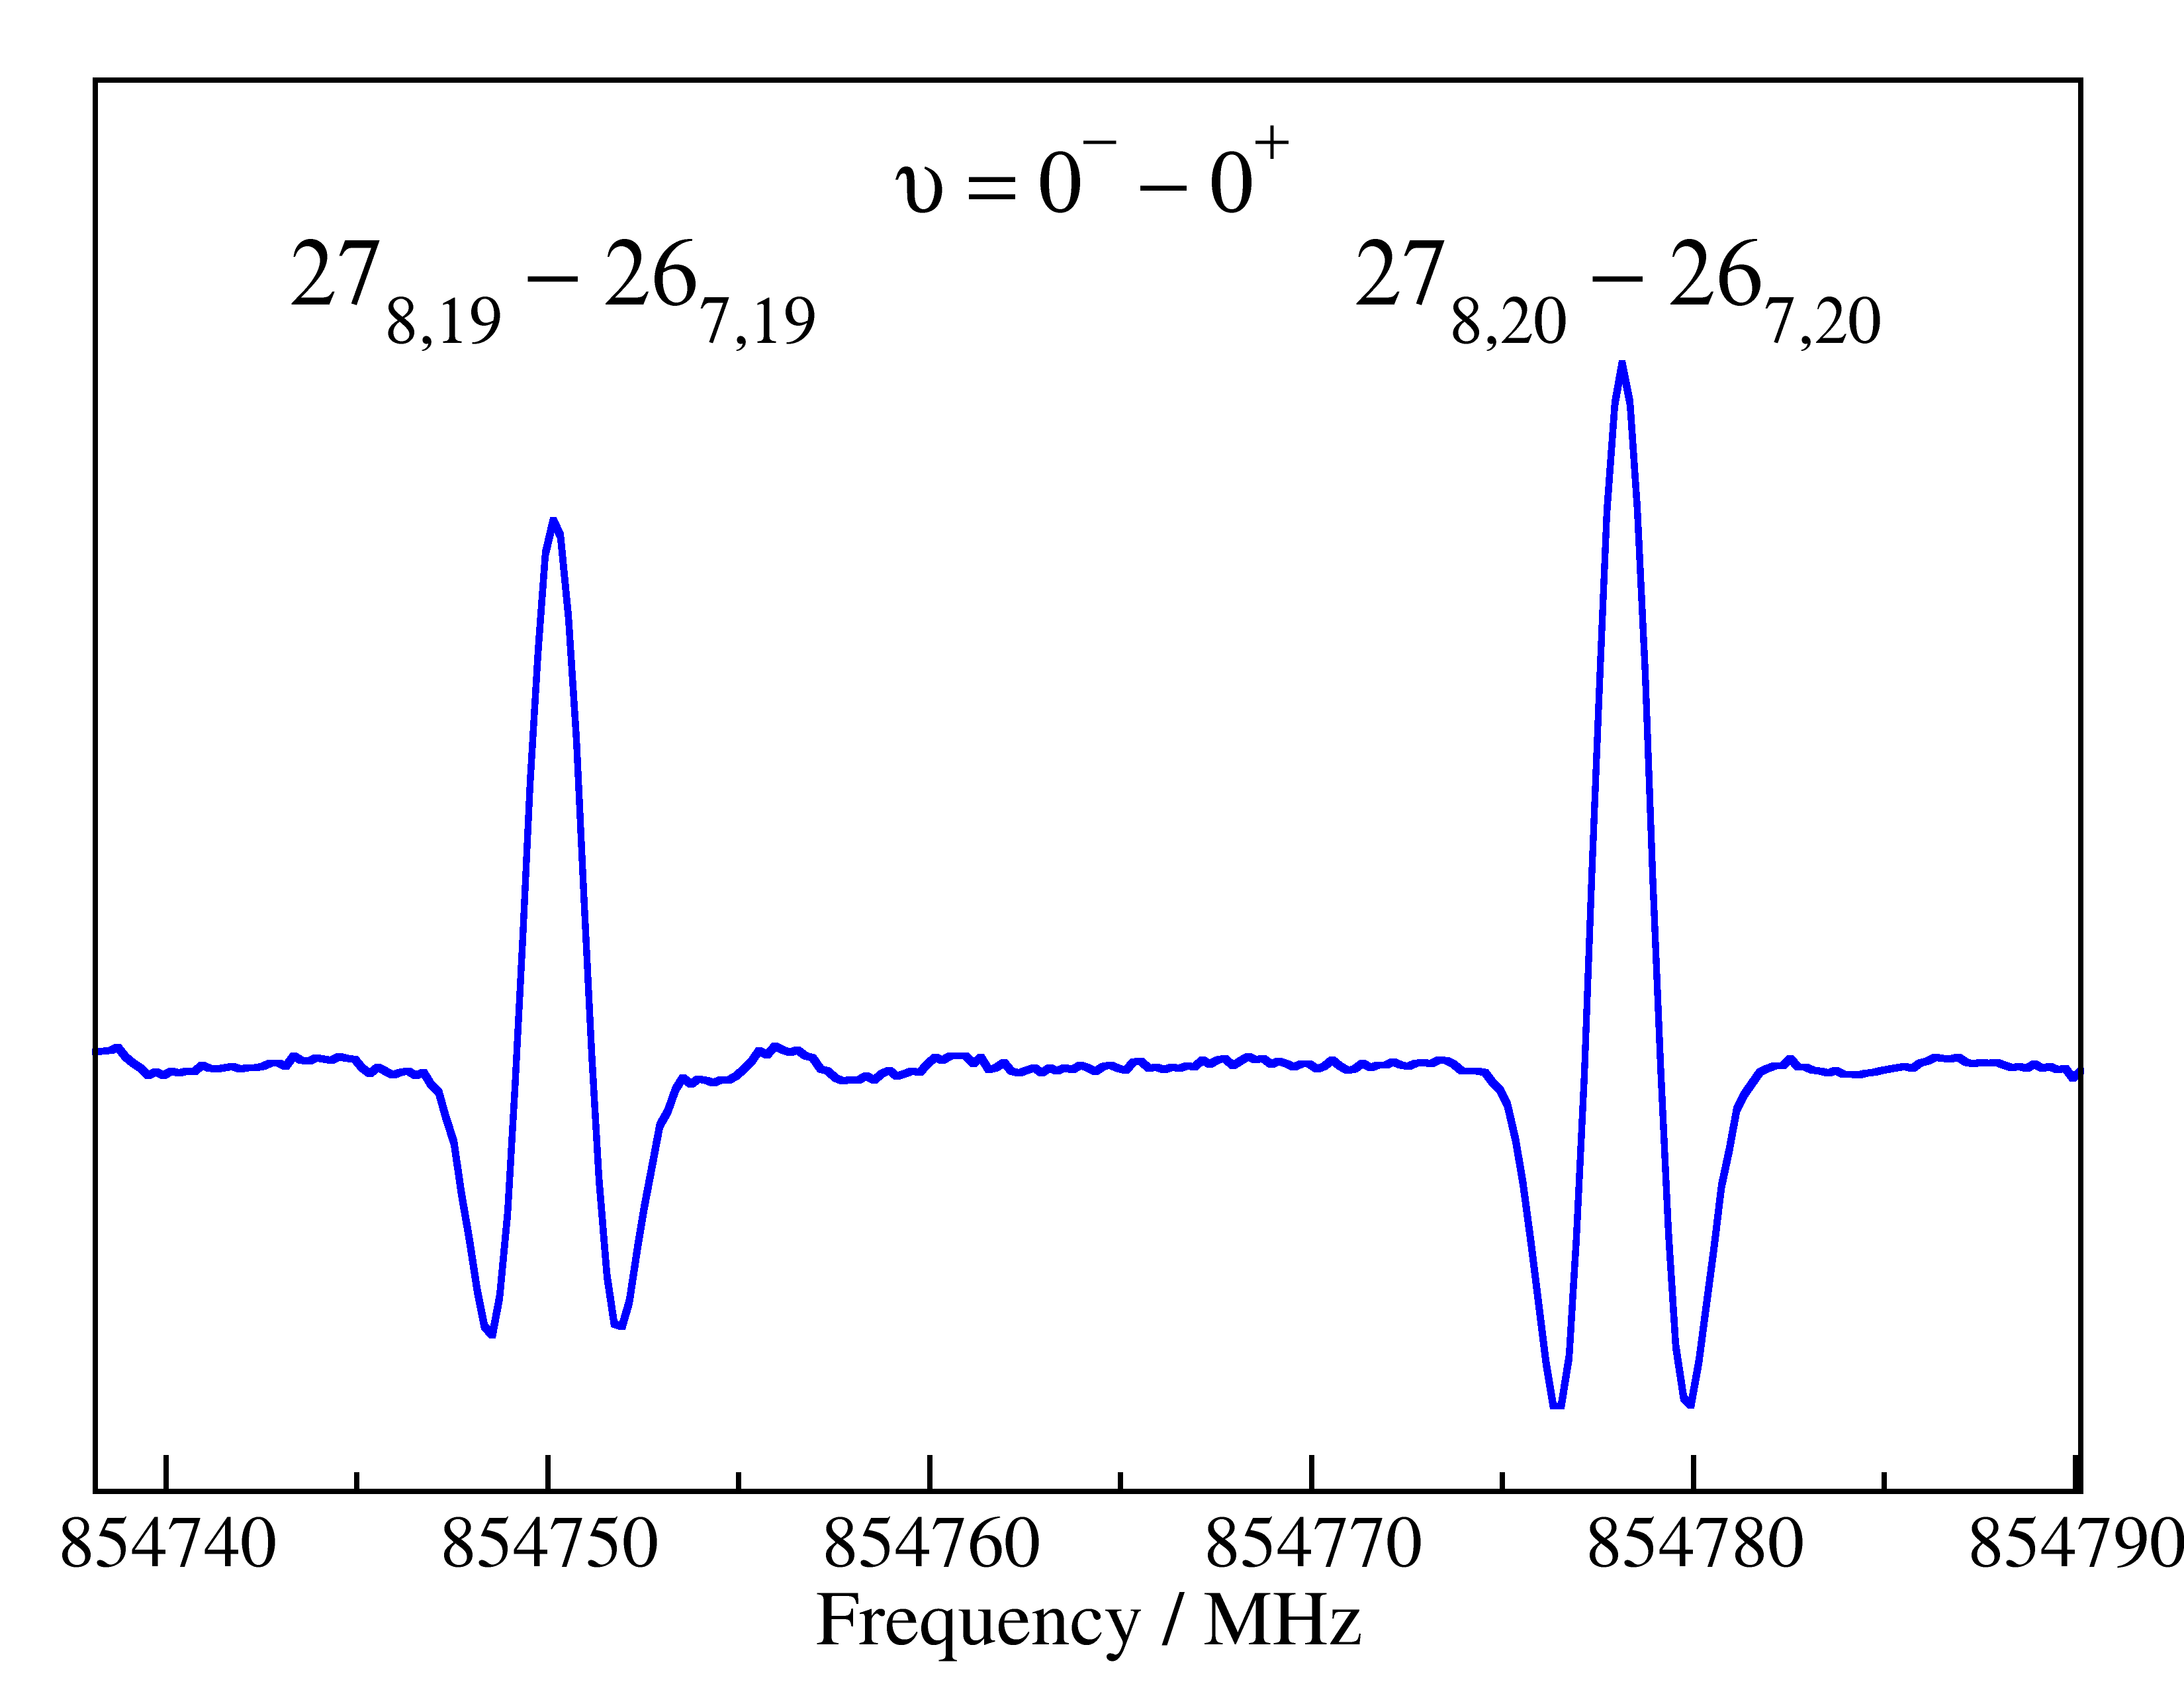
The majority of the measurements were made between 159 and 375 GHz, fairly extensive recordings were also carried out between 793 and 1091 GHz. We focused on transitions that had a splitting between the and the overlapping components of at least one line width up to 254 GHz or on transitions having HFS splitting well within half of the estimated line width throughout the entire frequency region. We tried to record as many members of specific series as possible with limitations caused by the intrinsic weakness of a series, the reduced sensitivity of the spectrometer in certain regions, especially at the edges, or by accidental blending. We covered several different series of transitions pertaining to adjacent for low values of . The strong -branch transitions were covered up to around 1067 GHz. All values were covered up to , which was accessed through both -branches, with or with representing the lower state level; part of the former one is shown in Fig. 5. The highest level that we accessed had . The highest value with partially resolved HFS was 44 for the -branch transitions within and near 252565 MHz; we only used the overlapping components because the uncertainties of the components were much larger. The components were also kept in the line list for several -branch transitions between and with 38 being the highest value near 163889 MHz.
| Parameter | Value | |
|---|---|---|
| 34242 | .442246 (208) | |
| 9334 | .296360 (77) | |
| 8215 | .651275 (72) | |
| 255 | .2442 (33) | |
| 32 | .49219 (66) | |
| 8 | .273664 (98) | |
| 1 | .614217 (34) | |
| 0 | .014938 (16) | |
| 9104 | .5 (220) | |
| 2063 | .2 (41) | |
| 66 | .83 (47) | |
| 6 | .592 (51) | |
| 3 | .8166 (103) | |
| 0 | .6967 ( 61) | |
| 0 | .0386 (13) | |
| 1691 | . ( 64) | |
| 734 | .2 (117) | |
| 29 | .92 (174) | |
| 2 | .255 (114) | |
| 0 | .1061 (96) | |
| 0 | .521 (64) | |
| 0 | .6835 (137) | |
| 0 | .0345 (28) | |
| 10 | .98176(137) | |
| 6 | .31 (27) | |
| 0 | .2747 (30) | |
| 1322 | .95355 (21) | |
| 288 | .982 (22) | |
| 22 | .1617 (23) | |
| 70 | .931 (160) | |
| 10 | .808 (22) | |
| 0 | .3817 (26) | |
| 12 | .05 (33) | |
| 2 | .736 (87) | |
| 0 | .2006 (123) | |
| 5 | .56 (100) | |
| 916 | .10 (242) | |
| 37 | .46 (169) | |
| 2 | .99972 (95) | |
| a | 0 | .94217 (176) |
| 3 | .94189 (146) | |
| 2 | .959 (74) | |
Watson’s S reduction was used in the representation . Numbers in parentheses are one standard deviation in units of the least significant figures.
a Derived parameter.
We took care to describe the rotation-tunneling interaction in DMA well. To this end, we tried to cover as many near-degenerate levels as available. We accessed several transitions for each between 1 and 8, as can be seen in Table 1; we reached only one below the strongest interaction for . The interaction transfers intensity from -type transitions to some of the weaker -type transitions. This is best described with being positive when and are chosen to be positive. The parameter affects in particular the line positions in the transitions involving the levels. Its value needed to be negative once was chosen to be positive.
The determination of the spectroscopic parameters was carried out in the usual way. We tested after each round of assignments if one or more spectroscopic parameters would improve the quality of the fit by amounts that warranted keeping the respective parameter in the fit. Care was taken to try only parameters that are reasonable with respect to those already used in the fit. If at least one parameter improved the quality of the fit sufficiently, we chose the one that improved the quality the most and searched for additional parameters. Correlation among the parameters may cause a parameter that looked well determined, i.e., with a magnitude at least several times its uncertainty, to be not well determined. It was omitted from the fit, often only temporarily, if its omission did not cause a large deterioration of the fit.
Some of our spectral recordings resolved internal rotation splitting, as can be seen in Fig. 4. DMA is isoelectronic to dimethyl ether; the internal rotation patterns for this molecule were described in detail for example by Endres et al. (2009). Briefly, the nine equivalent internal rotation positions caused by the two equivalent methyl rotors in DMA and dimethyl ether lead to four distinct internal rotation substates , , , and . The lines pertaining to and are frequently blended, in particular in dimethyl ether and even more so in DMA with their small internal rotation splittings. The combined and peak has then the same intensity as the peak, and the two peaks occur to either side of the central peak displaced by essentially the same amount in the absence of strong torsion-rotation interaction. Information on the internal rotation splitting in DMA is provided in the microwave study on torsionally excited DMA (Wollrab & Laurie, 1971). We did not use the internal rotation splitting of ground state DMA in almost all of our fits and only used the central, strong internal rotation peak ().
The SPFIT program is capable of fitting spectra with small internal rotation splitting (Drouin et al., 2006; Endres et al., 2009), but attempts to introduce internal rotation into the treatment of the rotation-tunneling spectrum of DMA failed. The transition frequencies calculated with internal rotation splitting differed from those calculated without splitting by a few to several tens of kilohertz, often well outside the experimental uncertainties, and we were unable to reduce this difference. The reason is that the internal rotation splitting affects the tunneling splitting differently for different values of . Therefore, we also used only the frequencies of the central internal rotation components from the Fourier transform microwave measurements (Koziol et al., 2021). Four of the -type HFS components and most of the few -type HFS components showed larger residuals of around 10 kHz or more than the majority of the data, so the -type transitions and the four -type HFS components were omitted from the final fit. The residuals are a result of the density of lines for -type transitions with low values of and for some of the -type transitions. The Fourier transform microwave data did not require any additional parameters in the fit, such as nuclear spin-rotation parameters, but improved some of the lower order parameters substantially, in particular and as well as the rotational parameters and ; effects were smaller for most other parameters. The resulting spectroscopic parameters are listed in Table 2.
The 48 transition frequencies from Wollrab & Laurie (1968) were fit to 103 kHz on average, acceptably close to the assigned 100 kHz uncertainty. The more recent microwave data from Koziol et al. (2021) were fit to 1.39 kHz on average. We had chosen 1.5 kHz as final uncertainties for these 88 transition frequencies after we recognized that the value of 1.0 kHz, initially assumed by us, was too optimistic. Our 1294 transitions were reproduced to an rms error, also known as weighted or normalized rms, of 0.952. As we employed a substantial range of different uncertainties, the rms value of 28.7 kHz is dominated by the data with larger uncertainties. The number of different frequencies is 943 because of overlapping HFS components, unresolved asymmetry splitting or accidental blending.
The fit file and calculations of the rotational spectrum of DMA with and without HFS have been deposited as supplementary material to this paper together with an explanatory file. These files as well as additional files are also available in the Cologne Database for Molecule Spectroscopy (CDMS111https://cdms.astro.uni-koeln.de/; Müller et al., 2005; Endres et al., 2016). The partition function was calculated for selected temperatures beyond the standard temperatures in the CDMS by summation over the ground state energies up to and . Spin-statistics and the spin-weight from the 14N nucleus were taken into account. In the warm ISM ( K), excited vibrational states are populated non-negligibly. We evaluated the vibrational partition function for a posteriori correction in the harmonic approximation. Gamer & Wolff (1973) and Durig et al. (1977) reported on gas phase infrared and Raman measurements. These reports are, however, not always consistent with each other and are incomplete as not all of the 24 fundamental vibrations were identified. Explanations for the incompleteness and inconsistency are that some fundamentals are very weak and may be blended with potentially stronger overtone and combination bands. Moreover, some fundamentals occur in a very narrow energy range. We carried out quantum-chemical calculations at the Regionales Rechenzentrum der Universität zu Köln (RRZK) using the commercially available program Gaussian 09 (Frisch et al., 2013) in order to calculate the harmonic and anharmonic fundamentals of DMA. We employed the B3LYP hybrid density functional (Becke, 1993; Lee et al., 1988) for that matter together with the correlation consistent basis set augmented with diffuse basis functions commonly denoted aug-cc-pVTZ (Dunning, Jr., 1989). There are 17 fundamentals below 1500 cm-1; the highest ones correspond to a Boltzmann factor of 10-3 at 300 K; the remaining fundamentals are above 2700 cm-1. Wherever fundamentals are isolated and not too weak, there is usually good to reasonable agreement between experimental and calculated values. Gamer & Wolff (1973) and Durig et al. (1977) reported also vibrations around 1450 cm-1, but fewer than 7, and some of their values may correspond to overtones or combination bands. The experimental and quantum-chemically evaluated fundamentals are presented in Table 3, and the resulting values for and are summarized in Table 4.
| Mode No. | (b) | (c) | Harm. | Anharm. |
| 24 | — | 219.4 | 224.8 | 243.1 |
| 13 | 230? | 256.3 | 254.2 | 259.0 |
| 12 | 384 | 383 | 380.5 | 375.4 |
| 11 | 735 | ? | 755 | 685 |
| 10 | 928 | 929 | 935 | 913 |
| 23 | — | — | 1034 | 1026 |
| 22 | — | — | 1100 | 1078 |
| 21 | 1145? | 1123 | 1165 | 1132 |
| 9 | 1145? | 1159 | 1184 | 1148 |
| 8 | 1240 | 1240 | 1265 | 1234 |
| 20 | 1442 | 1412 | ||
| 7 | 1467 | 1438 | ||
| 19 | 1475 | 1438 | ||
| 18 | 1487 | 1460 | ||
| 6 | 1495 | 1449 | ||
| 5 | 1516 | 1475 | ||
| 17 | 1516 | 1478 |
| 300 | . | 822487 | .8817 | 2.7773 |
| 250 | . | 625513 | .5474 | 2.0932 |
| 225 | . | 534004 | .2559 | 1.8313 |
| 200 | . | 447470 | .9752 | 1.6117 |
| 180 | . | 382025 | .6185 | 1.4627 |
| 170 | . | 350623 | .5753 | 1.3964 |
| 160 | . | 320135 | .2065 | 1.3353 |
| 150 | . | 290588 | .3240 | 1.2793 |
| 140 | . | 262013 | .4910 | 1.2284 |
| 125 | . | 221048 | .8001 | 1.1615 |
| 100 | . | 158173 | .3256 | 1.0757 |
| 75 | . | 102752 | .3393 | 1.0232 |
| 50 | . | 55958 | .0584 | 1.0025 |
| 37 | .5 | 36366 | .3518 | 1.0003 |
| 18 | .75 | 12889 | .3154 | 1.0000 |
| 9 | .375 | 4580 | .6180 | 1.0000 |
| 5 | .0 | 1800 | .4981 | 1.0000 |
| 2 | .725 | 736 | .4721 | 1.0000 |
a We employ a reduced spin-weight of 9 : 7 for ortho and para states, respectively, instead of the full spin-weight of 72 : 56 to circumvent limitations for the upper state degeneracies in the catalog files.
5 Discussion of the spectroscopic parameters
The spectroscopic parameters of DMA are prototypical for an asymmetric top molecule close to the prolate limit, as the series of parameters describing the asymmetry (the ’s and ’s) converge faster than that of the purely -dependent parameters (, , ), and that, in turn, converges faster than the series of purely -dependent parameters (, , , ). In addition, the magnitudes of the diagonal distortion parameters within a given order decrease considerably from the purely -dependent parameters to the purely -dependent parameters with the minor exception of and . A strong decrease is also seen for and as well as for to . The distortion corrections to the energy behave in a similar way, and their number is smaller than that of the regular distortion parameters, commensurate with the moderate energy difference between and .
The value of is quite small, and only two distortion corrections are required to fit this fairly large data set well. The HFS parameters are very well determined, including the interaction parameter . It is not surprising that the 14N nuclear spin-rotation parameters could not be determined, as the magnetic moment of 14N is quite small. Inclusion of resolved internal rotation components other than the central components into a fit should not only enable the direct determination of a probably small number of internal rotation parameters, but may also reduce the uncertainties of some of the lower order parameters slightly.
Our present spectroscopic parameters are sufficiently accurate for all kinds of astronomical observations. The neglect of the internal rotation does not pose a limitation in sources such as Sgr B2(N) or G+0.6930.027. Moreover, it should affect our current parameter values negligibly. Internal rotation may need to be considered around 100 GHz for sources with line widths less than 2 km s-1. The internal rotation splitting is likely too small to be resolved at much higher frequencies. Conversely, the DMA lines are probably too weak at lower frequencies in the warm ISM (around 100 to 200 K).
6 Search for dimethylamine toward G+0.693–0.027
6.1 Observations
We searched for DMA toward the G+0.6930.027 molecular cloud, located in the Sgr B2 Giant Molecular Cloud of the Galactic center region. This source exhibits an extremely rich molecular complexity, and numerous molecular species have been detected for the first time toward it (see e.g. Rivilla et al. 2019, 2020; Bizzocchi et al. 2020; Rivilla et al. 2021a, b, 2022c, 2022a; Rodríguez-Almeida et al. 2021b, a; Zeng et al. 2021; Jiménez-Serra et al. 2022). We used a sensitive unbiased spectral survey performed with the Yebes 40m (Guadalajara, Spain) and the IRAM 30m (Granada, Spain) telescopes. The position switching observations were centered at (J2000.0)= 17h47m22s, (J2000.0)=28∘21′27′′. The Yebes 40m observations cover a spectral range from 31.0 GHz to 50.4 GHz, while the IRAM 30m observations cover the spectral ranges 71.77116.72 GHz, 124.8–175.5 GHz, and 199.8238.3 GHz. The line intensity of the spectra was measured in units of as the molecular emission toward G+0.693 is extended over the beam (Requena-Torres et al. 2006, 2008; Zeng et al. 2018, 2020). The noise of the spectra (in ) depends on the frequency range, and varies from 1 to 10 mK. The spectra were smoothed to velocity resolutions of 1.02.6 km s-1, depending on the frequency. For more detailed information of the observational survey we refer to Rivilla et al. (2022b).
| Molecule | a | b | |
| (cm-2) | |||
| CH3OHc | 1.51016 | 1.110-7 | 1 |
| CH3OCH3 | 1.11014 | 8.110-10 | 136 |
| CH3NH2d | 3.01015 | 2.210-8 | 5 |
| CH3NHCH3 | 7.61013 | 5.610-10 |
6.2 Nondetection of dimethylamine toward G+0.693–0.027
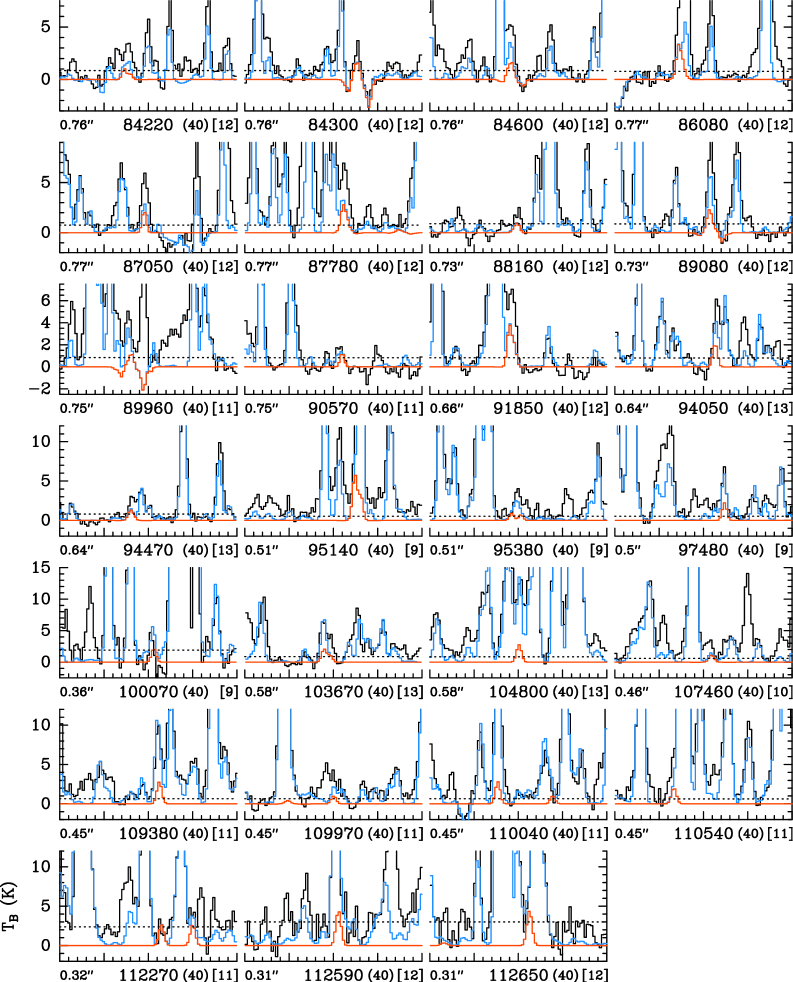
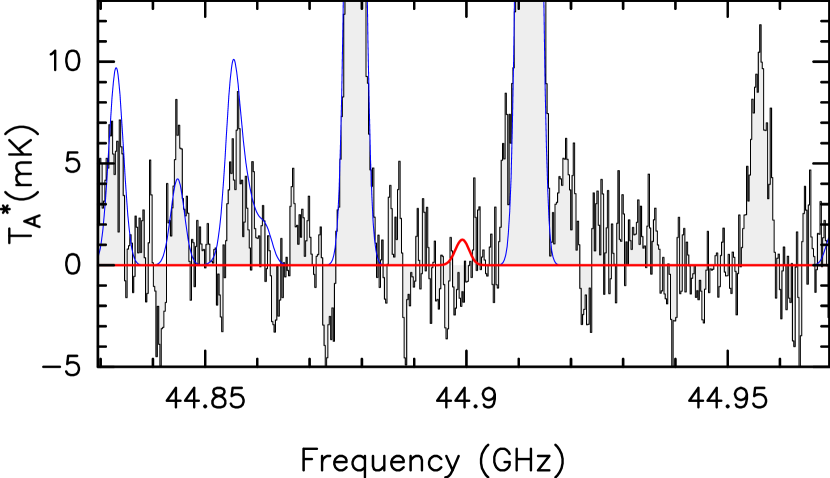
We implemented the spectroscopic entry of DMA presented in this work into the MADCUBA package222Madrid Data Cube Analysis is a software developed at the Center of Astrobiology (CAB) in Madrid and built using the Image Processing and Analysis in Java (ImageJ) infrastructure; http://cab.inta-csic.es/madcuba/ (version 28/10/2022; Martín et al. 2019). Using the SLIM (Spectral Line Identification and Modeling) tool of MADCUBA, we generated a synthetic spectrum of DMA under the assumption of local thermodynamic equilibrium (LTE) and compared it with the observed spectra. The molecule is not detected in the observational survey. Most of the DMA transitions appear heavily blended with brighter transitions from other molecules already identified in the survey. To derive the upper limit to the column density, we have used the brightest emission according to the simulated LTE model that appears unblended, which are three unresolved HFS components of the transition with 01, 21 and 11 that fall in the Q-band survey performed with the Yebes telescope and that are shown in Fig. 6. For the LTE simulated spectrum, we have used the excitation temperature derived for \ceCH3NH2 by Zeng et al. (2018), 16 K, which is similar to those derived for \ceC2H3NH2 and \ceC2H5NH2 (18 and 12 K, respectively; Zeng et al. 2021). We also used the velocity and linewidth found for the latter species: km s-1 and km s-1; the beam size at 44.9 GHz is 39”. Unfortunately, the predicted emission just appears in a spectral region which shows a local minimum in the data with respect to the adjusted broad band baseline. Considering the noise of the data, we obtained a 3 upper limit in integrated area of 7.61013 cm-2, which corresponds to an abundance compared to H2 of 5.610-10, using (H2)=1.351023 cm-2 (Martín et al. 2008). This upper limit as well as column densities of methylamine, methanol and dimethyl ether are summarized in Table 5 together with derived quantities. The upper limit to the column density of DMA could be affected by the local baseline by less than a factor of two when the local baseline uncertainty is considered. The rms noise level in the Yebes spectrum near 44.9 GHz is 1.6 mK in a 1.5 km s-1 channel. Fortunately, the spectral region of these transitions seems to be clean from contamination, opening the possibility of a detection in future more sensitive Q band searches.
7 Search for dimethylamine toward Sgr B2(N)
7.1 Observations
We also used the imaging spectral line survey Reexploring Molecular Complexity with ALMA (ReMoCA) that targeted the high-mass star forming protocluster Sgr B2(N) with ALMA to search for dimethylamine in the interstellar medium. The data reduction and the method of analysis of this survey were described in Belloche et al. (2019). We summarize the main features of the survey below. The phase center is located at the equatorial position ()J2000= (). This position is half-way between the two hot molecular cores Sgr B2(N1) and Sgr B2(N2). The survey covers the frequency range from 84.1 GHz to 114.4 GHz at a spectral resolution of 488 kHz (1.7 to 1.3 km s-1). This frequency coverage was obtained with five different tunings of the receivers. The observations achieved a sensitivity per spectral channel ranging between 0.35 mJy beam-1 and 1.1 mJy beam-1 (rms) depending on the setup, with a median value of 0.8 mJy beam-1. The angular resolution (HPBW) varies between 0.3 and 0.8 with a median value of 0.6. This corresponds to 4900 au at the distance of Sgr B2 (8.2 kpc, Reid et al., 2019). We further improved the process that separates the line and continuum emission by adding two reference positions to the pool of positions that were used to find the frequency ranges that contain absorption features (for more details about the separation of line and continuum emission, see Belloche et al., 2019).
For this work we analyzed the spectra of two positions. The first one, Sgr B2(N1S), is located at ()J2000= (, ). It is offset by about 1 to the south of the main hot core Sgr B2(N1). This position was chosen by Belloche et al. (2019) for its lower continuum opacity compared to the peak of the hot core. The second position is the position called Sgr B2(N2b) by Belloche et al. (2022). It is located in the secondary hot core Sgr B2(N2) at ()J2000= (). This position was chosen as a compromise between getting narrow line widths to reduce the level of spectral confusion and keeping a high enough H2 column density to detect less abundant molecules.
Like in our previous ReMoCA studies (e.g., Belloche et al., 2019, 2022), we compared the observed spectra to synthetic spectra computed under the assumption of LTE with the astronomical software Weeds (Maret et al., 2011). This assumption is justified by the high densities of the regions where hot-core emission is detected in Sgr B2(N) ( cm-3, see Bonfand et al., 2019). The calculations take into account the finite angular resolution of the observations and the optical depth of the rotational transitions. For each position, we derived by eye a best-fit synthetic spectrum for each molecule separately, and then added together the contributions of all identified molecules. Each species was modeled with a set of five parameters: size of the emitting region (), column density (), temperature (), linewidth (), and velocity offset () with respect to the assumed systemic velocity of the source, km s-1 for Sgr B2(N1S) and km s-1 for Sgr B2(N2b). The linewidth and velocity offset are obtained directly from the well detected and not contaminated lines. The emission of complex organic molecules is extended over several arcseconds around Sgr B2(N1) (see Busch et al., 2022). For the LTE modeling, we assumed like in Belloche et al. (2019) an emission size of 2, which is much larger than the beam, meaning that the derived column densities do not depend on the exact value of this size parameter. In the case of Sgr B2(N2b), the size of the emission of a given molecule was estimated from integrated intensity maps of transitions of this given molecule that were found to be relatively free of contamination from other species.
7.2 Search for DMA toward Sgr B2(N1S) and Sgr B2(N2b)
| Molecule | Statesa | b |
| (K) | ||
| CH3OCH3 | , , | 174 ( 7) |
a Vibrational states that were taken into account to fit the population diagram.
b The standard deviation of the fit is given in parentheses. As explained in Sect. 3 of Belloche et al. (2016) and in Sect. 4.4 of Belloche et al. (2019), this uncertainty is purely statistical and should be viewed with caution. It may be underestimated.
| Molecule | Statesa | b |
| (K) | ||
| CH3OCH3 | , , | 127.2 (1.1) |
a Vibrational states that were taken into account to fit the population diagram.
b The standard deviation of the fit is given in parentheses. As explained in Sect. 3 of Belloche et al. (2016) and in Sect. 4.4 of Belloche et al. (2019), this uncertainty is purely statistical and should be viewed with caution. It may be underestimated.
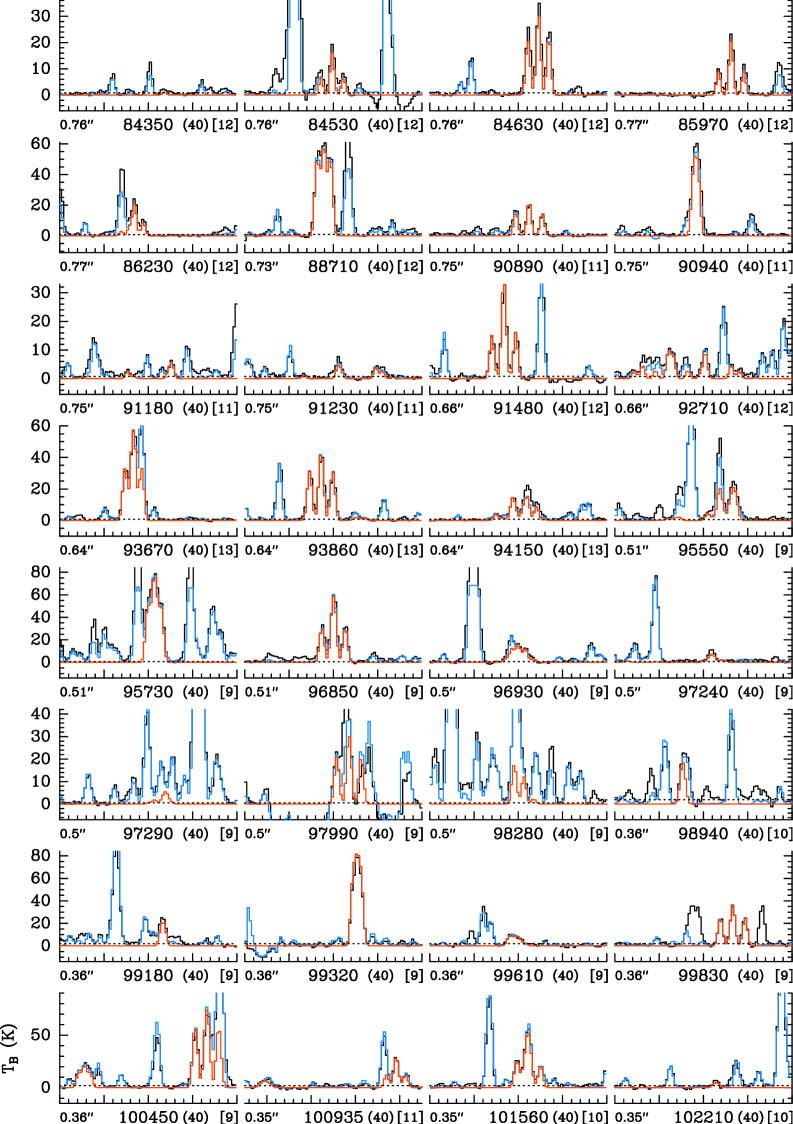
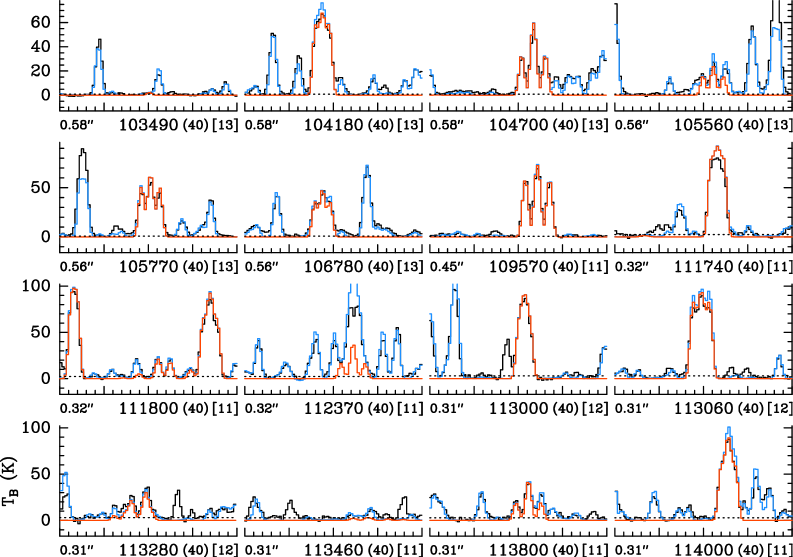
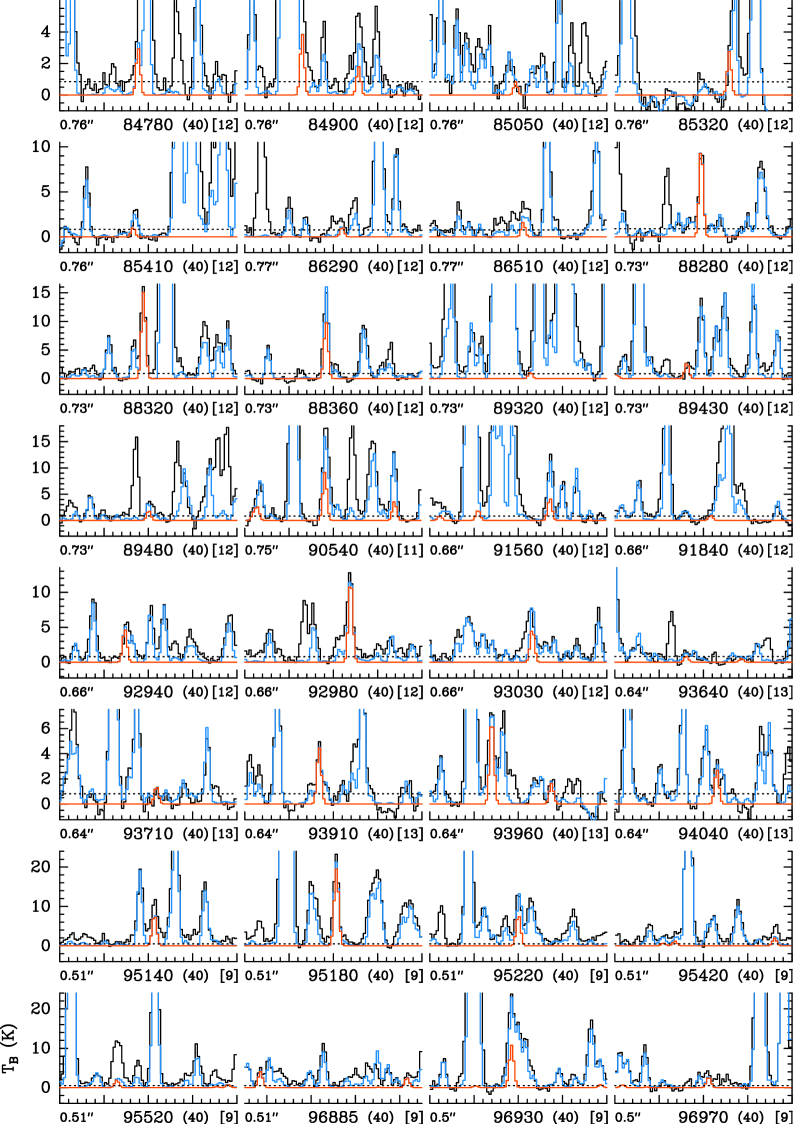
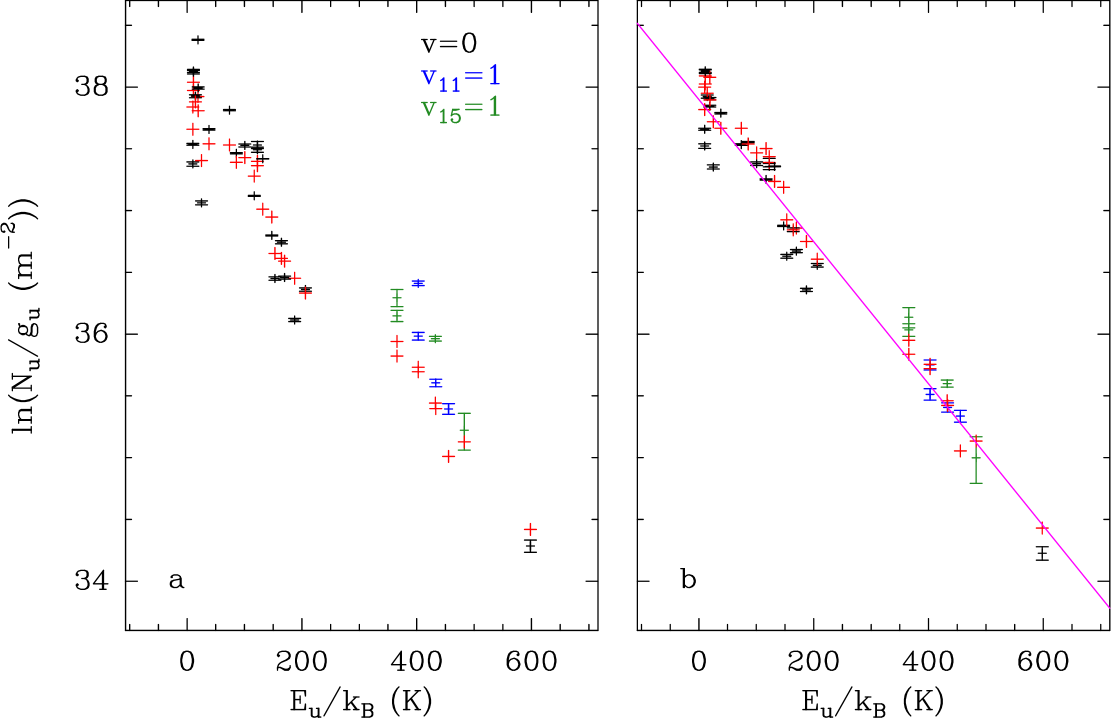
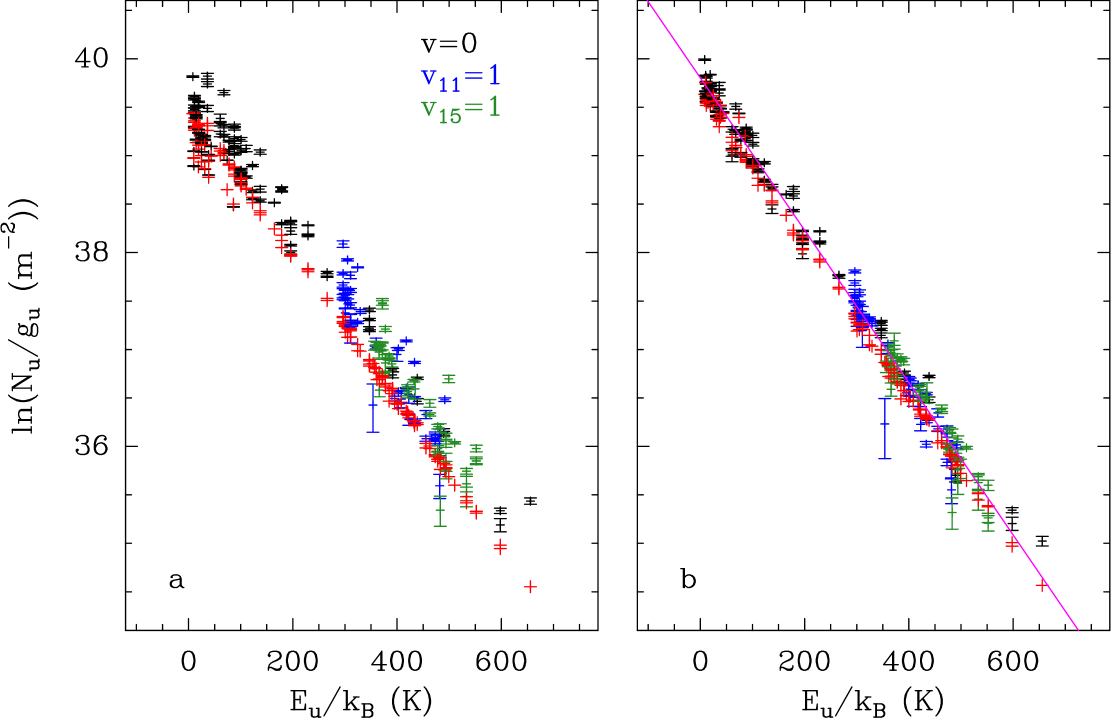
Before searching for dimethylamine, CH3NHCH3, toward Sgr B2(N1S) and Sgr B2(N2b), we modeled the rotational emission of the similar molecule dimethyl ether, CH3OCH3. We used the spectroscopic calculations available in the CDMS (Müller et al., 2005) for the vibrational ground state (version 1 of entry 46514), which are based on Endres et al. (2009) and references therein. For the vibrationally excited states and , we used like in Belloche et al. (2013) predictions provided by C. Endres. Dimethyl ether is well detected toward both Sgr B2(N1S) and Sgr B2(N2b), with dozens of lines in its vibrational ground state easily identified (see Figs. 14 and 17). Two dozen lines in each of its vibrationally excited states and are also clearly detected toward Sgr B2(N2b) (Figs. 18–19). Because of the broader line widths that increase the level of spectral confusion (5 km s-1 versus 3.5 km s-1 toward Sgr B2(N2b)), only a few lines from within and are sufficiently free of contamination to be identified toward Sgr B2(N1S) (Figs. 15–16). As explained in Sect. 7.1, we assumed an emission size of 2 to model the emission of dimethyl ether toward Sgr B2(N1S). In the case of Sgr B2(N2b), integrated intensity maps of lines of dimethyl ether that are free of contamination suggest an emission size on the order of 0.8. Figures 7 and 8 show population diagrams of dimethyl ether for Sgr B2(N1S) and Sgr B2(N2b), respectively. A fit to these population diagrams yields rotational temperatures of 170 K and 130 K, respectively (see Tables 6 and 7). Assuming these temperatures, we adjusted synthetic LTE spectra to the observed spectra and obtained the column densities reported in Tables 8 and 9 for dimethyl ether. We also list in these tables the parameters that we previously obtained from the ReMoCA survey for methanol toward both positions (Motiyenko et al., 2020; Belloche et al., 2022), as well as the parameters that we recently obtained for methylamine, CH3NH2, toward Sgr B2(N1S) (Gyawali et al., 2023), using the spectroscopic predictions available in the Lille Spectroscopic Database (version 2021.08.hfs of entry 31802), which are based on Motiyenko et al. (2014).
| Molecule | Statusa | b | Sizec | d | e | f | g | h | i |
| (′′) | (K) | (cm-2) | (km s-1) | (km s-1) | |||||
| CH3OHj,⋆ | d | 57 | 2.0 | 230 | 2.0 (19) | 1.00 | 5.0 | 0.2 | 1 |
| CH3OCH3, | d | 32 | 2.0 | 170 | 1.4 (18) | 1.02 | 5.0 | 0.0 | 14 |
| d | 3 | 2.0 | 170 | 1.4 (18) | 1.02 | 5.0 | 0.0 | 14 | |
| d | 3 | 2.0 | 170 | 1.4 (18) | 1.02 | 5.0 | 0.0 | 14 | |
| CH3NH2k | d | 15 | 2.0 | 230 | 1.4 (18) | 1.25 | 5.0 | 0.0 | 15 |
| CH3NHCH3, | n | 0 | 2.0 | 170 | 9.8 (16) | 1.40 | 5.0 | 0.0 | 204 |
a d: detection, n: nondetection. b Number of detected lines (conservative estimate, see Sect. 3 of Belloche et al., 2016). One line of a given species may mean a group of transitions of that species that are blended together. c Emission size (FWHM). d Rotational temperature. e Total column density of the molecule. () means . f Correction factor that was applied to the column density to account for the contribution of vibrationally excited states, in the cases where this contribution was not included in the partition function of the spectroscopic predictions. g Linewidth (FWHM). h Velocity offset with respect to the assumed systemic velocity of Sgr B2(N1S), km s-1. i Column density ratio, with the column density of the previous reference species marked with a . j The parameters were derived from the ReMoCA survey by Motiyenko et al. (2020). k The parameters were derived from the ReMoCA survey by Gyawali et al. (2023).
| Molecule | Statusa | b | Sizec | d | f | g | h | i | |
| (′′) | (K) | (cm-2) | (km s-1) | (km s-1) | |||||
| CH3OHj,⋆ | d | 69 | 0.5 | 140 | 8.0 (19) | 1.00 | 3.5 | 0.0 | 1 |
| CH3OCH3, | d | 93 | 0.8 | 130 | 3.1 (18) | 1.00 | 3.5 | -0.5 | 26 |
| d | 24 | 0.8 | 130 | 3.1 (18) | 1.00 | 3.5 | -0.5 | 26 | |
| d | 26 | 0.8 | 130 | 3.1 (18) | 1.00 | 3.5 | -0.5 | 26 | |
| CH3NH2, | t | 2 | 0.5 | 140 | 2.7 (17) | 1.07 | 3.5 | 0.0 | 299 |
| CH3NHCH3, | n | 0 | 0.8 | 130 | 5.9 (16) | 1.18 | 3.5 | 0.0 | 1360 |
a d: detection, t: tentative detection, n: nondetection. b Number of detected lines (conservative estimate, see Sect. 3 of Belloche et al., 2016). One line of a given species may mean a group of transitions of that species that are blended together. c Emission size (FWHM). d Rotational temperature. e Total column density of the molecule. () means . f Correction factor that was applied to the column density to account for the contribution of vibrationally excited states, in the cases where this contribution was not included in the partition function of the spectroscopic predictions. g Linewidth (FWHM). h Velocity offset with respect to the assumed systemic velocity of Sgr B2(N2b), km s-1. i Column density ratio, with the column density of the previous reference species marked with a . j The parameters were derived from the ReMoCA survey by Belloche et al. (2022).
Methylamine turns out to be more difficult to identify toward Sgr B2(N2b) than toward Sgr B2(N1S). Methylamine has a similar rotational temperature as methanol toward Sgr B2(N1S), which led us to assume the same rotational temperature and emission size as methanol toward Sgr B2(N2b). The best-fit synthetic LTE spectrum of methylamine using these parameters is shown in Fig. 20. Most transitions of this molecule are contaminated by emission from other species. Only two transitions are relatively free of contamination (at 84 306 and 112 273 MHz). As a result, we only claim a tentative detection of methylamine toward Sgr B2(N2b). The parameters of its best-fit LTE model are given in Table 9.
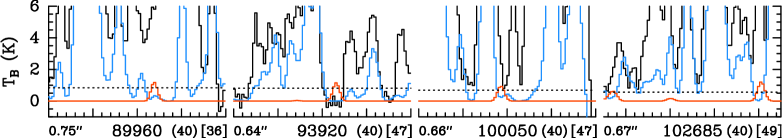
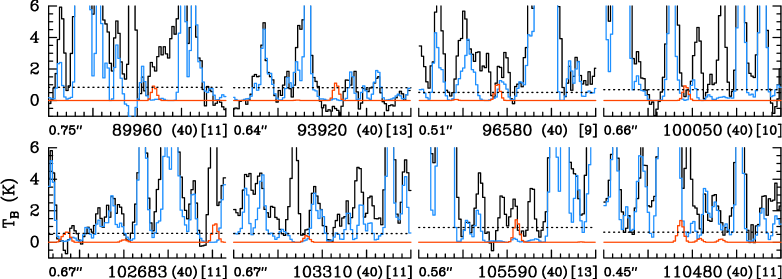
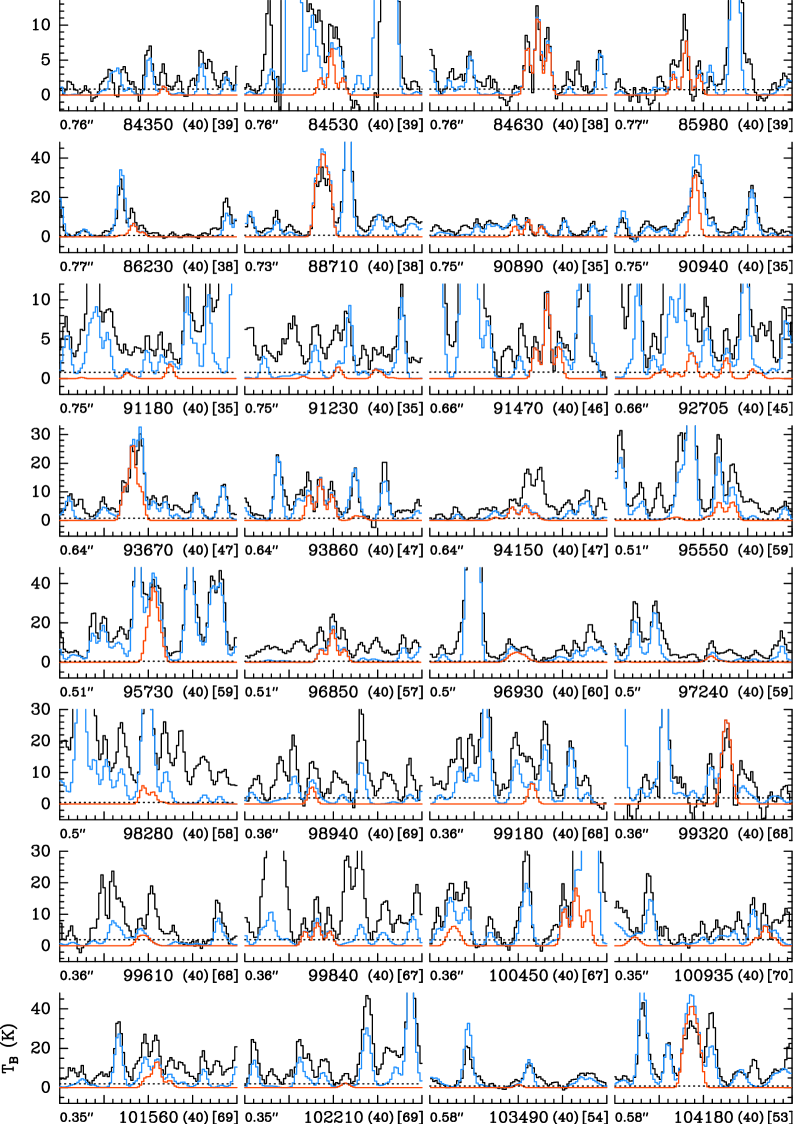
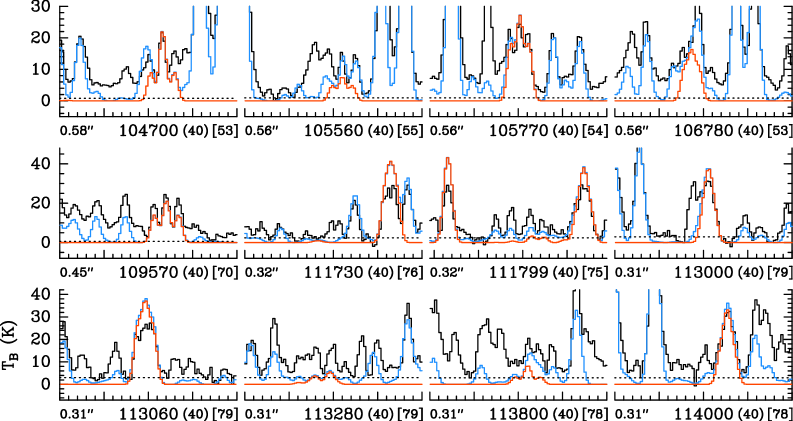
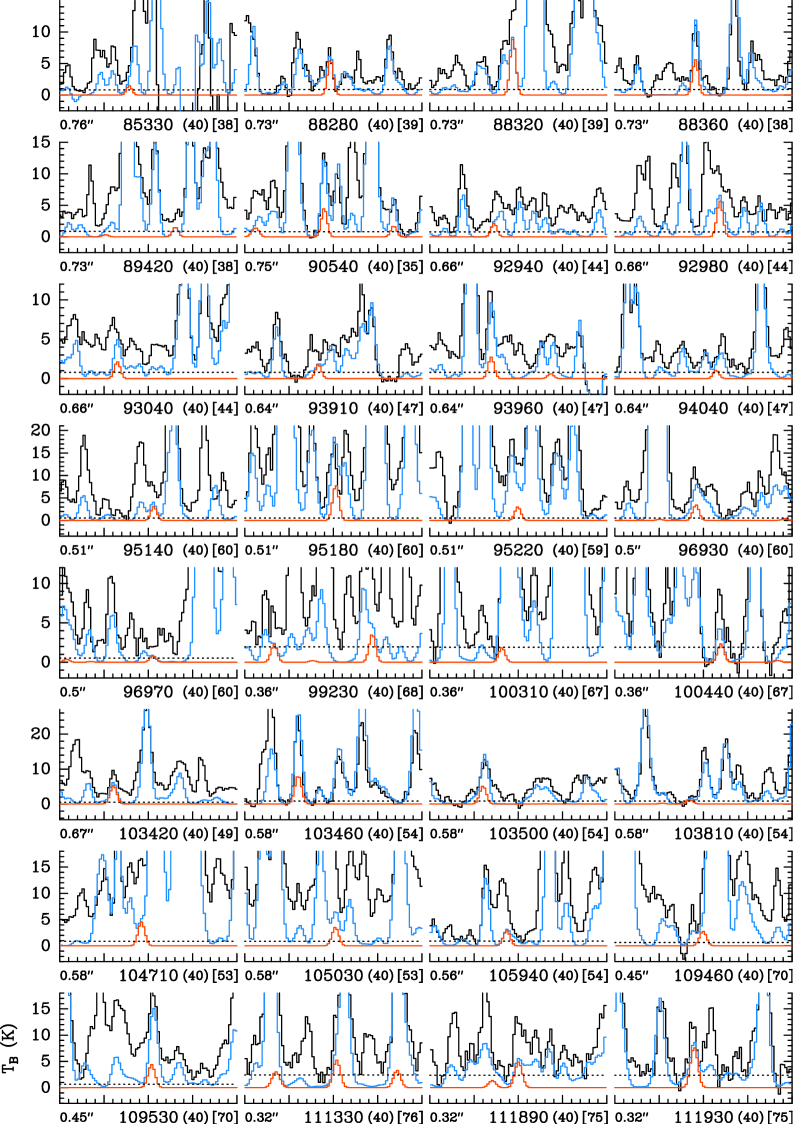
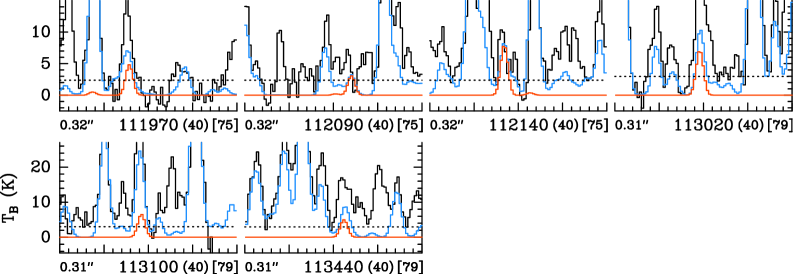
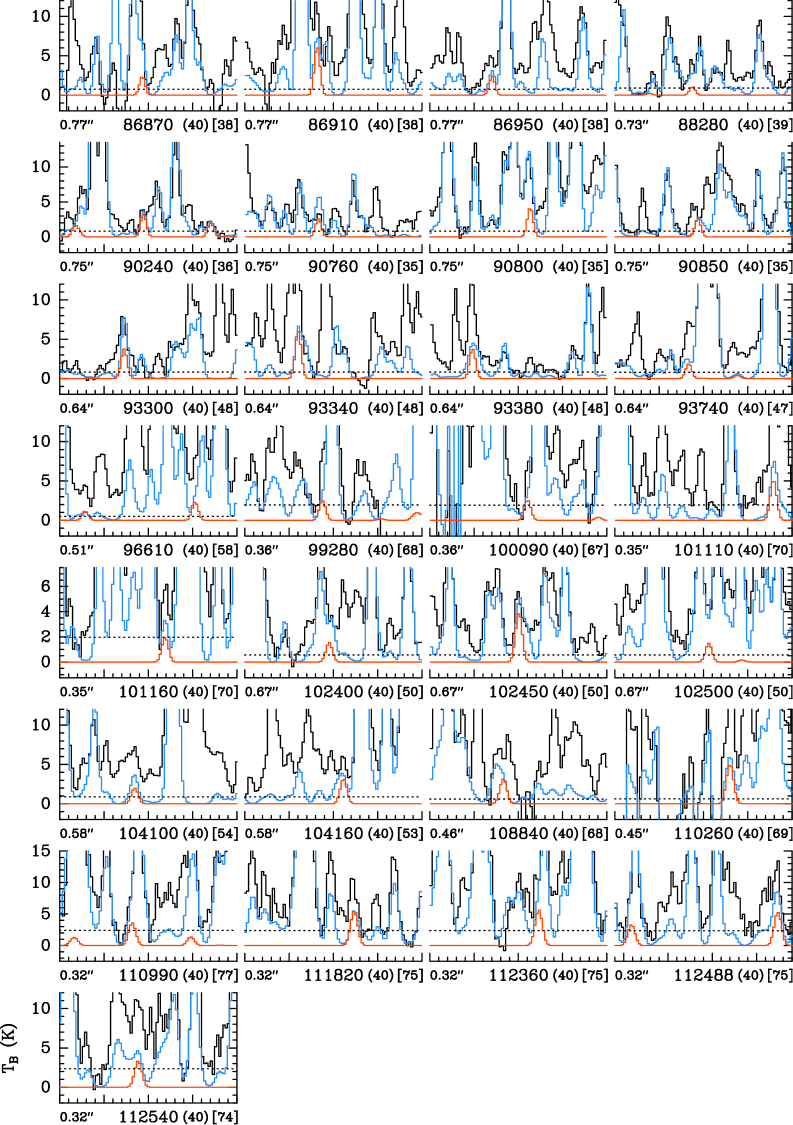
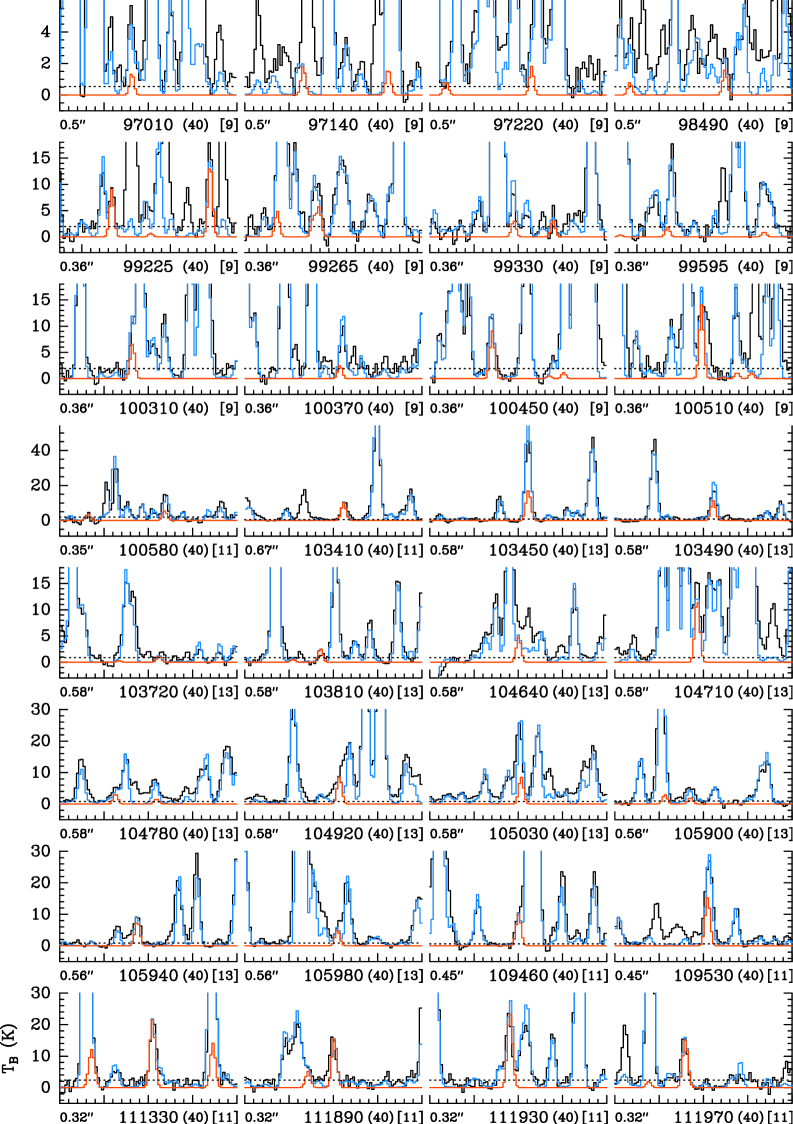
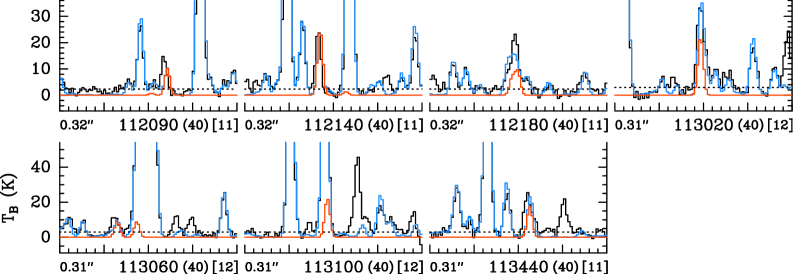
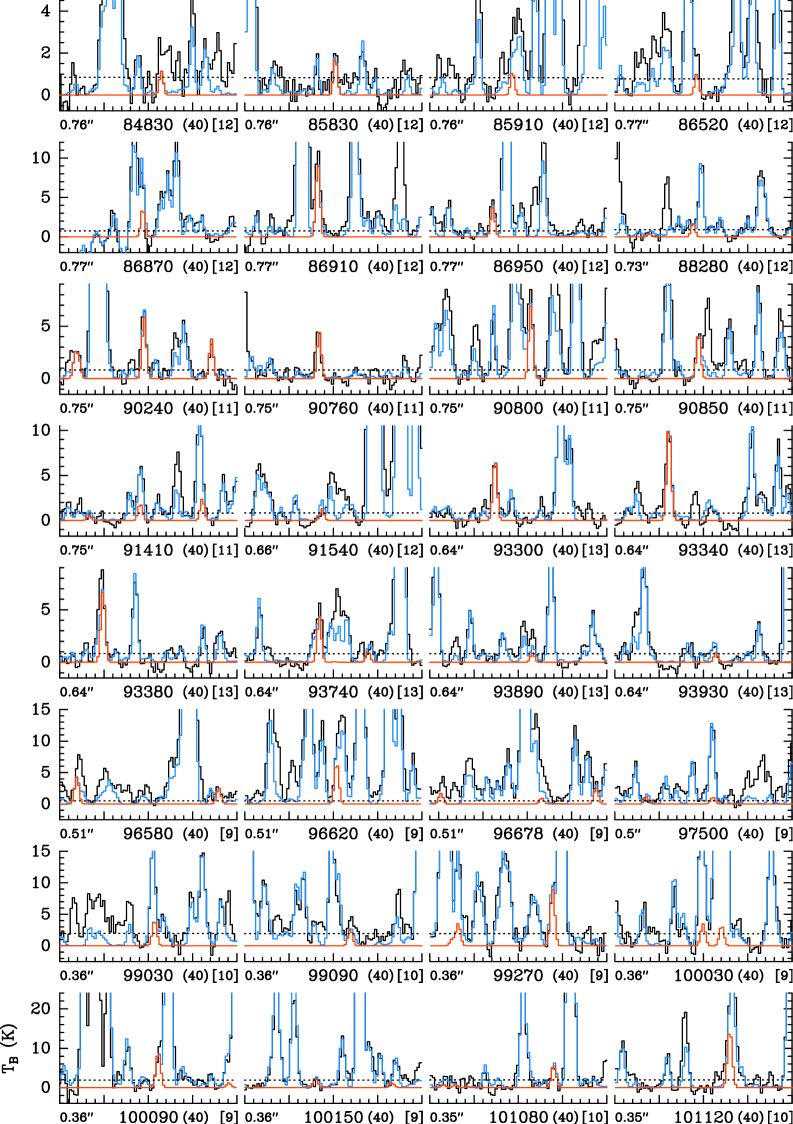
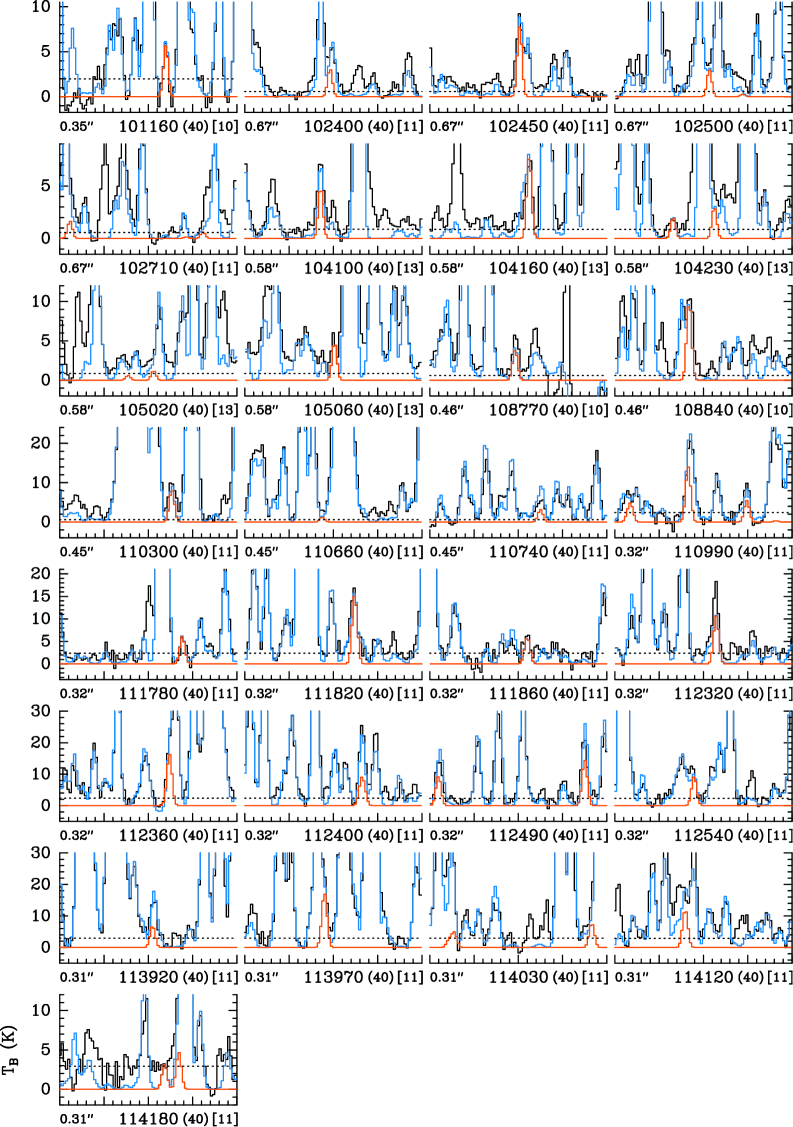
To search for dimethylamine toward each position using the spectroscopic predictions obtained in Sect. 4, we computed synthetic LTE spectra assuming the same emission size and rotational temperature as those derived for dimethyl ether. We did not find any evidence for dimethylamine in either source. The upper limit to the column density of DMA was evaluated for each source by varying the column density by hand and comparing the synthetic and observed spectra by eye, using the 3 level (dashed lines in Figs. 9 and 10) as a guide, but also accounting for the blends with other species and the uncertainties on the baseline level. The synthetic spectra used to estimate the upper limit to its column density are shown in Figs. 9 and 10 for Sgr B2(N1S) and Sgr B2(N2b), respectively. These upper limits are reported in Tables 8 and 9, respectively.
8 Astrochemical modeling
To explore the possible chemistry of DMA and its likely yield in the interstellar medium, we adapt the astrochemical models presented by Garrod et al. (2022) to include DMA and a selection of related species. The physical treatment and chemical framework of the models correspond to the final model of Garrod et al. (2022), which uses a three-phase (gas, grain/ice-surface and bulk-ice) treatment of the coupled gas and grain chemistry of hot cores. The grain chemistry framework (explained in detail by Jin & Garrod, 2020) includes nondiffusive mechanisms for surface and bulk-ice reactions, which allows the production of complex organic molecules to occur on the grains even at very low temperatures. The physical modeling uses a two-stage treatment, in which relatively diffuse gas ( cm-3) first collapses to high density ( cm-3); as the visual extinction increases from 3 to 500 mag., the dust cools from 14.6 K to 8 K, while the gas temperature is held steady at 10 K during the collapse as in past models. Much of the grain-surface ice builds up toward the end of the collapse stage. During the subsequent warm-up stage, this material is heated such that the gas and dust temperatures rise monotonically to a maximum of 400 K. Following various past models that have used the same physical treatment, the warm-up occurs over one of three characteristic timescales, labeled fast ( yr), medium ( yr), and slow ( yr), where the timescale technically corresponds to the time required to reach a representative hot-core temperature of 200 K. Desorption of the ice mantles into the gas phase takes place mainly in the 100–200 K temperature range.
The chemical network is based on that of Belloche et al. (2022), which included propanol chemistry and which is itself derived from the Garrod et al. (2022) network. The new chemistry for DMA is based around production on grain surfaces or in the bulk ices, through the radical recombination reaction
| (1) |
and the two-stage reaction process,
| (2a) | |||
| (2b) | |||
The intermediate radical CH3NH may be produced by the hydrogenation of other species of the form CHNH, or through the addition of other radicals leading to such species. Crucially, the CH3NH radical may additionally be formed through the photodissociation of methylamine, while CH2 and CH3 can be formed via repetitive H-addition to atomic carbon, or by the photodissociation of methane or other species containing a methyl group.
| Reaction | (K) | Rate (s-1) | ||||||
|---|---|---|---|---|---|---|---|---|
| \ceCH3 | + | \ceCH3NH | \ceCH3NHCH3 | 0 | – | |||
| \ceCH2 | + | \ceCH3NH | \ceCH2NHCH3 | 0 | – | |||
| \ceH | + | \ceCH2NHCH3 | \ceCH3NHCH3 | 0 | – | |||
| \ceCH2OH | + | \ceCH2NHCH3 | \ceCH3NHCH3 | + | \ceH2CO | 0 | – | |
| \ceCH3O | + | \ceCH2NHCH3 | \ceCH3NHCH3 | + | \ceH2CO | 0 | – | |
| \ceCOOH | + | \ceCH2NHCH3 | \ceCH3NHCH3 | + | \ceCO2 | 0 | – | |
| \ceHCO | + | \ceCH2NHCH3 | \ceCH3NHCH3 | + | \ceCO | 0 | – | |
| \ceH | + | \ceCH3NHCH3 | \ceCH2NHCH3 | + | \ceH2 | 1600 a | – | |
| \ceCH3O | + | \ceCH3NHCH3 | \ceCH2NHCH3 | + | \ceCH3OH | 2020 b | – | |
| \ceCN | + | \ceCH3NHCH3 | \ceCH2NHCH3 | + | \ceHCN | 100 | – | |
| \ceNH2 | + | \ceCH3NHCH3 | \ceCH2NHCH3 | + | \ceNH3 | 2710 b | – | |
| \ceOH | + | \ceCH3NHCH3 | \ceCH2NHCH3 | + | \ceH2O | 1000 | – | |
| \ceCH3NHCH3 | + | [CR] | \ceCH3NH | + | \ceCH3 | – | 10,000 | |
| \ceCH3NHCH3 | + | [CR] | \ceCH2NHCH3 | + | \ceH | – | 500 | |
| \ceCH3NHCH2 | + | [CR] | \ceCH2NH | + | \ceCH3 | – | 10,000 | |
| \ceCH3NHCH2 | + | [CR] | \ceCH3NH | + | \ceCH2 | – | 10,000 | |
| \ceCH3NHCH3 | + | [ext] | \ceCH3NH | + | \ceCH3 | – | ||
| \ceCH3NHCH3 | + | [ext] | \ceCH2NHCH3 | + | \ceH | – | ||
| \ceCH3NHCH2 | + | [ext] | \ceCH2NH | + | \ceCH3 | – | ||
| \ceCH3NHCH2 | + | [ext] | \ceCH3NH | + | \ceCH2 | – | ||
| Pre-existing in the network: | ||||||||
| \ceH | + | \ceCH2NH | \ceCH3NH | 605 c | – | |||
| \ceH | + | \ceCH2NH | \ceCH2NH2 | 605 c | – | |||
| \ceCH4 | + | [CR] | \ceCH3 | + | \ceH | – | 1170 | |
| \ceCH4 | + | [CR] | \ceCH2 | + | \ceH2 | – | 1170 | |
| \ceCH3NH2 | + | [CR] | \ceCH3NH | + | \ceH | – | 1000 | |
| \ceCH3NH2 | + | [CR] | \ceCH2NH2 | + | \ceH | – | 500 | |
| \ceCH3NH2 | + | [CR] | \ceCH3 | + | \ceNH2 | – | 10,000 | |
| \ceCH4 | + | [ext] | \ceCH3 | + | \ceH | – | ||
| \ceCH4 | + | [ext] | \ceCH2 | + | \ceH2 | – | ||
| \ceCH3NH2 | + | [ext] | \ceCH3NH | + | \ceH | – | ||
| \ceCH3NH2 | + | [ext] | \ceCH2NH2 | + | \ceH | – | ||
| \ceCH3NH2 | + | [ext] | \ceCH3 | + | \ceNH2 | – | ||
Each of the reaction sequences (1) and (2) may occur either on the grain/ice surfaces or within the bulk ice. On surfaces, reactions may be driven by diffusion or by nondiffusive encounters resulting from prior reactions (labeled “three-body” reactions, 3-B) or photodissociation events (labeled “photodissociation-induced” reactions, PDI). At the low temperatures (i.e. 20 K) achieved during the collapse stage and early in the warm-up stage, surface reactions such as (1) and (2a) occur mainly through nondiffusive processes, due to the immobility of the reactants, while reaction (2b) is driven by the diffusion of mobile atomic H. At higher temperatures, surface diffusion of radicals also contributes somewhat to the production of large molecules. Within the bulk ice, diffusive motions are restricted to H and H2 only, which can occur through quantum tunneling as well as thermal diffusion. Thus, in the bulk ice, reactions between radicals (i.e. not H) may only occur through the nondiffusive 3-B and PDI mechanisms.
Based on the above chemistry, two new neutral species are added to the network: DMA and its radical precursor \ceCH2NHCH3. Following past grain-surface chemistry treatments (e.g. Garrod, 2013), both of these species may also be destroyed by reactions with radicals; DMA may undergo H-abstraction by e.g. the OH radical, forming water and \ceCH2NHCH3, while \ceCH2NHCH3 may abstract H from a selection of other radical species such as HCO, to form DMA and the stable molecule CO. DMA and \ceCH2NHCH3 can also be photodissociated on the grains or in the gas phase.
Grain-surface/ice reactions included in the network that are relevant to DMA are listed in Table 10. Subject to the caveats outlined above, each may occur as the result of diffusive meetings, the 3-B and PDI processes, or by the Eley-Rideal (E-R) mechanism (surface only). Adsorption onto the grains, as well as thermal and nonthermal desorption mechanisms (photo- and chemical desorption) are treated as per past models. The surface binding energies of DMA and \ceCH2NHCH3 used in the model are 5856 K and 5731 K, respectively, based on extrapolation from other species/functional groups in the network, as per previous models (Garrod et al., 2008; Belloche et al., 2017; Belloche et al., 2019). Molecular desorption driven by the direct impingement of cosmic rays on dust grains is not included in the present model, although the photodesorption mechanism includes a contribution from the cosmic ray-induced photon field.
The main destruction mechanisms for most complex organic molecules in the network are gas-phase ion-molecule reactions that take place following the desorption of the ice mantles into the gas. These are dominated by proton transfer from ions H, HCO+ and H3O+; the resulting protonated molecule (\ceCH3NH2CH3+, in the case of DMA) may then recombine with electrons, fragmenting the molecule. A description of the procedures for the construction of this basic gas-phase chemistry may be found in Garrod et al. (2008) and Garrod (2013).
Following Taquet et al. (2016), Garrod et al. (2022) added to their reaction network a number of gas-phase proton-transfer reactions between ammonia and various protonated complex organics, producing NH while returning the original complex molecule unscathed. The inclusion of this mechanism was found to provide a competitive alternative to the destructive electronic recombination of protonated complex organics, thus enhancing their post-desorption gas-phase lifetimes. However, the proton affinity of DMA is greater than that of ammonia (929.5 versus 853.6 kJ mol-1 Hunter & Lias, 1998), meaning that protonated DMA cannot transfer its proton in this way; such a mechanism is therefore not included in the present chemical network. The possible importance of the converse process of proton transfer from NH to certain complex organics is explored by Garrod & Herbst (2023) (submitted).
The new chemical network already incorporates the chemistry of a large selection of simple and complex molecules, including methylamine, methanol, dimethyl ether and ethylamine; hot-core chemical model results for each of these are presented with those of DMA in order to compare with observations toward Sgr B2(N).
In order to test the effects on molecular ratios of the elevated cosmic ray ionization rates expected toward the Galactic center (Goto et al., 2014), the hot-core models are run using a selection of logarithmically spaced rates ranging from to , where s-1.
For comparison with the gas-phase abundances observed toward G+0.6930.027, the most appropriate modeling approach would include an explicit treatment of the passage of a shock (e.g., Requena-Torres et al., 2006; Zeng et al., 2018; Rivilla et al., 2022a), including the grain-heating and sputtering processes, as well as post-desorption gas-phase chemistry. Here, to allow a simpler comparison between the modeled abundances in the ices and the post-shock gas-phase abundances, we run collapse models similar to the first stage of the hot-core models, that would correspond to the pre-shock evolution of the dust and gas in G+0.6930.027. The shock models of Rivilla et al. (2022a) suggest cosmic-ray ionization rates in this molecular cloud ranging from 1001000 ; we run collapse models with using the two extremes of this range. To better represent the pre-shock gas density of G+0.6930.027, the final gas density at the end of the collapse is reduced to cm-3, as inferred by Zeng et al. (2020).
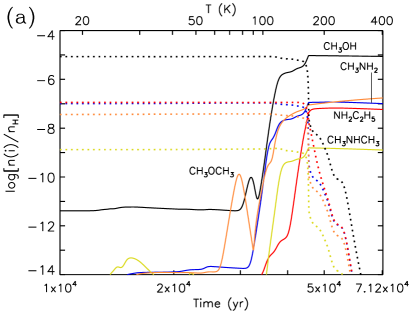
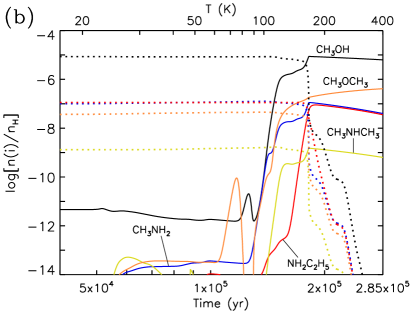
8.1 Chemical model results
Figure 11 shows fractional abundances for DMA and other molecules during the warm-up stage, using the three typical warm-up timescales, under conditions of . Each of the molecules shown inherits a substantial solid-phase abundance (indicated by dotted lines) from the cold collapse stage. The material remains on the grains until the ice begins to desorb strongly into the gas phase at temperatures greater than 100 K. Much of this release is driven by the thermal desorption of water, which comprises much of the ice abundance; it begins to be lost substantially at temperatures around 114 K, as noted by Garrod et al. (2022), and this continues until most water has been released by around 164 K. This desorption model is supported by observational results from Busch et al. (2022). They found in a study of Sgr B2(N1) that COMs formed on grains desorb thermally from the grain surface at 100 K, concomintantly with water. Because the model treats the ice as a distinct surface layer with a separate bulk ice beneath, the loss of water helps to release other species within the same time/temperature range. As a result, DMA, along with methanol and methylamine, reach their peak gas-phase abundances at around the temperature when water desorption reaches its maximum. These peak abundances and corresponding temperatures are shown in Table 11. The behavior of other molecules not shown in the figures are well represented by the extensive results presented by Belloche et al. (2022) and Garrod et al. (2022).
Post-desorption gas-phase abundances are seen to fall more strongly as a function of temperature in the longer warm-up timescales runs, due to the longer period spent in the gas phase by those molecules. In all cases but for dimethyl ether, the peak gas-phase values of the molecules shown are seen to track fairly closely with the peak ice-mantle abundances of the same species. Thus, the relative abundances in the gas are more or less preserved from the much earlier and colder period when those molecules were formed on the grains. Dimethyl ether, as noted in various past modeling papers, has a strong gas-phase production mechanism based on the reaction of methanol with protonated methanol; its abundance therefore rises in the gas phase following desorption of the existing dimethyl ether in the ices.
Production of DMA in the models occurs during two main periods; the first occurs during the cold collapse stage and is thus a shared feature of all of the subsequent warm-up models. Reaction (1) occurs at very early times in the model, driven by a combination of PDI and 3-B processes within the bulk ice, in the proportion 2 : 1, respectively. The initial visual extinction of around 3 mag. is low enough to allow external UV photons to dissociate methane (CH4) and methylamine, producing CH3 and CH3NH and allowing one or other radical to be produced, on occasion, in the presence of the other, leading to immediate nondiffusive reaction. Since this process does not involve diffusion, most of the reactions leading to DMA production occur in the thicker bulk-ice layer, rather than on the surface. At this early stage, the ice is up to a few tens of monolayers in thickness in total. The 3-B reaction mechanism in the bulk ice occurs around the same time, when H atoms released in the bulk ice by other photodissociation processes diffuse to find the stable molecule methanimine, CH2NH, with which it reacts to form CH3NH; the latter radical may then react with any contiguous CH3 in the bulk ice.
Production of the related species ethylamine (C2H5NH2) occurs in a similar way, through the reaction of radicals \ceCH3 and \ceCH2NH2; however, \ceCH2NH2 is formed mainly through H-atom abstraction from \ceCH3NH2 by atomic H in the bulk ice. This abstraction reaction is substantially faster than the comparable photodissociation process by which it might form, because of the availability of diffusive atomic H in the bulk ice caused by the photodissociation of numerous different ice species, including water. Abstraction from the methyl group on methylamine to form \ceCH2NH2 is expected to be strongly dominant over the alternative, \ceCH3NH, at very low temperatures (see Kerkeni & Clary, 2007, who calculated branching down to 200 K). The availability of this effective mechanism for producing \ceCH2NH2 therefore leads to much greater production of ethylamine versus DMA in the model.
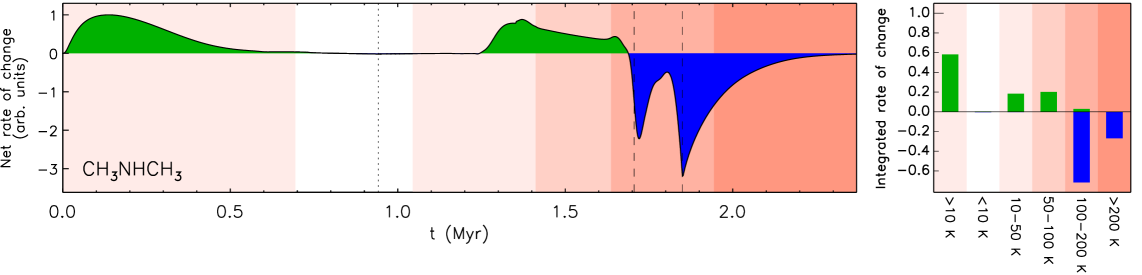
The second stage of DMA production occurs during the warm-up stage, and is most prevalent in the slow warm-up model, due to the longer period available for ice photochemistry. In this case, the DMA formation occurs through cosmic ray-induced photodissociation of methylamine and methane. The left panel of Fig. 12 shows the total rate of production of DMA in all phases (surface, ice-mantle, and gas phase) as a function of time through the full collapse stage followed by the slow warm-up stage. The first and second stages of DMA production are seen clearly in green. The second production stage becomes significant beginning around 30 K, and continues to produce DMA up until the point of desorption, which begins to occur strongly between the two vertical dashed lines that indicate the beginning and end of water desorption. The onset of DMA production around 30 K is related to the falling abundance of atomic H in the ice as temperatures increase, reducing its ability to recombine with simple radicals before they can form more complex species. The right panel of Fig. 12 shows the production and destruction of DMA in several key temperature regimes. The early production mechanism for DMA contributes around 60% of total production. The blue sections of the left and right panels indicate where DMA is destroyed in the gas phase, mainly through proton-transfer from H3O+, followed by dissociative electronic recombination.
Table 11 also shows peak gas-phase abundances and associated temperatures for three additional sets of model-runs, using , and . Among the nitrogen-bearing species, the peak abundances fall somewhat with increased cosmic ray ionization rate, with the effect more pronounced with longer warm-up timescales. The effect is caused by more rapid gas-phase destruction via ion-molecule reactions. The two highest values, when combined with the longest warm-up timescale, produce a more extreme degree of destruction for all the molecules. Outside of those two cases, the oxygen-bearing species methanol and dimethyl ether are more robust to changes in , generally varying by less than a factor 2 between the various models. Although the peak values are less affected, however, both increased warm-up timescale and value lead to more rapid destruction in the gas phase for all species following attainment of the post-desorption peak.
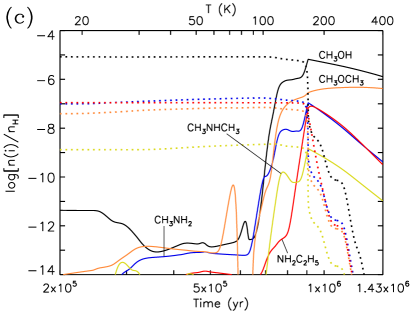
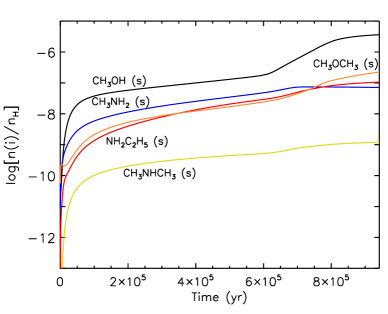
Fig. 13 shows results from the low-density collapse model with = 100 , which is intended to represent the pre-shock behavior of G+0.693; time-dependent solid-phase abundances are shown for the same five species as in Fig. 11. During the collapse, the increases in gas density and decreases in dust temperature become more substantial after a time of around 0.5 Myr, which manifests as a steeper rise in methanol abundance in particular. DMA abundance is seen never to exceed that of methylamine, while ethylamine slightly exceeds the latter toward the end of the model run.
The final solid-phase abundances of these molecules are shown in Table 12, where the results for the = 1000 model are also shown. The abundance of methanol is notably affected in the highest model, while the abundance of dimethyl ether is lower by a factor 4. The abundances of the N-bearing species shown are each lower by a factor 2 in the = 1000 model.
| Fast | Medium | Slow | ||||||||
|---|---|---|---|---|---|---|---|---|---|---|
| Cosmic ray ionization rate | Molecule | (K) | (K) | (K) | ||||||
| CH3OH | 9.4(-6) | 168 | 8.7(-6) | 167 | 6.6(-6) | 166 | ||||
| CH3OCH3 | 1.7(-7) | 400 | 4.1(-7) | 398 | 4.7(-7) | 292 | ||||
| CH3NH2 | 1.2(-7) | 218 | 1.1(-7) | 167 | 1.1(-7) | 166 | ||||
| CH3NHCH3 | 1.6(-9) | 167 | 1.5(-9) | 167 | 1.4(-9) | 166 | ||||
| NH2C2H5 | 6.7(-8) | 227 | 9.0(-8) | 180 | 8.0(-8) | 172 | ||||
| CH3OH | 1.4(-5) | 166 | 1.1(-5) | 165 | 5.8(-6) | 164 | ||||
| CH3OCH3 | 8.0(-7) | 400 | 1.2(-6) | 334 | 5.0(-7) | 187 | ||||
| CH3NH2 | 8.2(-8) | 166 | 7.4(-8) | 165 | 4.8(-8) | 164 | ||||
| CH3NHCH3 | 1.5(-9) | 166 | 1.3(-9) | 165 | 8.2(-10) | 164 | ||||
| NH2C2H5 | 4.0(-8) | 184 | 4.9(-8) | 174 | 2.6(-8) | 167 | ||||
| CH3OH | 1.5(-5) | 165 | 7.9(-6) | 163 | 1.1(-7) | 118 | ||||
| CH3OCH3 | 1.8(-6) | 335 | 9.6(-7) | 189 | 3.6(-9) | 118 | ||||
| CH3NH2 | 5.5(-8) | 165 | 3.3(-8) | 163 | 5.9(-10) | 117 | ||||
| CH3NHCH3 | 1.1(-9) | 165 | 6.4(-10) | 163 | 1.6(-11) | 118 | ||||
| NH2C2H5 | 2.7(-8) | 175 | 1.9(-8) | 169 | 1.3(-10) | 155 | ||||
| CH3OH | 9.7(-6) | 168 | 2.5(-6) | 163 | 2.5(-9) | 112 | ||||
| CH3OCH3 | 8.7(-7) | 205 | 1.9(-7) | 165 | 3.2(-10) | 112 | ||||
| CH3NH2 | 3.4(-8) | 168 | 1.1(-8) | 163 | 9.1(-11) | 112 | ||||
| CH3NHCH3 | 6.0(-10) | 168 | 2.0(-10) | 163 | 1.7(-12) | 113 | ||||
| NH2C2H5 | 1.8(-8) | 171 | 5.3(-9) | 163 | 5.4(-12) | 149 | ||||
| Cosmic ray ionization rate | Molecule (ice mantle) | ||
|---|---|---|---|
| CH3OH | 3.5(-6) | ||
| CH3OCH3 | 2.2(-7) | ||
| CH3NH2 | 7.1(-8) | ||
| CH3NHCH3 | 1.2(-9) | ||
| NH2C2H5 | 1.1(-7) | ||
| CH3OH | 2.6(-7) | ||
| CH3OCH3 | 6.0(-8) | ||
| CH3NH2 | 3.8(-8) | ||
| CH3NHCH3 | 6.8(-10) | ||
| NH2C2H5 | 5.7(-8) |
| Cosmic ray ionization rate | Molecular ratio (gas phase) | Fast | Medium | Slow | |
|---|---|---|---|---|---|
| CH3OH : CH3OCH3 | 55 | 21 | 14 | ||
| CH3NH2 : CH3NHCH3 | 75 | 73 | 79 | ||
| CH3OH : CH3NHCH3 | 6030 | 5740 | 4590 | ||
| CH3OH : CH3OCH3 | 18 | 9 | 12 | ||
| CH3NH2 : CH3NHCH3 | 55 | 57 | 59 | ||
| CH3OH : CH3NHCH3 | 9350 | 8850 | 7090 | ||
| CH3OH : CH3OCH3 | 8 | 8 | 31 | ||
| CH3NH2 : CH3NHCH3 | 50 | 52 | 37 | ||
| CH3OH : CH3NHCH3 | 13100 | 12400 | 6680 | ||
| CH3OH : CH3OCH3 | 11 | 13 | 8 | ||
| CH3NH2 : CH3NHCH3 | 57 | 55 | 54 | ||
| CH3OH : CH3NHCH3 | 16200 | 12700 | 1410 |
| Cosmic ray ionization rate | Molecular ratio (ice mantle) | Value | |
|---|---|---|---|
| CH3OH : CH3OCH3 | 16 | ||
| CH3NH2 : CH3NHCH3 | 60 | ||
| CH3OH : CH3NHCH3 | 2900 | ||
| CH3OH : CH3OCH3 | 4 | ||
| CH3NH2 : CH3NHCH3 | 56 | ||
| CH3OH : CH3NHCH3 | 379 |
9 Discussion of the astrochemical results
9.1 G+0.693
The column density upper limit derived for DMA is 7.61013 cm-2, slightly higher than the column density derived for \ceC2H3NH2 and \ceC2H5NH2, which are (4.50.6)1013 cm-2 and (2.50.7)1013 cm-2, respectively (Zeng et al. 2021). The abundance ratio compared to methylamine, whose abundance is 2.210-8 (Zeng et al. 2018), is \ceCH3NH2/DMA 39. We can compare this ratio with other H and CH3 pairs already detected towards G+0.693, such as methanol (\ceCH3OH) and dimethyl ether (\ceCH3OCH3). The \ceCH3OH abundance is 1.110-7 (Jiménez-Serra et al. 2022), and that of \ceCH3OCH3 is 8.110-10 (Rivilla, private communication), which yields a ratio \ceCH3OH/\ceCH3OCH3 135. This value is consistent with the lower limit found for the \ceCH3NH2/DMA ratio (39), see also Table 5. This might suggest, if the H/CH3 ratio also holds for amines, that the detection of DMA would still need a significant improvement of the sensitivity of the current observations.
9.2 Sgr B2(N)
Table 8 shows that dimethyl ether is 14 times less abundant than methanol in Sgr B2(N1S) and dimethylamine is at least 14 times less abundant than methylamine toward this position. This limit is not constraining enough to infer whether or not the formation routes that possibly relate methanol to dimethyl ether and methylamine to dimethylamine operate differently. Toward Sgr B2(N2b), dimethyl ether is 26 times less abundant than methanol (Table 9). Because the abundance ratio of methanol to methylamine is much higher in Sgr B2(N2b) than in Sgr B2(N1S) (300 versus 15), the upper limit obtained for dimethylamine is much less constraining toward Sgr B2(N2b): we can only say that dimethylamine is at least 4.5 times less abundant than methylamine toward this position.
9.3 Comparison of chemical models with observations
As with the observational data themselves, molecular abundance ratios may be the most useful means of comparison between models and observations. Table 13 shows chemical model ratios between peak gas-phase abundance values for CH3OH : CH3OCH3, CH3NH2 : CH3NHCH3 and CH3OH : CH3NHCH3. The first of these, comparing with the ratios obtained for Sgr B2(N1S) and Sgr B2(N2b) of 14 and 26, respectively, provides an acceptable match with the observed values within the range of model outcomes, which range from 8 to 55. The modeled ratio CH3NH2 : CH3NHCH3, however, is rather more extreme, ranging from 37 to 75, with most values exceeding 50. Lower limits on this ratio for Sgr B2(N1S) and Sgr B2(N2b) are 14 and 4.5; thus the models predict abundances for DMA that are substantially below its observational upper limits in Sgr B2(N). The modeled ratio of methanol to DMA shows a similar picture, although the ratio for the high-/slow warm-up model of 1410 is close to the observed lower limit for Sgr B2(N2b) of 1360. Either way, the chemical models are consistent with the non-detection of DMA toward Sgr B2(N).
Table 14 shows molecular ratios based on the ice-mantle abundances achieved for each molecule at the end of the low-density, high- collapse models. We compare these ratios with those obtained from the gas-phase abundances observed toward G+0.6930.027, on the assumption that the gas-phase abundances may retain the underlying ratios of the originating ice composition.
In comparison with the observed CH3OH : CH3OCH3 ratio of 135, the model ratios are too low, producing values of 16 and 4 for the = 100 and 1000 models, respectively. At cosmic-ray ionization rates that are this high, the gas-phase survival of CO is substantially affected by ion-molecule reactions involving H and He+, such that the amount of CO available to produce grain-surface methanol, via hydrogenation by atomic H, is diminished. Furthermore, under these high-, low-density conditions, in which photodissociation of ice-mantle species is quite rapid in comparison to the rate at which gas-phase CO and other species are deposited onto the grains, bulk-ice photochemistry involving CH3OH dominates dimethyl ether production on the grains, increasing its ratio relative to methanol.
Meanwhile the CH3NH2 : CH3NHCH3 ratios achieved in the models still slightly exceed the observational lower limit of 39, ranging from 56 to 60. These results are thus consistent with the non-detection of DMA toward G+0.6930.027, although they also suggest that a detection may be rather easier to achieve toward this source than toward Sgr B2(N).
We note, however, that the ice-mantle abundance ratio for CH3NH2 : C2H5NH2 is close to unity in both the hot-core models and the lower-density, high- models. This compares unfavorably with the observational ratio of 120 toward G+0.6930.027, suggesting that the models substantially over-produce ethylamine. Furthermore, toward Sgr B2(N1S), this ratio has been found to be 6 (Margulès et al., 2022). Due to the similarities in the chemistry between ethylamine and DMA, this could indicate that DMA is also over-produced, rendering a possible future detection of this molecule even more challenging.
The rates used to simulate the production of DMA and related species are only poorly constrained, largely by comparison between photodissociation rates of similar molecules (under gas-phase conditions). There may therefore be a substantial amount of possible variation in model outcomes. The strongest mechanism for DMA production in the hot-core models also occurs early in the physical evolution, when visual extinction is low. It remains to be seen whether such a low initial visual extinction is appropriate to all regions of a hot core, thus DMA abundances could again be lower than the models predict.
There remains also the possibility that DMA could be formed in the gas phase, possibly through a similar mechanism to that which is so effective for the production of protonated dimethyl ether, \ceCH3OH2+ + \ceCH3OH \ceCH3OHCH3+ + \ceH2O, followed by dissociative recombination. However, the authors are unaware of any experimental studies (Anicich, 2003) of such a reaction between any combination of \ceCH3OH2+, \ceCH3OH, \ceCH3NH3+ or \ceCH3NH2 that would lead to protonated DMA. Furthermore, the gas-phase reaction producing dimethyl ether is especially effective due to the exceedingly high gas-phase abundances achieved by both methanol and protonated methanol (relative to other protonated complex organics), due to the presence of methanol in great abundance in the ice mantles. Even with a large reaction rate coefficient, the absolute reaction rate for an alternative process involving methylamine might not be great enough to compete with production of DMA on grains, limited as that may be.
While the DMA abundance produced by the low-density, high- models is consistent with the non-detection, the behavior of dimethyl ether with respect to methanol is not consistent with their observed ratio toward G+0.6930.027. However, we emphasize that a fair comparison between models and observations should include the substantial influence of the shock chemistry and shock-induced grain-mantle release, which the present models do not do.
10 Conclusion and outlook
We have investigated the rotation-tunneling spectrum of DMA extensively in the millimeter and submillimeter region. This yielded very accurate spectroscopic parameters which are well-suited for almost all searches for this molecule in space, except possibly in cases in which the methyl internal rotation needs to be taken into account.
Dimethylamine was not detected toward G+0.6930.027. The lower limit to the \ceCH3NH2/DMA ratio of 39 is constraining. But if the \ceCH3NH2/DMA ratio is the same as the \ceCH3OH/\ceCH3OCH3 ratio of 135 an unambiguous identification of DMA in this source will require a considerable improvement in sensitivity.
We report nondetections of dimethylamine with ALMA toward Sgr B2(N1S) and Sgr B2(N2b). The nondetections imply that dimethylamine is at least 14 and 4.5 times less abundant than methylamine toward these sources, respectively, while dimethyl ether is 14 and 26 times less abundant than methanol, respectively.
Dimethylamine was included in astrochemical kinetic modeling calculations, assuming grain-surface and ice-mantle formation mechanisms. The calculated \ceCH3NH2/DMA ratios are compatible with our observational non-detections. DMA in the models is formed mainly through an early mechanism that relies on photoprocessing of the young dust-grain ices by external UV under low-extinction conditions. Further processing of the ices by cosmic ray-induced UV photons allows DMA to be formed at higher temperatures. The models overproduce \ceC2H5NH2 with respect to \ceCH3NH2, suggesting that the abundance of DMA in the interstellar medium could be substantially lower than the predicted values if both DMA and ethylamine are similarly overproduced by the models. The calculated ratios of peak molecular abundances remain fairly stable for the range of cosmic-ray ionization rates tested here.
Acknowledgements
We are grateful to H. V. L. Nguyen for communicating results of the Fourier transform microwave investigation prior to publication. We also thank C. P. Endres for providing SPFIT files of the ground state rotational spectrum of dimethyl ether. We acknowledge support by the Deutsche Forschungsgemeinschaft via the collaborative research center SFB 956 (project ID 184018867) project B3 as well as the Gerätezentrum SCHL 341/15-1 (“Cologne Center for Terahertz Spectroscopy”). RTG thanks the Astronomy & Astrophysics program of the National Science Foundation (grant No. AST 19-06489) for funding the chemical modeling presented here. V.M.R. has received support from the project RYC2020-029387-I funded by MCIN/AEI /10.13039/501100011033. I.J-.S and J.M.-P. acknowledge funding from grant No. PID2019-105552RB-C41 awarded by the Spanish Ministry of Science and Innovation/State Agency of Research MCIN/AEI/10.13039/501100011033. Our research benefited from NASA’s Astrophysics Data System (ADS). This paper makes use of the following ALMA data: ADS/JAO.ALMA#2016.1.00074.S. ALMA is a partnership of ESO (representing its member states), NSF (USA), and NINS (Japan), together with NRC (Canada), NSC and ASIAA (Taiwan), and KASI (Republic of Korea), in cooperation with the Republic of Chile. The Joint ALMA Observatory is operated by ESO, AUI/NRAO, and NAOJ. The interferometric data are available in the ALMA archive at https://almascience.eso.org/aq/.
Data Availability
The spectroscopic line lists and associated files are available as supplementary material through the journal and in the data section of the CDMS333https://cdms.astro.uni-koeln.de/classic/predictions/daten/DMA/. The underlying original spectral recordings will be shared on reasonable request to the corresponding author. The radio astronomical data on Sgr B2(N) are available through the ALMA archive444https://almascience.eso.org/aq/.
References
- Allen & Robinson (1977) Allen M., Robinson G. W., 1977, ApJ, 212, 396
- Anicich (2003) Anicich V. G., 2003, JPL publication, 03-19
- Becke (1993) Becke A. D., 1993, J. Chem. Phys., 98, 5648
- Belloche et al. (2013) Belloche A., Müller H. S. P., Menten K. M., Schilke P., Comito C., 2013, A&A, 559, A47
- Belloche et al. (2016) Belloche A., Müller H. S. P., Garrod R. T., Menten K. M., 2016, A&A, 587, A91
- Belloche et al. (2017) Belloche A., et al., 2017, A&A, 601, A49
- Belloche et al. (2019) Belloche A., Garrod R. T., Müller H. S. P., Menten K. M., Medvedev I., Thomas J., Kisiel Z., 2019, A&A, 628, A10
- Belloche et al. (2022) Belloche A., Garrod R. T., Zingsheim O., Müller H. S. P., Menten K. M., 2022, A&A, 662, A110
- Bizzocchi et al. (2020) Bizzocchi L., et al., 2020, A&A, 640, A98
- Bøgelund et al. (2019) Bøgelund E. G., McGuire B. A., Hogerheijde M. R., van Dishoeck E. F., Ligterink N. F. W., 2019, A&A, 624, A82
- Bonfand et al. (2019) Bonfand M., Belloche A., Garrod R. T., Menten K. M., Willis E., Stéphan G., Müller H. S. P., 2019, A&A, 628, A27
- Busch et al. (2022) Busch L. A., Belloche A., Garrod R. T., Müller H. S. P., Menten K. M., 2022, A&A, 665, A96
- Christen & Müller (2003) Christen D., Müller H. S. P., 2003, Phys. Chem. Chem. Phys., 5, 3600
- Coutens et al. (2019) Coutens A., Zakharenko O., Lewen F., Jørgensen J. K., Schlemmer S., Müller H. S. P., 2019, A&A, 623, A93
- Drouin et al. (2006) Drouin B. J., Pearson J. C., Walters A., Lattanzi V., 2006, J. Mol. Spectrosc., 240, 227
- Dunning, Jr. (1989) Dunning, Jr. T. H., 1989, J. Chem. Phys., 90, 1007
- Durig et al. (1977) Durig J. R., Groner P., Griffin M. G., 1977, J. Chem. Phys., 66, 3061
- Endres et al. (2009) Endres C. P., Drouin B. J., Pearson J. C., Müller H. S. P., Lewen F., Schlemmer S., Giesen T. F., 2009, A&A, 504, 635
- Endres et al. (2016) Endres C. P., Schlemmer S., Schilke P., Stutzki J., Müller H. S. P., 2016, J. Mol. Spectrosc., 327, 95
- Fourikis et al. (1974) Fourikis N., Takagi K., Morimoto M., 1974, ApJ, 191, L139
- Frisch et al. (2013) Frisch M. J., et al., 2013, Technical report, Gaussian 09, Revision E.01. Gaussian, Inc., Wallingford CT
- Gamer & Wolff (1973) Gamer G., Wolff H., 1973, Spectrochim. Acta A, 29, 129
- Garrod (2013) Garrod R. T., 2013, ApJ, 765, 60
- Garrod & Herbst (2023) Garrod R. T., Herbst E., 2023, Faraday Discussions, p. in press
- Garrod et al. (2008) Garrod R. T., Widicus Weaver S. L., Herbst E., 2008, ApJ, 682, 283
- Garrod et al. (2022) Garrod R. T., Jin M., Matis K. A., Jones D., Willis E. R., Herbst E., 2022, ApJS, 259, 1
- Goto et al. (2014) Goto M., Geballe T. R., Indriolo N., Yusef-Zadeh F., Usuda T., Henning T., Oka T., 2014, ApJ, 786, 96
- Gyawali et al. (2023) Gyawali P., et al., 2023, A&A, submitted
- Harris et al. (1966) Harris D. O., Harrington H. W., Luntz A. C., Gwinn W. D., 1966, J. Chem. Phys., 44, 3467
- Hunter & Lias (1998) Hunter E. P., Lias S. G., 1998, J. Phys. Chem. Ref. Data, 27, 413
- Jiménez-Serra et al. (2022) Jiménez-Serra I., et al., 2022, A&A, 663, A181
- Jin & Garrod (2020) Jin M., Garrod R. T., 2020, ApJS, 249, 26
- Johansson et al. (1984) Johansson L. E. B., et al., 1984, A&A, 130, 227
- Kaifu et al. (1974) Kaifu N., Morimoto M., Nagane K., Akabane K., Iguchi T., Takagi K., 1974, ApJ, 191, L135
- Kamiński et al. (2017) Kamiński T., Menten K. M., Tylenda R., Karakas A., Belloche A., Patel N. A., 2017, A&A, 607, A78
- Kamiński et al. (2020) Kamiński T., Menten K. M., Tylenda R., Wong K. T., Belloche A., Mehner A., Schmidt M. R., Patel N. A., 2020, A&A, 644, A59
- Kerkeni & Clary (2007) Kerkeni B., Clary D. C., 2007, Chem. Phys. Lett., 438, 1
- Koziol et al. (2021) Koziol K. J., Stahl W., Nguyen H. V. L., 2021, in International Symposium on Molecular Spectroscopy, Contribution WH10. , doi:10.15278/isms.2021.WH10
- Lee et al. (1988) Lee C., Yang W., Parr R. G., 1988, Phys. Rev. B, 37, 785
- Lide (1962) Lide D. R., 1962, J. Mol. Spectrosc., 8, 142
- Maret et al. (2011) Maret S., Hily-Blant P., Pety J., Bardeau S., Reynier E., 2011, A&A, 526, A47
- Margulès et al. (2017) Margulès L., McGuire B. A., Senent M. L., Motiyenko R. A., Remijan A., Guillemin J. C., 2017, A&A, 601, A50
- Margulès et al. (2022) Margulès L., et al., 2022, A&A, 663, A132
- Martin-Drumel et al. (2015) Martin-Drumel M. A., van Wijngaarden J., Zingsheim O., Lewen F., Harding M. E., Schlemmer S., Thorwirth S., 2015, J. Mol. Spectrosc., 307, 33
- Martín et al. (2008) Martín S., Requena-Torres M. A., Martín-Pintado J., Mauersberger R., 2008, ApJ, 678, 245
- Martín et al. (2019) Martín S., Martín-Pintado J., Blanco-Sánchez C., Rivilla V. M., Rodríguez-Franco A., Rico-Villas F., 2019, A&A, 631, A159
- Melosso et al. (2020) Melosso M., Dore L., Tamassia F., Brogan C. L., Hunter T. R., McGuire B. A., 2020, J. Phys. Chem. A, 124, 240
- Michael et al. (2005) Michael J. V., Su M. C., Sutherland J. W., Harding L. B., Wagner A. F., 2005, Proc. Combust. Inst., 30, 965
- Motiyenko et al. (2014) Motiyenko R. A., Ilyushin V. V., Drouin B. J., Yu S., Margulès L., 2014, A&A, 563, A137
- Motiyenko et al. (2020) Motiyenko R. A., Belloche A., Garrod R. T., Margulès L., Müller H. S. P., Menten K. M., Guillemin J. C., 2020, A&A, 642, A29
- Müller et al. (2002) Müller H. S. P., Cohen E. A., Christen D., 2002, J. Mol. Spectrosc., 216, 335
- Müller et al. (2005) Müller H. S. P., Schlöder F., Stutzki J., Winnewisser G., 2005, J. Mol. Struct., 742, 215
- Muller et al. (2011) Muller S., et al., 2011, A&A, 535, A103
- Müller et al. (2016) Müller H. S. P., et al., 2016, A&A, 587, A92
- Müller et al. (2017) Müller H. S. P., Zingsheim O., Wehres N., Grabow J.-U., Lewen F., Schlemmer S., 2017, J. Phys. Chem. A, 121, 7121
- Müller et al. (2021) Müller H. S. P., Belloche A., Lewen F., Drouin B. J., Sung K., Garrod R. T., Menten K. M., 2021, J. Mol. Spectrosc., 378, 111449
- Müller et al. (2022) Müller H. S. P., Guillemin J.-C., Lewen F., Schlemmer S., 2022, J. Mol. Spectrosc., 384, 111584
- Müller et al. (2023) Müller H. S. P., Jørgensen J. K., Guillemin J.-C., Lewen F., Schlemmer S., 2023, MNRAS, 518, 185
- Nazari et al. (2022) Nazari P., et al., 2022, A&A, 668, A109
- Ohishi et al. (2019) Ohishi M., Suzuki T., Hirota T., Saito M., Kaifu N., 2019, PASJ, 71, 86
- Ordu et al. (2012) Ordu M. H., Müller H. S. P., Walters A., Nuñez M., Lewen F., Belloche A., Menten K. M., Schlemmer S., 2012, A&A, 541, A121
- Pickett (1972) Pickett H. M., 1972, J. Chem. Phys., 56, 1715
- Pickett (1991) Pickett H. M., 1991, J. Mol. Spectrosc., 148, 371
- Reid et al. (2019) Reid M. J., et al., 2019, ApJ, 885, 131
- Requena-Torres et al. (2006) Requena-Torres M. A., Martín-Pintado J., Rodríguez-Franco A., Martín S., Rodríguez-Fernández N. J., de Vicente P., 2006, A&A, 455, 971
- Requena-Torres et al. (2008) Requena-Torres M. A., Martín-Pintado J., Martín S., Morris M. R., 2008, ApJ, 672, 352
- Rivilla et al. (2019) Rivilla V. M., et al., 2019, MNRAS, 483, L114
- Rivilla et al. (2020) Rivilla V. M., et al., 2020, ApJ, 899, L28
- Rivilla et al. (2021a) Rivilla V. M., et al., 2021a, Proc. Natl. Acad. Sci., 118, 2101314118
- Rivilla et al. (2021b) Rivilla V. M., et al., 2021b, MNRAS, 506, L79
- Rivilla et al. (2022a) Rivilla V. M., et al., 2022a, Front. Astron. Space Sci., 9, 829288
- Rivilla et al. (2022b) Rivilla V. M., et al., 2022b, Front. Astron. Space Sci., 9, 876870
- Rivilla et al. (2022c) Rivilla V. M., et al., 2022c, ApJ, 929, L11
- Rodríguez-Almeida et al. (2021a) Rodríguez-Almeida L. F., et al., 2021a, A&A, 654, L1
- Rodríguez-Almeida et al. (2021b) Rodríguez-Almeida L. F., et al., 2021b, ApJ, 912, L11
- Shang et al. (2019) Shang Y., Ning H., Shi J., Wang H., Luo S.-N., 2019, Phys. Chem. Chem. Phys., 21, 12685
- Tanaka & Morino (1970) Tanaka T., Morino Y., 1970, J. Mol. Spectrosc., 33, 538
- Taquet et al. (2016) Taquet V., Wirström E. S., Charnley S. B., 2016, ApJ, 821, 46
- Wollrab & Laurie (1968) Wollrab J. E., Laurie V. W., 1968, J. Chem. Phys., 48, 5058
- Wollrab & Laurie (1971) Wollrab J. E., Laurie V. W., 1971, J. Chem. Phys., 54, 532
- Xu et al. (2012) Xu L.-H., et al., 2012, J. Chem. Phys., 137, 104313
- Zeng et al. (2018) Zeng S., et al., 2018, MNRAS, 478, 2962
- Zeng et al. (2020) Zeng S., et al., 2020, MNRAS, 497, 4896
- Zeng et al. (2021) Zeng S., et al., 2021, ApJ, 920, L27
- Zingsheim et al. (2022) Zingsheim O., Müller H. S. P., Bonah L., Lewen F., Thorwirth S., Schlemmer S., 2022, J. Mol. Spectrosc., 384, 111565
Appendix A Additional figures from the ReMoCA survey
Figures 14–16 show transitions of CH3OCH3 , CH3OCH3 , and CH3OCH3 , respectively, that are covered by the ReMoCA survey and significantly contribute to the signal detected toward Sgr B2(N1S). Figures 17–20 show transitions of CH3OCH3 , CH3OCH3 , CH3OCH3 , and CH3NH2 , respectively, that are covered by the ReMoCA survey and significantly contribute to the signal detected toward Sgr B2(N2b). Transitions of a given molecule that are too heavily blended with much stronger emission from other molecules and therefore cannot contribute to the identification of this molecule are not shown in these figures.