Black Hole Feeding and Feedback in a Compact Galaxy
Abstract
We perform high-resolution hydrodynamical simulations using the framework of MACER to investigate supermassive black hole (SMBH) feeding and feedback in a massive compact galaxy, which has a small effective radius but a large stellar mass , with a simulation duration of 10 Gyr. We compare the results with a reference galaxy with a similar stellar mass but a less concentrated stellar density distribution, as typically found in local elliptical galaxies. We find that about 10% of the time, the compact galaxy develops multi-phase gas within a few kpc, but the accretion flow through the inner boundary below the Bondi radius is always a single phase. The inflow rate in the compact galaxy is several times larger than in the reference galaxy, mainly due to the higher gas density caused by the more compact stellar distribution. Such a higher inflow rate results in stronger SMBH feeding and feedback and a larger fountain-like inflow-outflow structure. Compared to the reference galaxy, the star formation rate in the compact galaxy is roughly two orders of magnitude higher but is still low enough to be considered quiescent. Over the whole evolution period, the black hole mass grows by 50% in the compact galaxy, much larger than the value of 3% in the reference galaxy.
keywords:
black hole physics - galaxies: active – galaxies: evolution – galaxies: nuclei1 Introduction
Observations suggest that the progenitors of today’s massive elliptical galaxies were compact quiescent galaxies at , often termed “red nuggets” (e.g., Kriek et al., 2009; Damjanov et al., 2009). Numerical simulations show that they are formed through a compaction-quenching process (Fang et al., 2013; Zolotov et al., 2015; Tacchella et al., 2015). At lower , the evolution of massive early-type galaxies is dominated by minor mergers which mainly add stars to the outskirts of the galaxies to grow their sizes (van Dokkum et al., 2010; Oser et al., 2010; Naab et al., 2009). Recent observations have revealed a small population of local compact galaxies with small effective radii but large stellar masses (Yıldırım et al., 2017). These compact galaxies are suggested to be relics of the red nuggets that have evolved passively in isolation and thus did not experience as many late-time mergers to grow their sizes (Trujillo et al., 2014). Like the more typical massive elliptical galaxies, these red nugget relics also show little to no ongoing star formation and are surrounded by hot X-ray halos (Buote & Barth, 2018; Werner et al., 2018).
It is generally accepted that the quiescent state of massive elliptical galaxies is maintained by the feedback from the supermassive black holes (SMBHs) in the centers of galaxies (McNamara & Nulsen, 2007; Fabian, 2012). The roles of SMBHs in galaxy evolution have been studied extensively in large-scale cosmological simulations (e.g., Schaye et al., 2015; Weinberger et al., 2018). Idealized galaxy-scale simulations have explored more details of the feeding and feedback of SMBHs thanks to the higher spatial resolution they are able to achieve (e.g., Ciotti et al., 2010; Yuan et al., 2018; Wang et al., 2019; Prasad et al., 2020). However, almost all previous theoretical studies have been focused on typical massive elliptical galaxies. How SMBH feeding and feedback operate in compact galaxies and how they differ from typical massive galaxies are not well-understood from a theoretical perspective.
In this work, we explore SMBH feeding and feedback in an idealized, isolated compact galaxy. We also perform a simulation of a typical low z massive elliptical galaxy for comparison. The two-dimensional hydrodynamical simulations are performed using the MACER framework (Yuan et al., 2018), resolving from galaxy scales all the way down below the Bondi radius. In section 2, we present a brief overview to MACER and the setup of our simulations. Our main results are discussed in Section 3, including the accretion flow, SMBH feedback, and star formation in the simulations. We conclude our work in Section 4.
2 Methodology
2.1 The MACER framework: overview
The simulations in this paper are performed using MACER (Massive AGN Controlled Ellipticals Resolved), a high-resolution hydrodynamical numerical simulation framework built on the ZEUS code (Stone & Norman, 1992) developed over the past decades to study the evolution of elliptical galaxies, emphasizing the role of AGN feedback (e.g., Ciotti & Ostriker, 2001; Ciotti et al., 2010; Yuan et al., 2018). The detailed descriptions of the framework are presented in Yuan et al. (2018). Here we briefly introduce the key features of MACER (this section) and the AGN physics adopted in it (section 2.2).
MACER uses spherical coordinate (). Axial symmetry is assumed in the -direction and we focus only on the () plane; thus our simulation is 2.5 dimensional. The inner boundary of the simulation is adopted to be small enough to resolve the Bondi radius, , so that we can reliably calculate the mass flux there. We can then combine the calculated mass flux with the theory of black hole accretion to obtain the value of the mass accretion rate at the black hole horizon and properties of radiation and wind. The value of mass accretion rate is crucial to the AGN feedback study since it determines the power of the AGN. Due to limited resolution, cosmological simulations cannot resolve the Bondi radius thus have to adopt various approximated approaches to estimate the accretion rate, whose uncertainty is found to be as large as (Negri & Volonteri, 2017).
The second characteristic of our model is that we adopt the state-of-the-art physics of black hole accretion. Especially, the results of wind and radiation in the hot accretion mode developed in the recent decade are incorporated, as we will briefly introduce in section 2.2. We inject radiation and wind at the inner boundary and calculate their energy and momentum interactions with the gas in the galaxy. For AGN wind, we treat it as a source term by adding the energy, momentum and mass of the wind into the innermost two grids of the simulation domain. For AGN radiation, we consider the heating/cooling and radiation pressure to the gas. The radiative heating and cooling processes include bremsstrahlung, Compton heating and cooling, photoionization heating, line and recombination continuum cooling. We then self-consistently calculate the interaction between AGN outputs and the interstellar medium. In contrast, in cosmological models, phenomenological parameters are usually adopted to couple the AGN outputs with the gas in an assumed region surrounding the AGN.
2.2 Physics of AGN feedback adopted in MACER
Motivated by the observations and theoretical models of black hole X-ray binaries, black hole accretion comes in hot and cold modes, bounded by (Yuan & Narayan, 2014). The existence of two accretion modes and the value of this “boundary luminosity” between them should also apply to the supermassive black holes in the centers of galaxies, because the physics of black hole accretion is largely independent of black hole mass. When the accretion is in the cold mode, the inflowing gas first freely falls until a disk is formed at the circularization radius determined by the specific angular momentum of the falling gas. The black hole accretion rate is calculated from the accretion rate at the inner boundary by solving a set of differential equations, taking into account the mass evolution of the small disk and the mass lost in the wind. The bolometric luminosity is calculated by , with is the radiative efficiency. The mass flux and velocity of wind launched in the cold mode as a function of are taken from observational results of Gofford et al. (2015). The mass flux of wind is assumed to be , i.e., the wind has a bipolar structure (Yuan et al., 2018).
When the accretion is in the hot mode, the accretion flow consists of an outer truncated thin disk and an inner hot accretion flow, with the value of the truncation radius determined by the mass accretion rate at and the black hole mass (Yuan & Narayan, 2014). The dynamics and radiation of the hot accretion flow have been intensively studied in the past decades (see review by Yuan & Narayan, 2014). Different from the thin disk, the radiative efficiency of a hot accretion flow is a function of accretion rate (Xie & Yuan, 2012).
Numerical simulations have shown that strong wind must be produced throughout the hot accretion flows (Yuan et al., 2012a, b; Narayan et al., 2012; Yuan et al., 2015; Bu et al., 2016a, b; Yang et al., 2021). The prediction has been confirmed by more and more observations in recent years (Wang et al., 2013; Cheung et al., 2016; Park et al., 2019; Ma et al., 2019; Shi et al., 2021, 2022). Since the observational constraints on the properties of hot wind are still weak, in MACER, we take the properties of the wind, including its mass flux, velocity, and spatial distribution, from the averaged results of three-dimensional general relativity MHD numerical simulation of black hole accretion flows of Yuan et al. (2015). For simplicity, we assume that the accretion is in the SANE (standard and normal evolution) mode and the black hole spin .
2.3 Physics of stellar evolution adopted in MACER
In our simulation, the gas is mainly supplied by stellar evolution. The total mass-loss rate of a stellar population is
| (1) |
Here is the mass-loss rate, which is approximated as “simple stellar population”, namely all stars are formed at the same time. It is determined by (Maraston, 2005),
| (2) |
where is the stellar mass of the galaxy at an age of 12 Gyr, and is the age in units of 12 Gyr. The coefficient is set to 3.3, which is Kroupa initial mass function. The recycle rate of gas from SN Ia is , where is the evolution of the explosion rate with time.
The star formation rate is calculated as (Yuan et al., 2018):
| (3) |
with being the efficiency. The calculation of the timescale can be found in Yuan et al. (2018). But different from Yuan et al. (2018), here we adopt thresholds for the density and temperature, which is widely adopted in numerical simulations due to insufficient resolutions. We assume that gas can be converted into stars only when its density is higher than and the temperature is lower than K.
The star formation removes mass, momentum, and energy of gas from the grid, while SNe II injects mass and energy. The newly formed star is assumed to have a Salpeter IMF, the mass return from SN II progenitors is 20% of the newly formed stellar mass.
2.4 Galaxy initial conditions
The initial condition of our compact galaxy is based on a compact galaxy (ID: 58771) extracted from the IllustrisTNG simulation (Pillepich et al., 2018) at 2. The galaxy is selected using the criteria from van Dokkum et al. (2015):
| (4) |
with , where is the stellar mass and is effective radius. We fit the dark matter halo using an NFW profile (Navarro et al., 1996) with a scale radius kpc and a dark matter mass of . The stellar density profile is fitted with a spherically symmetric Jaffe model (Dehnen, 1993):
| (5) |
with an effective radius and a stellar mass . The values of these two parameters are obtained by fitting the stellar distribution in the IllustrisTNG simulation data. We use the model for the initial gas density profile:
| (6) |
with and kpc. Again, the values of these two parameters are obtained by fitting the gas distribution in the IllustrisTNG simulation data. The temperature profile is obtained by hydrostatic equilibrium calculation. We find that when our simulations reach the quasi-steady state, the gas within kpc is dominated by the mass loss from the stellar evolution; while beyond this radius, the gas is dominated by the “initial” gas. The central black hole has an initial mass .
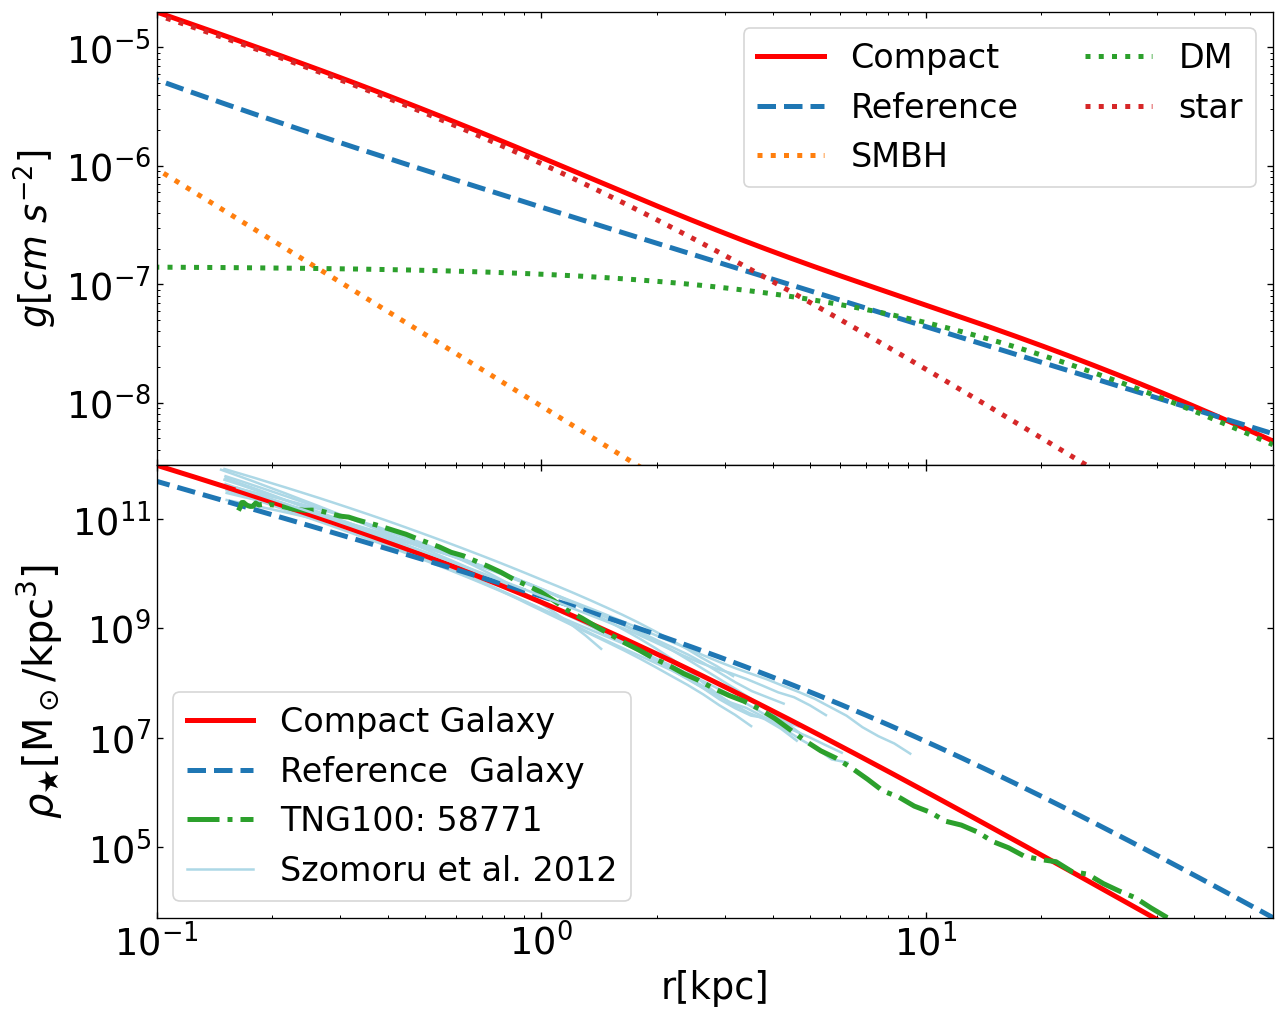
For reference, we also simulate a typical local massive elliptical galaxy. Its parameters are described in Yuan et al. (2018), except that a same black hole mass as the compact galaxy is adopted for comparison purpose. The stellar profile of this reference galaxy is described by a Jaffe model, with and kpc (refer to Eq. 5). The stellar profiles of the compact and reference galaxies are shown in Fig. 1, together with the initial condition taken from IllustrisTNG. The density profile of the sum of stellar matter and dark matter is given by
| (7) |
Here is the projected central velocity dispersion (). The initial gas is neglected as we find they are quickly ejected out and replaced by the gas that originated from stellar evolution.
The assumed specific angular momentum of the stars providing gas in the simulation can be calculated from this equation (Novak et al., 2011):
| (8) |
where is the distance to the -axis, is the central one-dimensional line-of-sight velocity dispersion for the galaxy model, and , and are adjustable parameters controlling the angular momentum profile at various radii. In our simulation, the value of at the innermost radius is only in the tens of . Both the compact massive galaxy and the reference galaxy are assumed to be isolated and slowly rotating.
2.5 Model setting
The inner and outer boundaries of the simulation domain are set to be 0.8pc and 160 kpc. We have calculated the mass flux-weighted Bondi radius and found that this value of the inner boundary is times smaller than the Bondi radius. Our fiducial simulations have grids in the plane. In the direction, the mesh is divided homogeneously; in the radial direction, we use a logarithmic mesh. With such grids, the finest resolution is achieved in the innermost region, which is 0.17 pc.
3 Results and Discussions
3.1 Gas Motion from Galaxy Scale to Bondi Radius
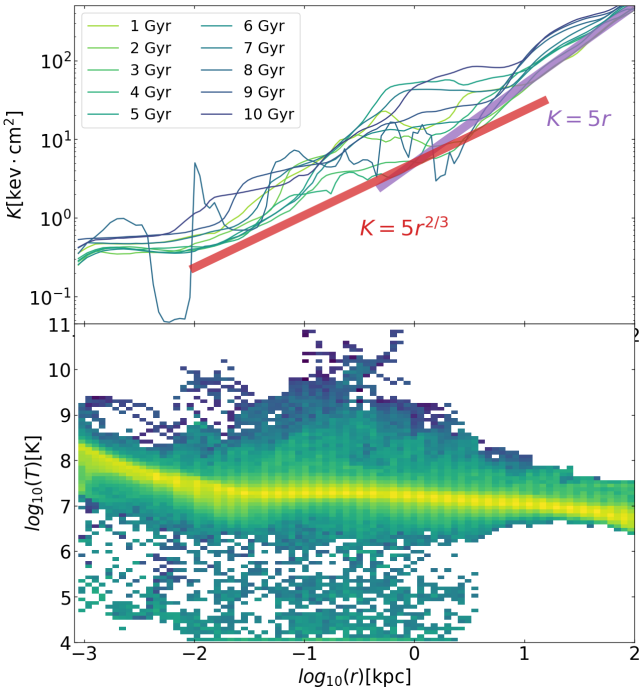
The interplay between radiative cooling and AGN feedback regulates the simulated galaxy to a quasi-steady state. The top panel of Figure 2 shows the evolution of the hot gas entropy profiles. Entropy here is defined as . On large scales ( kpc), the entropy profile roughly follows , which is the baseline entropy profile from gravitational structure formation (Voit et al., 2005). From pc to kpc, the entropy profile scales as , following the precipitation limit (Voit et al., 2015). Such an entropy limit is equivalent to the criteria (Sharma et al., 2012; Li & Bryan, 2014; Ji et al., 2018). At the innermost region ( pc), the entropy is roughly flat. Previous simulations with lower resolution typically show a much larger flat entropy core of kpc scales (e.g., Voit et al., 2017). Our smaller entropy core ( pc) is more consistent with the observed entropy profiles of elliptical galaxies (Voit et al., 2015).
The bottom panel of Figure 2 shows the stacked gas temperature as a function of . Gas condensation indeed develops from pc to kpc, where the entropy of the hot gas follows the precipitation limit. Previous simulations suggest that the accretion of cold gas dominates at the Bondi radius when multiphase gas is present (Gaspari et al., 2013). However, when even smaller scales are resolved, we find that cool gas is dissolved before reaching the smallest radius, and the accretion flow is hot. This is consistent with the recent findings in Guo et al. (2022) for simulated three-dimensional accretion flows in M87. We note that although the galaxy develops multi-phase gas sometimes, it is a single-phase galaxy about 90% of the time in the simulation, similar to the simulated reference galaxy.
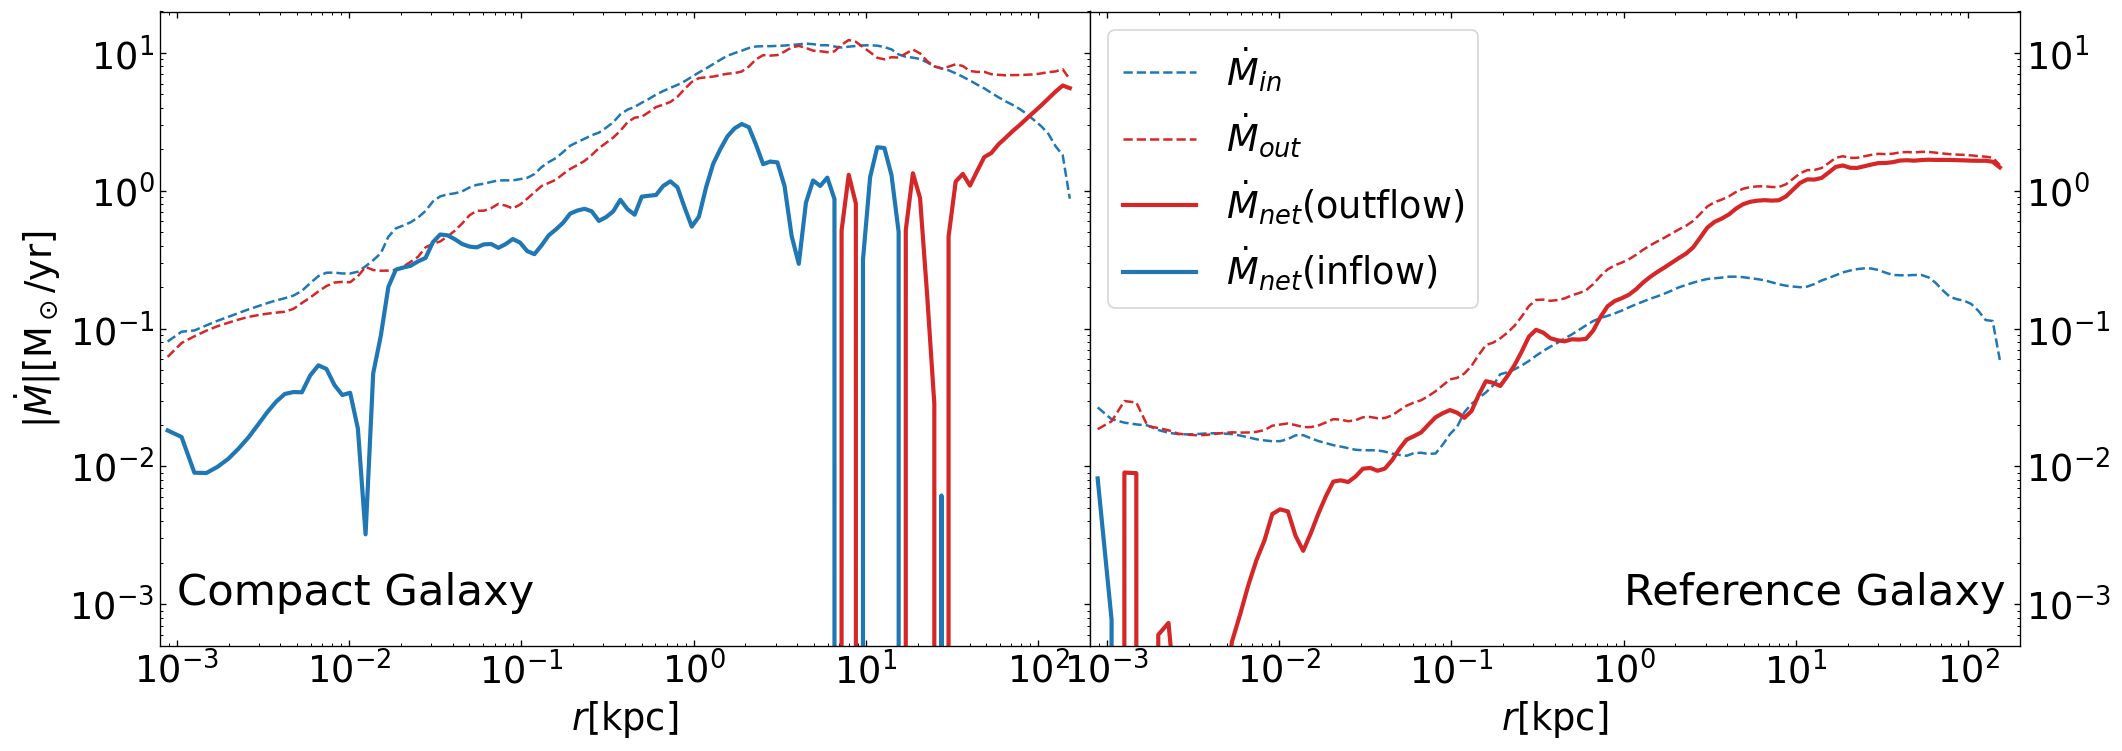
We define the time and angle-averaged inflow, outflow, and net rates as Ressler et al. (2018):
| (9) |
The rates are averaged over 10 Gyr. Figure 3 shows the radial profiles of the three rates for compact and reference galaxies. We find that for both galaxies, both the inflow and outflow rates decrease with decreasing radius. Such an inward decrease is similar to that of the black hole hot accretion flow (Yuan et al., 2012a). We speculate that, as in the case of the black hole accretion flow, it may be due to the presence of convective motion and/or outflow in the galaxy (Yuan et al., 2012b). One important difference is that here the net rate is not a constant of radius. This is because we have gas sources from stellar evolution, which is not considered in the case of black hole accretion flow. We note that our result is similar to what is found in Ressler et al. (2018) for the Milky Way SMBH fed by stellar winds.
The location of the “stagnation region”, where the inflow and outflow have comparable strengths and thus the net flow rapidly switches between the two, is very different in the two simulated galaxies. In the compact galaxy, it is located around kpc; while in the reference galaxy, it is three orders of magnitude closer to the SMBH, at only a few pc. Within a few kpc, the compact galaxy is entirely dominated by inflow; whereas in the reference galaxy, inflow only takes over close to the inner boundary. As shown by the top panel of Figure 1, the gravitational force in the compact galaxy is typically stronger than that in the reference galaxy by a factor of a few. This is why the inflow region in the former is much larger than in the latter.
At galaxy scales, ranging from the inner boundary to kpc, the magnitude of the inflow and outflow rates in the compact galaxy is several times higher than those in the reference galaxy. This is mainly because the gas density in the central region of the compact galaxy is a few times higher than the reference galaxy. The stellar wind is the main source of gas in the galaxy. The higher density in the compact galaxy is because its stellar distribution is more compact.
This higher inflow rate at the inner boundary implies stronger feeding, and subsequently feedback, of the SMBH, which we discuss in more detail in Section 3.2.
When comparing the outflow rate and the stellar mass loss from evolved stars, we find that in the reference galaxy, the two are comparable. This suggests that within a few kpc, the outflow is mainly composed of stellar wind. In the compact galaxy, stellar wind makes up a small fraction of the inflow and outflow rates. This suggests that the stellar wind gas is difficult to escape out of the galaxy due to the strong gravity of the galaxy; rather, the inflow and outflow motions are likely dominated by the strong galaxy-scale circulation.
3.2 SMBH Feedback
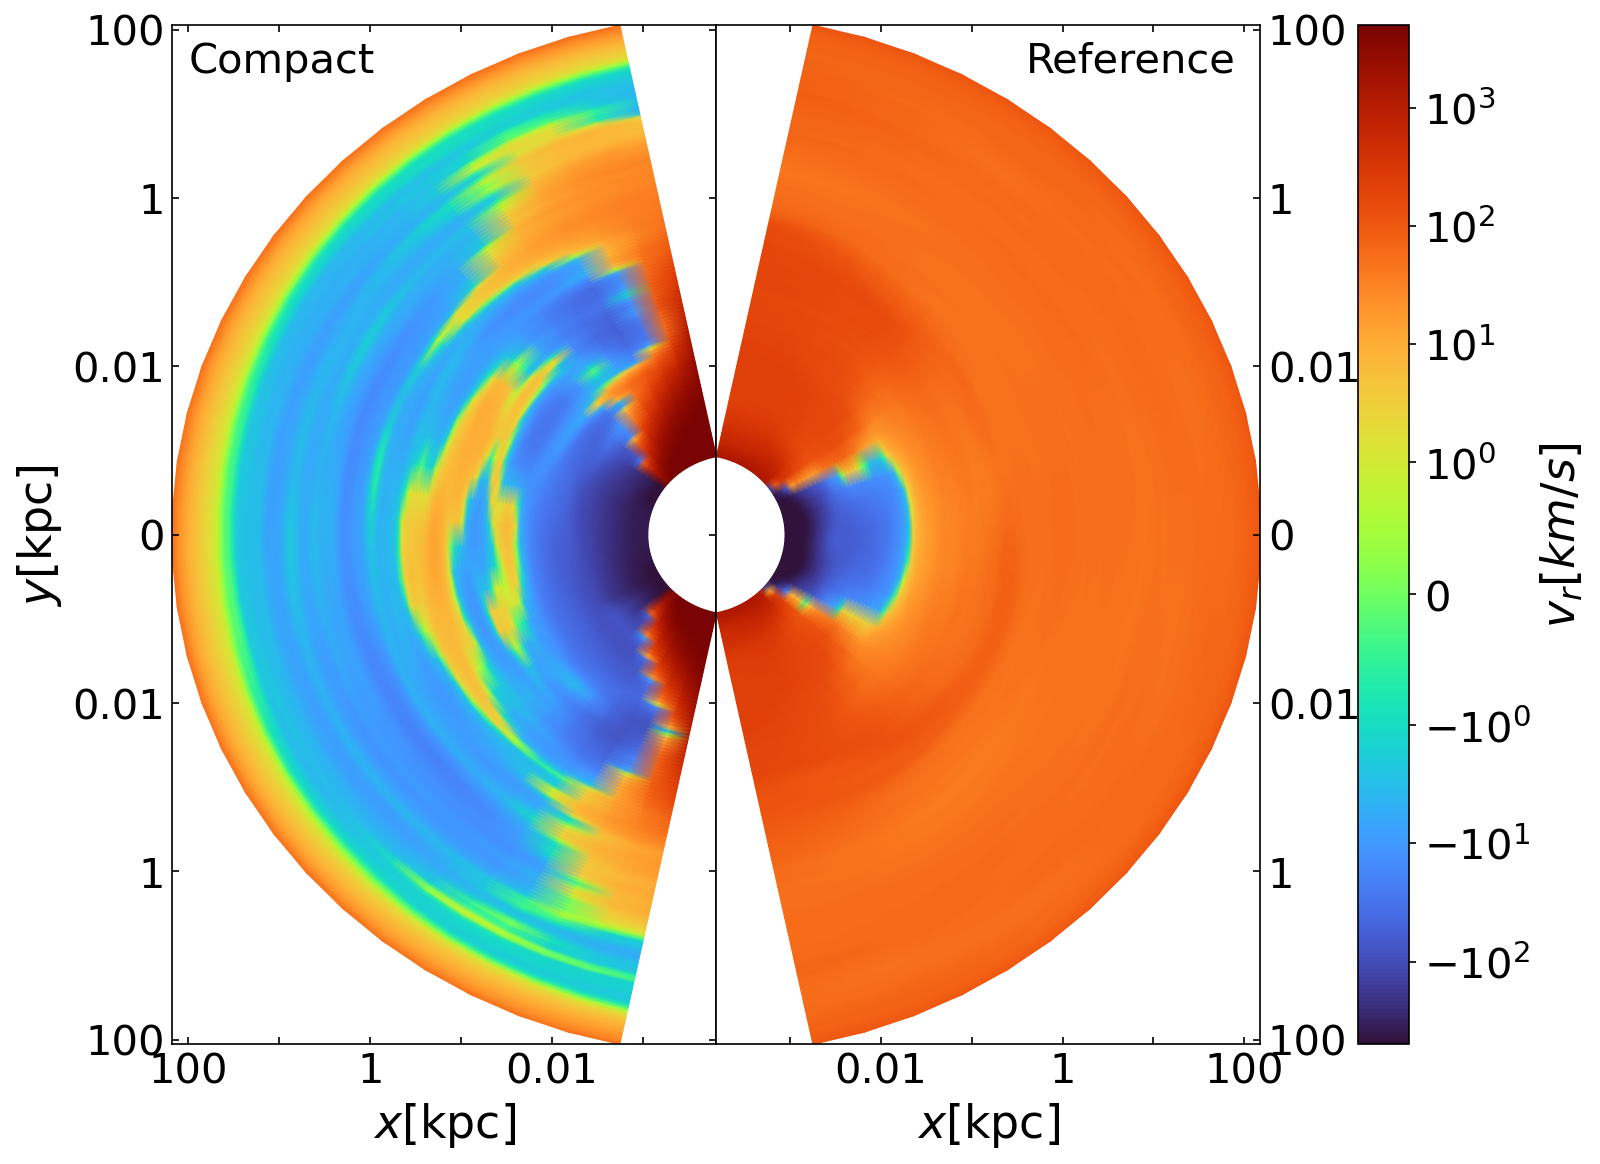
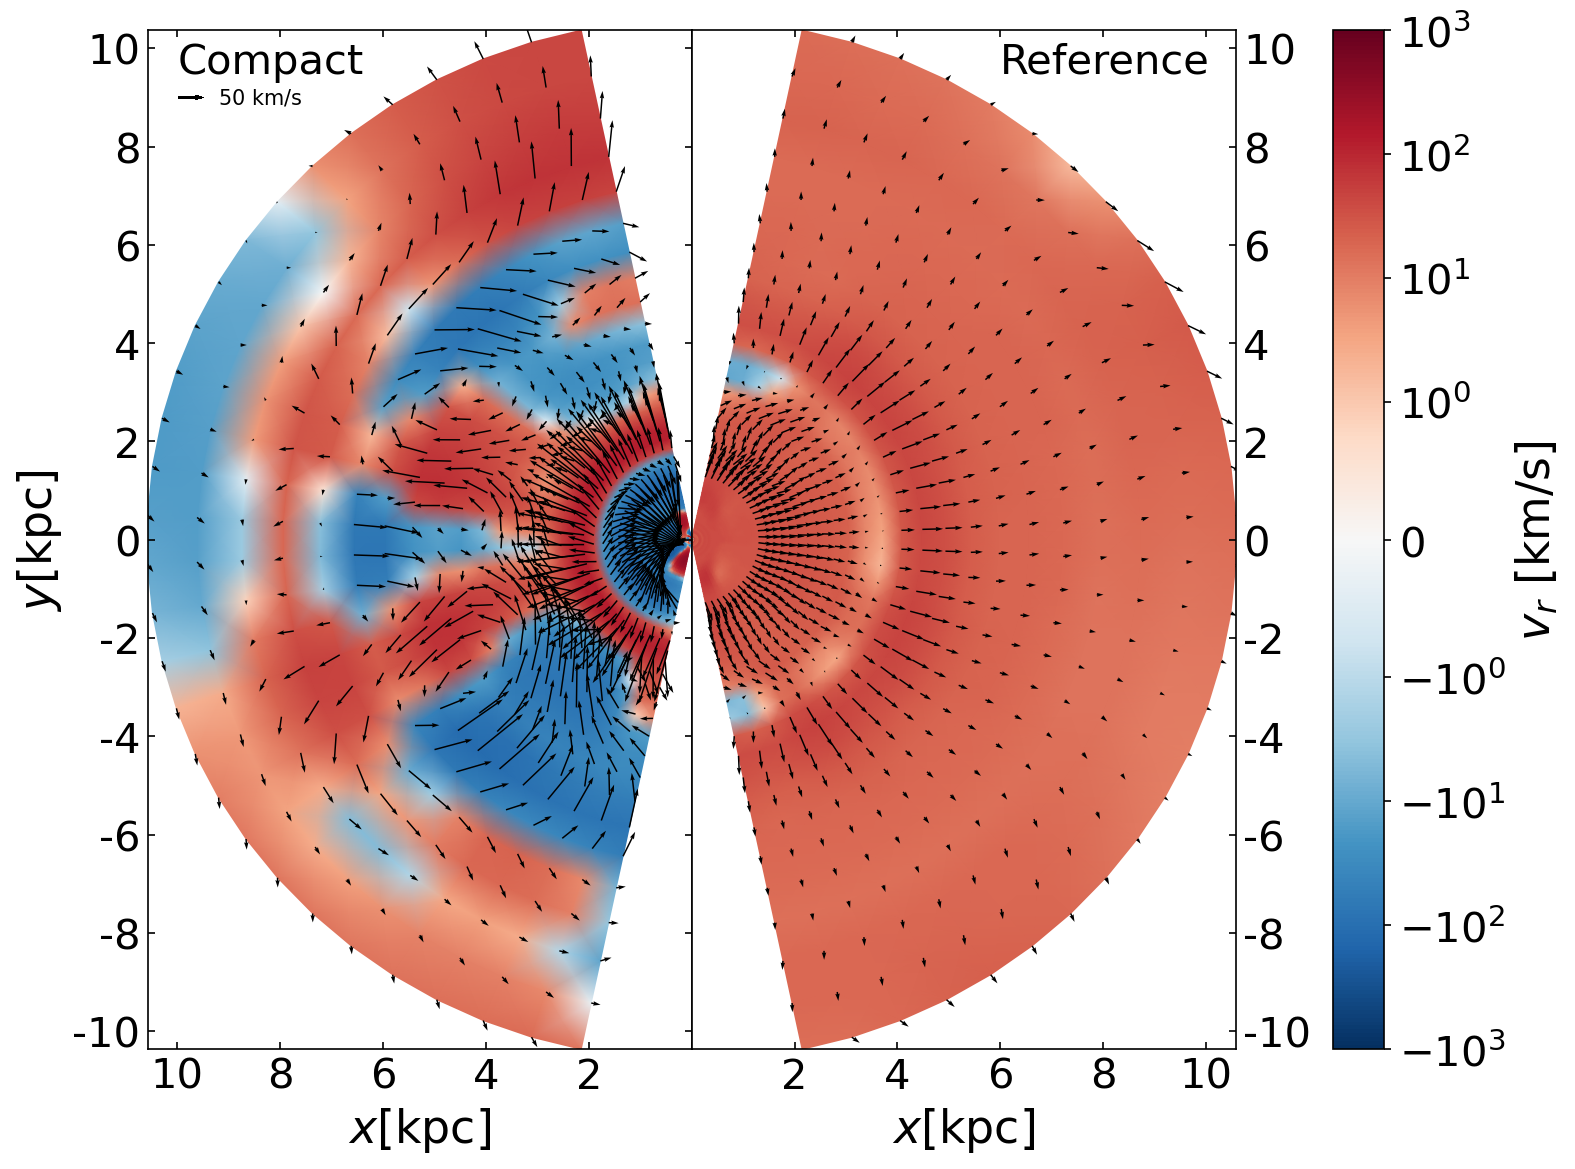
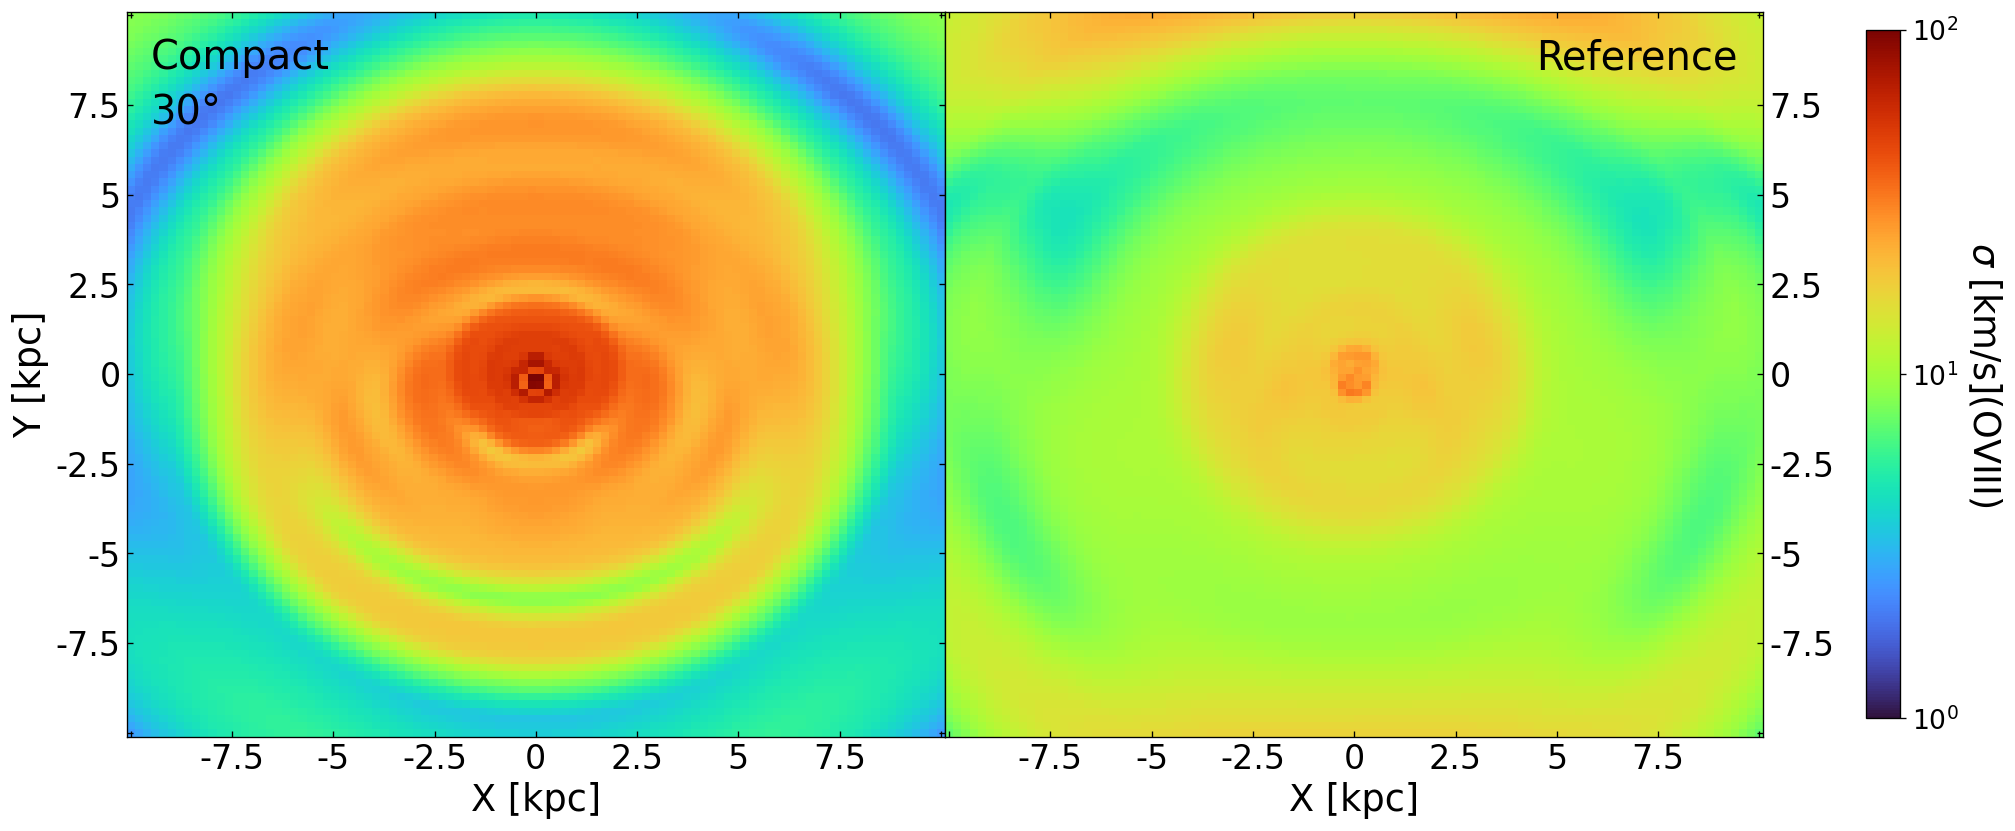
Figure 4(a) shows the radial velocity distribution for the compact and reference galaxies averaged over the entire 10 Gyr period. In both cases, the flow forms a fountain-like structure, with the outflow mainly in the polar region and the inflow along the equatorial plane. Such a structure is caused by the bipolar structure of wind launched from the AGN. In the compact galaxy, the fountain flow extends to a few kpc, while in the reference galaxy, the fountain pattern is confined to the central kpc. This difference is because the black hole accretion rate in the compact galaxy is about 10 times larger than the reference galaxy, as we discuss in more detail in section 3.3, thus the wind in the compact galaxy is much stronger than that in the reference galaxy. On average, both the inflow and the outflow in the compact galaxy have higher speeds than those in the reference galaxy. In both galaxies, even though galactic-scale bi-polar outflows can form at the peaks of AGN outbursts, most of the time the galaxy hosts a subsonic galactic wind with no preferred directions. Figure 4(b) shows the distribution of the velocity field for the compact and reference galaxies at 9.75 Gyr. This snapshot was randomly selected and displayed with linear spacing in radius. The fountain-like structure remains in the compact galaxy and the flow velocities are larger in the compact galaxy.
The predicted difference between the compact and reference galaxies can be tested by observing heavy ion emission lines in X-ray spectra. Figure 5 shows the predicted velocity dispersion of O VIII-emitting gas in the compact and reference galaxies corresponding to Figure 4(b). The line of sight is adopted to be degrees. To produce the mock observations, we first produced the 3D data based on our 2D simulation data by assuming axial symmetry. We then compute O VIII emissivity based on ATOMDB111www.atomdb.org. This figure shows that the compact galaxy has a much higher velocity dispersion than the reference galaxy. This prediction can be tested using the upcoming high-resolution X-ray instruments such as Athena X-IFU (Barret et al., 2018) or HUBS (Cui et al., 2020). When warm gas exists, the predictions could also be observed by the Integral Field Spectrographs (IFS) on some optical telescopes. Note that the rings shown in the figure are caused by torus-like structure within which the typical gas velocity is significantly lower than the gas outside of the torus. Such a 3D torus-like structure corresponds to some vortexes in the 2D simulation data, so we expect they should be replaced by more tangled structure in the more realistic 3D simulation.
3.3 Star Formation and SMBH Accretion Rate
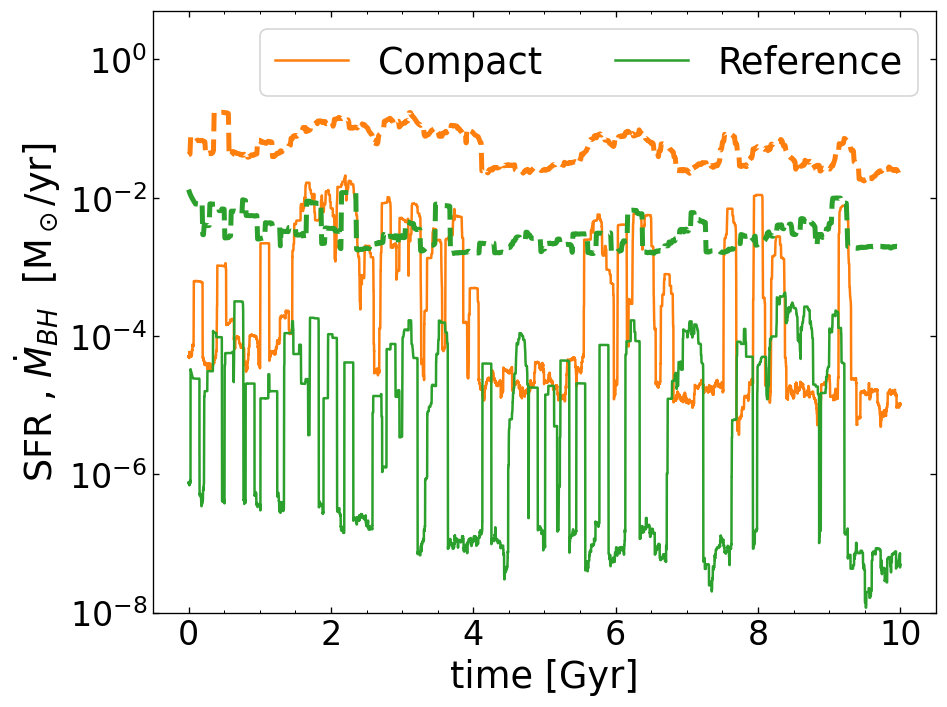
Figure 6 shows the evolution of the star formation rate (SFR) and black hole accretion rate in compact and reference galaxies. The SFR in the compact galaxy (solid orange line) is roughly two orders of magnitude higher than the reference galaxy due to its higher gas density. But the SFR in the compact galaxy is still very low, with a median and the highest value below 1 . The corresponding specific SFR are and , respectively, both of which being lower than . In other words, there is some very low-level star formation activity, and the simulated galaxy stays quiescent by any observational standards (e.g., Franx et al., 2008). The average spatial distribution of the newly formed stars roughly follows that of the existing stellar population, similar to the reference galaxy and what has been found in previous simulations of massive elliptical galaxies (Yuan et al., 2018; Wang et al., 2019).
The SMBH accretion rate in the compact galaxy is higher than the reference galaxy by a factor of 10. The AGN in the compact galaxy is in the cold mode about 0.08% of the time, while for the reference galaxy, it is 0.02%. Over the 10 Gyr evolution period, the SMBH mass grows by in the compact galaxy, compared with in the reference galaxy. Some observational works (e.g., Walsh et al., 2015, 2016) have suggested that SMBHs in local compact galaxies tend to be overly massive given the host’s luminosity and bulge mass (although see Cohn et al., 2021). The SMBH mass growth in our simulations is overall insignificant. If a larger observational sample in the future confirms that compact galaxies do tend to host overly more massive SMBHS, this trend is likely set by the formation history of the galaxies in the distant past, rather than the late-time SMBH growth at lower redshifts.
4 Conclusions and Final Remarks
We have performed high-resolution two-dimensional numerical simulations of SMBH feeding and feedback in an idealized compact galaxy in the framework of MACER and compared the results with a simulated typical low-z elliptical galaxy. We study the SMBH-driven outflow and the accretion flow from galaxy scales down to below the Bondi radius. The compact galaxy shows larger inflow and outflow rates compared with the reference galaxy, which is mainly because the gas density in the compact galaxy is higher due to its more compact stellar distribution. The high inflow rate in the compact galaxy results in strong SMBH feeding and feedback. Consequently, the compact galaxy forms a large galaxy-scale inflow-outflow fountain, while the reference galaxy shows a relatively smooth and gentle outflow. Due to the stronger SMBH feeding, we find that compact galaxies tend to have stronger winds. We observe this in the form of faster velocities and higher velocity dispersions. This prediction can be potentially tested with IFS observations.
Multi-phase gas can develop within a few kpc about 10% of the time, following the typical precipitation criteria. However, the accretion flow past the inner boundary within the Bondi radius is always single phase, as the cool/warm gas is mixed back to the hot phase before reaching the SMBH.
Due to the higher gas density in the compact galaxy, its SFR is roughly two orders of magnitude larger than the reference galaxy. But during the entire 10 Gyr simulation duration, the compact galaxy still stays quiescent with very low-level star formation activities. Due to its stronger inflow rate, the SMBH grows by in the compact galaxy, significantly larger than that in the reference galaxy, which is .
Acknowledgments
We would like to thank Lei Hao, Suoqing Ji, Miao Li, Zhiyuan Li, and Mark Voit for helpful discussions. We thank the referee for his/her constructive suggestions which significantly improved the paper. YD, FY and FS are supported in part by the NSF of China (grants 12133008, 12192220, and 12192223), YL is supported in part by the NSF (grants AST-2107735 and AST-2219686). The calculations have made use of the High Performance Computing Resource in the Core Facility for Advanced Research Computing at Shanghai Astronomical Observatory.
Data Availability
The data underlying this article will be shared on reasonable request to the corresponding author.
References
- Barret et al. (2018) Barret D., et al., 2018, in den Herder J.-W. A., Nikzad S., Nakazawa K., eds, Society of Photo-Optical Instrumentation Engineers (SPIE) Conference Series Vol. 10699, Space Telescopes and Instrumentation 2018: Ultraviolet to Gamma Ray. p. 106991G (arXiv:1807.06092), doi:10.1117/12.2312409
- Bu et al. (2016a) Bu D.-F., Yuan F., Gan Z.-M., Yang X.-H., 2016a, ApJ, 818, 83
- Bu et al. (2016b) Bu D.-F., Yuan F., Gan Z.-M., Yang X.-H., 2016b, ApJ, 823, 90
- Buote & Barth (2018) Buote D. A., Barth A. J., 2018, ApJ, 854, 143
- Cheung et al. (2016) Cheung E., et al., 2016, Nature, 533, 504
- Ciotti & Ostriker (2001) Ciotti L., Ostriker J. P., 2001, ApJ, 551, 131
- Ciotti et al. (2010) Ciotti L., Ostriker J. P., Proga D., 2010, ApJ, 717, 708
- Cohn et al. (2021) Cohn J. H., et al., 2021, ApJ, 919, 77
- Cui et al. (2020) Cui W., et al., 2020, Journal of Low Temperature Physics, 199, 502
- Damjanov et al. (2009) Damjanov I., et al., 2009, ApJ, 695, 101
- Dehnen (1993) Dehnen W., 1993, MNRAS, 265, 250
- Fabian (2012) Fabian A. C., 2012, ARA&A, 50, 455
- Fang et al. (2013) Fang J. J., Faber S. M., Koo D. C., Dekel A., 2013, ApJ, 776, 63
- Franx et al. (2008) Franx M., van Dokkum P. G., Förster Schreiber N. M., Wuyts S., Labbé I., Toft S., 2008, ApJ, 688, 770
- Gaspari et al. (2013) Gaspari M., Ruszkowski M., Oh S. P., 2013, MNRAS, 432, 3401
- Gofford et al. (2015) Gofford J., Reeves J. N., McLaughlin D. E., Braito V., Turner T. J., Tombesi F., Cappi M., 2015, MNRAS, 451, 4169
- Guo et al. (2022) Guo M., Stone J. M., Kim C.-G., Quataert E., 2022, arXiv e-prints, p. arXiv:2211.05131
- Ji et al. (2018) Ji S., Oh S. P., McCourt M., 2018, Mon. Not. Roy. Astron. Soc., 476, 852
- Kriek et al. (2009) Kriek M., van Dokkum P. G., Labbé I., Franx M., Illingworth G. D., Marchesini D., Quadri R. F., 2009, ApJ, 700, 221
- Li & Bryan (2014) Li Y., Bryan G. L., 2014, ApJ, 789, 153
- Ma et al. (2019) Ma R.-Y., Roberts S. R., Li Y.-P., Wang Q. D., 2019, MNRAS, 483, 5614
- Maraston (2005) Maraston C., 2005, MNRAS, 362, 799
- McNamara & Nulsen (2007) McNamara B. R., Nulsen P. E. J., 2007, ARA&A, 45, 117
- Naab et al. (2009) Naab T., Johansson P. H., Ostriker J. P., 2009, ApJ, 699, L178
- Narayan et al. (2012) Narayan R., SÄ dowski A., Penna R. F., Kulkarni A. K., 2012, MNRAS, 426, 3241
- Navarro et al. (1996) Navarro J. F., Frenk C. S., White S. D. M., 1996, ApJ, 462, 563
- Negri & Volonteri (2017) Negri A., Volonteri M., 2017, MNRAS, 467, 3475
- Novak et al. (2011) Novak G. S., Ostriker J. P., Ciotti L., 2011, ApJ, 737, 26
- Oser et al. (2010) Oser L., Ostriker J. P., Naab T., Johansson P. H., Burkert A., 2010, ApJ, 725, 2312
- Park et al. (2019) Park J., Hada K., Kino M., Nakamura M., Ro H., Trippe S., 2019, ApJ, 871, 257
- Pillepich et al. (2018) Pillepich A., et al., 2018, MNRAS, 473, 4077
- Prasad et al. (2020) Prasad D., Voit G. M., O’Shea B. W., Glines F., 2020, ApJ, 905, 50
- Ressler et al. (2018) Ressler S. M., Quataert E., Stone J. M., 2018, MNRAS, 478, 3544
- Schaye et al. (2015) Schaye J., et al., 2015, MNRAS, 446, 521
- Sharma et al. (2012) Sharma P., McCourt M., Quataert E., Parrish I. J., 2012, MNRAS, 420, 3174
- Shi et al. (2021) Shi F., Li Z., Yuan F., Zhu B., 2021, Nature Astronomy, 5, 928
- Shi et al. (2022) Shi F., Zhu B., Li Z., Yuan F., 2022, ApJ, 926, 209
- Stone & Norman (1992) Stone J. M., Norman M. L., 1992, ApJS, 80, 753
- Szomoru et al. (2012) Szomoru D., Franx M., van Dokkum P. G., 2012, ApJ, 749, 121
- Tacchella et al. (2015) Tacchella S., et al., 2015, Science, 348, 314
- Trujillo et al. (2014) Trujillo I., Ferré-Mateu A., Balcells M., Vazdekis A., Sánchez-Blázquez P., 2014, ApJ, 780, L20
- Voit et al. (2005) Voit G. M., Kay S. T., Bryan G. L., 2005, MNRAS, 364, 909
- Voit et al. (2015) Voit G. M., Donahue M., O’Shea B. W., Bryan G. L., Sun M., Werner N., 2015, ApJ, 803, L21
- Voit et al. (2017) Voit G. M., Meece G., Li Y., O’Shea B. W., Bryan G. L., Donahue M., 2017, ApJ, 845, 80
- Walsh et al. (2015) Walsh J. L., van den Bosch R. C. E., Gebhardt K., Yildirim A., Gültekin K., Husemann B., Richstone D. O., 2015, ApJ, 808, 183
- Walsh et al. (2016) Walsh J. L., van den Bosch R. C. E., Gebhardt K., Yıldırım A., Richstone D. O., Gültekin K., Husemann B., 2016, ApJ, 817, 2
- Wang et al. (2013) Wang Q. D., et al., 2013, Science, 341, 981
- Wang et al. (2019) Wang C., Li Y., Ruszkowski M., 2019, MNRAS, 482, 3576
- Weinberger et al. (2018) Weinberger R., et al., 2018, MNRAS, 479, 4056
- Werner et al. (2018) Werner N., Lakhchaura K., Canning R. E. A., Gaspari M., Simionescu A., 2018, MNRAS, 477, 3886
- Xie & Yuan (2012) Xie F.-G., Yuan F., 2012, ApJ, 427, 1580
- Yang et al. (2021) Yang H., Yuan F., Yuan Y.-F., White C. J., 2021, ApJ, 914, 131
- Yıldırım et al. (2017) Yıldırım A., van den Bosch R. C. E., van de Ven G., Martín-Navarro I., Walsh J. L., Husemann B., Gültekin K., Gebhardt K., 2017, MNRAS, 468, 4216
- Yuan & Narayan (2014) Yuan F., Narayan R., 2014, ARA&A, 52, 529
- Yuan et al. (2012a) Yuan F., Wu M., Bu D., 2012a, ApJ, 761, 129
- Yuan et al. (2012b) Yuan F., Bu D., Wu M., 2012b, ApJ, 761, 130
- Yuan et al. (2015) Yuan F., Gan Z., Narayan R., Sadowski A., Bu D., Bai X.-N., 2015, ApJ, 804, 101
- Yuan et al. (2018) Yuan F., Yoon D., Li Y.-P., Gan Z.-M., Ho L. C., Guo F., 2018, ApJ, 857, 121
- Zolotov et al. (2015) Zolotov A., et al., 2015, MNRAS, 450, 2327
- van Dokkum et al. (2010) van Dokkum P. G., et al., 2010, ApJ, 709, 1018
- van Dokkum et al. (2015) van Dokkum P. G., et al., 2015, ApJ, 813, 23