THE ORIGIN OF LOW-REDSHIFT EVENT RATE EXCESS AS REVEALED BY THE LOW-LUMINOSITY GRBS
Abstract
The relation between the event rate of long Gamma-Ray Bursts and the star formation rate is still controversial, especially at the low-redshift end. Dong et al. confirmed that the Gamma-Ray Burst rate always exceeds the star formation rate at low-redshift of in despite of the sample completeness. However, the reason of low-redshift excess is still unclear. Since low-luminosity bursts are at smaller redshifts generally, we choose three Swift long burst samples and classify them into low- and high-luminosity bursts in order to check whether the low-redshift excess is existent and if the excess is biased by the sample size and completeness. To degenerate the redshift evolution from luminosity, we adopt the non-parametric method to study the event rate of the two types of long bursts in each sample. It is found that the high-luminosity burst rate is consistent with the star formation rate within the whole redshift range while the event rate of low-luminosity bursts exceeds the star formation rate at low redshift of . Consequently, we conclude that the low-redshift excess is contributed by the low-luminosity bursts with possibly new origins unconnected with the star formation, which is also independent of the sample size and the sample completeness.
1 Introduction
Gamma-Ray Bursts (GRBs) can be traditionally classified into long and short classes according to the duration (), with a dividing line of s (e.g. Kouveliotou et al., 1993; Zhang & Choi, 2008; Wang et al., 2020) or s (Bromberg et al., 2013; Gruber et al., 2014; Zhang et al., 2020b). The exact dividing line between long and short GRBs depends on the sample and the energy band. For example, the values of Swift GRBs with good duration measurement (Gruber et al., 2014) and well-measured spectrum (Zhang et al., 2020b; Deng et al., 2022) are bimodally distributed with a boundary of s. In any case, it proves that the apparent middle class in some -selected GRB samples is inexistent or artificial (e.g. Zhang et al., 2016; Tarnopolski, 2019a, b; Zhang et al., 2020b; Deng et al., 2022; Tarnopolski, 2022). Long GRBs (lGRBs) with s are believed to come from the core-collapse of massive stars (e.g. Woosley, 1993; Paczyński, 1998; Woosley & Bloom, 2006; Hjorth et al., 2003; Stanek et al., 2003; Zhang, 2018), so that the lGRB rate was frequently compared with the star formation rate (SFR) in a low-metallicity environment (Wang & Dai, 2009; Palmerio & Daigne, 2021; Elías & Martínez, 2018). On the other hand, short GRBs (sGRBs) with s are usually interpreted as the mergers of compact objects such as double neutron stars (DNS) or neutron star-black hole (NS-BH) binaries (e.g., Eichler et al., 1989; Paczyński, 1991; Narayan, Paczyński & Piran, 1992). lGRBs can also be divided into high- and low-luminosity classes (see Zhang, 2018, for a detail). They can even be grouped into classical GRBs, X-ray-rich GRBs and X-ray flashes (XRFs) (Zhang et al., 2020b) by considering their peak energy, or into more interesting sub-classes by considering whether they have extended emissions or not (Zhang et al., 2020a). Considering the joint observational features, Zhang et al. (2009) proposed to classify GRBs into two subgroups of long/soft type I and short/hard type II in physics.
Since most lGRBs are believed to have a massive star core-collapse origin, their redshift distribution is expected to trace the SFR, which has been revealed by various SFR indicators (namely Madau et al., 1998; Daigne, Rossi & Mochkovitch, 2006; Hopkins & Beacom, 2006; Grieco et al., 2012). Over the past decades, the event rates derived with different methods are still controversial and even conflicting with the star formation history. Interestingly, it was found that the lGRB rate exhibits an excess at either the low-redshift end (e.g. Yu et al., 2015; Petrosian, Kitanidis & Kocevski, 2015; Zhang & Wang, 2018; Lloyd-Ronning, Aykutalp & Johnson, 2019) or the high-reshift end (e.g. Yüksel et al., 2008; Kistler et al., 2008; Virgili et al., 2011; Lan et al., 2019) when it is compared with the SFR. Since the current high-z SFR is measured with a relatively large uncertainty (see e.g. Dong et al., 2022, hereafter D22), the discrepancy between the lGRB formation rate and the SFR at the high redshift end is not prominent yet. On the contrary, whether the lGRB rate traces the SFR in the low-z domain is still an important issue that has been deeply investigated recently (e.g. Yu et al., 2015; Petrosian, Kitanidis & Kocevski, 2015; Pescalli et al., 2016; Palmerio & Daigne, 2021; Dainotti, Petrosian & Bowden, 2021; Dong et al., 2022; Nugent et al., 2022). Similarly, some authors claimed that the formation rate of sGRBs also exceeds the SFR at low redshift (Zhang & Wang, 2018; Dainotti, Petrosian & Bowden, 2021). Recently, Nugent et al. (2022) analyzed the stellar population of 69 sGRB host galaxies and concluded that the event rate of sGRBs trace a combination of recent star formation and stellar mass, but is not singularly dependent on either property. It is interesting to note that some authors argued that low-luminosity GRBs are a distinctive class of bursts (e.g. Sazonov, Lutovinov & Sunyaev, 2004; Cobb et al., 2006; Liang et al., 2007). However the relation between their event rate and the low-redshift lGRB rate has not been carefully examined yet. Since most low-luminosity GRBs occur at a relatively low redshift, it is quite possible that they could be the key factor leading to the low-redshift excess of lGRB rate. Here we will study this issue in-depth.
People have employed various statistical methods to assess the GRB formation rate and compare it with SFR. There are mainly two approaches frequently applied for this purpose. The first one is the traditional parametric estimate, namely the direct fit (Gehrels et al., 2004; Guetta & Piran, 2005; Daigne, Rossi & Mochkovitch, 2006; Le & Dermer, 2007; Liang et al., 2007; Yüksel et al., 2008; Wanderman & Piran, 2010, 2015; Elías & Martínez, 2018) or the maximum likelihood method (Lan et al., 2019) on the stellar population analysis (Nugent et al., 2022; Ghirlanda & Salvaterra, 2022), in which the dependence of luminosity on redshift was neglected and the luminosity distribution should be assumed in advance. The second one is the non-parametric -statistic method (Lynden-Bell, 1971; Efron & Petrosian, 1992; Petrosian, Kitanidis & Kocevski, 2015) that was initially proposed to investigate the luminosity function of quasars and its evolution based on a flux-limited sample. Noticeably, the evolution of luminosity with redshift can be represented by a factor of . It has now been popularly adopted to calculate the luminosity function and event rate of both lGRBs and sGRBs (Wu et al., 2012; Petrosian, Kitanidis & Kocevski, 2015; Yu et al., 2015; Pescalli et al., 2016; Tsvetkova et al., 2017; Zhang & Wang, 2018; Lloyd-Ronning, Aykutalp & Johnson, 2019; Dainotti, Petrosian & Bowden, 2021; Dong et al., 2022). It should be emphasized that the derived event rate could be somewhat biased by the statistical method, the instrumental effect and the sample selection. By contrast, the non-parametric method has a special advantage for a truncated sample since it does not depend on any pre-assumptions of the luminosity property and can give point-by-point description of the cumulative distributions. Therefore, we will use the non-parametric method to investigate different samples of Swift lGRBs in this study.
To reduce the instrumental bias, GRBs detected by a single satellite are usually utilized as the first choice. As a result, most previous works have paid particular attention to the Swift/BAT GRBs. However, note that such GRB samples collected from the literature are generally incomplete according to the selection standards defined in Jakobsson et al. (2006) and Salvaterra et al. (2012). The completeness of GRB sample was especially emphasized in Pescalli et al. (2016) (hereafter P16), but our recent work showed that it does not affect the resulting event rate too much as long as the selected GRB sample have a large size and a sufficient redshift coverage (Dong et al., 2022). It strongly indicates that the low-redshift excess of GRB rate is not due to the sample incompleteness. Also, even for the same Swift lGRB sample, different methods may lead to inconsistent results. For example, P16 used the non-parametric method to study a complete sample of 81 Swift lGRBs and found no low-redshift excess, which however may be caused by the neglect of the differential comoving volume in their calculations. Using the same complete lGRB sample in P16, Lan et al. (2019) employed the maximum likelihood method to examine the luminosity function and event rate and concluded that the GRB event rate is roughly consistent with the SFRs at but shows a discrepancy at high redshift of . However, D22 also applied the non-parametric method to the P16 samples and confirmed the similar low-redshift () excess and the high-redshift consistency in both complete and non-complete Swift lGRB samples. Meanwhile, they concluded that the resulting event rate is basically threshold-independent provided that the number of bursts above the flux limit is sufficient enough. However, whether the event rate of low-luminosity GRBs differs from that of high-luminosity ones and how these two types of GRBs trace star formation are still unknown yet. It motivates us to utilize a larger Swift GRB sample to investigate such an important issue in this study. Also, we will compare the event rates derived from complete samples with that from incomplete samples.
2 DATA and method
To obtain the less-biased luminosity function and event rates of low- and high-luminosity lGRBs and their dependence on the redshift, we need to collect those lGRBs with both redshift measurement and well-constrained spectra so that the bolometric luminosity can be precisely calculated. Firstly, we select 365 lGRBs with redshift and peak photon flux in the Swift/BAT catalog111https://swift.gsfc.nasa.gov/archive/grb_table/ from January 26, 2005 to May 31, 2022. Note that the big lGRB sample (called BL sample thereinafter) does not surfer from any selection effects except the Malmquist bias (Dainotti et al., 2018). The method used to convert the peak photon flux into peak energy flux () can be found in Zhang et al. (2018). Owing to the narrow energy range of the Swift/BAT detector, a single power-law spectrum of (see also Tang et al., 2019) has been applied to calculate the bolometric luminosity , where is in units of erg cm-2 s-1, is the K-correction factor and denotes the luminosity distance at a redshift of z. Here, a flat CDM universe with , and will be used (Zhang et al., 2021). Secondly, we also take the sample of 127 Swift lGRBs with well-measured spectra from Yu et al. (2015) (hereafter Y15) and the complete sample of 79 lGRBs in D22 in order to check whether the resulting event rates of lGRBs are dependent on the spectral quality, the sample size and the sample completeness.
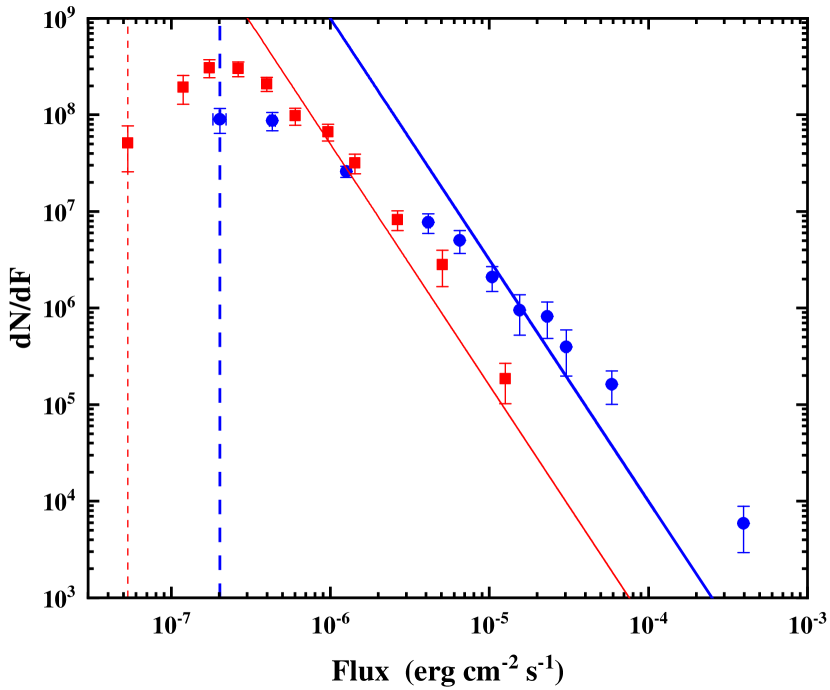
Subsequently, we divide the above three samples of lGRBs into low-luminosity and high-luminosity ones according to the differential luminosity distributions as shown in Figure 1. In this figure, the broken luminosity is marked by a vertical line in the left panels, and the luminosity versus the redshift of low- and high-luminosity lGRBs is displayed in the right panels. To put the luminosity limit on the plots, we need to set a suitable flux limit in advance. For the samples of Y15 and D22, we have taken the threshold as . For our newly-built sample BL, we plot the differential flux distributions of the two kinds of lGRBs in Figure 2, from which we can get the smallest flux as . This value is taken as the threshold in order to reserve sufficient low-luminosity lGRBs. It is worth noting that we have determined the boundaries between low- and high-luminosities via the following broken power-law function
| (1) |
which has been widely adopted in previous studies (e.g. Lloyd-Ronning, Fryer, & Ramirez-Ruiz, 2002; Guetta & Piran, 2005; Petrosian, Kitanidis & Kocevski, 2015). Note that the broken power-law function presents a better description for the luminosity function in Figure 1, as compared with the single power-law function.
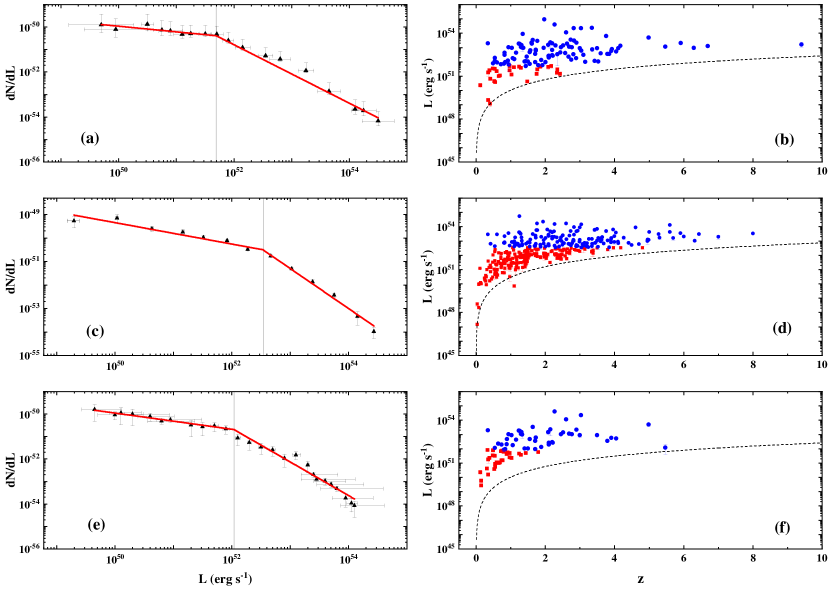
As a result, we get the broken luminosity as erg s-1, erg s-1 and erg s-1 for the Y15, BL and D22 samples, respectively, which are larger than the former artificial reference value of erg s-1 by about 1 – 2 orders of magnitude. In practice, there are no strict criteria to distinguish between low- and high-luminosity lGRBs previously. For example, Cobb et al. (2006) suggested that SN 1998bw/GRB 980425 and SN 2003lw/GRB 031203 are subluminous in -rays but they did not provide a standard for the classification (see also Liang et al., 2007). The fractions of low-luminosity lGRBs on basis of our criterion given by Equation (1) are 22% for sample Y15, 44% for sample BL and 41% for sample D22. For the sample BL, we caution that the percentages of low-redshift lGRBs are 36 and 6.2 for the low- and high-luminosity lGRBs, respectively. The fraction of low-luminosity lGRBs goes up to 88% in the redshift range from 0 to 1. This demonstrates that most low-luminosity lGRBs are located at high-redshift instead of in the nearby universe and will be absolutely dominant at the low-redshift end.
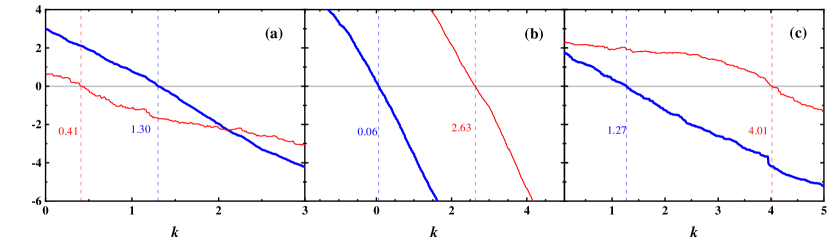
Following our recent work, we utilize the Lynden Bell’s c- method and the -statistic to determine the dependence of the peak luminosity on the redshift, which is assumed to take the form of (see Dong et al., 2022, for details). By varying the value until reaches zero, we obtain and in the Y15 sample, and in the BL sample, and in the D22 sample for low- and high-luminosity lGRBs, correspondingly. The results are illustrated in Figure 3. It can be seen that the power-law indices of and are significantly different in each sample. Interestingly, we notice that is larger than in the two samples of BL and D22, but the case is opposite for Sample Y15, which may be caused by the lower proportion of low-luminosity lGRBs in the Y15 sample. Although the derived values are sample-dependent, they are roughly coincident with previous estimates. For instance, Wu et al. (2012) derived the value of as for a sample of 95 lGRBs detected by multiple satellites including Swift, Fermi/GBM, Konus-wind, and so on. Tsvetkova et al. (2017) got a smaller value of for a sample of 150 Konus-wind lGRBs with reliable redshift measurements. It indicates that the values are less biased by the instrumental effect as compared with the sample selection effect.
3 GRB rate versus SFR
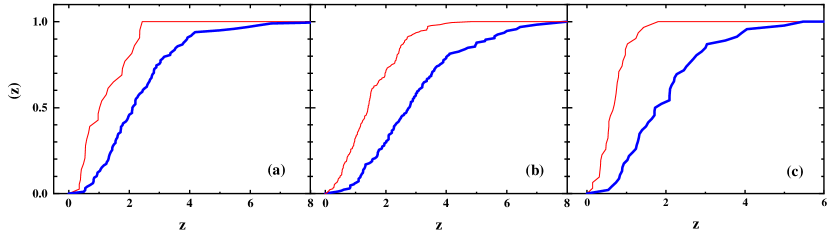
Using the cumulative redshift distribution function , one can calculate the lGRB rate, , as done in D22. The normalized cumulative redshift distributions of Samples Y15, BL and D22 are shown in Figure 4, where we find that the low-luminosity lGRBs are relatively closer to us than those high-luminosity ones in each sample. In comparison, the cumulative redshift distributions of low-luminosity lGRBs increase faster in the smaller redshift domain. Interestingly, the median redshifts of both low- and high-luminosity lGRBs in Sample Y15 are evidently larger than those corresponding medians of Sample D22, but smaller than the medians of Sample BL. More interestingly, we find that the median redshift of high-luminosity lGRBs in each sample is about two times larger than that of low-luminosity lGRBs, in which the physical reason is unknown yet. However, we can speculate that weak GRBs at high redshifts are most probably low-luminosity bursts not detected by us due to the Malmquist bias effect (Dainotti, Petrosian & Bowden, 2021). They need more effective ways to detect in the future (Jiang et al., 2021; Tanvir et al., 2021; Thomas et al., 2022).
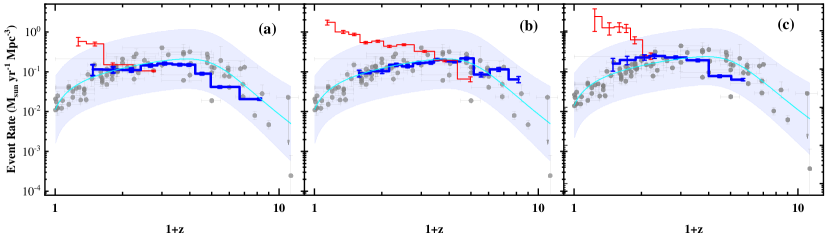
Now, we use the cumulative redshift distribution to compute the event rates of the two classes of lGRBs in each sample. The results are compared with the SFR in Figure 5. It can be obviously found that the dependence of the event rate on redshift for the low- and high-luminosity lGRBs is very different no matter whether the lGRB sample is complete or not, which is consistent with our findings in D22. In other words, the event rates of high-luminosity lGRBs match the SFR well in all redshift ranges and the low-luminosity lGRBs exhibit significant excess at low-redshift of , particularly for the complete sample D22. Even for the smaller and incomplete Y15 sample, the low-redshift excess is still significant. On the other hand, Figure 5 (b) indicates that the event rate of a small fraction of low-luminosity lGRBs with higher redshift of is somewhat in agreement with the SFR. This is evidently different from the previous viewpoint that the low-redshift excess was biased by the incompleteness of GRB samples (e.g. Pescalli et al., 2016; Lan et al., 2019). Strictly speaking, the sample completeness can influence the estimation of GRB rate slightly as displayed in Figure 5, but it would not change the evolutionary trend of GRBs in nature and its importance may be overestimated in some previous studies. Our results indicate that the high-luminosity lGRBs are produced by the core-collapse of massive stars, while most low-luminosity lGRBs could originate from other processes including compact star mergers which are unrelated to the star formation rate. Note that the limited GRB samples may bias the estimation of GRB rate especially in the low-redshift region. To test the reliability of our results, we have double-checked the data used in Figure 5, ensuring that the number of data points in each redshift bin is no less than 5. In this way, we still find that there is an excesses at low redshift in both the complete and incomplete lGRB samples based on Poisson statistics. The excess is mainly contributed by the low-luminosity lGRBs as well.
4 Conclusions
Based on the analysis of GRB rates for both complete and incomplete lGRB samples, we draw the following conclusions:
(1) The relations between peak luminosity and redshift of lGRBs are described by , with and for Sample Y15, and for Sample BL, and for Sample D22, respectively.
(2) After dividing the lGRBs into low- and high-luminosity ones, we find that the event rates of high-luminosity lGRBs match the SFR well in all redshift ranges and the low-luminosity lGRBs show significant excess at low-redshift of . Therefore, we conclude that the low-redshift excess of GRB rate is resulted from the low-luminosity lGRBs.
(3) We find that the lGRB rate always exceeds SFR at low redshift of no matter whether the lGRB samples are complete or not. That is to say, the low-redshift excess is intrinsically real and it cannot be attributed to the sample incompleteness.
Consequently, we argue that the high- and low-luminosity lGRBs might have different physical origins. High-luminosity bursts tracing the SFR should be produced by the death of massive stars and the low-luminosity bursts may come from other processes that is unrelated to the SFR. The results might shed new light on the investigation of GRB progenitors and central engines.
5 Discussion
Currently, the origin of the low-luminosity GRBs is still an open question. For example, Liang et al. (2007) and Guetta & Della Valle (2007) claimed the existence of two physically distinct classes of lGRBs but cannot exclude a single population. Lan et al. (2021) showed that the low-luminosity lGRBs are not the straightforward extension of high-luminosity ones through the luminosity distribution of their sample. Pais, Piran & Nakar (2023) mentioned that a cocoon breakout is most likely the origin of low-luminosity GRBs. Broad absorption lines produced in such a process have been observed in several SNe associated with low-luminosity lGRBs (e.g. Bufano et al., 2012; Xu et al., 2013; Izzo et al., 2019). Guetta & Della Valle (2007) investigated the GRB classification by considering their probability of being associated with an SN Ib/c. They found that low-luminosity GRBs are more likely to be associated with an SN Ib/c than high-luminosity GRBs. However, it is still too difficult to infer the nature of these two populations simply from their difference in the probability. Grieco et al. (2012) compared the Type Ib/c event rate with the GRB rate. It is found that the local ratio of GRB/SNe Ib/c is in spirals, and is in irregulars, which means that only a tiny fraction of SNe Ib/c sources ends up by exploding as lGRBs. Another possible origin involving the cocoon shock breakout from AGN disk was also proposed (Zhu et al., 2021). Particularly, MichałowskI et al. (2018) argued that the low-luminosity GRB 111005A represents an independent class of GRBs differing from the typical core-collapse events and inferred that the GRB rate may be biased towards low SFRs.
The discrepancy between the GRB rate and the SFR has been tried to be reconciled by several groups by considering the cosmic metallicity evolution (Salvaterra et al., 2012; Lloyd-Ronning, Aykutalp & Johnson, 2019) or an evolving luminosity function of GRBs (Lloyd-Ronning, Fryer, & Ramirez-Ruiz, 2002; Pescalli et al., 2016; Lan et al., 2021). Soderberg et al. (2006) derived the intrinsic rate of sub-energetic GRBs as Gpc-3 yr-1, which is about 10 times more abundant than typical bright GRBs. The low-luminosity lGRBs are likely a unique population because of the high local event rate and small beaming factor (see e.g. Liang et al., 2007; Guetta & Della Valle, 2007; Zhu et al., 2021). However, the real reason of the event rate exceeding the SFR at low redshift remains unknown. The most important finding in this study is that the low-redshift excess of GRB rate is induced by low-luminosity events rather than faint lGRBs. Moreover, the low-luminosity lGRBs at low redshift may not be related with the death of massive stars, but should be most probably connected to the merger of compact stars with a relatively low mass.
The reason that some previous works found no excess at low redshift may be that their samples are mainly consisted of high-luminosity lGRBs (Wu et al., 2012; Salvaterra et al., 2012; Pescalli et al., 2016; Ghirlanda & Salvaterra, 2022), since they have utilized the complete GRB samples such as the BAT6 sample (Salvaterra et al., 2012) which is dominated by bright Swift lGRBs. Dong et al. (2022) also applied the same non-parametric method to a complete sample including weak bursts and found the low-redshift excess exists. Simultaneously, they verified that the GRB rate exceeds the SFR at low redshift even for the non-complete GRB samples when the fraction of low-redshift GRBs is sufficient enough. Interestingly, we find in this study that the low-redshift excess is caused by the low-luminosity lGRBs instead of the high-luminosity ones, which is independent of the completeness of GRB samples.
An interesting issue is that the distributions of both luminosity and redshift can be influenced by the detailed geometry of the jet. It is quite clear that a realistic GRB jet could have some kinds of structure (Guo et al., 2020). Therefore, how different jet models affect the luminosity and redshift distributions is an important issue. Some authors have tried to solve the problem by assuming a particular jet profile in advance (e.g., Nakar, Granot, & Guetta, 2004; Guo et al., 2020; Banerjee & Guetta, 2022). For example, Nakar, Granot, & Guetta (2004) discussed the influence of an universal structured jet model on the redshift distribution. They also calculated the theoretical GRB rate as a function of redshift and viewing angle. It is found that the structured jet model is incompatible with the currently available observational data because of the redshift selection effects. More recently, Banerjee & Guetta (2022) proposed that the scatter of the luminosity in the co-moving frame can be influenced by the angular emission profile of GRB jets. They also found that the mean luminosity is insensitive to the on-axis luminosity of the jet. But still, they did not find the actual effect of a particular structured jet model on the distributions of luminosity and redshift. In practice, it is usually difficult to discriminate whether the GRB ejecta is structured or isotropic through observations. It is even more difficult to distinguish different types of structured jets. In some cases, our line of sight may deviate from the jet axis (Xu et al., 2023), which will lead to more difficulties in deriving the luminosity function and event rate of GRBs. We hope that the rapid increase of the number of GRBs with redshift measured would bring more opportunity to us in the future.
Acknowledgements
We thank the anonymous referee for helpful suggestions that led to an overall improvement of this study. This work was supported by the National Natural Science Foundation of China (No. U2031118), the Youth Innovations and Talents Project of Shandong Provincial Colleges and Universities (Grant No. 201909118) and the Natural Science Foundations (ZR2018MA030, XKJJC201901). YFH is supported by the National Key R&D Program of China (2021YFA0718500), by National SKA Program of China (No. 2020SKA0120300), by the National Natural Science Foundation of China (Grant Nos. 12233002, 12041306, U1938201).
References
- Banerjee & Guetta (2022) Banerjee S., Guetta D., 2022, A&A, 661, A145. doi:10.1051/0004-6361/202142628.
- Bufano et al. (2012) Bufano F., Pian E., Sollerman J., Benetti S., Pignata G., Valenti S., Covino S., et al., 2012, ApJ, 753, 67. doi:10.1088/0004-637X/753/1/67
- Bromberg et al. (2013) Bromberg, O., Nakar, E., Piran, T., et al. 2013, ApJ, 764, 179. doi:10.1088/0004-637X/764/2/179
- Cobb et al. (2006) Cobb B. E., Bailyn C. D., van Dokkum P. G., Natarajan P., 2006, ApJL, 645, L113. doi:10.1086/506271
- Daigne, Rossi & Mochkovitch (2006) Daigne, F., Rossi, E. M., Mochkovitch, R., 2006, MNRAS, 372, 1034. doi:10.1111/j.1365-2966.2006.10837.x
- Dainotti et al. (2018) Dainotti, M. G. & Amati, L. 2018, PASP, 130, 051001
- Dainotti, Petrosian & Bowden (2021) Dainotti M. G., Petrosian V., Bowden L., 2021, ApJL, 914, L40. doi:10.3847/2041-8213/abf5e4
- Deng et al. (2022) Deng Q., Zhang Z.-B., Li X.-J., et al., 2022, ApJ, 940, 5. doi:10.3847/1538-4357/ac9590
- Dong et al. (2022) Dong X. F., Li X. J., Zhang Z. B., Zhang X. L., 2022, MNRAS, 513, 1078. doi:10.1093/mnras/stac949
- Efron & Petrosian (1992) Efron B., Petrosian V., 1992, ApJ, 399, 345. doi:10.1086/171931
- Eichler et al. (1989) Eichler, D., Livio, M., Piran, T., and Schramm, D. N. 1989, Nature, 340, 126. doi:10.1038/340126a0
- Elías & Martínez (2018) Elías M., Martínez O., 2018, RMxAA, 54, 309
- Gehrels et al. (2004) Gehrels N., Chincarini G., Giommi P., Mason K. O., Nousek J. A., Wells A. A., White N. E., et al., 2004, ApJ, 611, 1005. doi:10.1086/422091
- Ghirlanda & Salvaterra (2022) Ghirlanda G., Salvaterra R., 2022, ApJ, accepted, arXiv:2206.06390
- Grieco et al. (2012) Grieco V., Matteucci F., Meynet G., Longo F., Della Valle M., Salvaterra R., 2012, MNRAS, 423, 3049. doi:10.1111/j.1365-2966.2012.21052.x
- Gruber et al. (2014) Gruber, D., Goldstein, A., Weller von Ahlefeld, V., et al. 2014, ApJS, 211, 12. doi:10.1088/0067-0049/211/1/12
- Guetta & Piran (2005) Guetta D., Piran T., 2005, A&A, 435, 421. doi:10.1051/0004-6361:20041702
- Guetta & Della Valle (2007) Guetta D., Della Valle M., 2007, ApJL, 657, L73. doi:10.1086/511417
- Guo et al. (2020) Guo Q., Wei D.-M., Wang Y.-Z., Jin Z.-P., 2020, ApJ, 896, 83. doi:10.3847/1538-4357/ab8f9d
- Hjorth et al. (2003) Hjorth J., Sollerman J., Møller P., Fynbo J. P. U., Woosley S. E., Kouveliotou C., Tanvir N. R., et al., 2003, Natur, 423, 847. doi:10.1038/nature01750
- Hopkins & Beacom (2006) Hopkins, A. M., Beacom, J. F., 2006, ApJ, 651, 142. doi: 10.1086/506610
- Izzo et al. (2019) Izzo L., de Ugarte Postigo A., Maeda K., Thöne C. C., Kann D. A., Della Valle M., Sagues Carracedo A., et al., 2019, Natur, 565, 324. doi:10.1038/s41586-018-0826-3
- Jakobsson et al. (2006) Jakobsson, P., Levan, A., Fynbo, J. P. U. et al., 2006, A&A, 447, 897. doi:10.1051/0004-6361:20054287
- Jiang et al. (2021) Jiang L., Wang S., Zhang B., Kashikawa N., Ho L. C., Cai Z., Egami E., et al., 2021, NatAs, 5, 262. doi:10.1038/s41550-020-01266-z
- Kistler et al. (2008) Kistler, M. D., Yüksel, H., Beacom, J. F., Stanek, K. Z., 2008, ApJ, 673, 119. doi:10.1086/527671
- Kouveliotou et al. (1993) Kouveliotou C., Meegan C. A., Fishman G. J., Bhat N. P., Briggs M. S., Koshut T. M., Paciesas W. S., et al., 1993, ApJL, 413, L101. doi:10.1086/186969
- Lan et al. (2019) Lan G.-X., Zeng H.-D., Wei J.-J., Wu X.-F., 2019, MNRAS, 488, 4607. doi:10.1093/mnras/stz2011
- Lan et al. (2021) Lan G.-X., Wei J.-J., Zeng H.-D., Li Y., Wu X.-F., 2021, MNRAS, 508, 52. doi:10.1093/mnras/stab2508
- Le & Dermer (2007) Le T., Dermer, C. D., 2007, ApJ, 661, 394. doi:10.1086/513460
- Le, Ratke & Mehta (2020) Le T., Ratke C., Mehta V., 2020, MNRAS, 493, 1479. doi:10.1093/mnras/staa366
- Li et al. (2023) Li Q. M., Zhang Z. B., Han X. L., Zhang K. J., Xia X. L., Hao C. T., 2023, MNRAS, 524, 1096. doi:10.1093/mnras/stad1648
- Liang et al. (2007) Liang E., Zhang B., Virgili F., Dai Z. G., 2007, ApJ, 662, 1111. doi:10.1086/517959
- Lloyd-Ronning, Aykutalp & Johnson (2019) Lloyd-Ronning N. M., Aykutalp A., Johnson J. L., 2019, MNRAS, 488, 5823. doi:10.1093/mnras/stz2155
- Lloyd-Ronning, Fryer, & Ramirez-Ruiz (2002) Lloyd-Ronning N. M., Fryer C. L., Ramirez-Ruiz E., 2002, ApJ, 574, 554. doi:10.1086/341059
- Lynden-Bell (1971) Lynden-Bell D., 1971, MNRAS, 155, 95. doi:10.1093/mnras/155.1.95
- Madau et al. (1998) Madau, P., Pozzetti, L., and Dickinson, M. 1998, ApJ, 498, 106. doi:10.1086/305523
- MichałowskI et al. (2018) MichałowskI M. J., Xu D., Stevens J., et al., 2018, A&A, 616, A169. doi:10.1051/0004-6361/201629942
- Narayan, Paczyński & Piran (1992) Narayan, R., Paczyński, B., and Piran, T., 1992, ApJ, 395, L83. doi: 10.1086/186493
- Nakar, Granot, & Guetta (2004) Nakar E., Granot J., Guetta D., 2004, ApJL, 606, L37. doi:10.1086/421107
- Nugent et al. (2022) Nugent A. E., Fong W.-F., Dong Y., Leja J., Berger E., Zevin M., Chornock R., et al., 2022, arXiv, arXiv:2206.01764
- Paczyński (1991) Paczyński B., 1991, Acta Astron., 41, 257.
- Paczyński (1998) Paczyński B., 1998, ApJL, 494, L45. doi:10.1086/311148
- Pais, Piran & Nakar (2023) Pais M., Piran T., Nakar E., 2023, MNRAS, 519, 1941
- Palmerio & Daigne (2021) Palmerio J. T., Daigne F., 2021, A&A, 649, A166. doi:10.1051/0004-6361/202039929
- Pescalli et al. (2016) Pescalli A., Ghirlanda G., Salvaterra R., Ghisellini G., Vergani S. D., Nappo F., Salafia O. S., et al., 2016, A&A, 587, A40. doi:10.1051/0004-6361/201526760
- Petrosian, Kitanidis & Kocevski (2015) Petrosian V., Kitanidis E., Kocevski D., 2015, ApJ, 806, 44. doi:10.1088/0004-637X/806/1/44
- Petrosian & Dainotti (2023) Petrosian V., Dainotti M. G., 2023, arXiv, arXiv:2305.15081. doi:10.48550/arXiv.2305.15081
- Salvaterra et al. (2012) Salvaterra R., Campana S., Vergani S. D., Covino S., D’Avanzo P., Fugazza D., Ghirlanda G., et al., 2012, ApJ, 749, 68. doi:10.1088/0004-637X/749/1/68
- Sazonov, Lutovinov & Sunyaev (2004) Sazonov, S. Yu., Lutovinov, A. A., Sunyaev, R. A., Nature, 2004, 430, 646. doi:https://doi.org/10.1038/nature02748
- Soderberg et al. (2006) Soderberg A. M., Kulkarni S. R., Nakar E., Berger E., Cameron P. B., Fox D. B., Frail D., et al., 2006, Natur, 442, 1014. doi:10.1038/nature05087
- Stanek et al. (2003) Stanek K. Z., Matheson T., Garnavich P. M., Martini P., Berlind P., Caldwell N., Challis P., et al., 2003, ApJL, 591, L17. doi:10.1086/376976
- Tang et al. (2019) Tang, C.-H., Huang, Y.-F., Geng, J.-J. and Zhang, Z.-B., 2019, ApJS, 245, 1.
- Tanvir et al. (2021) Tanvir N. R., Le Floc’h E., Christensen L., Caruana J., Salvaterra R., Ghirlanda G., Ciardi B., et al., 2021, ExA, 52, 219. doi:10.1007/s10686-021-09778-w
- Tarnopolski (2019a) Tarnopolski, M. 2019, ApJ, 870, 105. doi:10.3847/1538-4357/aaf1c5
- Tarnopolski (2019b) Tarnopolski, M. 2019, ApJ, 887, 97. doi:10.3847/1538-4357/ab4fe6
- Tarnopolski (2022) Tarnopolski, M. 2022, A&A, 657, 13. doi:10.1051/0004-6361/202038645
- Thomas et al. (2022) Thomas M., Trenti M., Greiner J., Skrutskie M., Forbes D. A., Klose S., Mack K. J., et al., 2022, PASA, 39, e032. doi:10.1017/pasa.2022.22
- Tsvetkova et al. (2017) Tsvetkova A., Frederiks D., Golenetskii S., Lysenko A., Oleynik P., Pal’shin V., Svinkin D., et al., 2017, ApJ, 850, 161. doi:10.3847/1538-4357/aa96af
- Virgili et al. (2011) Virgili, F. J., Zhang, B., Nagamine, K., Choi, J. H., 2011, MNRAS, 417, 3026. doi:10.1111/j.1365-2966.2011.19459.x
- Wanderman & Piran (2010) Wanderman, D., Piran, T., 2010, MNRAS, 406, 1944. doi:10.1111/j.1365-2966.2010.16787.x
- Wanderman & Piran (2015) Wanderman D., Piran T., 2015, MNRAS, 448, 3026. doi:10.1093/mnras/stv123
- Wang & Dai (2009) Wang F. Y., Dai Z. G., 2009, MNRAS, 400, L10. doi:10.1111/j.1745-3933.2009.00751.x
- Wang et al. (2020) Wang F.-F., Zou Y.-C., Liu F. X. et al., 2020, ApJ, 893, 77. doi:10.3847/1538-4357/ab0a86
- Woosley (1993) Woosley S. E., 1993, \aas, 182, 5505
- Woosley & Bloom (2006) Woosley S. E., Bloom J. S., 2006, ARA&A, 44, 507. doi:10.1146/annurev.astro.43.072103.150558
- Wu et al. (2012) Wu S.-W., Xu D., Zhang F.-W., Wei D.-M., 2012, MNRAS, 423, 2627. doi:10.1111/j.1365-2966.2012.21068.x
- Xu et al. (2013) Xu D., de Ugarte Postigo A., Leloudas G., Krühler T., Cano Z., Hjorth J., Malesani D., et al., 2013, ApJ, 776, 98. doi:10.1088/0004-637X/776/2/98
- Xu et al. (2023) Xu F., Huang Y.-F., Geng J.-J., et al., 2023, A&A, 673, A20. doi:10.1051/0004-6361/202245414
- Yu et al. (2015) Yu H., Wang F. Y., Dai Z. G., Cheng K. S., 2015, ApJS, 218, 13. doi:10.1088/0067-0049/218/1/13
- Yüksel et al. (2008) Yüksel H., Kistler M. D., Beacom J. F., Hopkins A. M., 2008, ApJL, 683, L5. doi:10.1086/591449
- Zhang et al. (2009) Zhang B., Zhang B. B., Virgili F. J., et al., 2009, ApJ, 703, 1696. doi: 10.1088/0004-637X/703/2/1696
- Zhang (2018) Zhang B., 2018, The Physics of Gamma-Ray Bursts. Cambridge Univ. Press, New York, doi:10.1017/9781139226530
- Zhang & Wang (2018) Zhang G. Q., Wang F. Y., 2018, ApJ, 852, 1. doi:10.3847/1538-4357/aa9ce5
- Zhang et al. (2021) Zhang, K., Zhang, Z. B., Huang, Y. F., et al., 2021, MNRAS, 503, 3262.
- Zhang et al. (2020a) Zhang, X. L., Zhang, C. T., Li, X. J., et al., 2020a, RAA, 20, 201. doi:10.1088/1674-4527/20/12/201
- Zhang & Choi (2008) Zhang Z.-B., Choi C.-S., 2008, A&A, 484, 293. doi:10.1051/0004-6361:20079210
- Zhang et al. (2016) Zhang, Z. B., Yang, E.-B., Choi, C.-S., et al. 2016, MNRAS, 462, 3243. doi:10.1093/mnras/stw1835
- Zhang et al. (2018) Zhang Z. B., Zhang C. T., Zhao Y. X., Luo J. J., Jiang L. Y., Wang X. L., Han X. L., et al., 2018, PASP, 130, 054202. doi:10.1088/1538-3873/aaa6af
- Zhang et al. (2020b) Zhang, Z. B., Jiang, M., Zhang, Y., et al. 2020b, ApJ, 902, 40. doi:10.3847/1538-4357/abb400
- Zhu et al. (2021) Zhu J.-P., Wang K., Zhang B., Yang Y.-P., Yu Y.-W., Gao H., 2021, ApJL, 911, L19. doi:10.3847/2041-8213/abf2c3
- Zhu et al. (2021) Zhu J.-P., Zhang B., Yu Y.-W., Gao H., 2021, ApJL, 906, L11. doi:10.3847/2041-8213/abd412