Smart Pressure e-Mat for Human Sleeping Posture and Dynamic Activity Recognition
Abstract
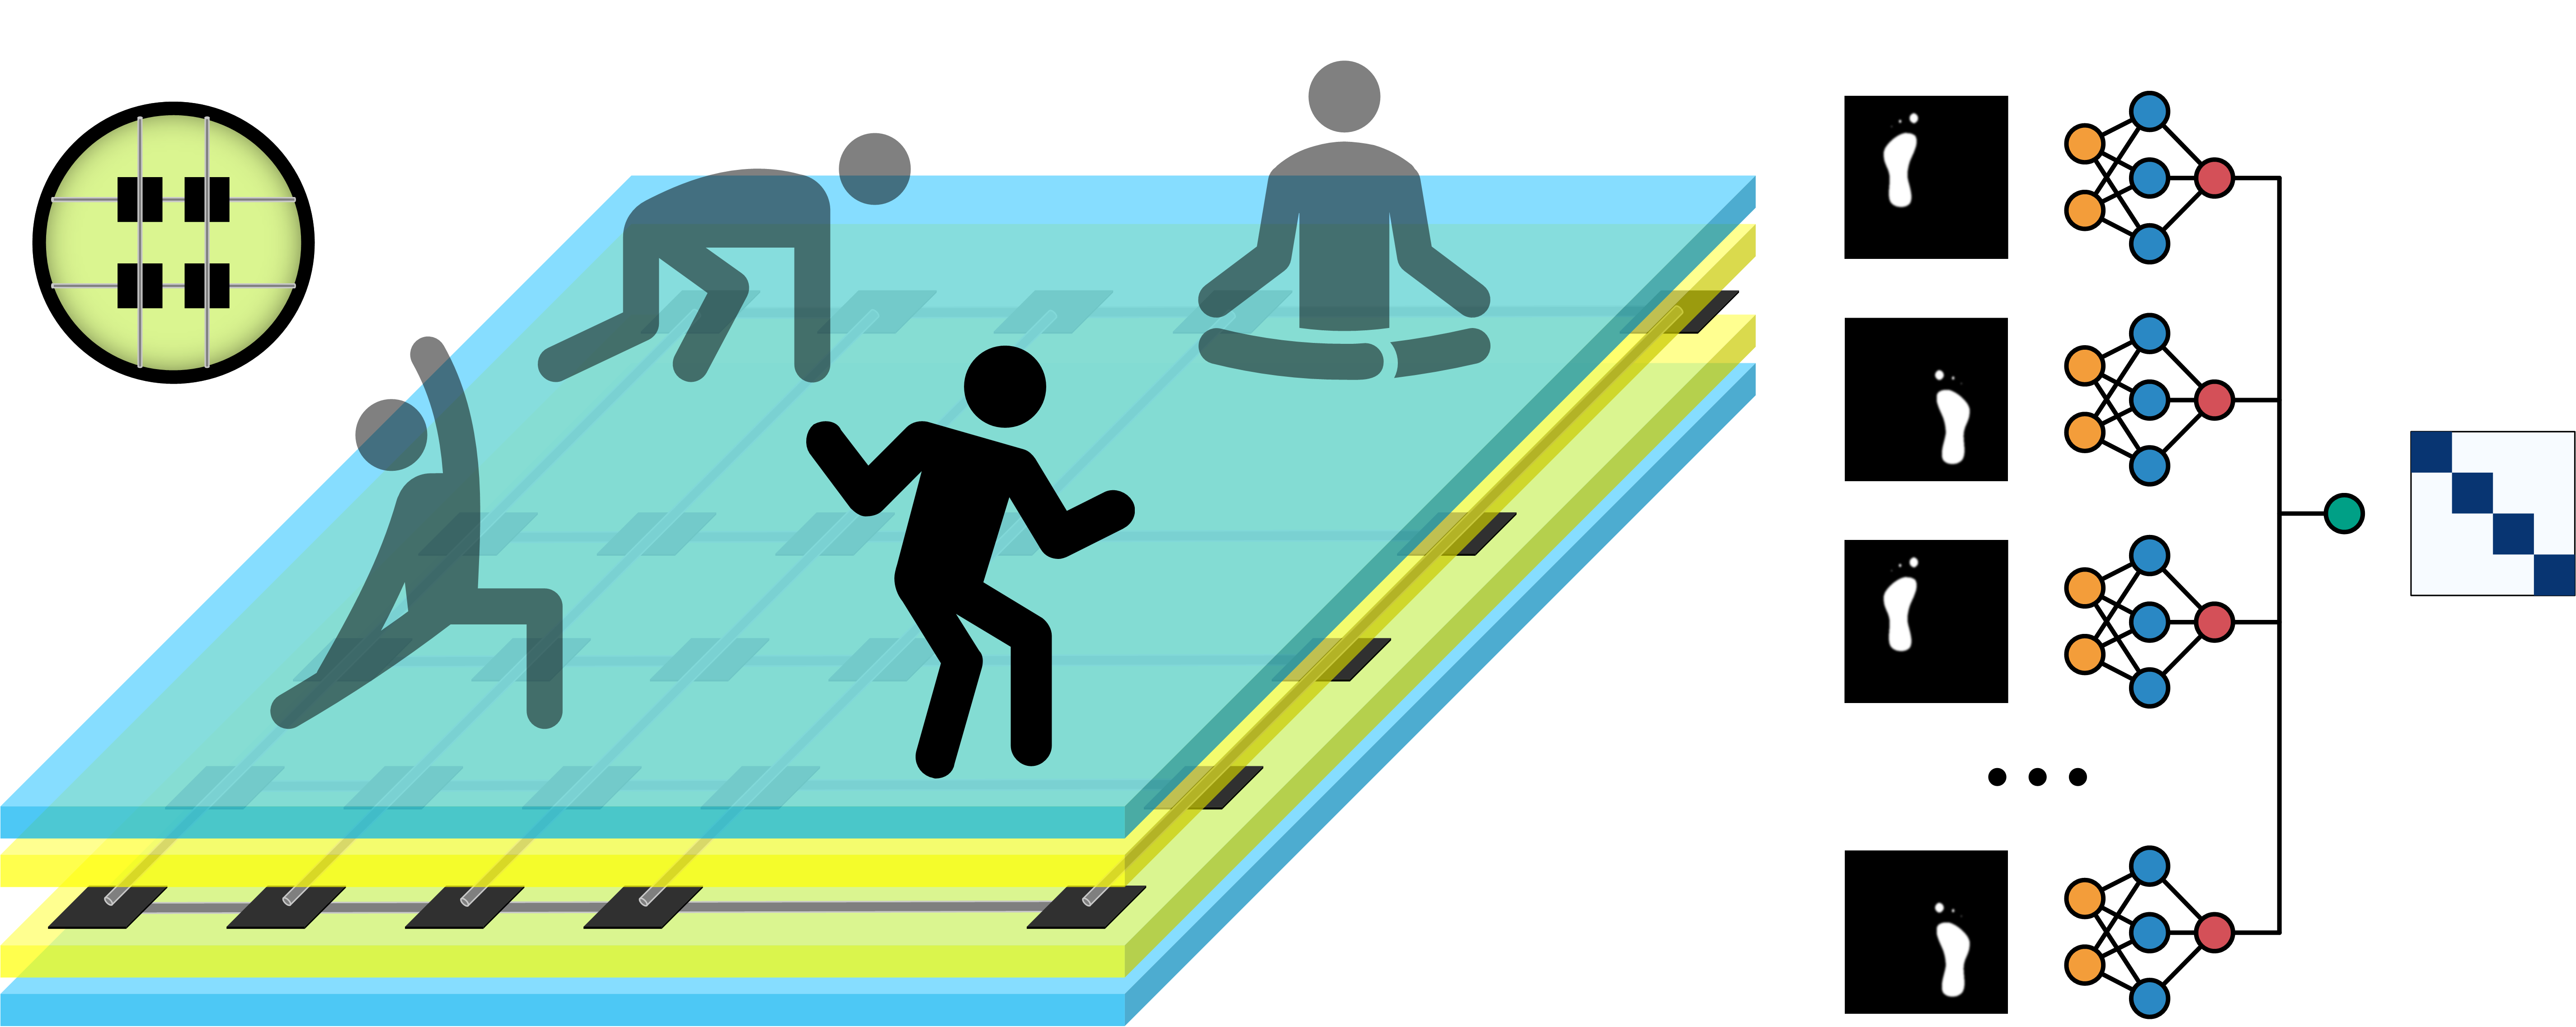
With the emphasis on healthcare, early childhood education, and fitness, non-invasive measurement and recognition methods have received more attention. Pressure sensing has been extensively studied due to its advantages of simple structure, easy access, visualization application, and harmlessness. This paper introduces a smart pressure e-mat (SPeM) system based on a piezoresistive material Velostat for human monitoring applications, including sleeping postures, sports, and yoga recognition. After a subsystem scans e-mat readings and processes the signal, it generates a pressure image stream. Deep neural networks (DNNs) are used to fit and train the pressure image stream and recognize the corresponding human behavior. Four sleeping postures and five dynamic activities inspired by Nintendo Switch Ring Fit Adventure (RFA) are used as a preliminary validation of the proposed SPeM system. The SPeM system achieves high accuracies on both applications, which demonstrates the high accuracy and generalization ability of the models. Compared with other pressure sensor-based systems, SPeM possesses more flexible applications and commercial application prospects, with reliable, robust, and repeatable properties.
Index Terms:
Pressure sensor, human sensing, activity recognition, healthcare, deep learning.I Introduction
HUMAN activity recognition (HAR) aims to identify activities through a snapshot of observations of the subject’s behavior and environmental conditions. Research on HAR has been most widely used in healthcare [1, 2], sports [3], human-computer interaction (HCI) [4], security [5], and robotics [6]. The mainstream mechanism of HAR is divided into wearable sensors and external devices. Wearable sensors are widely used in the HAR field [7, 8, 9, 10], because of they fit to human body, valid signal, compact sensor size, better spatial freedom, and the ability to work in various complex environments. However, wearable sensors suffer from the drawback of requiring the subject to wear or mount multiple sensors on different parts of the body. External devices are deployed to observe, detect, recognize, and segment human features in the scenario. Vision-based recognition methods involve computer vision (CV) [11, 12, 13], usually using RGB, depth, infrared, and thermal imaging cameras. The basic idea is to take the whole image as input and show the pixel coordinates of key points of the body. Because of the non-contact measurement, the wider corresponding spectral range, and the ability to work stably for a long time for vision inspection, CV systems are widely used in industry, agriculture, defense, transportation, medicine, entertainment, and so on [14]. Vision-based HAR has some inherent limits, e.g., the data acquisition is seriously affected by the lighting or temperature of the environment [15] and involves privacy concerns [16]. Other kinds of external HAR methods, such as radio frequency (RF) sensors [17, 18], can accurately classify human subjects and activities, but most of them are hard to visualize human behavior.
I-A Velostat-Based Application
Inspired by the mechanism that humans have sensory functions when they are in direct contact with the external environment [19], tactile sensing is widely used in the fields of intelligent HCI technology and biomedical monitoring, which is an essential means of data acquisition, analysis, and control of machines to perceive the external environment. Pressure sensing is the tactile sensing mode used in this paper. It has diversified production methods, strong versatility, and convenient configuration, ensuring lower production costs and more uses. Pressure sensors have multiple sub-categories, including capacitive, piezoelectric, optical, piezoresistive, etc [20]. Velostat [21], also known as Linqstat, is a packaging material made of polymer foil impregnated with carbon black to make it conductive. Velostat-based piezoresistive pressure sensor arrays have been widely studied and used in recent years. Despite its non-ideal electrical properties and crosstalk in numerous recent studies [22, 23, 24], its low price, flexibility, and scalability have attracted attention. In this paper, we select a Velostat sensor array as a tool to collect pressure distribution and complete HAR with deep learning (DL).
| Literature | Tasks | Material | Length Width (m m) | Resolution () | Price (USD) | Foldable |
|---|---|---|---|---|---|---|
| Tactilus [25] | N/A (Commercial Sensor System) | ? | 1.830 0.603 | 31.0 37.7 | 7200 | ? |
| Tekscan 5400N [26] | N/A (Commercial Sensor System) | ? | 1.060 0.640 | 17.0 17.0 | ? | ? |
| Fatema et al. [27] | • Object Movement Detection | Velostat | 0.300 0.300 | 75 75 | ? | ✗ |
| Yuan et al. [22] | • Object Recognition | Velostat | 0.140 0.140 | 5 5 | 25 | ✗ |
| Sun et al. [28] | • Respiratory Waveform Reconstruction | Velostat | 0.385 0.360 | 9 9 | ? | ✓ |
| Wan et al. [29] | • Sitting Posture Recognition | ? | 0.365 0.365 | 11.5 11.5 | 150 | ✗ |
| Yuan et al. [30] | • Sitting Posture Recognition | Velostat | 0.381 0.381 | 11.3 11.3 | 45 | ✓ |
| Tang et al. [31] | • Sleeping Posture Recognition | Velostat | 2.000 1.000 | 100 100 | 51 (sensor) | ✗ |
| Hu et al. [32] | • Sleeping Posture Recognition | Velostat | 1.800 0.900 | 54.5 27.2 | 130 (sensor) | ✓ |
| Hudec et al. [33] | • Sleeping Posture Recognition | Velostat | 0.900 0.900 | 100 100 | ? | ✓ |
| Sundholm et al. [34] | • Activity Pattern Recognition | CarboTex | 0.800 0.800 | 10 10 | ? | ✓ |
| Zhou et al. [35] | • Subject Gait Identification | CarboTex | 1.800 0.800 | 15 15 | ? | ✓ |
| Wicaksono et al. [36] | • Activity Pattern Recognition | Polypyrrole | 0.450 0.450 | 25 25 | ? | ✓ |
| This Paper | • Sleeping Posture Recognition • Dynamic Activity Recognition | Velostat | 2.030 1.525 | 67.3 52.3 | 220 | ✓ |
-
•
✓ Yes, ? No report, ✗ No.
The pressure sensor array aims to convert the vertically oriented pressure input into a standard grayscale image. With DL algorithms such as convolutional neural networks (CNNs) that have excellent performance in image recognition and processing, the framework of DL and pressure sensor array is able to classify contact objects with high accuracy. Tang et al. [31] designed a pressure mattress with Velostat material for hospice care of the elderly. The internet of things (IoT) based solution used sensors to record the patient’s posture-related data and transmitted it to the cloud for further processing. Hu et al. [32] developed an on-the-fly human sleep recognition system using pressure sensitive conductive sheet and a four-layer CNN architecture for sleep classification, with transfer learning to prevent overfitting and improve classification accuracy. Yuan et al. [22] established an object recognition broad to classify ten objects and conducted a systematic material analysis and study of Velostat, including resistance sensitivity, quasi-static response, and crosstalk issues. Zhang et al. [37] focused on gait recognition using a combination of pressure signals and acceleration signals to make up for the lack of data provided by a single sensor and transmitted the data to a computer for signal processing, and building a k nearest neighbor (kNN) model to test gait pattern recognition effect. Chen et al. [38] explored DL algorithms including ResNet50, InceptionV3, and MobileNet to identify differences in the response of walking speed to plantar pressure. Jun et al. [39] performed pathological gaits classification, feeding the sequential skeleton and average foot pressure data into a recurrent neural network (RNN) based encoding layers and CNN-based encoding layers, respectively. The method effectively extracted features, then output features were connected and fed to a fully connected layer for classification. Ghzizal et al. [40] used transfer learning of a pre-trained CNN to classify patients with Parkinson’s disease. Tactile perception is an important research direction in the field of robotics and artificial skin. We summarize the details of the state-of-the-art pressure sensor array technologies in Table I.
I-B Dynamic Pattern Recognition
Pressure pattern in the physical world, especially tactile sensing in relation to humans, is a dynamic modality. Different people have different physical characteristics and behavioral habits, which affects the generation of pressure distribution. Meanwhile, the non-ideal properties of most pressure sensors, especially piezoresistive sensors also cause nonlinear effects on resistance and conductance. It is difficult for traditional classifiers to handle such tasks. Therefore, it is a trend to use DL algorithms to classify a series of dynamic pressure images, known as a stream of pressure images. There are traceable solutions for image stream or video recognition. In the field of image sequence recognition, convolutional recurrent neural network (CRNN) is used for text extraction of language in image [41] and video classification [42], in which long short-term memory (LSTM) is used to integrate CNNs. It is also a common practice for researchers to recognize dynamic pressure image sequences using integrated CNNs. Song et al. [43] utilized a similar CRNN architecture to identify four modes of flexible tactile sensors, including stroking, patting, kneading, and scratching. Sundaram et al. [44] demonstrated tactile gloves for object-grasping robotics, in which a convolutional layer was used to integrate CNNs and employed to recognize the type of objects and judge the responding gestures of the robotics. Therefore, deep neural network (DNN) algorithm is used as the pressure pattern recognition method in this paper, and the performances of the three methods are discussed and compared.
I-C Motivation and Contribution
Our motivation received inspiration and impetus from augmented reality, HCI, healthcare, etc. This work aims to introduce a flexible, non-invasive, portable, and inexpensive pressure sensor system into the above areas of application. On the one hand, pressure can be a Boolean feedback as a single-dimensional signal detection method. On the other hand, the pressure distribution formed by the human body on a pressure array can generate a visualized pressure image. Gumus et al. [45] presented a textile-based pressure sensor array, which was capable of displaying the shape of objects, recognizing gestures, and early childhood education. Children could input and display numbers, arithmetic symbols, and English letters on an Android mobile phone by pressing them on the education platform. Wicaksono et al. [36] developed a knitted intelligent textile mat to control the standing, walking, and running behavior of the characters in the Minecraft video game. Therefore, this paper also explores the application of pressure sensor arrays in gaming, such as sports and yoga. Specifically, an e-mat made of a pressure sensor array is placed in an indoor environment, and activities are classified according to the different pressure distributions generated by different activities such as standing, running, sitting, lying, etc.
In this paper, a pressure sensor-based system, smart pressure e-mat (SPeM), for human sleeping posture and dynamic activity recognition is proposed, as shown in Fig. 1. SPeM consists of a pressure sensor array e-mat based on Velostat piezoresistive material and a DNN classifier. After demonstrating the fabrication of pressure sensor e-mat, a DNN algorithm with three alternate architectures are designed to process the pressure image stream. SPeM collects two datasets, including four sleeping postures and five dynamic activities, which are used to train different DNN models, respectively. After the evaluation and discussion of the experiment results, our SPeM system is considered as a high-accuracy, low-cost, and convenient human monitoring application. The contributions of this paper are:
-
1.
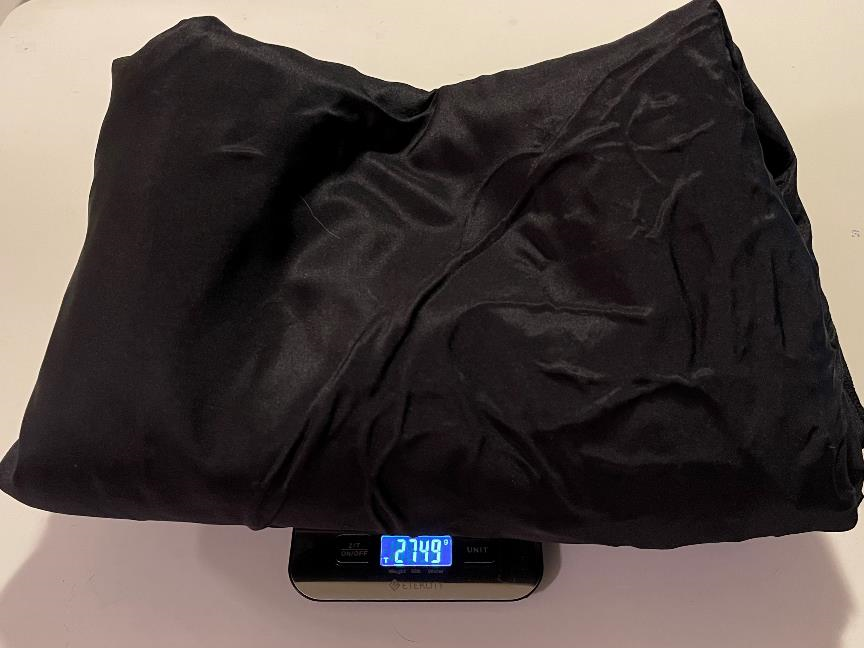
A Velostat sensor array-based SPeM is designed and established to generate human pressure patterns. SPeM is low in price, foldable, portable, flexible, and low weight, with a length of 2.030 meters, a width of 1.525 meters, a height of fewer than 0.001 meters, total weight is 2749 grams, and its total price is 220 USD. The resolution of can ensure the generated pressure images are easily processed and have potential visualization applications.
-
2.
Considering healthcare, sport, gaming, early childhood education, entertainment, and other application scenarios, SPeM is used to monitor human postures and dynamic activities at home scenarios. We collected human pressure pattern datasets in two different scenarios, including four sleeping postures and five dynamic activities, including a total of 14,000 image stream samples, each containing ten image frames.
-
3.
DNN algorithm is used to recognize static and dynamic pressure images, achieving high accuracies on sleeping posture and dynamic activity recognition. Experiment results demonstrate that the proposed SPeM can effectively capture the pressure modalities generated by human activities, which provides a high-precision, complete, and visualized paradigm and instance.
The presentation of the work is as follows. In Section II, the methodology of this work is described. The experimental setups and results are demonstrated in Section III. Some discussions of comparison with other methods are given in Section IV prior to the conclusion and future work drawn in Section V.
II Methodologies
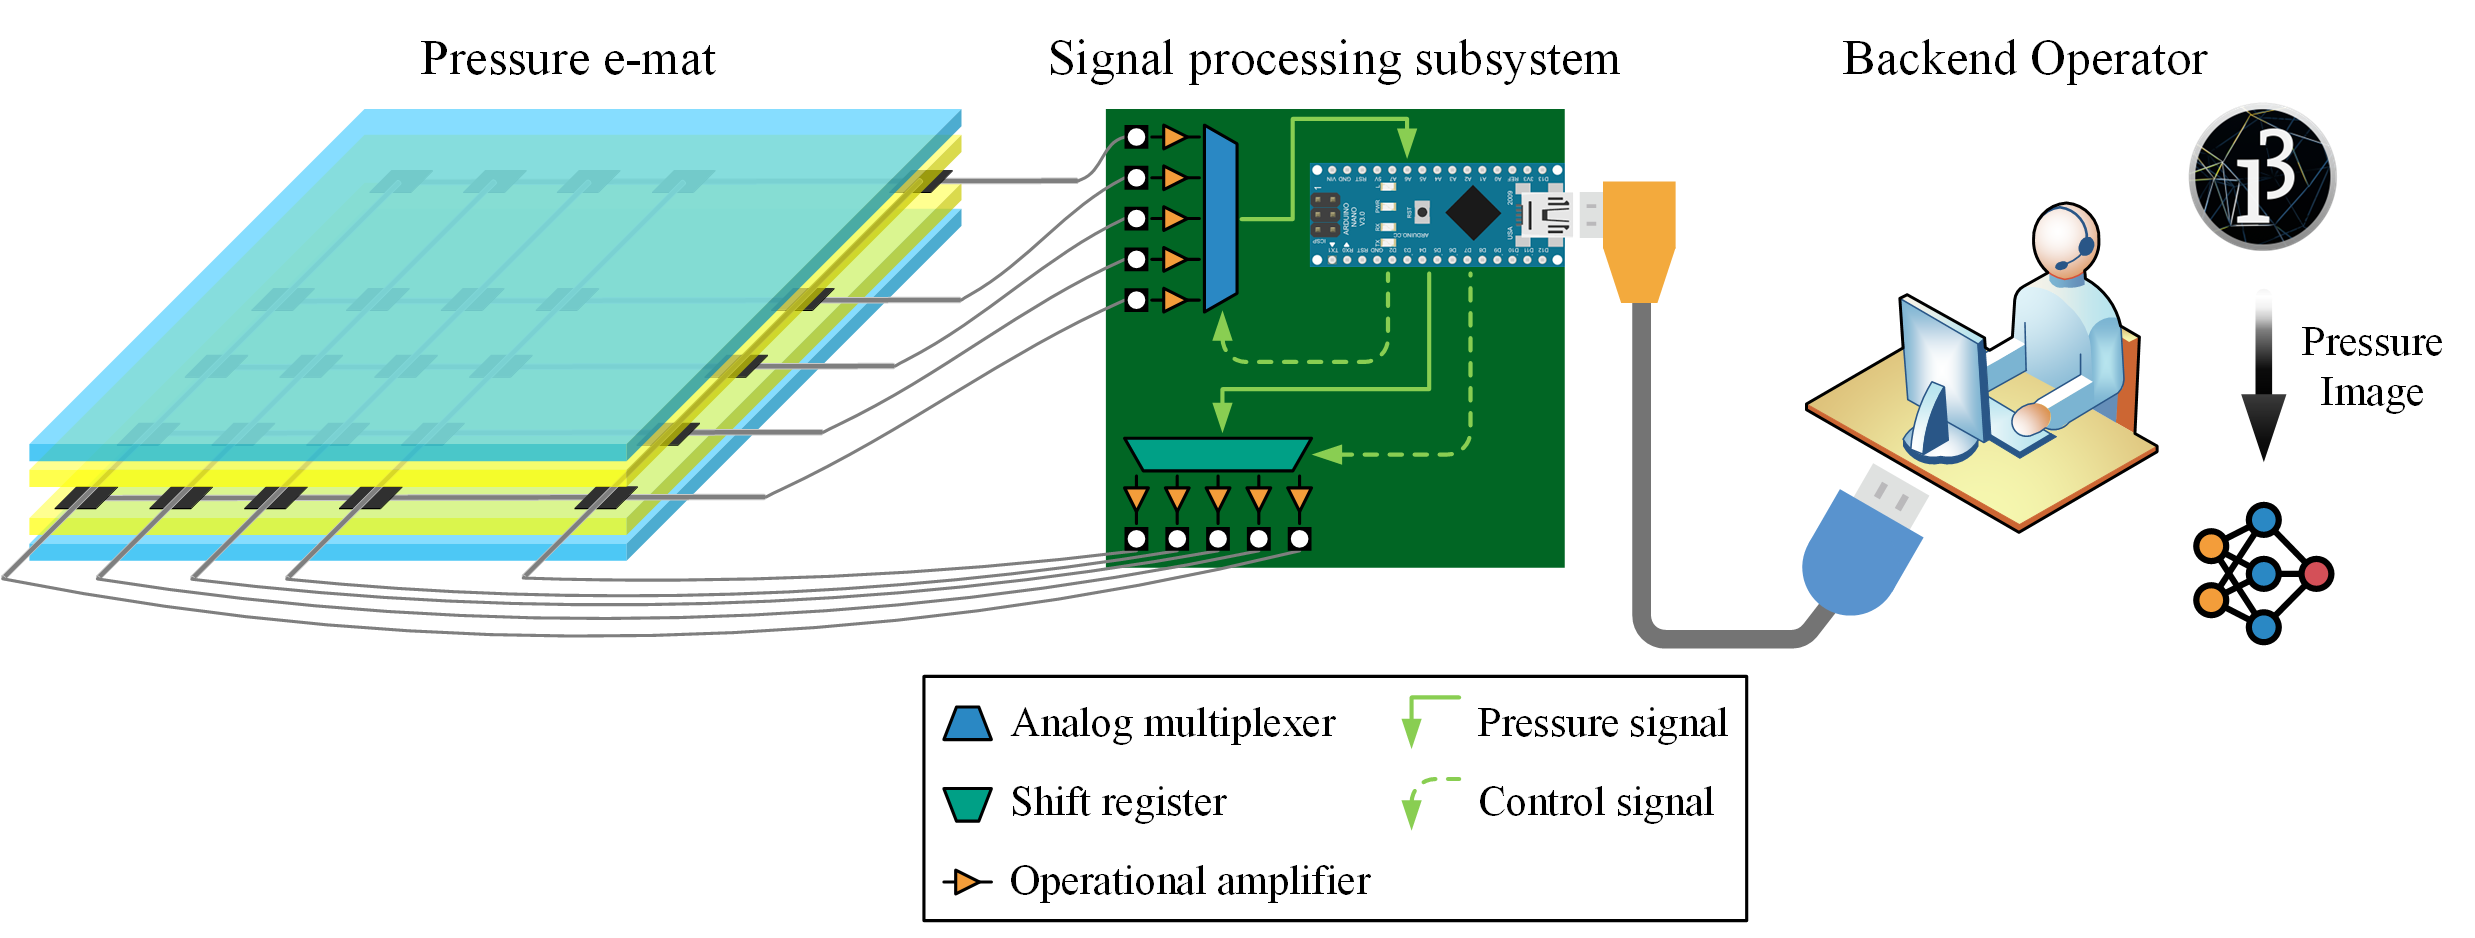
This section presents the proposed SPeM system, including the fabrication of the Velostat pressure sensor array-based e-mat and the design of the DNN algorithm. The schematic diagram of the proposed SPeM system design is presented in Fig. 2.
II-A Smart Pressure e-Mat System Design
The proposed SPeM system comprises a pressure e-mat for sensing, a signal processing subsystem for calibration, scanning, and sampling, and a backend for visualization and classification. The signal processing subsystem consists of a printed circuit board (PCB) integrated with analog multiplexers, shift registers, and operational amplifiers, and embedded with an Arduino Nano as the central signal processing unit. To generate pressure images in real-time for visualization and classification, a Processing program is run by the backend operator, which utilizes the voltage distribution produced by the signal processing subsystem. The human body exerts varying pressure on the pressure e-mat depending on different tasks, resulting in distinct resistance distributions. Arduino controls analog multiplexers and shift registers to scan the pressure mat line by line and obtain the corresponding analog voltage distribution. Therefore, the quality of the pressure image relies on the ability of the pressure cushion to completely, accurately, and reliably receive the human body pressure distribution.
II-B Fabrication of SPeM
For the Velostat pressure sensor array, the pressure distribution represented by the pressure image is only related to the Velostat resistance at the intersections of the row and column of conductive lines, i.e., the pressure sensor elements, and the pressure distribution between elements is not sampled. Separated sensor elements, i.e., using cut Velostat instead of a whole piece of Velostat, is a viable approach to avoid wasting material in inactive areas, as shown in Fig. 3. Separated sensor elements have three advantages: saving material, avoiding stray current flowing through the Velostat resistance material to adjacent elements, and avoiding the deformation caused by human body pressure to affect adjacent elements through the material. The design approach of separated Velostat sensor elements can reduce the use of Velostat material by 64. Meanwhile, separated sensor elements need to be distinguished from independent sensor elements. The independent sensor element is that each sensor element does not share the input and output circuits with other elements, while each row and each column of separated sensor elements share the input and output circuits, respectively. Therefore, compared with independent sensor elements, separated sensor elements have a minimal number of input and output ports, resulting in a simpler signal processing subsystem, but there will inevitably be crosstalk. Independent sensor elements are more suitable for a small number of elements requirement, while separated sensor elements are required in large sensor arrays.
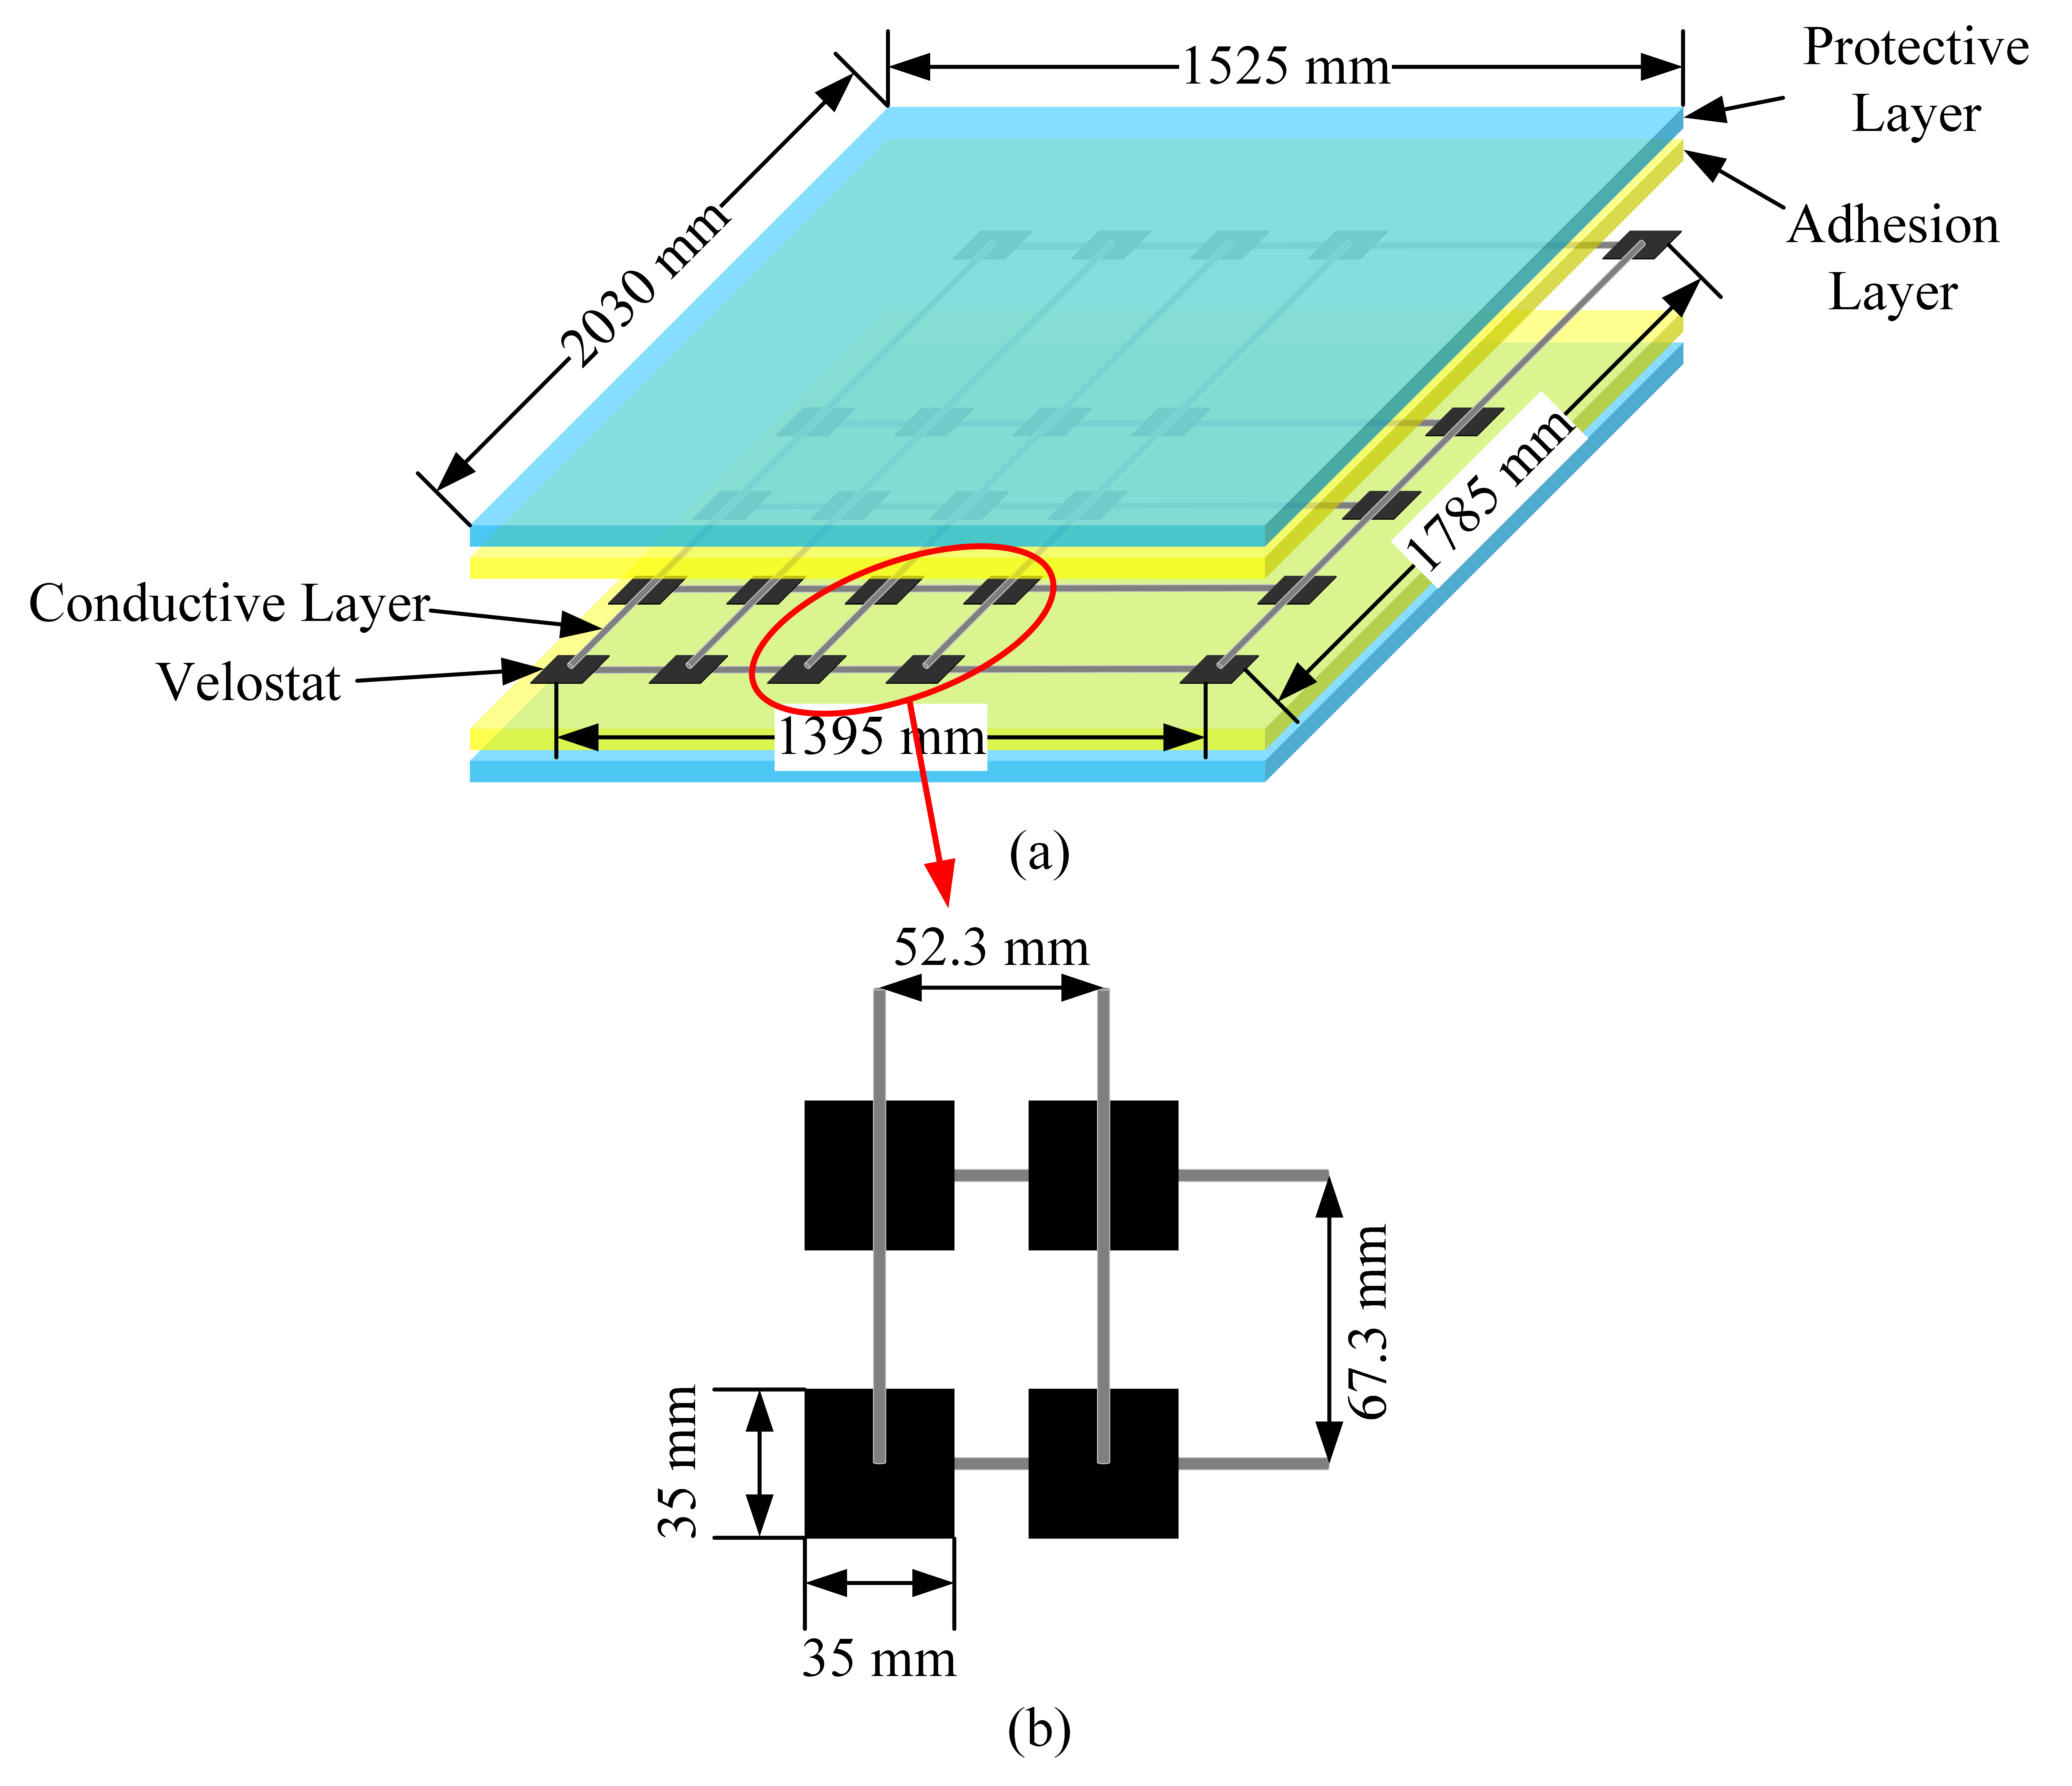
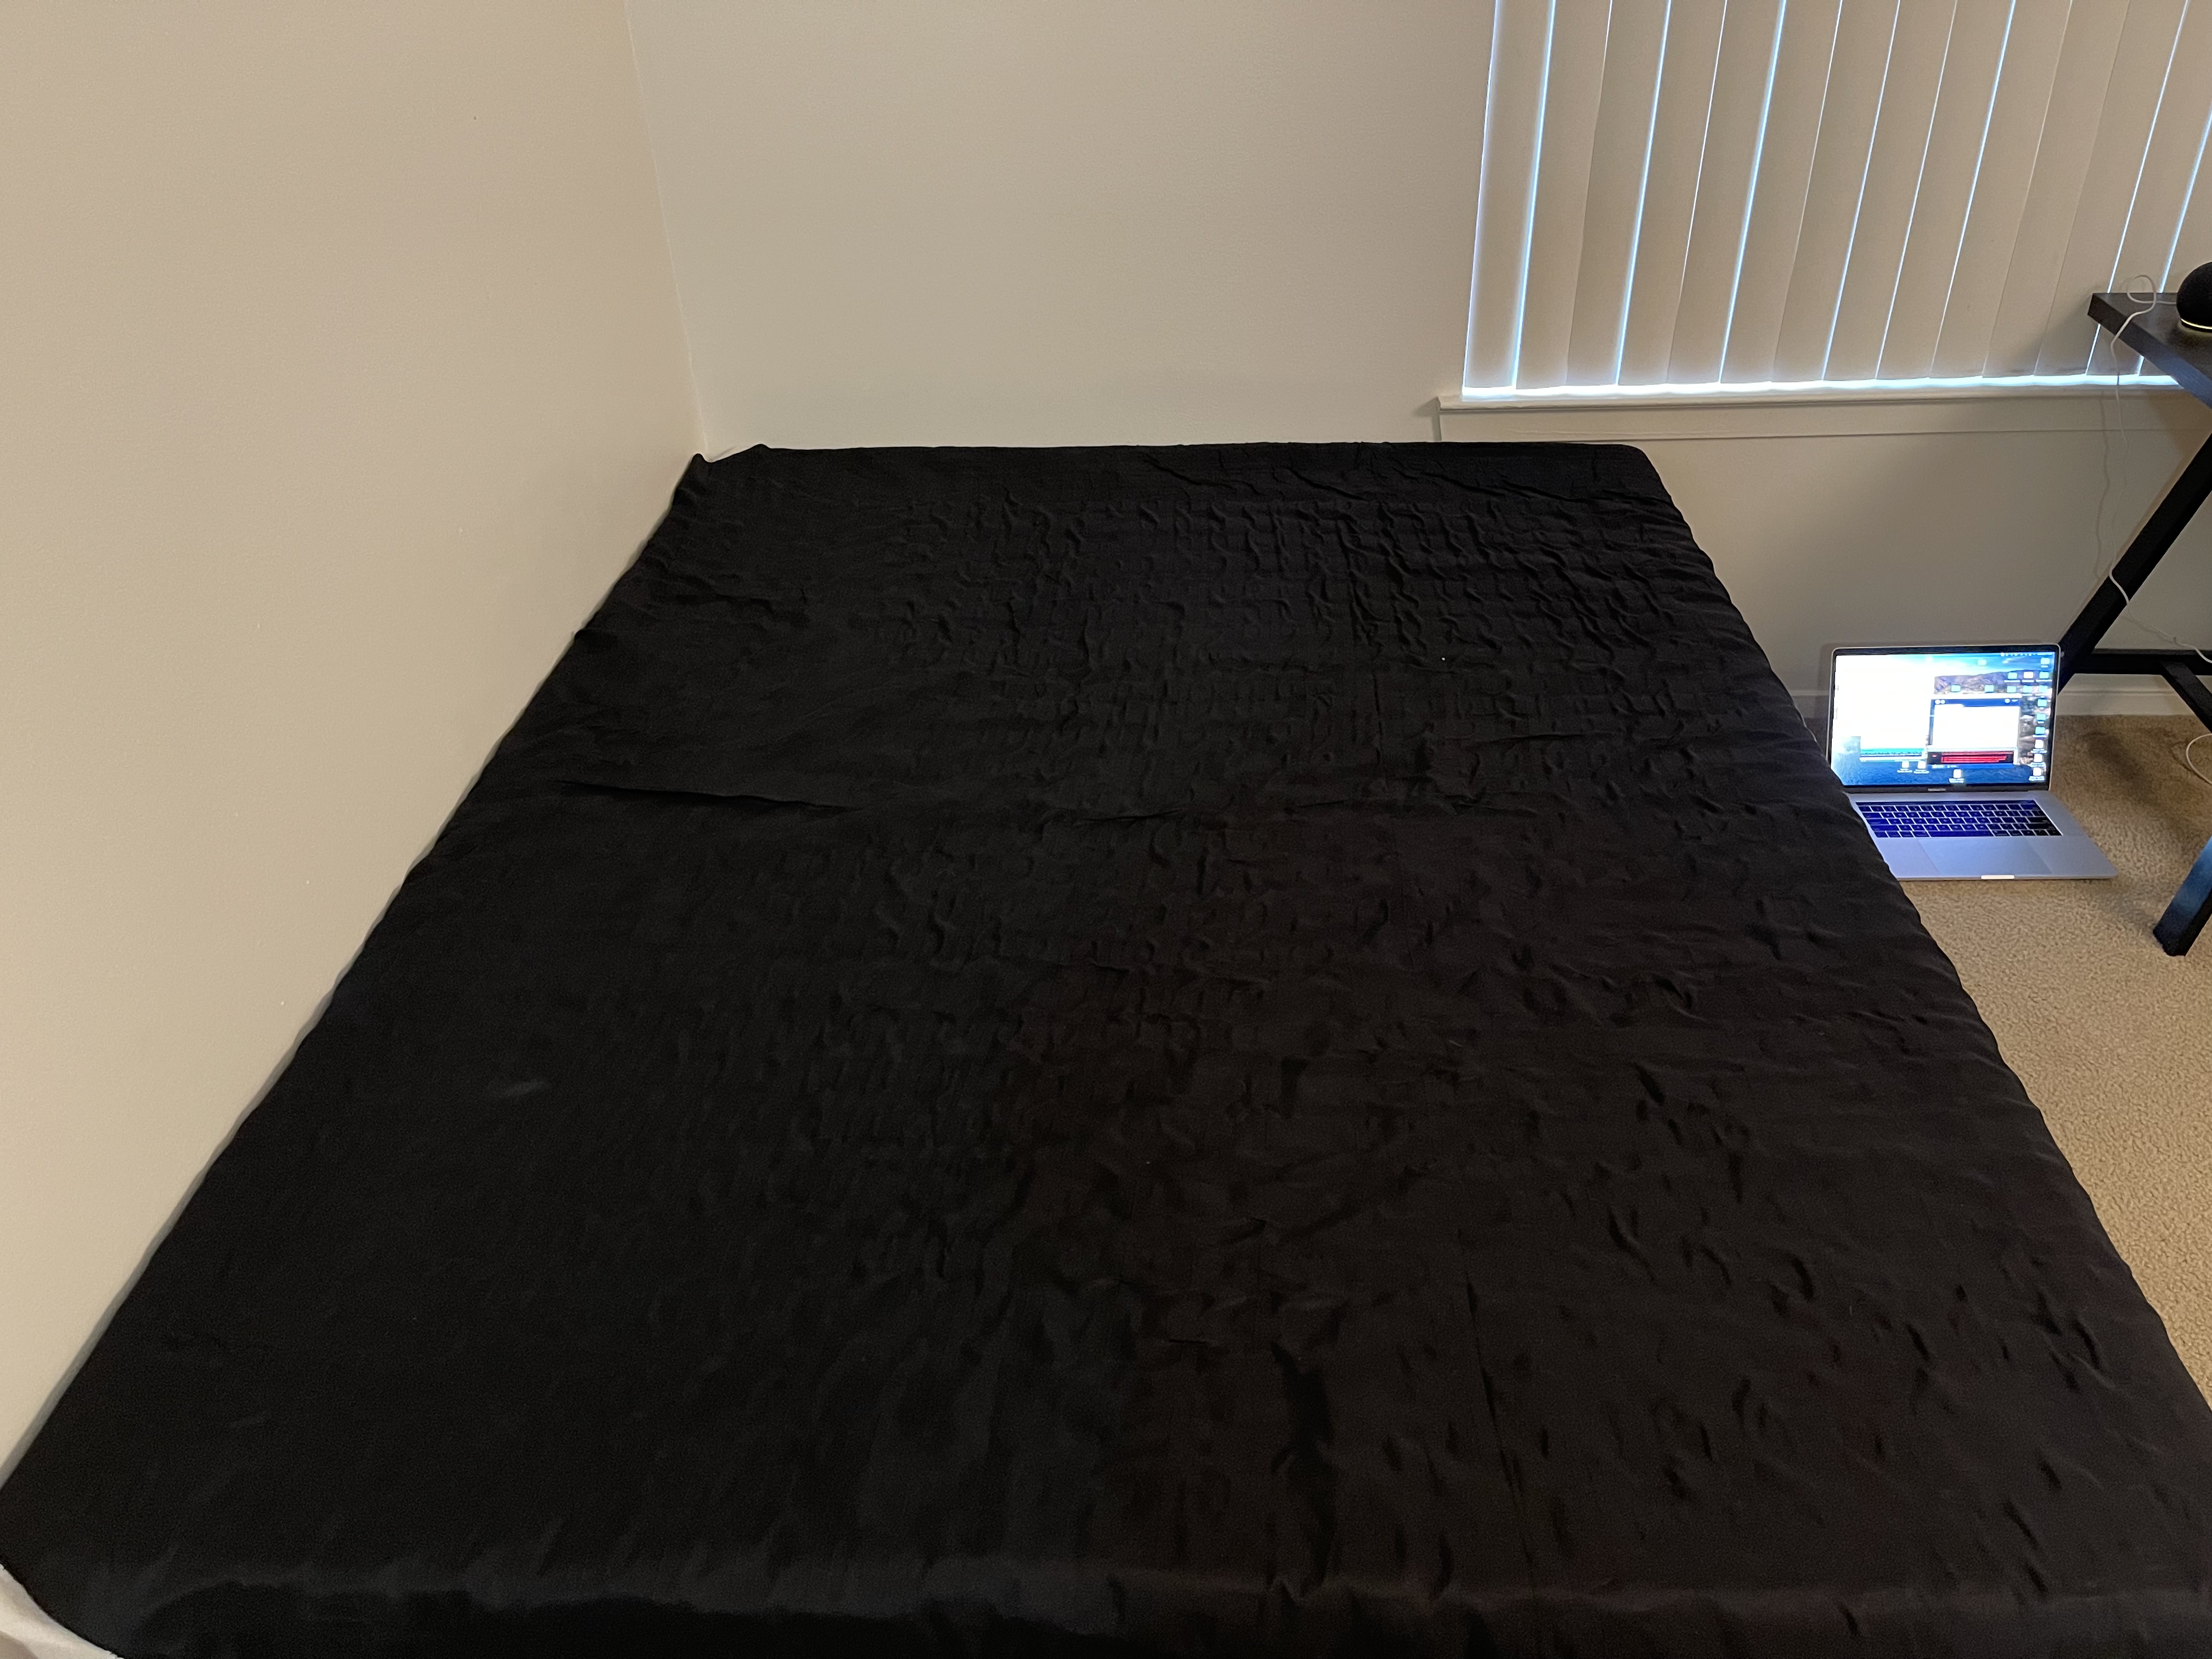
Fig. 3a shows the general structure and size of e-mat, which consists of five layers, and two adhesive layers to fix the upper and lower protective layers with the middle conductive layer, respectively. The protective layers are polyester due to their cheap, wrinkle-resistant, durable, and soft properties. The adhesive layers are acrylic, which is not only soft but also firm and efficient for bonding multiple objects together, such as protective layers, conductive threads, and Velostat. The conductive threads are stainless steel fiber, which is famous for its role in conductive fabrics, and we have taken a fancy to its softness. Therefore, the soft property of the selected material is the core consideration, leading to the suitability of the fabricated e-mat for human-related applications. Unlike other Velostat-based pressure sensor arrays, the distances between sensor elements in the vertical and horizontal directions of the e-mat are not equidistant, as shown in Fig. 3b. In order to conform to the length and width of the human body when lying on the bed, the size of e-mat is set to be equal to the Queen size, and the actual sensing area is slightly smaller than the bed sheet. Fig. 4a shows the Smart Bed Sheet placed on a Queen size mattress for collecting subject sleeping posture data. The fabricated Smart Bed Sheet is flexible, soft, and portable, and Fig. 4b shows its foldability and low weight. We summarize the parameters of the proposed SPeM in Table II.
| Item | Description |
|---|---|
| Length Width (m m) | 2.030 1.525 |
| Resolution () | 67.3 52.3 |
| Weight (gram) | 2749 |
| Price (USD) | 220 |
| Image sample rate (Hz) | 2 |
| Image stream sample rate (Hz) | 0.2 |
| Image stream resolution (pixel) | 27 27 1 10 |
II-C Deep Neural Network for Image Stream
In this paper, we advocate the use of an end-to-end DNN as a pressure image stream classifier to achieve both human sleeping posture and dynamic activity recognition. CNN is one of the leading solutions for image classification problems. However, how to handle the temporal relationship between images after 2D convolution is still an open problem. In pressure image classification tasks, the sample is 3D tensors and the label is , where is the image length, is the width, and is the channel. and are real number set and natural number set, respectively. The length , width , and channel of the pressure image are determined by the actual manufacture of the pressure sensor e-mat. While the classification tasks proposed in this paper are based on an image stream, also known as video, the sample is a 4D tensor , where is a customized number of images in the stream, depending on the application requirements. In this paper, the sample dimensions are . Considering the nonlinear resistance characteristics of the Velostat material, the image stream generated by SPeM depends not only on the pressure distribution of human activity but also on the electrical sensitivity of the Velostat based on the resulting pressure distribution. Specifically, the resistance sensitivity is higher when the activity generates greater pressure, and the pressure is applied for a shorter time, and vice versa. Considering the task of human sleep posture recognition with a large pressure distribution area and a lengthy application time, even if it is a static human activity, the stream still presents different pressure images due to the nonlinear resistance characteristics of Velostat. In addition to the above two factors of activity and Velostat nonlinear characteristics, possible secondary factors include the subject’s personal habits, noise, etc.
Therefore, the critical thing is to find the temporal relationship of pressure images. Due to the excellent performance of CNN in image processing, it is used as a feature extractor to extract a high-level representation of human pressure patterns. Subsequently, the temporal relationships between images in a stream also need to be processed by neurons. Consequently, after CNNs are used to extract image tensors , a final layer process the relationship between images in the stream, as a DNN classifier of the proposed SPeM system. Specifically, we consider [22] proposed CNN ResNet-PI as the pressure image feature extractor of DNN. ResNet-PI reduces the number of model parameters by removing one residual block from ResNet-18 [46]. ResNet-PI, as a lightweight CNN, not only reduces the computational complexity but also avoids overfitting on pressure image data with a small number of features. Therefore, the DNN algorithm uses a temporal feature-level concatenation of ResNet-PIs, using pending convolution (Conv), long short-term memory (LSTM), or fully-connected (Dense) to process the temporal relationships. Fig. 5 shows the proposed DNN with three alternate architecture integrating ResNet-PIs.
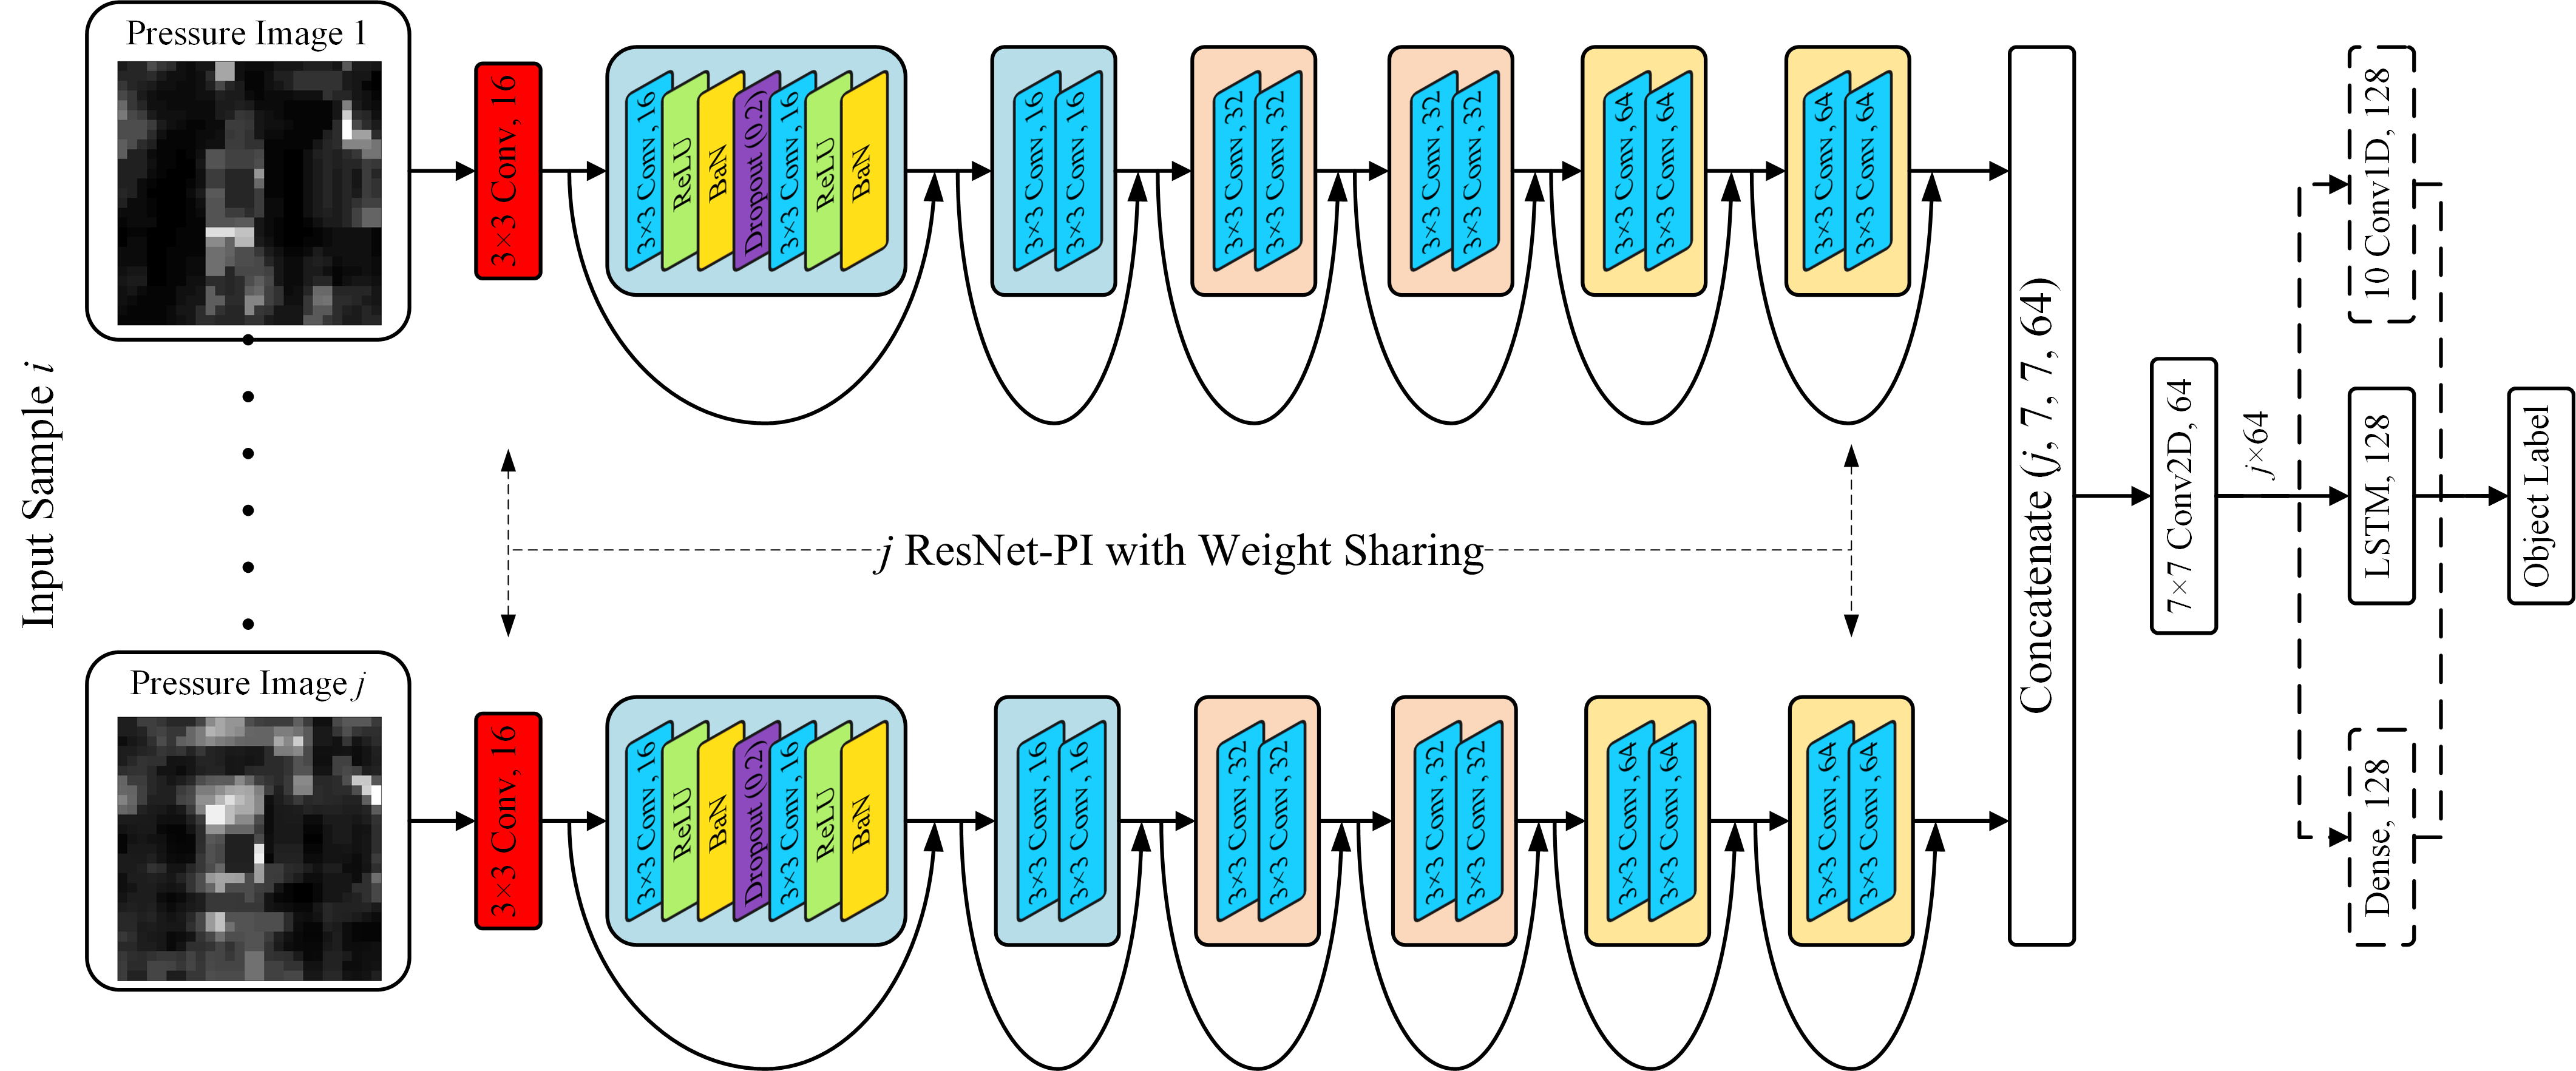
The proposed DNN can adjust the number of sub-CNN according to the number of pressure images. Considering the need of recognition speed for human monitoring applications, the experiment in this paper considers a sample including pressure images, which results in a sampling time of five seconds for each sample. Considering that sub-CNNs are only used as feature extractors here, they can increase the learning efficiency and reduce the computational complexity by sharing weights. A Dropout layer is inserted into each ResNet block to further enhance the generalization ability of the proposed DNN. The entire process of generating the pressure image stream dataset and training the DNN model by the SPeM system is elaborated in Algorithm 1.
Input: Initial DNN model , training epochs , learning rate , loss function , Adam optimizer.
Output: Trained DNN model
III Experiment and Results
This section is organized as follows to illustrate the experiments and results of this paper. After introducing the non-ideal properties of Velostat and subject information, we conduct two experiments, including human sleeping posture and activity recognition, respectively. A sports game is introduced as an indicator for our activity recognition. The experiment also compares the performances and results of different DNN architectures.
III-A Velostat Non-ideal Properties
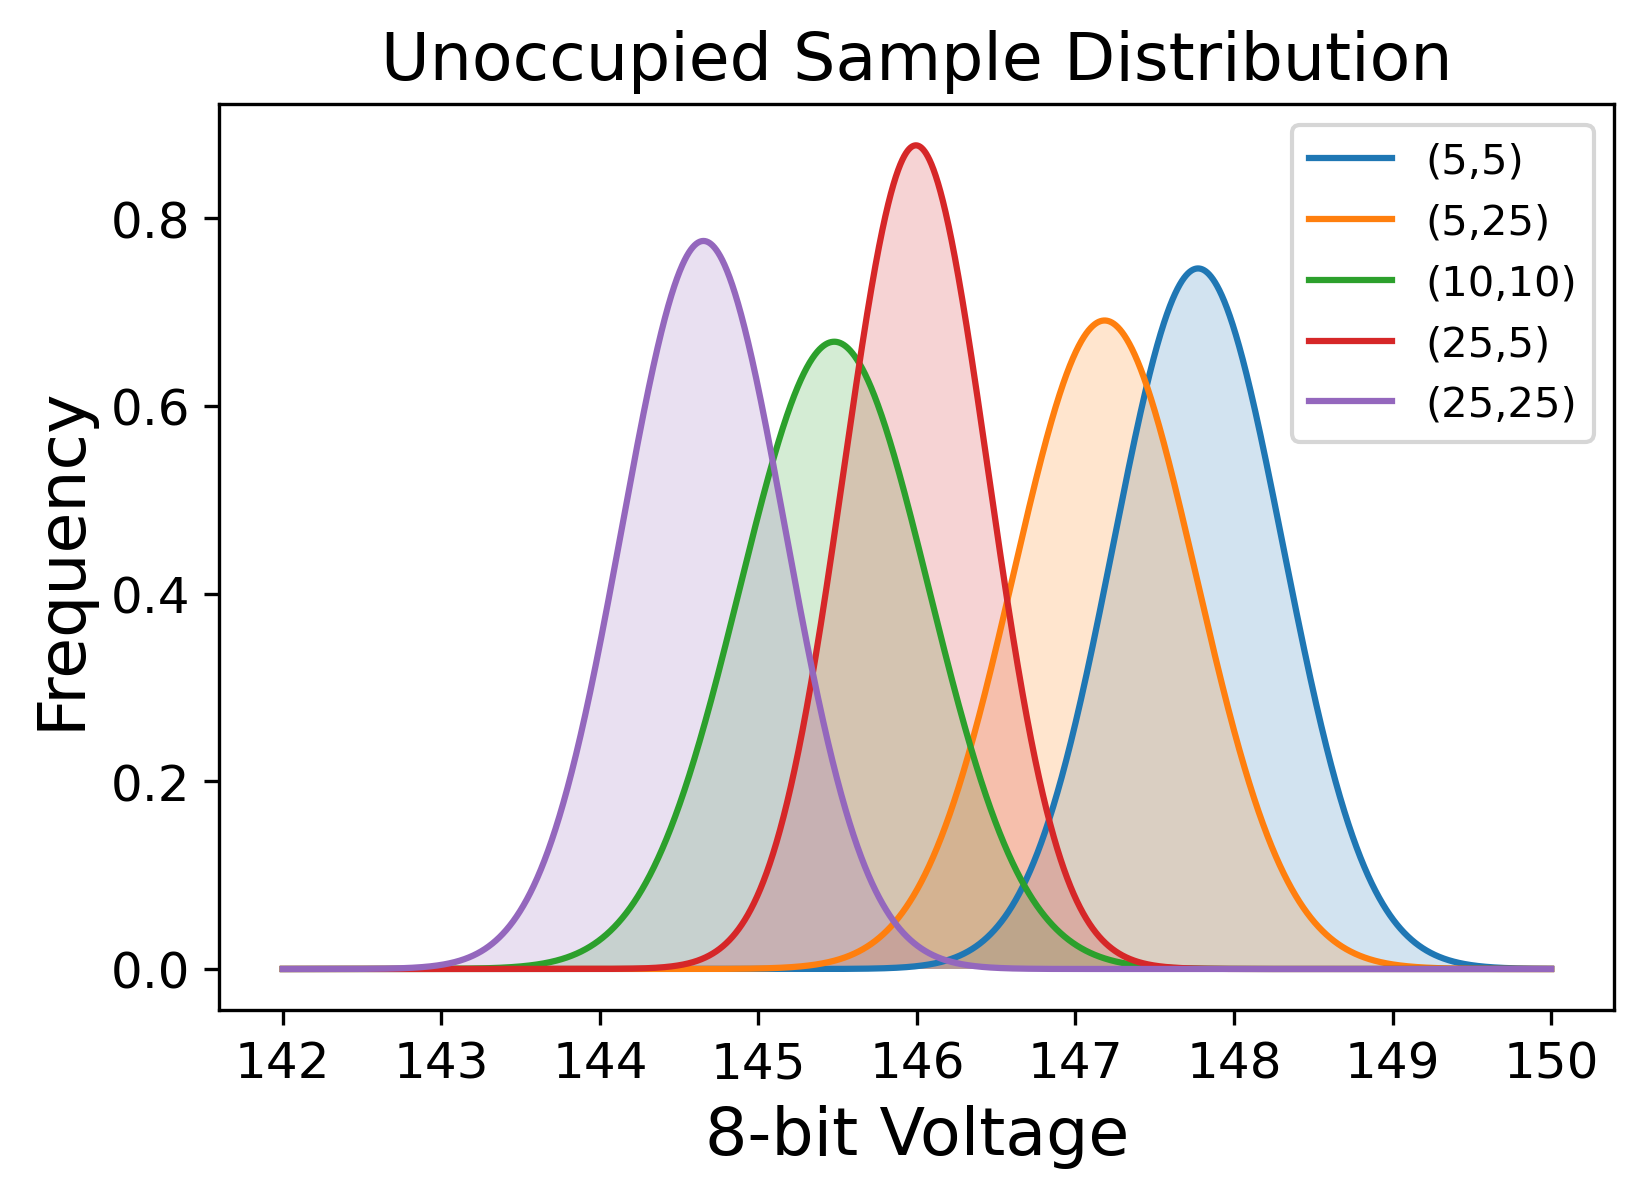
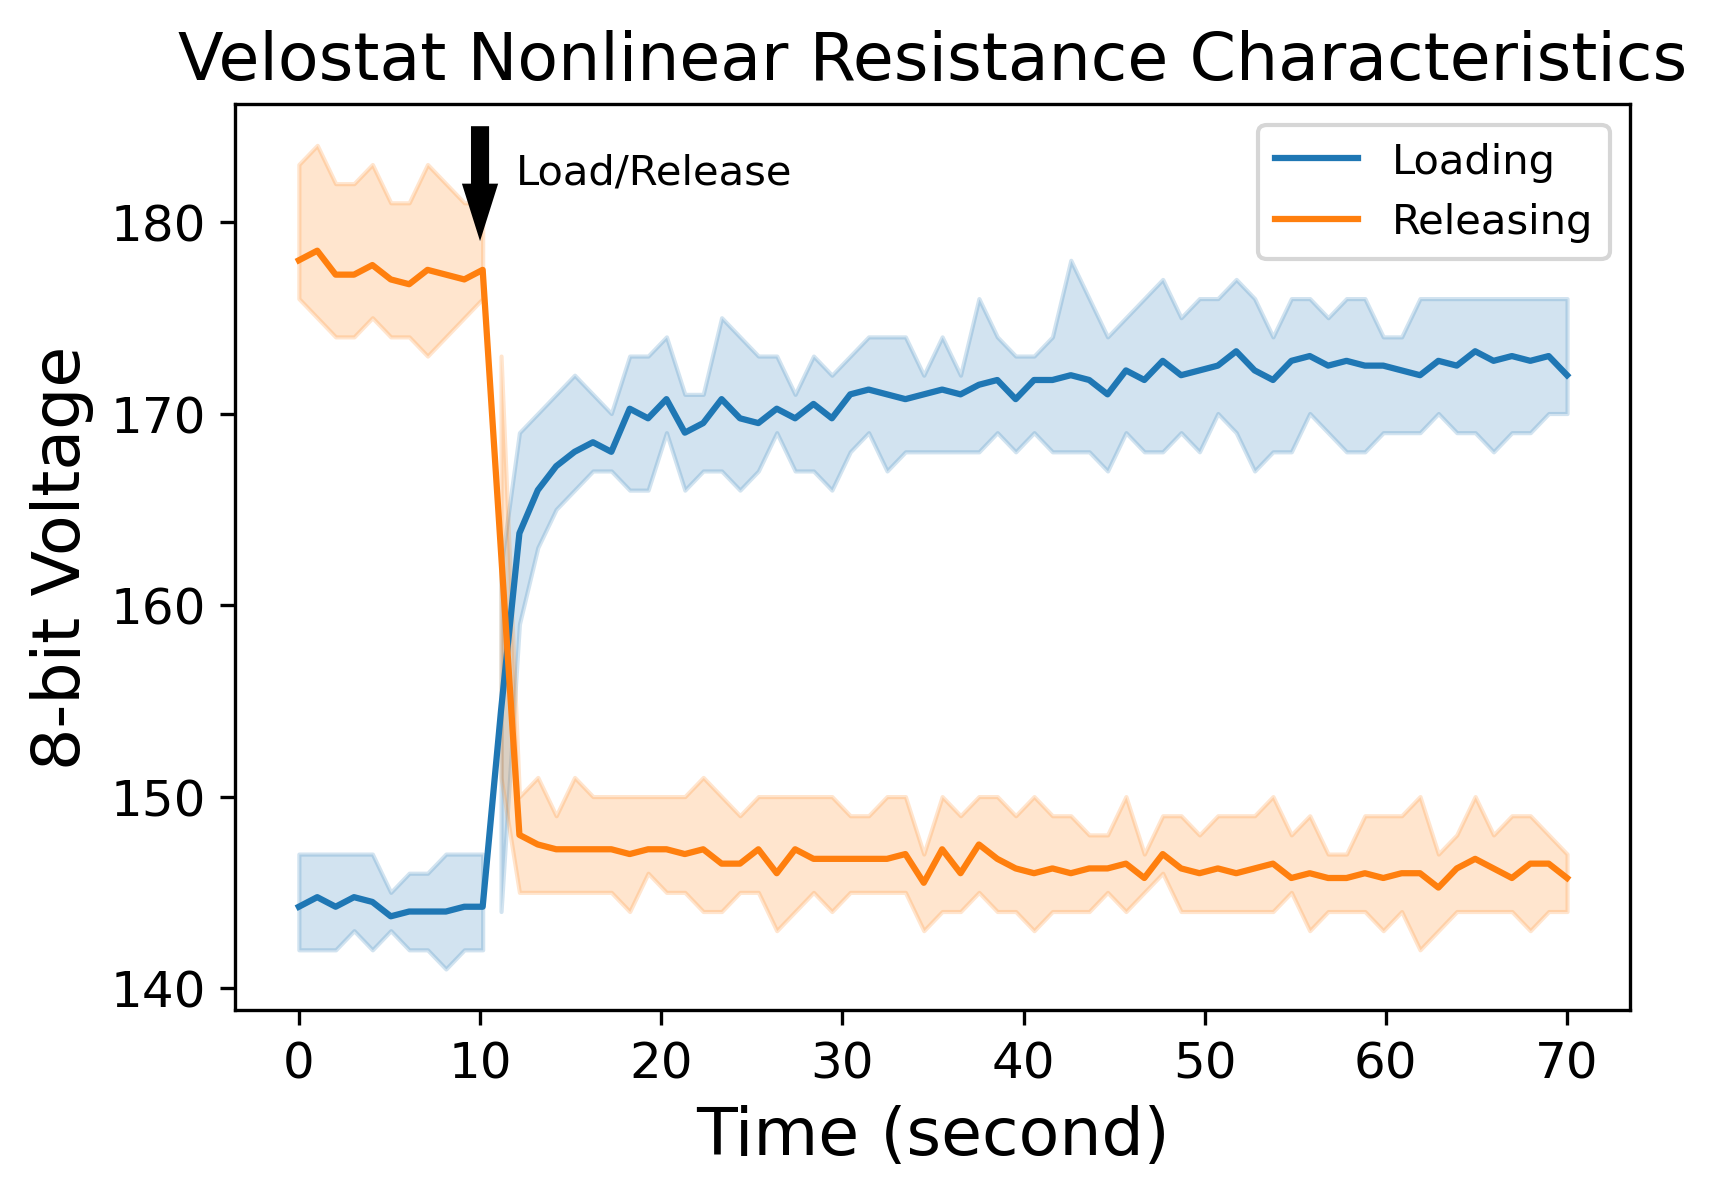
Piezoresistive resistors like the Velostat have some notorious non-ideal properties, including reduced sensitivity due to crosstalk, stray currents, electrical noise, and nonlinear resistance characteristics. We seek to improve the accuracy and robustness of SPeM by discussing and characterizing these properties of Velostat and by featuring them in the pressure image stream data. Due to the inevitable crosstalk, the resulting noise is a challenge. Fig. 6a shows the voltage distribution of different elements when they are unoccupied. It can be seen that the voltage of different elements oscillates between several units when unoccupied, which also causes the element voltage to oscillate when monitoring human activities. Fig. 6b shows the noise-induced voltage instability in the loading and releasing states and the nonlinear resistance characteristics. In which the loading and releasing states refer to the state of continuous loading at 100 Newton pressure and the state of after-stop loading, respectively. At the 10th second, the Velostat is loading with a voltage rise, but the gradient is decreasing. Although the voltage rise can converge to a final steady-state value, for human monitoring applications, the voltage and the generated pressure image constantly oscillate and rise as the occupancy progresses. The same is true for the releasing state. Therefore, we propose an image stream rather than a single image as one sample in the dataset.
III-B Experimental Setup
The data collection is at a home scenario, as it can better fit the proposed SPeM product functionality. The portable pressure sensor e-mat that can be easily extended to multiple uses, so it is placed on a mattress and a carpet for different classification tasks. The pressure distribution on e-mat is strongly related to the pressure distribution of the human body, and a diverse dataset can effectively avoid overfitting the neural network model. We recruit seven subjects, including five males and two females, with varying ages, heights, and weights for the feasibility testing of the SPeM system. Their physical information is detailed and presented in Table III.
| Minimum | Maximum | Average | Standard Deviation | |
|---|---|---|---|---|
| Age (years) | 21 | 28 | 23.20 | 2.86 |
| Height (m) | 1.67 | 1.83 | 1.75 | 0.07 |
| Weight (kg) | 64 | 78 | 71.00 | 6.78 |
| BMI | 19.41 | 25.47 | 23.29 | 2.37 |
Subjects under different instructions completed the datasets of posture and activity collection. Ten pressure images are used as a sample of the dataset and have a sampling period of two images per second. The collection time for each sample is approximately five seconds. Appropriate sampling time can not only obtain a higher number of samples but also ensure that each sample contains a sufficient amount of pressure image information to be learned by DNN models. Between samples, subjects moved and rotated consciously to obtain a diverse dataset. Human sleeping postures and dynamic activities are collected in two datasets to validate the application of the proposed SPeM in human monitoring. Each dataset is divided into a training set, test set, and validation set with a ratio of 0.7, 0.15, and 0.15, respectively. The optimizer is Adam, with the learning rate is initially , and the learning rate decreases by 0.1 every 100 epochs of iterations. Since these are classification tasks, the last layer is Softmax, and the loss is estimated by cross-entropy. The batch size is set to 32 and iterated 200 epochs to obtain the preliminary fitting results of the DNN model. The DNN architectures are implemented on TensorFlow and then trained on an Intel(R) Core(TM) i9-10850K CPU @ 3.60GHz, and an Nvidia GeForce RTX(TM) 3080 GPU.
III-C Sleeping Posture Recognition
SPeM is placed on a queen-size mattress for its first home scenario application, which is the recognition of sleeping postures. This is crucial for high-precision posture recognition that can effectively prevent diseases such as bedsores. As shown in Fig. 4a, SPeM is designed to completely cover the mattress. Subjects are instructed to simulate four common sleeping postures on SPeM, as shown in Fig. 7. The subject’s body is oriented in the same direction as the mattress, and we allow some degree of movement and rotation of their arms, legs, torso, and head. The orientation of the chest is used to differentiate between the four postures, while allowing for some movement and rotation of the subject on the SPeM to diversify the dataset.
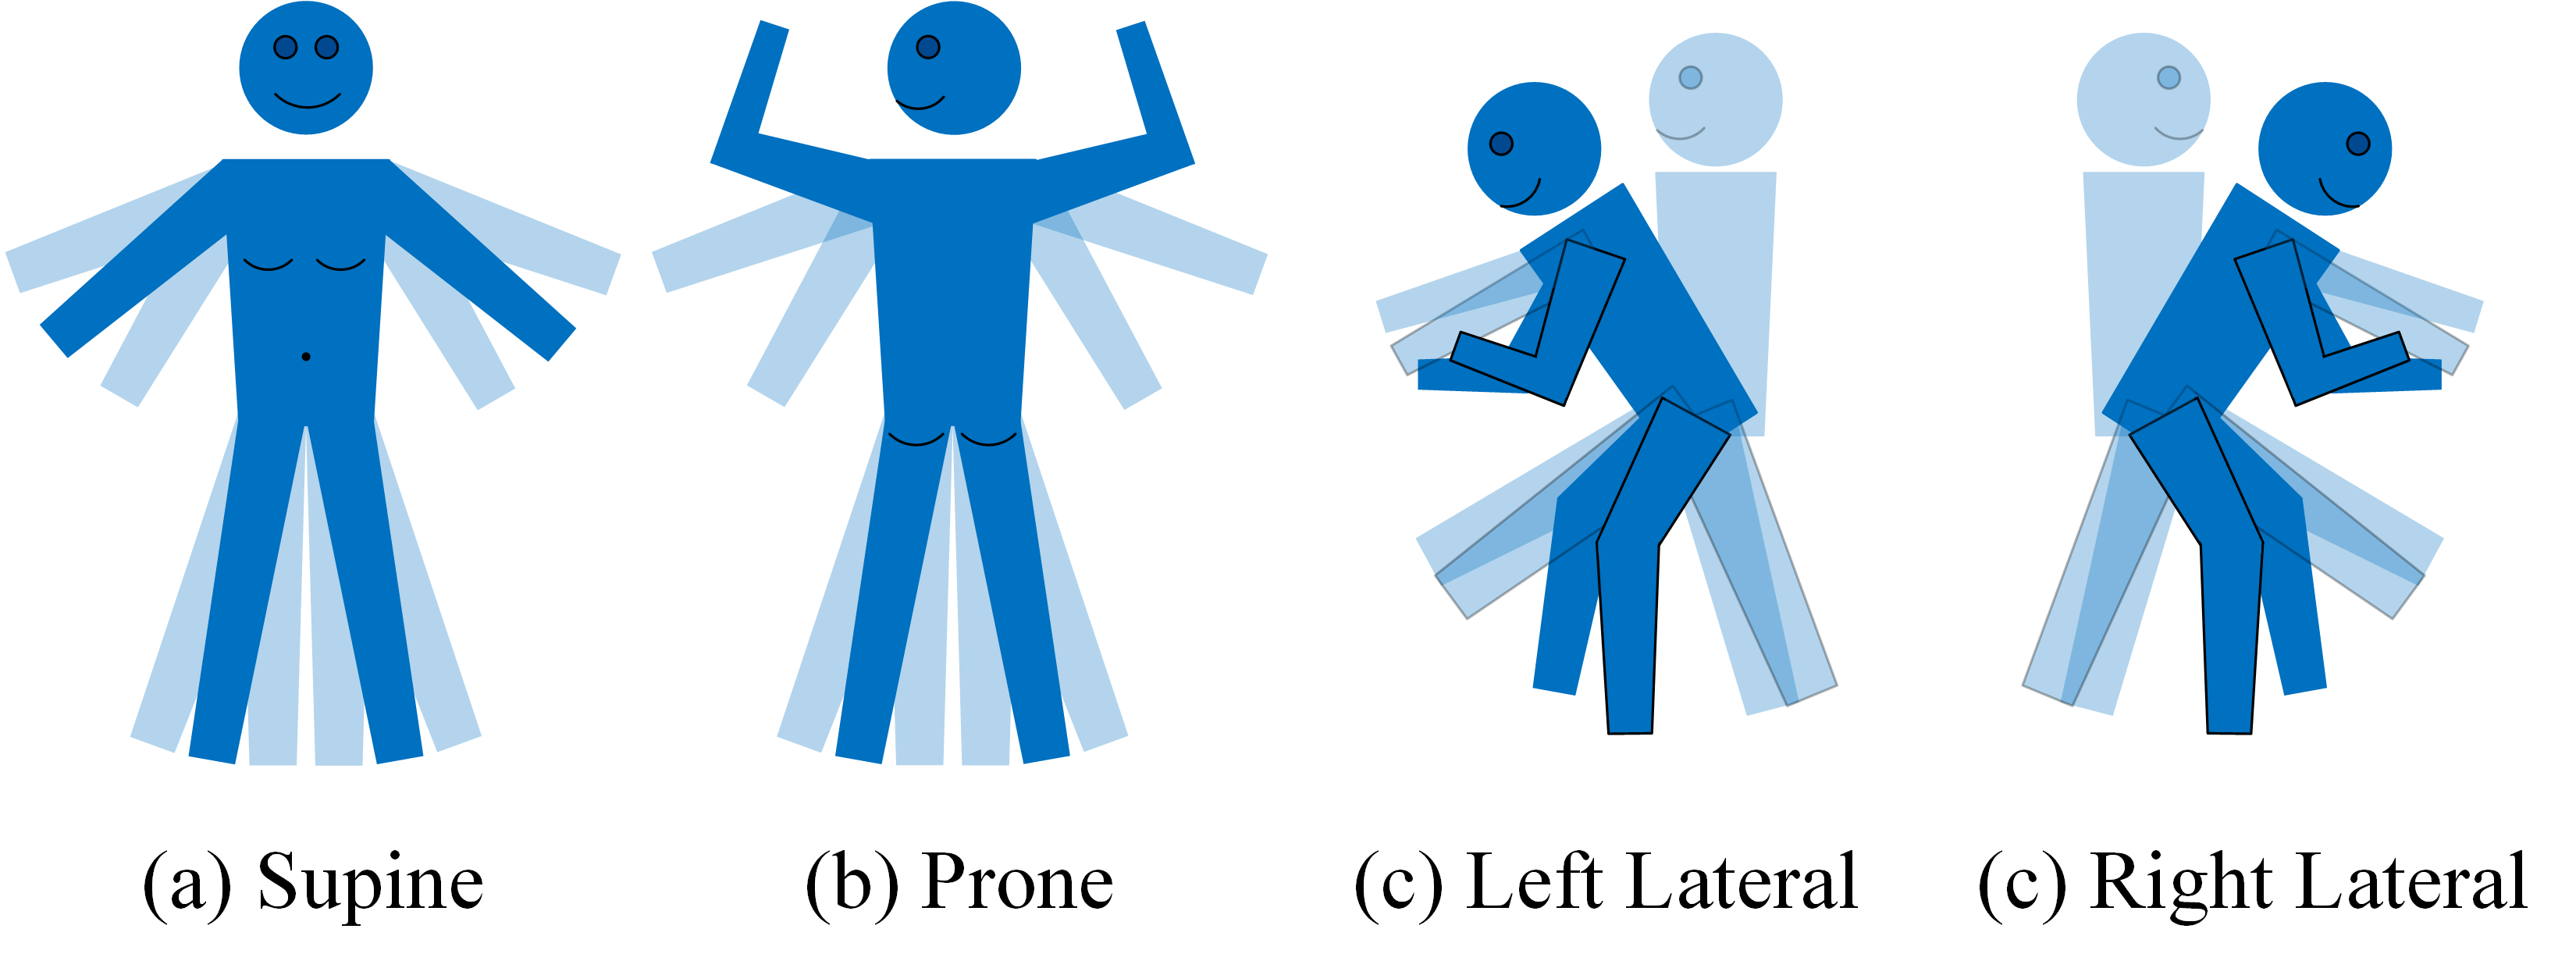
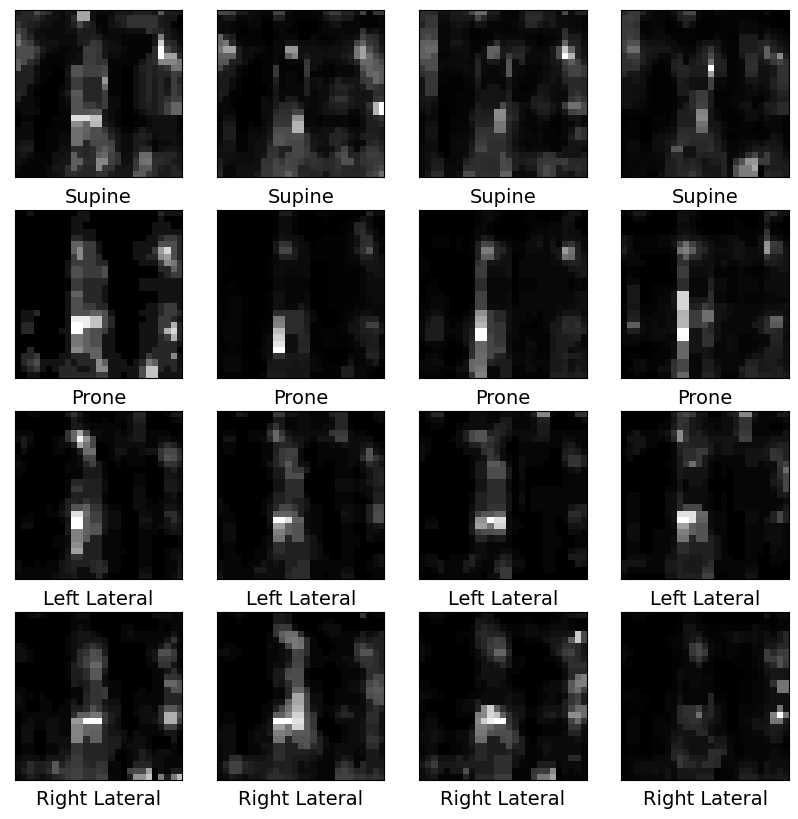
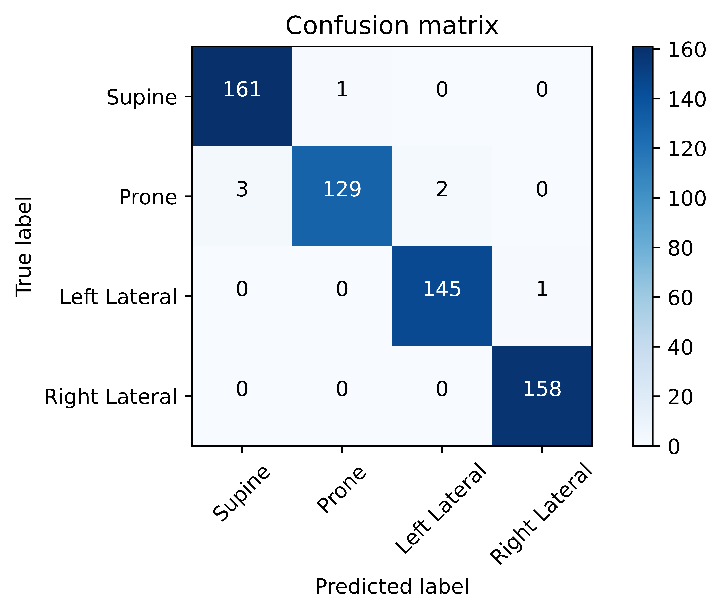
Fig. 8 shows some sampled pressure images of four human sleeping postures, from which a clear outline of the human body and pressure distribution can be seen. In addition to the changes caused by human pressure, there is also some noise distributed around the image edges. Therefore, in the process of pressure mode recognition, the classifier should focus more on the center of the pressure image rather than the edge area, and the neural network can undoubtedly achieve this purpose. The classification results of various DNN models are shown in Table IV, including CRNN, 3DCNN, and CDNN. It can be seen that these three DNN models all have fairly high accuracy and similar training time. Fig. 10a shows the exampled CRNN confusion matrix of the sleeping posture task.
| Task | Sleeping Posture | Dynamic Activity | ||||
|---|---|---|---|---|---|---|
| Algorithm | CRNN | 3DCNN | CDNN | CRNN | 3DCNN | CDNN |
| Accuracy | 0.988 | 0.985 | 0.993 | 1.0 | 0.998 | 0.998 |
| Time (s) | 2461 | 2120 | 2148 | 5782 | 4929 | 4990 |
III-D Dynamic Activity Recognition
To provide a more accurate and vivid description of human activities, we use the successful commercial game product, Nintendo Switch Ring Fit Adventure (RFA) [47], as an indicator in this study. SPeM is considered as a significant complementary, prior, and auxiliary sensor to the RFA gaming platform to enhance its performance. We only use the activity definitions, instructions, and scores of RFA for dynamic activity recognition experiments. The Nintendo Switch console is equipped with various sensors, including an inertial measurement unit (IMU), motion sensing infrared camera, brightness sensors, etc., and can be equipped with a variety of physical games. RFA is an exergame that may help overcome movement disorders and provide therapeutic applications for balance restoration and functional mobility, meeting the demand for home exercise [48, 49, 50]. By combining two independent Joy-Con controllers equipped with firmware Ring-Con, various fitness movements can be recognized and detected. However, RFA still has a high error rate when differentiating fitness movements, as only the leg side of the sensor set and the Ring-Con sensor set are used to identify all body movements. To improve the efficiency and performance of RFA, we propose to use a prior classifier. The contact sensor of the pressure system can better capture the pressure distribution of the human body and perform high-precision activity recognition.
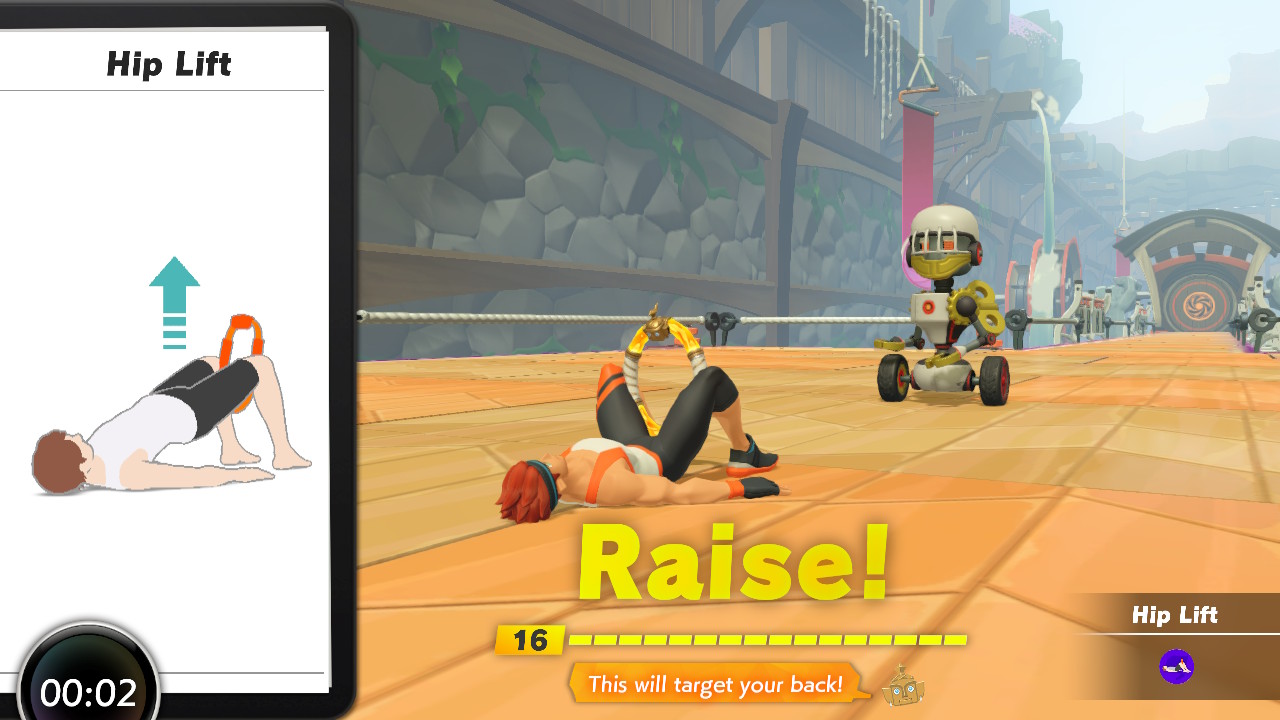
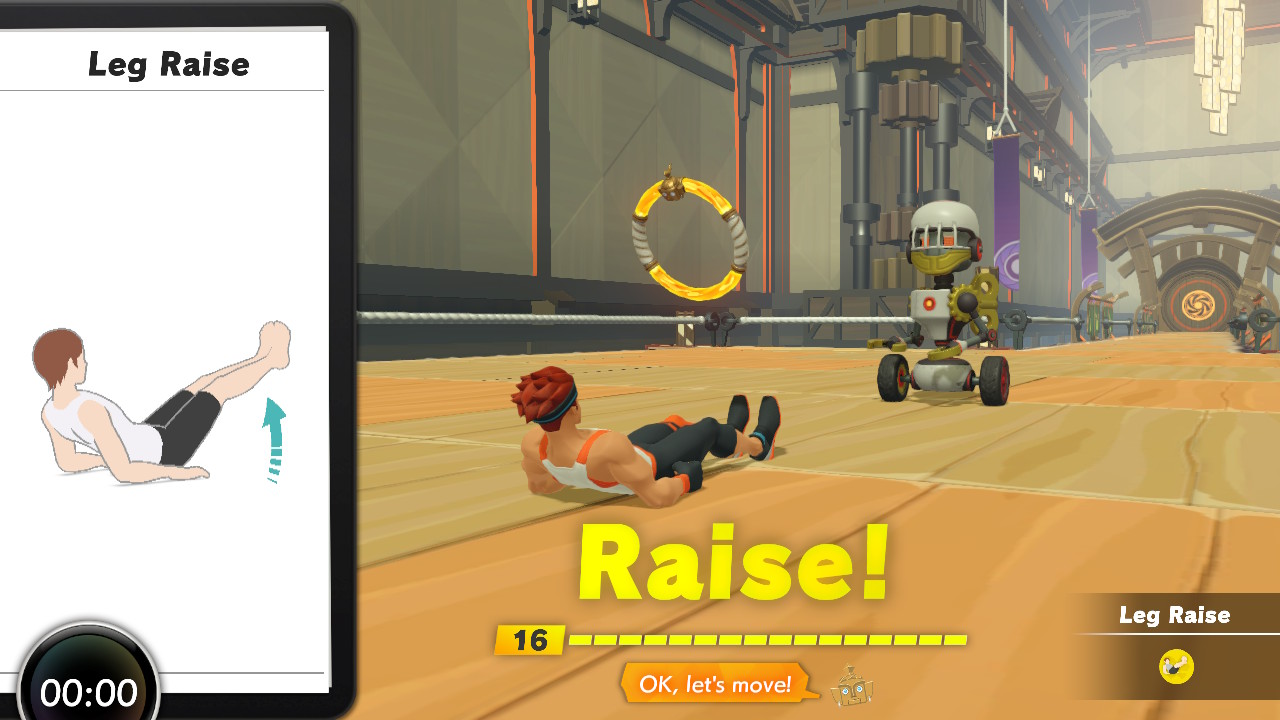
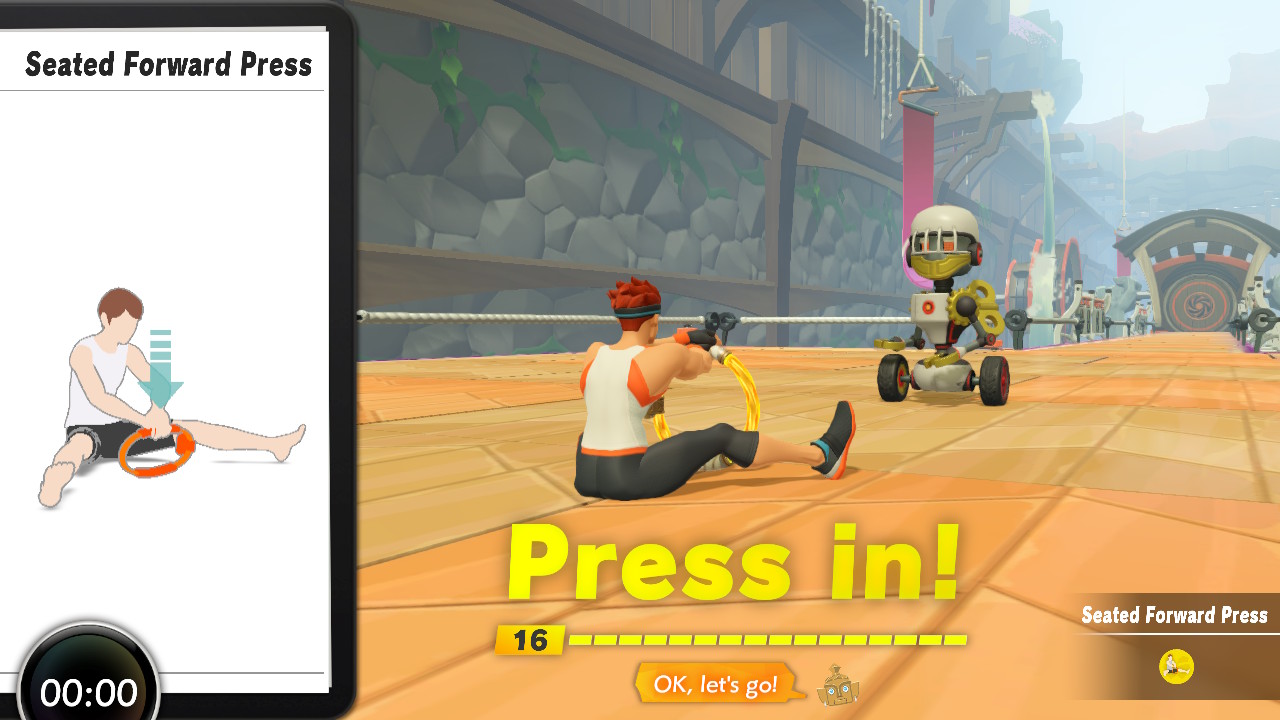
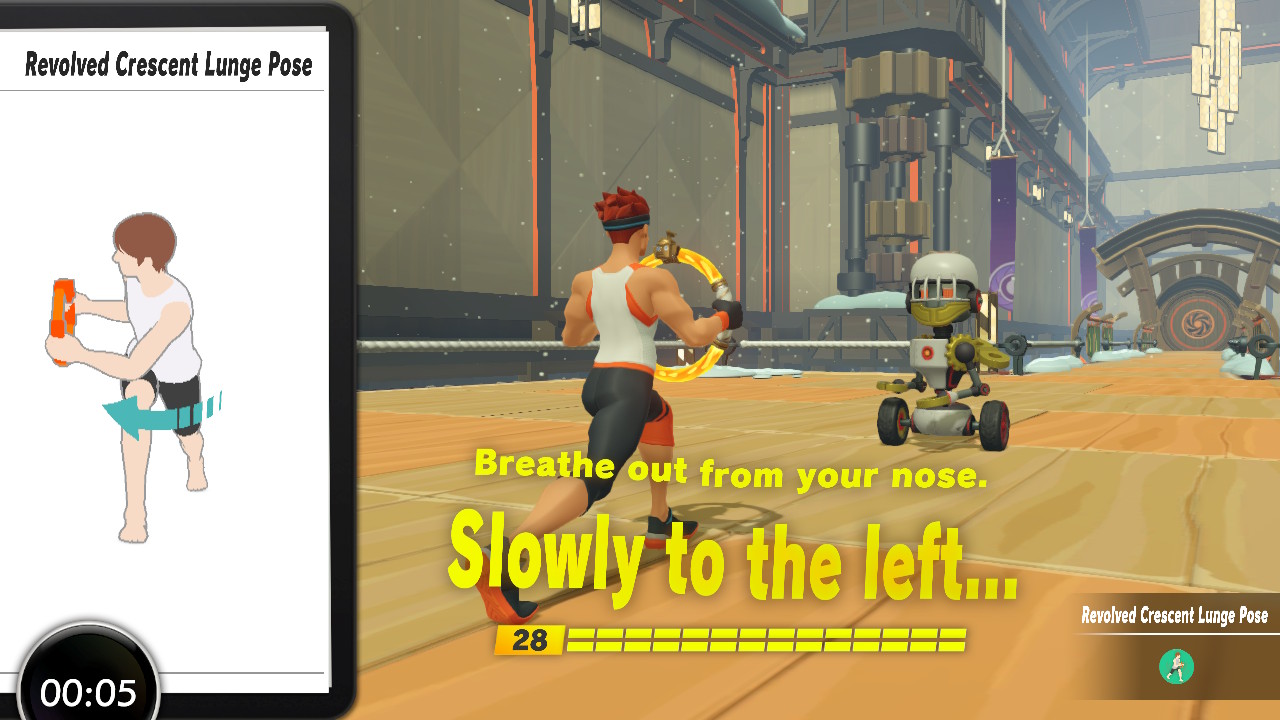
The design of dynamic tasks is a delicate process, as it requires a link to home sports activities while also requiring explicit activity instructions and specifications. Therefore, we borrowed activity directives and specifications from the successful case of RFA as the dynamic activity settings for our experiments. The visual cues and scoring system in RFA can effectively reduce the subjects’ comprehension errors regarding the experimental instructions. Fig. 9 shows four clearly indicated activities without Running in the RFA, and the RFA can determine whether the subject’s activity is normative through a scoring system. RFA includes dozens of activities that work muscles in different parts of the body, such as the chest, waist, and legs. For the preliminary validation of SPeM, we selected five activities, including Running, Hip Lift, Leg Raise, Seated Forward Press, and Revolved Crescent Lunge. Different activities generate weight in different areas of the body. For example, Hip Lift concentrates pressure on the shoulders and both feet. Similar to the data collection process for sleeping posture recognition, we asked subjects to collect pressure images with different displacements and rotations throughout SPeM.
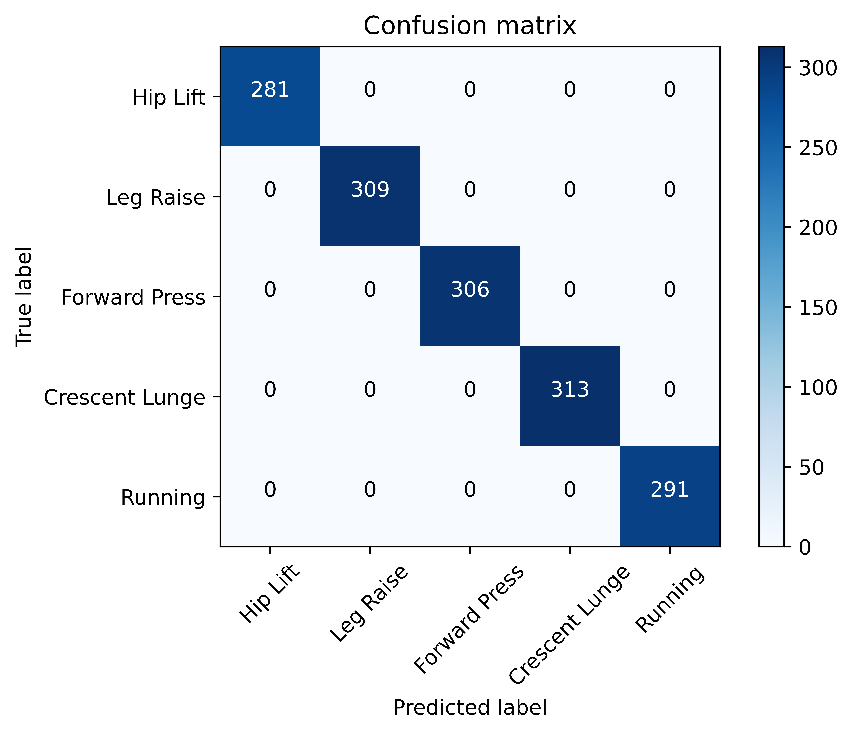
The classification results of dynamic activity recognition are shown in Table IV and Fig. 10b. CRNN achieves the highest classification accuracy of 1.0, which is remarkable for its ability to capture different pressure distributions generated by different activities accurately. According to experiment results, it can be seen that the proposed DNN algorithm achieves fairly high accuracy in both sleeping posture and dynamic activity recognition. Since we tested the model on an unseen test set, it is not difficult to see that in addition to the high generalization ability of the fitted model, the generated pressure dataset is also independent and identically distributed. According to the experiment results, it can be proved that the proposed SPeM system can produce high-reliability pressure images, precision classification prediction, and generalization ability.
IV Discussion
The accuracy of the SPeM system will be dependent on the experimental setup and the resulting data collection process. Two significant factors that affect the classification accuracy are the sampling rate and period. The sampling rate is impacted by the non-linear resistance characteristics of Velostat. In our experiments, we have set the sampling rate to two hertz to account for the application and release of Velostat resistance and the duration of a single activity in the RFA. However, we have observed that the sampling frequency may be a little high, resulting in minor variations in adjacent images and wasting computational resources, as well as electrical noise caused by cluttered currents in the sensor array. It is essential to note that the sampling period heavily depends on the application under consideration. While the experiments in this paper aim to control experimental variables and observe the differences between static and highly dynamic applications, a faster sampling period may not be appropriate for other applications, such as sleep recognition, where it could result in the unnecessary waste of computational resources. Therefore, it is necessary to adjust the system parameters to suit different human monitoring applications. A tailored application-following system parameter setting can lead to better performance and accurate classification results in diverse scenarios.
In this paper, we use a DNN algorithm with three architectures to perform the classification task of dynamic pressure image streams. However, based on our observations of related work (Table I), we have found that most human monitoring applications for static activities, such as sitting, sleeping, and long-term immobility, only use a single image as the data sample. Therefore, we conservatively tested ResNet-PI and other individual CNNs on the sleeping posture dataset, achieving a classification accuracy of approximately 0.98. Although single CNNs are a feasible method in ideal conditions, in real-world application scenarios, the proposed image stream-based classification method in the SPeM system is more robust. Firstly, in real-world scenarios, the pressure generated by human sleep is affected by various external factors, such as blankets, pillows, mattresses, and even dolls. Secondly, the pressure image generated by the Velostat-based pressure sensor array is time-varying due to electrical noise and crosstalk. Thirdly, the resistance of Velostat also changes over time due to its nonlinear resistance characteristics, as shown in Fig. 6b. For long-term static postures, we can adaptively adjust the sampling rate to reduce system power and storage overheads. Therefore, the introduction of the time dimension can also increase the robustness of human monitoring applications, and we advocate for its use in static-like human monitoring applications.
V Conclusion
In this paper, we propose a SPeM system for large-scale collection and demonstration of human pressure distribution and develop two potential applications of human sleeping posture and dynamic activity recognition. From the analysis of the pressure image stream, DNN models are used to train, classify, and predict the two datasets. Experiment results demonstrate that the proposed SPeM system can excellently achieve high-precision classification tasks. This paper highlights the portability, flexibility, and low price of SPeM and demonstrates its preliminary applications in human health care, entertainment, monitoring, etc.
Future work lies in the fusion of the proposed SPeM with other sensors, such as wearable sensors. Any single sensor has its limited capabilities, and pressure sensors in the dynamic activity recognition task cannot detect the motion of the human head, trunk, or hand. Therefore, the combination of SPeM, wearable sensors, or other kinds of sensors can monitor the human body in multiple modalities. Furthermore, although SPeM shows its advantages in visualization compared to individual pressure sensor modes, the pressure image needs to be optimized to be more clearly visible, with higher contrast and high resolution. Due to crosstalk and noise, most piezoresistive pressure sensors have similar defects, so it is necessary to further improve the image quality when the visualized pressure image stream is used in HCI applications. Fabricating pressure sensor array e-mat and related applications presents difficulties, especially in large-size and high-resolution applications. However, the increase in size and resolution is limited for recognition accuracy gains due to marginal effects. Currently, SPeM is able to generate pressure images with a resolution of , which is far from adequate for visualization applications in human activity monitoring. In addition to filtering and contrast enhancement, super-resolution of current pressure images is also a research scheme.
Acknowledgment
Thanks to Dr. Erik Blasch and Dr. Robert Ewing for concept development, research discussions, and paper editing.
References
- [1] M. I. Tiwana, S. J. Redmond, and N. H. Lovell, “A review of tactile sensing technologies with applications in biomedical engineering,” Sens. Actuator A Phys., vol. 179, pp. 17–31, Jun. 2012.
- [2] F. He, X. You, W. Wang, T. Bai, G. Xue, and M. Ye, “Recent progress in flexible microstructural pressure sensors toward human–machine interaction and healthcare applications,” Small Methods, vol. 5, no. 3, p. 2001041, Mar. 2021.
- [3] T. Al Shloul, M. Javeed, M. Gochoo, S. Alsuhibany, Y. Ghadi, A. Jalal, and J. Park, “Student’s health exercise recognition tool for e-learning education,” Intell. Autom. Soft Comput, vol. 35, pp. 149–161, 2022.
- [4] M. Rashid, M. A. Khan, M. Alhaisoni, S.-H. Wang, S. R. Naqvi, A. Rehman, and T. Saba, “A sustainable deep learning framework for object recognition using multi-layers deep features fusion and selection,” Sustainability, vol. 12, no. 12, p. 5037, Jun. 2020.
- [5] D. Aishwarya and R. Minu, “Edge computing based surveillance framework for real time activity recognition,” ICT Express, vol. 7, no. 2, pp. 182–186, Jun. 2021.
- [6] M. A. Khan, M. Mittal, L. M. Goyal, and S. Roy, “A deep survey on supervised learning based human detection and activity classification methods,” Multimed. Tools. Appl., vol. 80, no. 18, pp. 27 867–27 923, Jul. 2021.
- [7] F. Attal, S. Mohammed, M. Dedabrishvili, F. Chamroukhi, L. Oukhellou, and Y. Amirat, “Physical human activity recognition using wearable sensors,” Sensors, vol. 15, no. 12, pp. 31 314–31 338, Dec. 2015.
- [8] H. F. Nweke, Y. W. Teh, M. A. Al-Garadi, and U. R. Alo, “Deep learning algorithms for human activity recognition using mobile and wearable sensor networks: State of the art and research challenges,” Expert Syst. Appl., vol. 105, pp. 233–261, Sep. 2018.
- [9] Y. Wang, S. Cang, and H. Yu, “A survey on wearable sensor modality centred human activity recognition in health care,” Expert Syst. Appl., vol. 137, pp. 167–190, Dec. 2019.
- [10] Y. Luo, Y. Li, P. Sharma, W. Shou, K. Wu, M. Foshey, B. Li, T. Palacios, A. Torralba, and W. Matusik, “Learning human–environment interactions using conformal tactile textiles,” Nat. Electron., vol. 4, no. 3, pp. 193–201, Mar. 2021.
- [11] A. Voulodimos, N. Doulamis, A. Doulamis, and E. Protopapadakis, “Deep learning for computer vision: A brief review,” Comput. Intell. Neurosci., vol. 2018, Feb. 2018.
- [12] L. Yuan, L. Su, and Z. Wang, “Federated transfer-ordered-personalized learning for driver monitoring application,” arXiv preprint arXiv:2301.04829, 2023.
- [13] L. Yuan, Y. Ma, L. Su, and Z. Wang, “Peer-to-peer federated continual learning for naturalistic driving action recognition,” arXiv preprint arXiv:2304.07421, Apr. 2023.
- [14] Y. Zheng, E. Blasch, and Z. Liu, Multispectral image fusion and colorization. SPIE Press Bellingham, Washington, 2018, vol. 481.
- [15] Z. Ren, F. Fang, N. Yan, and Y. Wu, “State of the art in defect detection based on machine vision,” Int. J. Precis. Eng. Manuf. - Green Technol., pp. 1–31, May 2021.
- [16] J. Chen, J. Konrad, and P. Ishwar, “Vgan-based image representation learning for privacy-preserving facial expression recognition,” in Proceedings of the IEEE conference on computer vision and pattern recognition workshops, 2018, pp. 1570–1579.
- [17] L. Yuan, J. Andrews, H. Mu, A. Vakil, R. Ewing, E. Blasch, and J. Li, “Interpretable passive multi-modal sensor fusion for human identification and activity recognition,” Sensors, vol. 22, no. 15, p. 5787, Aug. 2022.
- [18] H. Li, X. Zeng, Y. Li, S. Zhou, and J. Wang, “Convolutional neural networks based indoor wi-fi localization with a novel kind of csi images,” China Commun., vol. 16, no. 9, pp. 250–260, Sep. 2019.
- [19] M. Park, B.-G. Bok, J.-H. Ahn, and M.-S. Kim, “Recent advances in tactile sensing technology,” Micromachines, vol. 9, no. 7, p. 321, Jun. 2018.
- [20] C. Chi, X. Sun, N. Xue, T. Li, and C. Liu, “Recent progress in technologies for tactile sensors,” Sensors, vol. 18, no. 4, p. 948, Mar. 2018.
- [21] Adafruit Industries, “Pressure-sensitive conductive sheet (velostat/linqstat).” [Online]. Available: https://www.adafruit.com/product/1361
- [22] L. Yuan, H. Qu, and J. Li, “Velostat sensor array for object recognition,” IEEE Sens. J., vol. 22, no. 2, pp. 1692–1704, Dec. 2021.
- [23] C. Medrano-Sánchez, R. Igual-Catalán, V. H. Rodríguez-Ontiveros, and I. Plaza-García, “Circuit analysis of matrix-like resistor networks for eliminating crosstalk in pressure sensitive mats,” IEEE Sens. J., vol. 19, no. 18, pp. 8027–8036, May 2019.
- [24] A. Dzedzickis, E. Sutinys, V. Bucinskas, U. Samukaite-Bubniene, B. Jakstys, A. Ramanavicius, and I. Morkvenaite-Vilkonciene, “Polyethylene-carbon composite (velostat®) based tactile sensor,” Polymers, vol. 12, no. 12, p. 2905, Dec. 2020.
- [25] “Tactilus® mattress pressure mapping sensor system.” [Online]. Available: https://tactilus.net/
- [26] “Body pressure measurement system (bpms).” [Online]. Available: https://www.tekscan.com/products-solutions/systems/body-pressure-measurement-system-bpms-research
- [27] A. Fatema, S. Poondla, R. B. Mishra, and A. M. Hussain, “A low-cost pressure sensor matrix for activity monitoring in stroke patients using artificial intelligence,” IEEE Sens. J., vol. 21, no. 7, pp. 9546–9552, Jan. 2021.
- [28] C. Sun, W. Li, and W. Chen, “A compressed sensing based method for reducing the sampling time of a high resolution pressure sensor array system,” Sensors, vol. 17, no. 8, p. 1848, Aug. 2017.
- [29] Q. Wan, H. Zhao, J. Li, and P. Xu, “Hip positioning and sitting posture recognition based on human sitting pressure image,” Sensors, vol. 21, no. 2, p. 426, Jan. 2021.
- [30] L. Yuan and J. Li, “Smart cushion based on pressure sensor array for human sitting posture recognition,” in 2021 IEEE Sensors. IEEE, 2021, pp. 1–4.
- [31] K. Tang, A. Kumar, M. Nadeem, and I. Maaz, “Cnn-based smart sleep posture recognition system,” IoT, vol. 2, no. 1, pp. 119–139, Feb. 2021.
- [32] Q. Hu, X. Tang, and W. Tang, “A real-time patient-specific sleeping posture recognition system using pressure sensitive conductive sheet and transfer learning,” IEEE Sens. J., vol. 21, no. 5, pp. 6869–6879, Dec. 2020.
- [33] R. Hudec, S. Matúška, P. Kamencay, and M. Benco, “A smart iot system for detecting the position of a lying person using a novel textile pressure sensor,” Sensors, vol. 21, no. 1, p. 206, Dec. 2020.
- [34] M. Sundholm, J. Cheng, B. Zhou, A. Sethi, and P. Lukowicz, “Smart-mat: Recognizing and counting gym exercises with low-cost resistive pressure sensing matrix,” in Proceedings of the 2014 ACM international joint conference on pervasive and ubiquitous computing, 2014, pp. 373–382.
- [35] B. Zhou, M. S. Singh, S. Doda, M. Yildirim, J. Cheng, and P. Lukowicz, “The carpet knows: Identifying people in a smart environment from a single step,” in 2017 IEEE International Conference on Pervasive Computing and Communications Workshops (PerCom Workshops). IEEE, 2017, pp. 527–532.
- [36] I. Wicaksono, P. G. Hwang, S. Droubi, F. X. Wu, A. N. Serio, W. Yan, and J. A. Paradiso, “3dknits: Three-dimensional digital knitting of intelligent textile sensor for activity recognition and biomechanical monitoring,” in 2022 44th Annual International Conference of the IEEE Engineering in Medicine & Biology Society (EMBC). IEEE, 2022, pp. 2403–2409.
- [37] M. Zhang, D. Liu, Q. Wang, B. Zhao, O. Bai, and J. Sun, “Gait pattern recognition based on plantar pressure signals and acceleration signals,” IEEE Trans. Instrum. Meas., Sep. 2022.
- [38] H.-C. Chen, Y.-K. Jan, B.-Y. Liau, C.-Y. Lin, J.-Y. Tsai, C.-T. Li, C.-W. Lung et al., “Using deep learning methods to predict walking intensity from plantar pressure images,” in International Conference on Applied Human Factors and Ergonomics. Springer, 2021, pp. 270–277.
- [39] K. Jun, S. Lee, D.-W. Lee, and M. S. Kim, “Deep learning-based multimodal abnormal gait classification using a 3D skeleton and plantar foot pressure,” IEEE Access, vol. 9, pp. 161 576–161 589, Nov. 2021.
- [40] Y. El Ghzizal, N. Aharrane, G. Khaissidi, and M. Mrabti, “Transfer learning and pressure effect for handwriting to early detection of parkinson’s disease,” in International Conference on Digital Technologies and Applications. Springer, 2022, pp. 460–469.
- [41] B. Shi, X. Bai, and C. Yao, “An end-to-end trainable neural network for image-based sequence recognition and its application to scene text recognition,” IEEE Trans. Pattern Anal. Mach. Intell., vol. 39, no. 11, pp. 2298–2304, Dec. 2016.
- [42] J. Yue-Hei Ng, M. Hausknecht, S. Vijayanarasimhan, O. Vinyals, R. Monga, and G. Toderici, “Beyond short snippets: Deep networks for video classification,” in Proceedings of the IEEE conference on computer vision and pattern recognition, 2015, pp. 4694–4702.
- [43] Y. Song, M. Li, F. Wang, and S. Lv, “Contact pattern recognition of a flexible tactile sensor based on the cnn-lstm fusion algorithm,” Micromachines, vol. 13, no. 7, p. 1053, Jun. 2022.
- [44] S. Sundaram, P. Kellnhofer, Y. Li, J.-Y. Zhu, A. Torralba, and W. Matusik, “Learning the signatures of the human grasp using a scalable tactile glove,” Nature, vol. 569, no. 7758, pp. 698–702, May 2019.
- [45] C. Gumus, K. Ozlem, F. Khalilbayli, O. F. Erzurumluoglu, G. Ince, O. Atalay, and A. T. Atalay, “Textile-based pressure sensor arrays: A novel scalable manufacturing technique,” Micro Nano Eng., vol. 15, p. 100140, Jun. 2022.
- [46] K. He, X. Zhang, S. Ren, and J. Sun, “Deep residual learning for image recognition,” in Proceedings of the IEEE conference on computer vision and pattern recognition, 2016, pp. 770–778.
- [47] “Ring fit adventure™ for nintendo switch™ – official site.” [Online]. Available: https://ringfitadventure.nintendo.com/
- [48] T. B. F. Pacheco, C. S. P. de Medeiros, V. H. B. de Oliveira, E. R. Vieira, and F. De Cavalcanti, “Effectiveness of exergames for improving mobility and balance in older adults: A systematic review and meta-analysis,” Syst. Rev., vol. 9, no. 1, pp. 1–14, Dec. 2020.
- [49] Y.-S. Wu, W.-Y. Wang, T.-C. Chan, Y.-L. Chiu, H.-C. Lin, Y.-T. Chang, H.-Y. Wu, T.-C. Liu, Y.-C. Chuang, J. Wu et al., “Effect of the nintendo ring fit adventure exergame on running completion time and psychological factors among university students engaging in distance learning during the covid-19 pandemic: Randomized controlled trial,” JMIR Serious Games, vol. 10, no. 1, p. e35040, Mar. 2022.
- [50] J. Ruth, S. Willwacher, and O. Korn, “Acceptance of digital sports: A study showing the rising acceptance of digital health activities due to the sars-cov-19 pandemic,” Int. J. Environ. Res. Public Health., vol. 19, no. 1, p. 596, Jan. 2022.