Extragalactic neutrino factories
Abstract
Identifying the astrophysical sources responsible for the high-energy cosmic neutrinos has been a longstanding challenge. In a previous work, we report evidence for a spatial correlation between blazars from the 5th Roma-BZCat catalog and neutrino data of the highest detectable energies, i.e. PeV, collected by the IceCube Observatory in the southern celestial hemisphere. The statistical significance is found at the level of post-trial. In this work we test whether a similar correlation exists in the northern hemisphere, were IceCube is mostly sensitive to PeV energies. We find a consistent correlation between blazars and northern neutrino data at the pre-trial p-value of , and a post-trial chance probability of . Combining the post-trial probabilities observed for the southern and northern experiments yields a global post-trial chance probability of for the genuineness of such correlation. This implies that the spatial correlation is highly unlikely to arise by chance. Our studies push forward an all-sky subset of 52 objects as highly likely PeVatron extragalactic accelerators.
1 Introduction
Despite the evidence of a diffuse neutrino flux consistent with an astrophysical origin reported by the IceCube Observatory in the TeV to PeV energy range (IceCube Collaboration, 2013; Aartsen et al., 2016a), little is known about the astrophysical objects that are responsible for it. Identifying the astrophysical sources originating the high-energy astrophysical neutrinos represents one of the most compelling questions in multi-messenger astrophysics. Evidence that at least a fraction of the IceCube high-energy ( PeV) neutrinos originates from a peculiar type of active galactic nuclei (AGN), i.e. accreting super-massive black holes at the centers of galaxies that emit non thermal radiation, has been recently provided (Buson et al., 2022a, b). Among them, some can launch powerful outflows, and few are capable of accelerating particles to nearly the speed of light in narrow collimated beams, i.e. relativistic jets. The blazar class commonly encompasses those AGN with a relativistic jet closely aligned with Earth and has been widely investigated in previous multi-messenger studies in relation to neutrinos. Generally, limited multi-wavelength information is available to access the nature of an AGN and, for a given survey, most of the times this is available only for the brightest objects. Moreover, variability may affect the behaviour of a source observed at a given time, making an unambiguous classification not possible. As a result, the classification of AGN often attempts to categorize the properties observed in a specific waveband (or survey) at the risk of lacking a comprehensive view of the actual physical characteristics of the system (Padovani et al., 2017). Motivated by these considerations, in our work we search for candidate neutrino counterparts among AGN whose emission exhibits the presence of non thermal radiation over the electromagnetic spectrum, as classified by the 5th Roma-BZCat catalog (5BZCat, Massaro et al., 2015, and references therein).
Our previous study (hereafter Paper I, Buson et al., 2022a) focuses on the time-integrated information encoded in the IceCube 7 yr sky map (Aartsen et al., 2017b) and reports the discovery of a statistically significant correlation between PeV neutrinos and a sample of 5BZCat blazars located in the southern celestial hemisphere. The study pinpoints a subset of 10 objects, i.e. PeVatron blazars, as highly-likely neutrino emitters. This paper, hereafter Paper II, represents a complement of Paper I. It builds on the findings of Paper I and expands the investigation to the northern hemisphere using the latest released IceCube 9-year northern sky map (IceCube Collaboration, 2022).
The paper is organized as follows. Section 2 summarises the hypothesis behind our study, already introduced in Paper I. Section 3 presents the IceCube observatory and the neutrino data available publicly at the time of the writing. The neutrino data and the blazar sample used in Paper II are presented in Section 4. Section 5 addresses the northern hemisphere statistical analysis and discusses the findings in the context of the southern hemisphere results. Section 6 places the findings in the context of previous all-sky searches for neutrino point sources. Section 7 discusses in brief the properties of the northern blazars associated with neutrinos. Section 8 provides supportive grounds regarding the astrophysical neutrino energies involved. Section 9 discusses the results in a broader context and Section 10 presents the discussion and conclusions. When referring to the time integration of an analysis (e.g. skymap), the paper refers to the instrument exposure rather than the calendar time span of the observations, i.e. the IceCube livetime, rounded to the integer in years, unless differently specified. When addressing the statistical significance in “”, we refer to Gaussian standard equivalent (one-sided).
2 The PeVatron blazars
hadronic primer
The study embraced in Paper I and Paper II builds on the hypothesis that, if blazars are capable of accelerating cosmic rays, the bulk of the energy-output in form of accompanying neutrino emission resides at energies PeV. This is consistent with the majority of the state-of-the-art blazar theoretical models, i.e. both hadronic and lepto-hadronic models (e.g. Mannheim, 1993, 1995; Atoyan & Dermer, 2003; Stecker, 2013; Dermer et al., 2014; Murase et al., 2014; Petropoulou et al., 2015; Reimer, 2015; Keivani et al., 2018; Cerruti et al., 2019; Rodrigues et al., 2021). PeV energies offer a favorable observational window also due to the characteristic of the expected background spectrum, according to which, the blazar spectrum is predicted to cross the steeply falling background one at PeV (e.g. Mannheim, 1993).
Due to the observatory’s geographical location and Earth’s opacity hampering the detection of high-energy neutrinos ( PeV), the astrophysical neutrino energy ranges accessible by the IceCube observatory depend on the celestial declination. While the IceCube southern hemisphere is democratic in energies, i.e. astrophysical neutrinos of all energies can travel unimpeded toward the observatory and be detected, the northern hemisphere is limited to observe astrophysical neutrinos in the TeV/sub-PeV energy range, with the higher-energy neutrinos preferentially detected close to the celestial horizon (Aartsen et al., 2017c; Bustamante & Connolly, 2019).
In Paper I we focus on the southern hemisphere, that is sensitive to the highest energies accessible, and observe a statistically significant correlation between IceCube neutrinos and blazars. To test whether the correlation may hold at the lower observed energies, in Paper II we apply the same analysis of Paper I to the northern neutrino data. The latter is independent from the one used in Paper I (see Section 4). Testing the hypothesis of blazars as long-term ( year-long) neutrino emitters in an independent dataset, offers the opportunity of corroborating the findings of Paper I. Besides, performing the same statistical analysis in the northern hemisphere, which concerns mainly muon-proxy energies in the range TeV to TeV, provides an informative estimate of the level of such correlation in a different energy band.
3 The IceCube Observatory data releases
The most sensitive neutrino detector currently operating is the IceCube observatory, a cubic-kilometer sized Cherenkov detector embedded in the ice at the geographic South Pole. It detects neutrinos above TeV energies by measuring the Cherenkov light produced by charged particles induced by neutrino interactions. The detector is equipped with a total of 5160 optical photomultiplier tubes arranged in 86 cable strings. The final instrument configuration with 86 strings was completed in December 2010 while, prior to that date, data were recorded with partial detector configurations (i.e. 40, 59, 79 strings).
Several works in the literature have previously addressed the search for all-sky, neutrino point-like sources exploiting the time-integrated IceCube data. During the past decade, the IceCube collaboration has reported such searches carried out with the progressive accumulation of more data, different energy ranges, and progressive improvements in the data calibration, reconstruction and statistical analysis techniques, e.g. years analysis (Aartsen et al., 2013; Adrián-Martinez et al., 2016), years (Aartsen et al., 2014), years (Aartsen et al., 2017b; Coenders, 2016), years (Aartsen et al., 2019), years (2008-2018, Aartsen et al., 2020), years (2011-2020, Abbasi et al., 2022).
The muon-track data collected by IceCube across the first 10-yr (2008-2018) of observations have been publicly released in the form of a list of events, along with information regarding the instrument responce functions, such as effective area, reconstructed angular error and energy estimation (IceCube Collaboration et al., 2021a). In principle, using this information one could reproduce searches similar to those carried out by the collaboration. Similar releases allowed independent authors to e.g. carry out point-source studies, although such works could not exploit the full information about the instrument because not publicly available (e.g. Hooper et al., 2019; Smith et al., 2021; Zhou et al., 2021).
Moreover, thanks to recent developments by the IceCube collaboration, most of the results based on the publicly released 10-yr event dataset (e.g., Aartsen et al., 2020) are nowadays superseded by those that build on the newer event reconstruction and data calibration methods (Bellenghi et al., 2021). The latter have yet shown their potential, leading to the claim for evidence of neutrino emission from the AGN NGC 1068 (Abbasi et al., 2022). In this most recent work, Abbasi et al. (2022) presents also an updated analysis of the northern (celestial) sky.
An alternative is to utilise higher-level data products which are released by the IceCube collaboration to the scientific community, when available. Among those concerning all-sky point-searches, two have been released at the time of the writing. These are a 7-y all-sky map (IceCube Collaboration, 2019) and, recently, the aforementioned 9 years sky map of the northern celestial hemisphere (Abbasi et al., 2022). The latter encompasses timescales similar to the one previously investigated in Aartsen et al. (2020), but employs a reprocessed muon-track dataset based on the full 86-string configuration and improved statistical analysis methods. This is expected to bring significant improvements in the analysis. Among other differences, the latest analysis provides improved source localization, flux characterization and thereby discovery potential (by up to 30% in the case of hard-spectrum signals, E-2) over previous works (see e.g. Bellenghi et al., 2021; Abbasi et al., 2022; IceCube Collaboration, 2022). As well as it enables an unbiased estimation of the source parameters.
3.1 Neutrino sky map data employed in our studies
In our first investigation (Paper I), we employed the IceCube 7-y sky map data (IceCube Collaboration, 2019; Aartsen et al., 2017b), as it was the only sky map publicly accessible when performing the study. We explored the southern hemisphere dataset, which was best suited to test the blazar hypothesis (see Section 2 and Paper I).
Shortly after the publication of Paper I, an updated IceCube -y sky map analysis of the northern hemisphere has been released publicly (IceCube Collaboration, 2022). Among the three northern-sky maps presented in the companion publication (Abbasi et al., 2022), the scan obtained by testing a signal hypothesis with spectral index treated as free parameter is publicly accessible (IceCube Collaboration, 2022, at the time of the writing). Compared to the 7-yr northern-sky map, the newest 9-y northern-sky map is based on better-reconstructed lower-level data and better parametrization of variables in the likelihood framework (see previous section). Therefore, to expand our investigation to the northern celestial hemisphere, we employ this improved 9-y northern-sky map.
The -y northern sky map () used in Paper II, and years southern () hemisphere sky map used in Paper I, may be regarded as distinct neutrino datasets due to the non-overlapping, complementary sky coverage, differences in the energy range, event-data calibration and reconstruction, background characteristics and analysis techniques applied to the individual events (Aartsen et al., 2017b; Buson et al., 2022a; Abbasi et al., 2022).
4 The Neutrino and Blazar Samples
4.1 Neutrino northern yr sky map
The northern hemisphere sky map employed in this study is based on the neutrino data collected by the IceCube observatory between 13 May 2011 and 29 May 2020, for a total exposure time of 3186 days. It uses more than 670 000 individual events, the largest majority of them are due to background. The northern-sky map is generated by applying a maximum likelihood analysis where the neutrino data are optimized for searches of point-like neutrino sources with declination . The overwhelming majority of the events of this dataset are observed at the lower energies, with a median angular resolution of 1.2∘ (Abbasi et al., 2022).
The sky map provides a probability (a local -value), for each direction of the sky at declination, , in a grid of () pixels. The local p-values are derived by applying the maximum likelihood technique to the event data where the model assumes for the putative point-source a power-law spectrum in a given direction of the sky. They indicate the level of clustering in the neutrino data, i.e. a measure of the significance of neutrino events being uniformly distributed. The p-values obtained in such manner yet incorporate the declination-dependence effect of the IceCube data (Coenders, 2016). They should not be confused with the p-values derived from our statistical analysis (see Section 5). We define the negative logarithm of the provided local p-value as log(-value). The local -values range from 0 to 6.75; larger values of imply a larger inconsistency with background expectations and, hence, a higher probability that astrophysical sources are responsible for the spatial clustering of the neutrino events.
4.2 Blazar sample
To search for counterparts to the neutrino data we use the 5BZCat catalog (Massaro et al., 2015). The catalog is a compilation of 3561 objects where each one has been thoroughly inspected to fulfill the criteria defining a blazar-like nature in 5BZCat (see Paper I). The catalog does not rely on any preferential observational energy band or blazar intrinsic physical properties.
Similarly to Paper I, we discard objects that lack an optical spectrum to confirm their blazar nature and appear as “BL Lac candidate” in the 5BZCat. Then we select objects at and located at high latitudes, at . The latter selection is motivated by the paucity of objects in the vicinity of the Galactic plane (due to observational biases). As well as because one may not exclude a-priori a contribution by galactic sources to the putative astrophysical signal (Albert et al., 2022, see also Appendix C). We remove objects at , since no neutrino sky map data are available for regions close to the northern celestial pole. The final sample of 5BZCat blazars employed in the analysis of the northern hemisphere counts a total of 2130 objects. For the reader’s reference, we summarise in Table 1 the relevant information for the northern analysis, including those of Paper I relative to the southern hemisphere analysis.
5 Statistical analysis procedure
In the following we summarise the most salient information about the analysis performed in Paper II. For further details we refer the reader to Paper I. Due to the limited knowledge to guide the selection of the neutrino data, we compute the degree of the blazar/neutrino correlation as a function of two parameters, i.e. the local probability of being astrophysical and the association radius . Being these a posteriori cuts, a statistical penalty will be accounted for, when estimating the post-trial statistical significance, as explained in the following sections.
5.1 Neutrino spot sample
Focusing on the sky map data for , we follow the approach of Paper I and consider only sky positions with the highest values as it is reasonable to assume that for the majority of the sky locations tested with the likelihood fit, the clustering in the neutrino data may be due to non-astrophysical components such as background fluctuations. We adopt as the fiducial neutrino-source location (spot) the map-pixel with the highest -value above a pre-defined . The Right Ascension () and declination () of the map-pixel are chosen as reference coordinates for the neutrino spot. The separation between spots is required to be larger than , i.e. larger than the median angular resolution reported for these data (Abbasi et al., 2022).
Similarly to Paper I, we build three subsamples of putative-neutrino sources with decreasing minimum -value (). In the analysis of the southern hemisphere (see Paper I) the ranged between [3.5,4.0,4.5]. In the latest -y north sky map, the subsample contains a small number of spots (only 5 spots are found). Therefore, in the northern analysis we consider the three spots subsamples defined by in the range [3.0,3.5,4.0]. These contain 82, 34 and 17 spots, respectively. Consistently with the selection criteria applied to the blazar sample, we select only spots at . Upon applying the Galactic plane cut, the final samples of neutrino spots , and comprise 66, 29 and 13 spots, respectively.
5.2 Positional cross-correlation analysis
To estimate the level of correlation between the blazar sample and neutrino data we employ the positional cross-correlation technique presented in Paper I (see also Finley & Westerhoff, 2004; Pierre Auger Collaboration et al., 2008; IceCube Collaboration et al., 2016; Padovani et al., 2016; Resconi et al., 2017; Plavin et al., 2021; Hovatta et al., 2021; Giommi et al., 2020). As association radius for the neutrino spots and blazars we test separation values () close to the median angular resolution reported for this neutrino dataset, in the range from to , with a step of .
We perform a scan in the space where for each set of we match the positions of the 5BZCat objects with the positions of the neutrino spots. To be conservative, only unique associations are allowed, i.e. one neutrino spot may be matched with only one 5BZCat object at most, and vice versa. This is applied both to the experimental data and to the mock data (see later). The number of real matches constitutes our test statistics, we denote it as TS. The pre-trial p-value, , for the set of parameters is estimated by deriving the chance probability of obtaining a test statistic value equal or higher than the one observed for the real data, following Davison & Hinkley (1997). As explained in Paper I we keep fixed the neutrino spot locations. We simulate Monte Carlo (MC) catalogs by randomizing the blazar positions, preserving both the total number and the spatial distribution of the blazars, applying Kolmogorov-Smirnov tests on the spatial distributions (see Paper I). This approach preserves the patterns present in the overall spatial distribution of the blazar sample, at the same time yielding a representative set of random cases. Appendix A addresses the robustness and impact of the randomization strategy on the results.
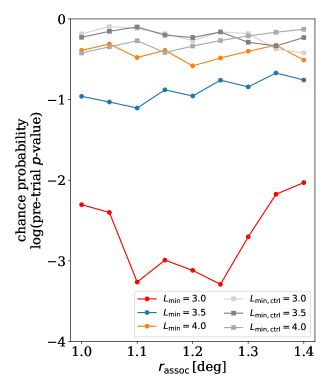
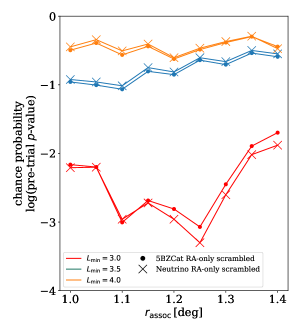
In this way, we obtain for each set of a corresponding pre-trial p-value, as shown in Figure 1. The lowest pre-trial p-value indicates the highest level of correlation potentially present in the data. In the northern sky map analysis this corresponds to a pre-trial p-value, , observed for and . Since these optimal values are derived from the data, a statistical penalty has to be included in the calculation of the final chance probability, i.e. the post-trial p-value. To this aim, we follow the procedure of Paper I and obtain a post-trial p-value . The neutrino sub-sample defined by contains a set of 66 neutrino spots and, given the employed samples, represents the best trade off between total number of neutrino spots in the sample, and neutrino spots possibly originated by 5BZCat blazars. Throughout Paper II, we refer to the northern neutrino spots with as hotspots. 42 hotspots have a 5BZCat association within , they are listed in Table 2.
The robustness of the analysis is tested on a control sample, i.e. astrophysical sources for which no correlation with astrophysical neutrinos is expected. For the northern hemisphere control-sample analysis a post-trial p-value of 1.0 is found. For reference, the test was carried out also for the 7-y southern hemisphere analysis, yielding the same results (post-trial p-value of 1.0), although not discussed in Paper I as the manuscript was yet rich in information. We provide these additional tests in Appendix B, and overlay the control sample results in Figure 1 (gray points).
| Sky region | Dataset (energies) | 5BZCat | Hotspots | Matches | Pre-trial p-value | Post-trial p-value | Reference |
| North | yr data | 2130 | 66 | 42 | () | () | Paper II |
| () | (TeV/ PeV) | Section 5.2 | |||||
| South | yr data | 1177 | 19 | 10 | () | () | Paper I |
| () | ( PeV) | ||||||
| North + South | – | – | – | () | () | Section 5.3 |
5.3 Combining northern / southern sky results
The p-values obtained for the northern hemisphere and the southern hemisphere analysis presented in Paper I may be combined to estimate the chance coincidence probability for the IceCube neutrino data and the 5BZCat catalog global experiment. The two data samples are not correlated and rather complementary, and aim testing the same hypothesis. Hence, the p-values can be combined with the Fisher’s method (Fisher, 1932).
Following the Fisher’s method, we combine the two pre-trial p-values, i.e. for the northern data set, and for the southern hemisphere analysis presented in Paper I, and find a global pre-trial p-value . The global pre-trial p-value represents the strongest statistical correlation potentially present between the blazar catalog and the neutrino data.
Then, we may combine the two post-trial p-values, and obtain the global post-trial p-value on the experiment. Combining the post-trial p-values estimated for the northern hemisphere, i.e. , and the one for the southern hemisphere analysis presented in Paper I, i.e. , yields a global post-trial p-value of . Table 1 summarises these findings.
Based on the northern hemisphere analysis, the blazar/neutrino correlation holds for the complementary muon-proxy energy range TeV to PeV, corroborating to a higher statistical significance the previous findings. I.e., the observed blazar/neutrino correlation is highly unlikely to arise by chance.
6 Previous all-sky searches and neutrino sky maps limitations
Previous studies that employed the neutrino sky map data followed mostly a “blind” approach, with the goal of testing whether any of the individual sky locations shows an inconsistency with background expectations. These searches have the advantage of not requiring any a-priori assumption on the astrophysical signal, at the price of a limited effectiveness due to the large number of trials involved. No evidence for astrophysical point-sources at a statistically significant level () has been reported so far from those searches (see e.g. the latest work in this direction by Abbasi et al., 2022). Nevertheless, they do not rule out the potential presence of genuine astrophysical signals, when different hypothesis are tested (see also Appendix B in Paper I). Contextually, our study reveals long-term ( year-long) astrophysical neutrino emitters, individually below the threshold for firm detection in other previous all-sky searches, that are related to populations of astrophysical sources, i.e. blazars and Seyfert-like objects (see Section 9).
The statistical significance reported in our work may be regarded as a conservative estimate, noting that the northern sky map has a lower spatial resolution () compared to the southern one (). This implies not only a limited accuracy on the position of the putative neutrino sources (spots), it also leads to test a larger number of association radii (e.g. compared to Paper I). The latter impacts the experiment by reducing the post-trial statistical significance, as the tested radii count as trials. However, the association radius is ultimately a proxy for the instrument point spread function (PSF). In the presence of a true spatial correlation, one expects (a-priori) a larger number of matches when sampling angular scales that are comparable to the instrument’s PSF.
7 PEVATRON BLAZARS HOSTED IN THE NORTHERN NEUTRINO SKY
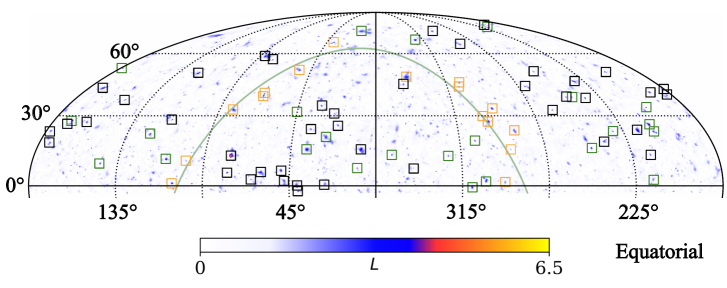
Figure 2 displays the -y northern-sky IceCube map in equatorial coordinates. The sky locations of the neutrino hotspots with a 5BZCat blazar association, i.e. PeVatron blazar, are highlighted by black squares. Hotspots that remain unassociated are reported as green squares, while hotspots located close to the Galactic plane are shown as orange squares (see Appendix C). The samples are also listed in Table 2, Table 3 and Table 4, respectively. We observe a roughly isotropic distribution of neutrino hotspots across the northern sky.
Among the 42 blazar candidate associations with neutrino hotspots found in the northern hemisphere analysis, 19 have a counterpart in the latest -LAT source catalog (see Table 2, Abdollahi et al., 2022), and, therefore, are -ray emitters at MeV-GeV energies. Only 10 were listed in the 2nd -LAT AGN Catalog (2LAC, Ackermann et al., 2011) and, hence, included in the neutrino stacking analysis of Aartsen et al. (2017a). In line with the findings of Paper I, PeVatron blazars cover a fairly large range of redshifts, and are in general weak -ray emitters. A large number of them remain undetected at GeV -ray energies suggesting that, overall, in blazars the neutrino emission is not necessary related to the observed -ray emission.
8 Northern & southern
PeVatron Hotspots
In this section we briefly discuss further evidences supporting the hypothesis that the observed hotspots may be driven by astrophysical sources capable of producing neutrinos with energies up to PeVs.
8.1 Southern Hotspots & Glashow resonance event
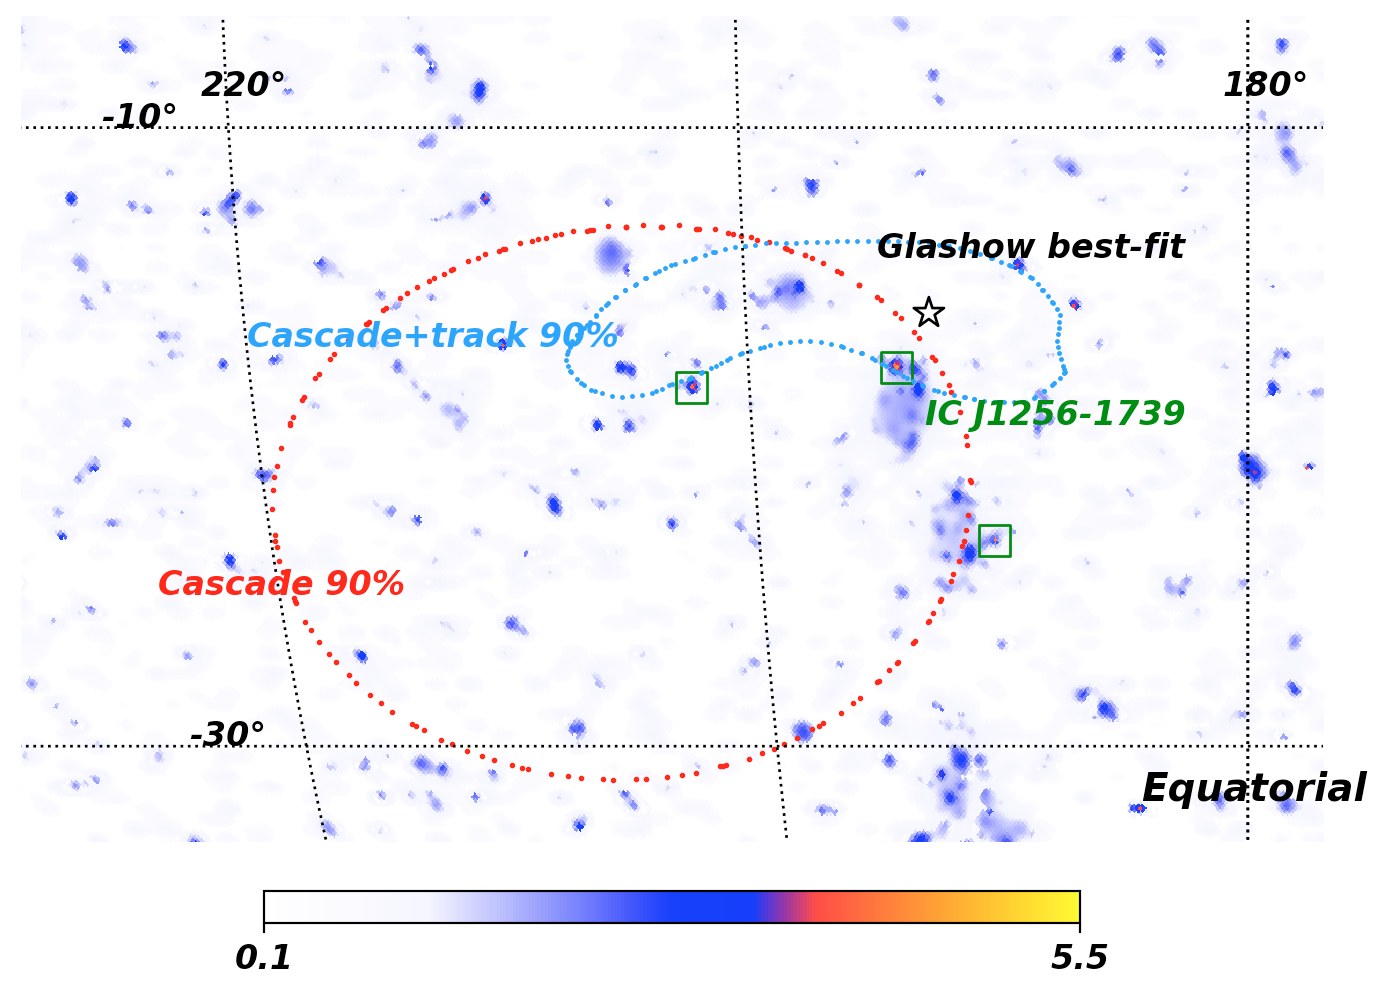
A shower of particles consistent with being produced by a Glashow resonance has been recorded by the IceCube Observatory on 2016 December 8. It originates from the southern celestial hemisphere, and is found to be consistent with a W- boson that decays hadronically, and has an estimated energy of PeV (IceCube Collaboration et al., 2021b). The neutrino event is very likely to be of astrophysical origin, and has a best-reconstructed position of and . Because it was observed in 2016, it is not included in the data used to produce the 7-y IceCube sky map studied in Paper I, that encompasses timescales between 2008-2015.
Figure 3 displays the 7-y sky map with overlaid the positional reconstruction region of the Glashow resonance event. Three hotspots found in Paper I are located in the vicinity of this PeV event. In particular, the unassociated hotspot IC J12561739 is away from the best-fit position of the Glashow resonance event, and located within its positional reconstruction contour.
An enhanced probability of observing electron antineutrinos from blazars, induced by the Glashow resonance, was anticipated by Mannheim (1993) in the seminal work of the “proton blazar” model. The 5BZCat object 5BZQ J12581800 is located away from IC J12561739. Although this separation does not allow us to claim a confident association, we suggest that this blazar may be a candidate counterpart for the hotspot and, possibly, the Glashow event. The separation is close to the optimal association radius found for the southern sky analysis, i.e. (see Paper I), especially when accounting for the resolution of the 7-y sky map.
8.2 Northern PeV neutrino muon-track
consistent with IC J07211125
On 2014 June 11 a PeV track-like event was recorded by the IceCube Observatory (Schoenen & Raedel, 2015). The probability of this event being of atmospheric origin has been estimated to be less than 0.005%, strongly suggesting an astrophysical origin (Aartsen et al., 2016b). The deposited energy has been measured to be PeV of equivalent electromagnetic energy, with a reconstructed median muon-proxy energy of PeV (68% C.L). The median expected muon-neutrino energy is 8.7 PeV. The PeV track-like event has reconstructed celestial coordinates ( C.L.) (Abbasi et al., 2023) consistent with the unassociated hotspot IC J07211125, located at . No 5BZCat object is positionally consistent with this hotspot. The lack of a candidate counterpart to this promising neutrino hotspot may be due to the blazar catalog incompleteness, hence related to the fainter and/or far away population of AGN out of reach of current electromagnetic surveys, or may as well be ascribable to a different population of neutrino emitters.
9 Beyond the multi-messenger
blazar / neutrino connection
The discovery of PeVatron blazars builds on the theoretical prediction that if jetted AGN, in particular those of the blazar class, accelerate hadrons, the accompanying neutrino emission may be observable at the energies accessible by the IceCube observatory. The investigative approach presented in Paper I and Paper II, offers a new view to decode the current and future neutrino data and further exploit them in the multi-messenger context. Assuming that neutrino hotspots are driven by genuine astrophysical sources, our findings suggest additional populations of cosmic neutrino emitters besides blazars, noting that about half of the neutrino hotspots remain unassociated, and/or multiple mechanisms for neutrino production as briefly discussed in the following.
9.1 Jetted active galaxies in the local Universe
Amongst the objects associated with high-energy neutrinos, some stand out in the “enlarged” blazar family of 5BZCat given their radio characteristics that depart from the general blazar fingerprint, i.e. a single compact radio component typically interpreted as a relativistic jet seen at a small viewing angle. Among others, there are 5BZU J16474950, a.k.a. SBS 1646499, located within the association radius of IC J16445052, and 5BZU 18196345, a.k.a. PKS 181463, located within the association radius of IC J18186315 (see Paper I).
Despite displaying the typical double-hump spectral energy distribution of a blazar, the former appears analogous to the radio galaxy Centaurus A (Pajdosz-Śmierciak et al., 2018). The radio morphology of 5BZU J16474950 is complex, with giant megaparsecs radio lobes, probably formed during earlier epochs of jet activity. In the vicinity of the central compact core there is indication of recent reactivation of the nuclear jet, while the larger-scale jet appears structured, with a spine-boundary shear layer morphology. In its host galaxy, type II core-collapse supernovae occur (e.g. SN 2009fe; CBET 1820, Kasliwal et al., 2009).
The latter, i.e. 5BZU 18196345, is a peculiar powerful radio emitter (O’Dea, 1990; Labiano et al., 2007), sometimes classified as a radio galaxy. In addition to a central compact radio component, it displays two lobes and, it may host a young radio-jet that is starting to expand through the near-nuclear interstellar medium (ISM, Santoro et al., 2020). In such case, we might be witnessing an initially relativistic jet that is drilling its way out, and that is rapidly decelerated by collisions in a dense surrounding broad line region or the ISM (Morganti et al., 2011). The radio power of 5BZU 18196345 (P W Hz-1) is two orders of magnitude higher than the most powerful radio Seyfert galaxy, i.e. NGC 1068 (P W Hz-1). 5BZU 18196345 shares similarities with NGC 1068, that is a nearby (14 Mpc) active galaxy suggested as neutrino emitter (Aartsen et al., 2020; Abbasi et al., 2022), among others an host galaxy morphology dominated by a strong, warped disk component that is observed edge-on. It has been suggested as an extreme example of the effects of outflow-cloud interactions in galaxies containing a rich interstellar medium, and perhaps a missing link between radio galaxies and radio-loud Seyfert galaxies (Morganti et al., 2011).
Both 5BZU J16474950 and 5BZU 18196345 show properties common to Seyfert-like galaxies. They are located in the nearby universe (within Mpc and 280 Mpc, respectively), and present remarkable features, ideal to foster the production of high-energy neutrinos, e.g. presence of AGN-driven outflow and/or corona activity, prominent jet-cloud interaction, among others.
9.2 Hotspot IC J1210+3939 & 5BZB J1210+3929,
in the vicinity of NGC 4151
Paper I envisaged the possibility that astrophysical neutrino hotspots could be generated by the cumulative emission of multiple sources. For instance, for a given spot, (neutrino-emitter) objects whose spatial separation is smaller than the angular resolution of current neutrino observatories, would seemingly contribute to enhancing the neutrino clustering local p-value. Further, we anticipated that some of the hotspots could be possibly driven by other populations of neutrino emitters besides blazars, as supported by the detection of hadronic rays from ultra fast outflows (UFOs) hosted in AGN (Ajello et al., 2021).
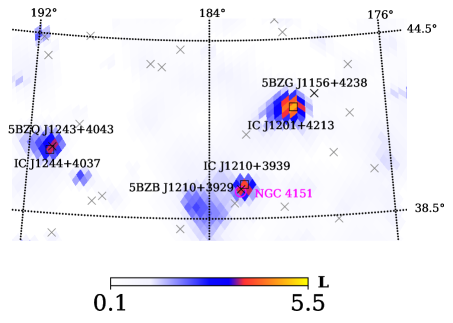
A possible example in this direction is highlighted in Figure 4, which shows a close up view of the 9-y sky map containing the hotspot IC J12103939, associated with 5BZB J1210+3929. Hotspots and associated blazars are pinpointed by black squares and crosses, respectively. In the region, there is also the jetted AGN NGC 4151 (magenta circle), located 5′ away from 5BZB J1210+3929, and 0.2∘ from IC J12103939. NGC 4151, which is not listed in 5BZCat, is a bright Seyfert galaxy suggested as promising neutrino source (e.g., Stecker et al., 1991). Similarly to the other Seyfert-like objects of our PeVatron sample, it is found in the nearby Universe ( Mpc, =0.0033).
NGC 4151 is known to host an UFO and is included in the study that provides evidence for collective, hadronic -ray emission from a small set of UFOs (Ajello et al., 2021). According to Ajello et al. (2021), AGN winds are capable of accelerating cosmic rays with proton maximum energies up to eV, suggesting that they could contribute to the diffuse astrophysical neutrino flux in the IceCube energy range (e.g. Wang & Loeb, 2016). While UFOs are predicted to be generally too faint to be detected individually by the -LAT at rays, NGC 4151 showed hints for the overall highest individual -ray emission. A recent study in the literature claims its detection at rays at high confidence (, Peretti et al., 2023). If this were to be confirmed, NGC 4151 would represent an outlier Seyfert galaxy based on the observed -ray properties. Moreover, theoretical models that attempt to provide a concomitant explanation of the putative neutrino and -ray emission from NGC 4151 face major challenges. For instance, models based on the UFO and/or coronal component predict neutrino fluxes undetectable by IceCube, given the -LAT spectrum (Ajello et al., 2021; Inoue et al., 2021).
Caution should be however paid when considering such claims. We note that the analyses of Peretti et al. (2023) relies on outdated LAT catalogs to model the -ray emission from the region (Abdollahi et al., 2020, i.e. the 8-yr LAT catalog). An inspection of the most recently released -LAT point-source catalog indicates a new faint -ray source (detected at ) in the vicinity of IC J12103939, i.e. 4FGL J1210.33928 (Abdollahi et al., 2022, i.e. the 12-yr LAT catalog). Although the -ray emission is spatially close to NGC 4151, it is associated with the blazar 5BZB J1210+3929 (see also the latest LAT AGN catalog, 4LAC-DR3, Ajello et al., 2022). The association with the blazar offers a natural explanation also in light of the observed neutrino emission: 5BZB J1210+3929 may represent a typical PeVatron blazar, whose comparatively weak GeV emission is emerging with the integration of more LAT exposure. While at the current state one may not exclude a contribution from NGC 4151 to the observed neutrino and -ray emission, this appears to be minor, unless invoking new physical interpretations.
10 Discussion and Conclusions
Conducting the positional cross-correlation analysis between the IceCube northern hemisphere sky map and 5BZCat sources yields a post-trial -value of . This result is combined with the post-trial -value of for the southern hemisphere, presented in Paper I, following the Fisher’s method. The global post-trial -value for the chance association between IceCube neutrino hotspots and 5BZCat blazars is found to be at the level of .
Based on this work, blazars are the first population of extragalactic neutrino sources discovered at high confidence. The two complementary studies point out 52 PeVatron blazars as likely counterparts of high-energy neutrinos, along with 23 hotspots missing an astrophysical counterpart in the 5BZCat. Only 22 PeVatron blazars have been detected at GeV energies by the -LAT (see Table 2, Abdollahi et al., 2022), confirming the conclusions of Paper I.
The majority of PeVatron blazars displays a radio power P W Hz-1, which is typical of high-excitation radio galaxies (HERGs, Best & Heckman, 2012), pushing forward as preferred neutrino emitters objects equipped with radiation fields external to the jet (e.g., from the accretion disc, coronae, photons reprocessed in the broad-line region and from the dusty torus). On the other hand, objects with properties that depart from the ordinary definition of blazars among the PeVatron sample (see Section 9), along with NGC 1068, could represent the first prototypes of a more abundant and (relatively) faint population of neutrino emitters in the nearby universe. Notably, HERGs objects have emission-line spectra similar to some Seyfert galaxies. Seyfert-like galaxies with outflows and/or jets are suggested to be active galaxies in their early stage of radio activity and, as such, are likely to have significant coronal activity, with their nuclear regions wrapped in a cocoon or thick disk of material remnant from the event(s) that trigger the activity. The jet expanding in this medium interacts and sweeps out the rich ISM, providing a good environment for neutrino production.
For objects with a significant coronal activity (as proposed for NGC 1068), in the presence of highly magnetized and turbulent coronae, cosmic rays can be accelerated and subsequently depleted via hadronuclear and photohadronic interactions, providing targets for TeV energy neutrino production. Among the various acceleration processes, capable to accelerate cosmic rays in the corona environment, the magnetic reconnection is the one reaching the highest neutrino energies with values above 100 TeV (Kheirandish et al., 2021, and references therein). Even though the magnetic reconnection has lower flux normalization compared to the stochastic cosmic ray pressure process, still this scenario could provide promising primers to guide future studies.
Appendix A Statistical analysis robustness
As a-posteriori robustness test we repeated the cross-correlation analysis by keeping the blazar sky distribution fixed and randomizing the IceCube neutrino spots. This was done by randomizing the right ascension of the neutrino spots while keeping their declination fixed, thus accounting for a potential residual declination dependence (due to the IceCube acceptance), and repeating the steps of the statistical analysis described in the main text. This procedure yields a minimum pre-trial p-value of which is observed for and , and a post-trial p-value of (see Figure 5, crosses). A slighter higher post-trial p-value with respect to the one in Table 1 is expected because the randomization is applied only to the right ascension. As a matter of fact, when applying (a-posteriori) the randomization to the blazar right ascension only, we obtain comparable results (filled circles in Figure 5), i.e. minimum pre-trial p-value of and a post-trial p-value of .
Appendix B Control sample
The statistical analysis employed in the cross-correlation between 5BZCat and the northern (Section 5), and southern hemisphere neutrino data (Paper I), was applied to a control sample, i.e. objects which are not expected to be neutrino emitters and thus should display no spatial correlation with the neutrino hotspots. To this aim, we employ sources which are not blazars. An established fingerprint for blazar activity is a radio flux density tens of mJy as observed in the GHz band. Therefore, we select faint radio sources, i.e. with a flux density mJy, chosen randomly from the NRAO VLA Sky Survey (NVSS) at 1.4 GHz (Condon et al., 1998) and the Sydney University Molonglo Sky Survey (SUMSS) survey at 843 MHz (Mauch et al., 2003). These two surveys include more than a hundred thousand objects and, combined, cover the full sky. The control sample is built from NVSS between and SUMSS between . We avoid objects at galactic latitudes , and ensure that the total number of sources considered in the cross-correlation analysis is the same as in the respective 5BZCat samples, to be consistent with the experiment on the real data. The northern control sample is composed by 2130 objects located between , and at . The southern control sample counts 1177 objects between , and at .
We perform the statistical cross-correlation analysis described in Section 5 between the northern control sample and the neutrino spots samples employing MCs. For the northern hemisphere sample the best pre-trial p-value is , found for the set of parameters and ; accounting for trials leads to a post-trial p-value of 1.0. Figure 1 displays the results of the space scan for the northern control sample (gray), along with the results for the 5BZCat northern analysis (orange, blue, and red). We provide for reference also the results obtained by applying the analysis described in Paper I to the southern hemisphere control sample. The best pre-trial p-value is , found for the set and , correcting for trials yields a post-trial p-value of 1.0.
Appendix C Low-galactic latitude neutrino hotspots
Neutrino hotspots located close to the the Galactic plane () were not included in the cross-correlation analysis performed in the northern (Sect. 5.2) and southern hemisphere (Paper I). The exclusion of these hotspots is mainly motivated by the poor completeness of the blazar catalog closer to the Galactic plane region. Besides, along the Galactic plane, one may not exclude a priori a possible galactic origin for these neutrino hotspots. In terms of putative neutrino astrophysical genuineness, however, there is no reason to prefer higher galactic latitude hotspots to the lower galactic latitude ones. In principle, these low-galactic latitude hotspots may be promising candidate neutrino sources. As reprove of this, evidence () for neutrino emission from the Galactic plane has been claimed111The IceCube collaboration presented this finding at the 2023 Deutsche Physikalische Gesellschaft Spring meeting, and the 2023 American Physical Society Spring meeting. by the IceCube collaboration, based on an improved IceCube dataset (see also Albert et al., 2022).
In the northern hemisphere sample, 16 hotspots are close to the Galactic plane, at . A-posteriori we note that two of them have a 5BZCat object located within the association radius found in this work (5BZU J19111611 and 5BZQ J02286721). For reference, they are listed in Table 4 along with the celestial coordinates and their corresponding values from the IceCube sky maps. In the Table we report also the galactic hotspots found in the southern hemisphere sample analysed in Paper I.
Appendix D A-posteriori comparison to previous neutrino/blazars correlation studies
An analysis presented in Plavin et al. (2021) investigates the possible correlation between IceCube neutrinos and a sample of 3411 radio-bright AGN, defined by an 8 GHz flux density mJy. The authors apply a time-integrated likelihood technique to compute the significance of the directional correlation between radio-selected objects and a list of candidate neutrino locations. The latter list is a combination of IceCube high-energy neutrino-candidate events and sky locations based on the same 7-years IceCube data studied in Paper I. The radio-selected sample contains 1938 sources at , and is correlated with all the putative neutrino locations of the northern sky map (). The study reports a chance association between the radio sources and the IceCube data at the level, when taking into account the radio-brightness of the objects. The radio-bright selected sample has a total of 1579 objects located at and ; 952 of them are objects in common with the 5BZCat northern sample presented in Section 4.2. We perform a-posteriori the statistical analysis described in Section 5 with the radio-selected sample and the northern neutrino spot samples of Section 4, employing MCs. The best pre-trial p-value is , observed for the set of and . Accounting for trials yields a post-trial p-value of , for a chance correlation between the radio-bright selected sample and the neutrino hotspots.
| IceCube hotspots | Blazar associations | |||||
|---|---|---|---|---|---|---|
| [∘] | [∘] | 5BZCat | Separation[∘] | |||
| IC J02420214 | 40.43 | 2.24 | 3.827 | 5BZQ J02390234 | 1.11413A | 0.60 |
| IC J02430009 | 40.78 | 0.15 | 6.752 | 5BZB J02430046a | 0.409 | 0.63 |
| IC J01470027 | 26.72 | 0.45 | 3.020 | 5BZB J01480129a | 0.94206B | 1.12 |
| IC J03110205 | 47.64 | 2.09 | 3.028 | 5BZQ J03120133a | 0.664 | 0.76 |
| IC J04190241 | 64.86 | 2.69 | 3.155 | 5BZQ J04220219a | 2.277 | 0.93 |
| IC J05090532 | 77.34 | 5.53 | 4.125 | 5BZB J05090541a,b | 0.3365C | 0.16 |
| IC J03590550 | 59.77 | 5.83 | 3.413 | 5BZQ J04000550 | 0.758D | 0.28 |
| IC J03170626 | 49.22 | 6.43 | 3.334 | 5BZB J03140619a | 0.62E | 0.62 |
| IC J22410720 | 340.31 | 7.33 | 3.265 | 5BZQ J22380724 | 1.011 | 0.77 |
| IC J05051247 | 76.29 | 12.79 | 5.192 | 5BZB J05021338a | 0.35F | 1.06 |
| IC J14211306 | 215.16 | 13.09 | 3.444 | 5BZQ J14201205 | 4.026 | 1.00 |
| IC J00321524 | 7.91 | 15.40 | 3.667 | 5BZB J00351515a | – | 0.88 |
| IC J11391822 | 174.73 | 18.37 | 3.379 | 5BZQ J11431843 | 0.37435B | 1.06 |
| IC J15511841 | 237.66 | 18.68 | 3.291 | 5BZB J15461817a | – | 1.08 |
| IC J11522309 | 177.89 | 23.16 | 4.317 | 5BZB J11502417a | 0.209F | 1.18 |
| IC J14282348 | 216.91 | 23.81 | 4.179 | 5BZB J14272348a,c | 0.604G | 0.15 |
| IC J02222408 | 35.51 | 24.13 | 3.107 | 5BZU J02202509 | 0.48H | 1.06 |
| IC J01242537 | 20.92 | 25.61 | 3.772 | 5BZQ J01222502 | 2.025 | 0.62 |
| IC J11252627 | 171.21 | 26.44 | 3.440 | 5BZQ J11252610 | 2.35005B | 0.36 |
| IC J10452717 | 161.19 | 27.28 | 3.175 | 5BZQ J10472635 | 2.56364B | 0.94 |
| IC J07382817 | 114.43 | 28.29 | 3.352 | 5BZB J07372846 | 0.272 | 0.51 |
| IC J01353102 | 23.73 | 31.04 | 3.167 | 5BZQ J01373122 | 1.73063B | 0.58 |
| IC J17123237 | 258.05 | 32.62 | 3.088 | 5BZU J17063214 | 1.06929B | 1.20 |
| IC J02063435 | 31.46 | 34.59 | 3.133 | 5BZB J02083523a | 0.318 | 0.98 |
| IC J10003710 | 149.94 | 37.17 | 3.166 | 5BZB J10043752 | 0.440 | 1.21 |
| IC J15353807 | 233.79 | 38.11 | 3.073 | 5BZU J15363742 | 0.679 | 0.48 |
| IC J16193841 | 244.86 | 38.68 | 3.734 | 5BZQ J16173801 | 1.60867B | 0.73 |
| IC J12103939 | 182.46 | 39.64 | 3.915 | 5BZB J12103929a,d | 0.61693B | 0.20 |
| IC J12444037 | 191.07 | 40.62 | 3.644 | 5BZQ J12434043 | 1.518 | 0.13 |
| IC J12014213 | 180.18 | 42.21 | 4.791 | 5BZG J11564238 | 0.17162B | 0.84 |
| IC J11264249 | 171.57 | 42.81 | 3.332 | 5BZB J11224316 | 0.43516B | 0.88 |
| IC J17424336 | 265.45 | 43.61 | 3.133 | 5BZQ J17404348 | 2.246 | 0.26 |
| IC J22494436 | 342.33 | 44.60 | 3.214 | 5BZB J22474413a | 0.31I | 0.46 |
| IC J15234559 | 230.74 | 45.98 | 3.490 | 5BZB J15234606 | – | 0.15 |
| IC J08055005 | 121.33 | 50.09 | 4.005 | 5BZQ J08084950a,d | 1.4344B | 0.59 |
| IC J13275029 | 201.86 | 50.48 | 3.638 | 5BZQ J13275008 | 1.01191J | 0.33 |
| IC J16445052 | 250.93 | 50.87 | 3.397 | 5BZU J16474950a | 0.0475 | 1.20 |
| IC J05125701 | 78.12 | 57.02 | 3.671 | 5BZQ J05145602 | 2.19 | 1.01 |
| IC J05465844 | 86.54 | 58.73 | 3.234 | 5BZB J05405823a | 0.1K | 0.81 |
| IC J18556531 | 283.87 | 65.51 | 3.041 | 5BZB J18486537a | 0.364 | 0.74 |
| IC J19387330 | 294.50 | 73.50 | 3.548 | 5BZQ J19277358 | 0.302 | 0.85 |
| IC J13567744 | 208.88 | 77.73 | 3.052 | 5BZQ J13577643a | 1.585 | 1.02 |
| \botrule |
-
•
a Objects listed in 4FGL-DR3; b 5BZB J05090541, a.k.a. TXS 0506056; c 5BZB J1427+2348, a.k.a. PKS 1424240; d An excess of neutrino events in the direction of 5BZB J12103929 and 5BZQ J08084950 was yet reported in Smith et al. (2021).; Redshifts are from : A Dunlop et al. (1989); B SDSS-DR17; C Ajello et al. (2014); D Peña-Herazo et al. (2021); E Arsioli et al. (2015); F Truebenbach & Darling (2017); G Landoni et al. (2020); H Paggi et al. (2014); I Shaw et al. (2013); J Hewett & Wild (2010); K Paiano et al. (2020).
| [∘] | [∘] | ||
|---|---|---|---|
| IC J20400036 | 309.90 | 0.60 | 3.494 |
| IC J20110147 | 302.87 | 1.79 | 3.607 |
| IC J14230232 | 215.86 | 2.54 | 3.061 |
| IC J00390729 | 9.67 | 7.48 | 4.342 |
| IC J09380927 | 144.49 | 9.44 | 3.604 |
| IC J07211125 | 110.21 | 11.42 | 4.039 |
| IC J21271238 | 321.86 | 12.64 | 3.129 |
| IC J23261306 | 351.56 | 13.09 | 3.405 |
| IC J02271524 | 36.74 | 15.40 | 3.602 |
| IC J16211601 | 245.21 | 16.02 | 3.804 |
| IC J20271909 | 306.74 | 19.16 | 3.223 |
| IC J01482045 | 26.89 | 20.74 | 3.116 |
| IC J08112211 | 122.70 | 22.19 | 3.060 |
| IC J13532309 | 208.12 | 23.16 | 4.579 |
| IC J15222319 | 230.45 | 23.32 | 3.212 |
| IC J13532617 | 208.30 | 26.28 | 3.692 |
| IC J11212747 | 170.16 | 27.78 | 3.833 |
| IC J03013144 | 45.18 | 31.74 | 3.138 |
| IC J13313352 | 202.68 | 33.87 | 4.013 |
| IC J16063829 | 241.52 | 38.49 | 3.073 |
| IC J11575225 | 179.33 | 52.42 | 4.221 |
| IC J21296756 | 322.12 | 67.93 | 4.029 |
| IC J01067330 | 16.50 | 73.50 | 3.011 |
| IC J14227616 | 215.40 | 76.26 | 3.720 |
| \botrule |
| IceCube hotspots | Potential blazar counterpart | |||||
| [∘] | [∘] | 5BZCat | Separation[∘] | |||
| IC J07030103 | 105.82 | 1.04 | 4.315 | – | – | – |
| IC J19310138 | 292.85 | 1.64 | 3.334 | – | – | – |
| IC J06381039 | 99.49 | 10.66 | 3.136 | – | – | – |
| IC J19141524 | 288.46 | 15.40 | 3.118 | 5BZU J19111611 | – | 0.91 |
| IC J18572339 | 284.24 | 23.64 | 3.092 | – | – | – |
| IC J19502727 | 297.42 | 27.45 | 5.275 | – | – | – |
| IC J19582950 | 299.53 | 29.83 | 4.187 | – | – | – |
| IC J05303248 | 82.44 | 32.80 | 4.049 | – | – | – |
| IC J19303320 | 292.50 | 33.33 | 3.533 | – | – | – |
| IC J04333852a | 68.20 | 38.87 | 3.220 | – | – | – |
| IC J04334025 | 68.20 | 40.42 | 3.066 | – | – | – |
| IC J20304324 | 307.56 | 43.41 | 3.219 | – | – | – |
| IC J20244523 | 306.11 | 45.39 | 3.471 | – | – | – |
| IC J22394808 | 339.71 | 48.14 | 3.214 | – | – | – |
| IC J03335127 | 53.26 | 51.45 | 3.253 | – | – | – |
| IC J02366627 | 39.02 | 66.44 | 3.090 | 5BZQ J02286721 | 0.523 | 1.15 |
| IC J07192240 | 109.78 | 22.67 | 4.081 | – | – | – |
| IC J16045735 | 241.07 | 57.59 | 4.724 | – | – | – |
| \botrule |
References
- Aartsen et al. (2017a) Aartsen, M. G., Abraham, K., Ackermann, M., et al. 2017a, ApJ, 835, 45, doi: 10.3847/1538-4357/835/1/45
- Aartsen et al. (2013) Aartsen, M. G., Abbasi, R., Abdou, Y., et al. 2013, ApJ, 779, 132, doi: 10.1088/0004-637X/779/2/132
- Aartsen et al. (2014) Aartsen, M. G., Ackermann, M., Adams, J., et al. 2014, ApJ, 796, 109, doi: 10.1088/0004-637X/796/2/109
- Aartsen et al. (2016a) Aartsen, M. G., Abraham, K., Ackermann, M., et al. 2016a, ApJ, 833, 3, doi: 10.3847/0004-637X/833/1/3
- Aartsen et al. (2016b) —. 2016b, ApJ, 833, 3, doi: 10.3847/0004-637X/833/1/3
- Aartsen et al. (2017b) —. 2017b, ApJ, 835, 151, doi: 10.3847/1538-4357/835/2/151
- Aartsen et al. (2017c) Aartsen, M. G., Hill, G. C., Kyriacou, A., et al. 2017c, Nature, 551, 596, doi: 10.1038/nature24459
- Aartsen et al. (2019) Aartsen, M. G., Ackermann, M., Adams, J., et al. 2019, European Physical Journal C, 79, 234, doi: 10.1140/epjc/s10052-019-6680-0
- Aartsen et al. (2020) —. 2020, Phys. Rev. Lett., 124, 051103, doi: 10.1103/PhysRevLett.124.051103
- Abbasi et al. (2022) Abbasi, R., Ackermann, M., Adams, J., et al. 2022, Science, 378, 538, doi: 10.1126/science.abg3395
- Abbasi et al. (2023) —. 2023, arXiv e-prints, arXiv:2304.01174, doi: 10.48550/arXiv.2304.01174
- Abdollahi et al. (2020) Abdollahi, S., Acero, F., Ackermann, M., et al. 2020, The Astrophysical Journal Supplement Series, 247, 33
- Abdollahi et al. (2022) Abdollahi, S., Acero, F., Baldini, L., et al. 2022, ApJS, 260, 53, doi: 10.3847/1538-4365/ac6751
- Ackermann et al. (2011) Ackermann, M., Ajello, M., Allafort, A., et al. 2011, ApJ, 743, 171, doi: 10.1088/0004-637X/743/2/171
- Adrián-Martinez et al. (2016) Adrián-Martinez, S., Albert, A., André, M., et al. 2016, ApJ, 823, 65, doi: 10.3847/0004-637X/823/1/65
- Ajello et al. (2014) Ajello, M., Romani, R. W., Gasparrini, D., et al. 2014, ApJ, 780, 73, doi: 10.1088/0004-637X/780/1/73
- Ajello et al. (2021) Ajello, M., Baldini, L., Ballet, J., et al. 2021, ApJ, 921, 144, doi: 10.3847/1538-4357/ac1bb2
- Ajello et al. (2022) —. 2022, ApJS, 263, 24, doi: 10.3847/1538-4365/ac9523
- Albert et al. (2022) Albert, A., Alves, S., André, M., et al. 2022, arXiv e-prints, arXiv:2212.11876, doi: 10.48550/arXiv.2212.11876
- Arsioli et al. (2015) Arsioli, B., Fraga, B., Giommi, P., Padovani, P., & Marrese, P. M. 2015, A&A, 579, A34, doi: 10.1051/0004-6361/201424148
- Astropy Collaboration et al. (2013) Astropy Collaboration, Robitaille, T. P., Tollerud, E. J., et al. 2013, A&A, 558, A33, doi: 10.1051/0004-6361/201322068
- Astropy Collaboration et al. (2018) Astropy Collaboration, Price-Whelan, A. M., Sipőcz, B. M., et al. 2018, AJ, 156, 123, doi: 10.3847/1538-3881/aabc4f
- Atoyan & Dermer (2003) Atoyan, A. M., & Dermer, C. D. 2003, ApJ, 586, 79, doi: 10.1086/346261
- Bellenghi et al. (2021) Bellenghi, C., Glauch, T., Haack, C., et al. 2021, arXiv e-prints, arXiv:2107.08700, doi: 10.48550/arXiv.2107.08700
- Best & Heckman (2012) Best, P. N., & Heckman, T. M. 2012, MNRAS, 421, 1569, doi: 10.1111/j.1365-2966.2012.20414.x
- Buson et al. (2022a) Buson, S., Tramacere, A., Pfeiffer, L., et al. 2022a, ApJ, 933, L43, doi: 10.3847/2041-8213/ac7d5b
- Buson et al. (2022b) —. 2022b, ApJ, 934, L38, doi: 10.3847/2041-8213/ac83a2
- Bustamante & Connolly (2019) Bustamante, M., & Connolly, A. 2019, Phys. Rev. Lett., 122, 041101, doi: 10.1103/PhysRevLett.122.041101
- Cerruti et al. (2019) Cerruti, M., Zech, A., Boisson, C., et al. 2019, MNRAS, 483, L12, doi: 10.1093/mnrasl/sly210
- Coenders (2016) Coenders, S. 2016, PhD thesis, Technical University of Munich, Germany. Available at https://mediatum.ub.tum.de/doc/1327578/document.pdf
- Condon et al. (1998) Condon, J. J., Cotton, W. D., Greisen, E. W., et al. 1998, AJ, 115, 1693, doi: 10.1086/300337
- Davison & Hinkley (1997) Davison, A., & Hinkley, D. C. 1997, Bootstrap Methods and their Application (Cambridge: Cambridge Series in Statistical and Probabilistic Mathematics), doi: 10.1017/CBO9780511802843
- Dermer et al. (2014) Dermer, C. D., Murase, K., & Inoue, Y. 2014, Journal of High Energy Astrophysics, 3, 29, doi: 10.1016/j.jheap.2014.09.001
- Dunlop et al. (1989) Dunlop, J. S., Peacock, J. A., Savage, A., et al. 1989, MNRAS, 238, 1171, doi: 10.1093/mnras/238.4.1171
- Finley & Westerhoff (2004) Finley, C. B., & Westerhoff, S. 2004, Astroparticle Physics, 21, 359, doi: 10.1016/j.astropartphys.2004.01.006
- Fisher (1932) Fisher, R. A. 1932, Statistical Methods for Research Workers (London: Oliver & Boyd)
- Giommi et al. (2020) Giommi, P., Glauch, T., Padovani, P., et al. 2020, MNRAS, 497, 865
- Górski et al. (2005) Górski, K. M., Hivon, E., Banday, A. J., et al. 2005, ApJ, 622, 759, doi: 10.1086/427976
- Hewett & Wild (2010) Hewett, P. C., & Wild, V. 2010, MNRAS, 405, 2302, doi: 10.1111/j.1365-2966.2010.16648.x
- Hooper et al. (2019) Hooper, D., Linden, T., & Vieregg, A. 2019, J. Cosmology Astropart. Phys, 2019, 012, doi: 10.1088/1475-7516/2019/02/012
- Hovatta et al. (2021) Hovatta, T., Lindfors, E., Kiehlmann, S., et al. 2021, A&A, 650, A83, doi: 10.1051/0004-6361/202039481
- IceCube Collaboration (2013) IceCube Collaboration. 2013, Science, 342, 1242856, doi: 10.1126/science.1242856
- IceCube Collaboration (2019) —. 2019, Dataset., doi: 10.21234/exm3-tm26
- IceCube Collaboration (2021) —. 2021, Dataset., doi: 10.21234/gr2021
- IceCube Collaboration (2022) —. 2022, Dataset., doi: 10.21234/03fq-rh11
- IceCube Collaboration et al. (2016) IceCube Collaboration, Pierre Auger Collaboration, & Telescope Array Collaboration. 2016, J. Cosmology Astropart. Phys, 2016, 037, doi: 10.1088/1475-7516/2016/01/037
- IceCube Collaboration et al. (2021a) IceCube Collaboration, Abbasi, R., Ackermann, M., et al. 2021a, Dataset., arXiv:2101.09836. https://arxiv.org/abs/2101.09836
- IceCube Collaboration et al. (2021b) IceCube Collaboration, Aartsen, M. G., Abbasi, R., Ackermann, M., et al. 2021b, Nature, 591, 220, doi: 10.1038/s41586-021-03256-1
- Inoue et al. (2021) Inoue, Y., Khangulyan, D., & Doi, A. 2021, Galaxies, 9, 36, doi: 10.3390/galaxies9020036
- Kasliwal et al. (2009) Kasliwal, M. M., Kulkarni, S. R., Quimby, R., et al. 2009, Central Bureau Electronic Telegrams, 1819, 1
- Keivani et al. (2018) Keivani, A., Murase, K., Petropoulou, M., et al. 2018, ApJ, 864, 84, doi: 10.3847/1538-4357/aad59a
- Kheirandish et al. (2021) Kheirandish, A., Murase, K., & Kimura, S. S. 2021, ApJ, 922, 45, doi: 10.3847/1538-4357/ac1c77
- Labiano et al. (2007) Labiano, A., Barthel, P. D., O’Dea, C. P., et al. 2007, A&A, 463, 97, doi: 10.1051/0004-6361:20066183
- Landoni et al. (2020) Landoni, M., Falomo, R., Paiano, S., & Treves, A. 2020, ApJS, 250, 37, doi: 10.3847/1538-4365/abb5ae
- Mannheim (1993) Mannheim, K. 1993, A&A, 269, 67. https://arxiv.org/abs/astro-ph/9302006
- Mannheim (1995) —. 1995, Astroparticle Physics, 3, 295, doi: 10.1016/0927-6505(94)00044-4
- Massaro et al. (2015) Massaro, E., Maselli, A., Leto, C., et al. 2015, Astrophysics and Space Science, 357, 1
- Mauch et al. (2003) Mauch, T., Murphy, T., Buttery, H. J., et al. 2003, MNRAS, 342, 1117, doi: 10.1046/j.1365-8711.2003.06605.x
- Morganti et al. (2011) Morganti, R., Holt, J., Tadhunter, C., et al. 2011, A&A, 535, A97, doi: 10.1051/0004-6361/201117686
- Murase et al. (2014) Murase, K., Inoue, Y., & Dermer, C. D. 2014, Phys. Rev. D, 90, 023007, doi: 10.1103/PhysRevD.90.023007
- O’Dea (1990) O’Dea, C. P. 1990, MNRAS, 245, 20P
- Padovani et al. (2016) Padovani, P., Resconi, E., Giommi, P., Arsioli, B., & Chang, Y. L. 2016, MNRAS, 457, 3582, doi: 10.1093/mnras/stw228
- Padovani et al. (2017) Padovani, P., Alexander, D. M., Assef, R. J., et al. 2017, A&A Rev., 25, 2, doi: 10.1007/s00159-017-0102-9
- Paggi et al. (2014) Paggi, A., Milisavljevic, D., Masetti, N., et al. 2014, AJ, 147, 112, doi: 10.1088/0004-6256/147/5/112
- Paiano et al. (2020) Paiano, S., Falomo, R., Treves, A., & Scarpa, R. 2020, MNRAS, 497, 94, doi: 10.1093/mnras/staa1840
- Pajdosz-Śmierciak et al. (2018) Pajdosz-Śmierciak, U., Jamrozy, M., Soida, M., & Stawarz, Ł. 2018, ApJ, 868, 64, doi: 10.3847/1538-4357/aae1a9
- Peña-Herazo et al. (2021) Peña-Herazo, H. A., Massaro, F., Gu, M., et al. 2021, AJ, 161, 196, doi: 10.3847/1538-3881/abe41d
- Peretti et al. (2023) Peretti, E., Peron, G., Tombesi, F., et al. 2023, arXiv e-prints, arXiv:2303.03298, doi: 10.48550/arXiv.2303.03298
- Petropoulou et al. (2015) Petropoulou, M., Dimitrakoudis, S., Padovani, P., Mastichiadis, A., & Resconi, E. 2015, MNRAS, 448, 2412, doi: 10.1093/mnras/stv179
- Pierre Auger Collaboration et al. (2008) Pierre Auger Collaboration, Abraham, J., Abreu, P., et al. 2008, Astroparticle Physics, 29, 188, doi: 10.1016/j.astropartphys.2008.01.002
- Plavin et al. (2021) Plavin, A. V., Kovalev, Y. Y., Kovalev, Y. A., & Troitsky, S. V. 2021, ApJ, 908, 157, doi: 10.3847/1538-4357/abceb8
- Reimer (2015) Reimer, A. 2015, in International Cosmic Ray Conference, Vol. 34, 34th International Cosmic Ray Conference (ICRC2015), 1123
- Resconi et al. (2017) Resconi, E., Coenders, S., Padovani, P., Giommi, P., & Caccianiga, L. 2017, MNRAS, 468, 597, doi: 10.1093/mnras/stx498
- Rodrigues et al. (2021) Rodrigues, X., Heinze, J., Palladino, A., van Vliet, A., & Winter, W. 2021, Phys. Rev. Lett., 126, 191101, doi: 10.1103/PhysRevLett.126.191101
- Santoro et al. (2020) Santoro, F., Tadhunter, C., Baron, D., Morganti, R., & Holt, J. 2020, A&A, 644, A54, doi: 10.1051/0004-6361/202039077
- Schoenen & Raedel (2015) Schoenen, S., & Raedel, L. 2015, The Astronomer’s Telegram, 7856, 1
- Shaw et al. (2013) Shaw, M. S., Romani, R. W., Cotter, G., et al. 2013, ApJ, 764, 135, doi: 10.1088/0004-637X/764/2/135
- Smith et al. (2021) Smith, D., Hooper, D., & Vieregg, A. 2021, J. Cosmology Astropart. Phys, 2021, 031, doi: 10.1088/1475-7516/2021/03/031
- Stecker (2013) Stecker, F. W. 2013, Phys. Rev. D, 88, 047301, doi: 10.1103/PhysRevD.88.047301
- Stecker et al. (1991) Stecker, F. W., Done, C., Salamon, M. H., & Sommers, P. 1991, Phys. Rev. Lett., 66, 2697, doi: 10.1103/PhysRevLett.66.2697
- Taylor (2005) Taylor, M. B. 2005, in Astronomical Society of the Pacific Conference Series, Vol. 347, Astronomical Data Analysis Software and Systems XIV, ed. P. Shopbell, M. Britton, & R. Ebert, 29
- Truebenbach & Darling (2017) Truebenbach, A. E., & Darling, J. 2017, ApJS, 233, 3, doi: 10.3847/1538-4365/aa9026
- Wang & Loeb (2016) Wang, X., & Loeb, A. 2016, J. Cosmology Astropart. Phys, 2016, 012, doi: 10.1088/1475-7516/2016/12/012
- Zhou et al. (2021) Zhou, B., Kamionkowski, M., & Liang, Y.-f. 2021, Phys. Rev. D, 103, 123018, doi: 10.1103/PhysRevD.103.123018
- Zonca et al. (2019) Zonca, A., Singer, L., Lenz, D., et al. 2019, The Journal of Open Source Software, 4, 1298, doi: 10.21105/joss.01298