Accurate Systemic Redshifts and Outflow Speeds for Extremely Red Quasars (ERQs)
Abstract
Extremely Red Quasars (ERQs) are thought to represent a brief episode of young quasar and galactic evolution characterized by rapid outflows and obscured growth due to dusty environments. We use new redshift measurements from CO and Ly emission-lines to better constrain outflow velocities from previous line measurements. We present sample of 82 ERQs, and the analysis confirms that ERQs have a higher incidence of large C iv blueshifts, accompanied by large Rest Equivalent Widths (REWs) and smaller line widths than blue quasars. We find that strong blueshifts (>2000 km s-1) are present in 12/54 (22.22%) of ERQs with the most robust redshift indicators. At least 4 out of 15 ERQs in the sample also have blueshifts in their H and low-ionization UV lines ranging from 500 to 1500 km s-1. ERQs with strong C iv blueshifts are substantially offset in C iv REW and Full-Width at Half-Maximum (FWHM) from typical blue quasars in the same velocity range. ERQs have average values of REW = 124Å and FWHM = 5274 km s-1, while blue quasars have REW = 24Å and FWHM = 6973 km s-1. The extreme nature of the outflows in ERQs might explain some of their other spectral properties, such as the large C iv REWs and peculiar wingless profiles owing to more extended broad-line regions participating in outflows. The physical reasons for the extreme outflow properties of ERQs are unclear; however, larger Eddington ratios and/or softer ionizing spectra incident on the outflow gas cannot be ruled out.
keywords:
galaxies: active – quasars: emission lines – galaxies: intergalactic medium – galaxies: evolution – galaxies: high-redshift1 Introduction
Quasars are supermassive black holes rapidly growing by accretion of infalling material at the center of their host galaxy. Accretion can coincide with streams of infalling gas, or galactic assembly, at high redshift. Merger activity, or infalling gas, may be the triggers supplying matter for starbursts and quasar activity (Hopkins et al., 2006, 2008; Somerville et al., 2008; Kereš et al., 2009; Dekel et al., 2009; Faucher-Giguère & Kereš, 2011; Fumagalli et al., 2014; Glikman et al., 2015). This rapid accretion can coincide with outflows, generating feedback, and potentially influence the galaxy’s formation (Costa et al., 2014; Nelson et al., 2015; Suresh et al., 2019). A possible evolutionary scheme is where the central black hole initially grows in obscurity until feedback generates outflows, and clears the obscuring interstellar material, revealing a normal blue quasar (Sanders et al., 1988; Di Matteo et al., 2005; Hopkins et al., 2006, 2008, 2016; Rupke & Veilleux, 2011, 2013; Liu et al., 2013; Stacey et al., 2022).
Red quasars are important for testing the hypothesis that obscured quasars may be in a young, and short-lived, phase in their evolution. Young quasars may be reddened by dust created in a major starburst inside the galaxies, triggered by a merger or cold-mode accretion. These reddened quasars may show signs of youth such as high accretion rates, more infall from the intergalactic medium, or powerful outflows, as they transform in to blue/unobscured quasars. Studies of red/obscured quasars have found many to be in mergers or high-accretion phases (Glikman et al., 2015; Wu et al., 2018; Zakamska et al., 2019).
Extremely red quasars (ERQs) are a unique quasar population selected from the Baryon Oscillation Spectroscopic Survey (BOSS, Paris+17) in the Sloan Digital Sky Survey-III (SDSS, Eisenstein+11) and the ALLWISE data release (Cutri+11; Cutri+13) of the Wide-field Infrared Survey Explorer (WISE, Wright+10), based on red rest-UV to mid-IR colors, – 4.6 (AB magnitudes Ross et al., 2015; Hamann et al., 2017). They are of particular interest because of a suite of other spectral properties connected to their extreme red colors, namely, unusually strong C iv 1549 emission lines with peculiar wingless profiles and frequent large blueshift, a high incidence of broad C iv outflow absorption lines, and exceptionally fast outflows measured in [O iii] 4959,5007 (Hamann et al., 2017; Perrotta et al., 2019). All of these features might be explained by exceptionally powerful accretion-disk outflows, e.g., that produce spatially-extended C iv broad emission line regions that produce large C iv rest equivalent widths (REWs) and feed into the fast, lower-density [O iii] outflows farther out (Zakamska et al., 2016; Hamann et al., 2017; Perrotta et al., 2019). This evidence for prodigious outflows, combined with the extreme dust reddening, make ERQs prime candidates for quasars driving feedback to their host galaxies during the early stages of massive galaxy evolution.
An essential ingredient for understanding quasar outflows, and the exotic properties of ERQs in particular, is accurate systemic redshifts to define the outflow speeds and kinetic energies. The most accurate redshift indicators are narrow emission lines, like [O iii] 5007, that form in the extended galactic or circumgalactic environments of quasars. When these lines are not available, H and various low-ionization broad emission lines in the UV, such as Mg ii 2800, O i 1304, can be useful for normal quasars because they are less likely to be blueshifted (i.e., participating in outflows) than high-ionization emission lines like C iv (e.g. Shen et al., 2008, 2016; Li et al., 2017).
However, these redshift indicators are often problematic for ERQs because outflow signatures are more common and more extreme throughout their spectra. In particular, their [O iii] lines are typically very broad and blueshifted with no distinct narrow components that might form in the extended/galactic environments (Zakamska et al., 2016; Perrotta et al., 2019), and their low-ionization broad emission lines often have large measurement uncertainties due noisy spectra and they might be affected by large blueshifts/outflow speeds throughout the broad emission-line region (including more than just the high-ionization gas, see Section 3 below).
In this paper, we provide reliable systemic redshifts for a sample of 82 ERQs that have existing measurements of CO in their host galaxies (Hamann et al. 2023 in preparation) and/or narrow Ly emission lines (Lau et al., 2022; Gillette et al., 2023, and this work) that form in their extended circumgalactic and/or halo environments. We then use these data to derive blueshifts/outflow speeds for the ERQ C iv 1549 broad emission lines and, whenever possible, reassess the [O iii] 5007 outflow speeds reported previously by (Zakamska et al., 2016; Perrotta et al., 2019, and by Lau et al. in prep.). Our findings provide more accurate results, but support previous claims that ERQs have an unusually high frequency of fast/powerful outflows in these emission line regions, e.g., compared to normal blue quasars at similar redshifts and luminosities.
This paper is organized as follows. Section 2 describes selection criteria for quasars from catalog spectra and their redshifts. Section 3 describes our revised C iv and [O iii] emission-line blueshifts and outflows. Section 4 discusses and summarizes correlations in measured parameters and emission features, such as blueshift, emission strength, and line width. Throughout this paper we adopt a -CDM cosmology with = 69.6 km s-1 Mpc-1, = 0.286 and Λ = 0.714, as adopted by the online cosmology calculator developed by Wright (2006). All magnitudes are on the AB system. Reported wavelengths are in vacuum and in the heliocentric frame.
2 Sample Selection & Systemic Redshifts
The parent sample for our study is the 205 ERQs selected to have – in the combined BOSS survey Hamann et al. (2017). Those authors provide detailed data for the C iv emission lines, including velocity shifts relative to the BOSS DR12 catalogue redshifts (see their Appendix A). The DR12 redshifts derive from automated fits to the BOSS spectra, plus algorithmic corrections based on nominal line blueshifts, that can be off by hundreds or 1000 km s-1 for quasars like ERQs with unusual emission-line properties.
For the present study, we select ERQs from Hamann et al. (2017) that have other, more reliable measurements of the quasar systemic redshifts. These include 14 ERQs with ALMA sub-mm CO(4-3) emission-line measurements by Hamann et al. (2023 in prep.), 6 ERQs with KCWI (integrated field spectroscopy) of the extended Ly halos by Gillette et al. (submitted), and 54 ERQs with narrow Ly emission spikes in their BOSS spectra caused by halo emission. For some of our analysis, we also include 8 ERQs that have well-measured Mg ii emission lines in their BOSS spectra, as measured by Gillette et al. (2023c in prep.).
Table 1 lists some basic catalogue properties and measurements for the total sample of 82 ERQs. The total ERQ sample has median color – 5.3 and redshifts in the range . The subsample of 20 ERQs with from either CO or Ly-halo has median color – 5.7, while the 54 ERQs with only a Ly-spike redshift have median color – 5.1. The small color difference between these two subsamples can be attributed to two factors beyond counting statistics in the samples sizes: 1) our preference for redder ERQs in the ALMA CO and KCWI Ly-halo observations, and 2) redder ERQs having fainter rest-UV fluxes that lead to noisier BOSS spectra and greater difficulty in identifying a narrow Ly-spike for our study (Section 2).
We include a large comparison sample of 39,909 (mostly) blue quasars from the SDSS survey with systemic redshifts measured from the Mg ii 2800 broad emission lines (Gillette et al. 2023c in prep.). Mg ii provides reasonably accurate systemic redshifts for normal blue quasars. For example, Shen et al. (2008) report that, in a large sample of SDSS quasars, the Mg ii line has average blueshift relative to [O iii] of 97 km s-1 and a dispersion in the measured shifts of 269 km s-1. The sample with Mg ii measurements are from emission-line profile fitting to SDSS BOSS spectra, is done with similar methodology as described in Hamann et al. (2017), and with care taken to exclude bad data with custom signal-to-noise measurements and rejection criteria. Mg ii emission is fit with a symmetric Gaussian or double-Gaussian profile, after the Fe ii complex near Mg ii is removed using a Fe ii emission template. Details and results of the fitting in the blue quasar sample to will be presented in Gillette et al. (2023c in prep). C iv blueshifts are determined for the blue quasar sample by calculating the velocity shift of its centroid from the Mg ii profile centroid.
Notes. a ERQ’s BOSS spectra show strong Mg ii or O i emission as well as having a CO or Ly redshift indicator. b [O iii] v98 blueshift determined from Keck-OSIRIS observations by Lau et al. (in prep.).
| ERQ Name | W3 | – | C iv REW | C iv FWHM | C iv shift | [O iii] v98 | |||
|---|---|---|---|---|---|---|---|---|---|
| (mag) | (mag) | indicator | (Å) | (km s-1) | (km s-1) | (km s-1) | |||
| J000610.67+121501.2 | 2.3099 | 14.09 | 8.01 | 2.3183 | CO | 107 | 4540 | 2260 | 5959 |
| J002400.67081110.2 | 2.0633 | 16.19 | 4.63 | 2.0638 | Mg ii | 53 | 2042 | 108 | - |
| J005233.24055653.5 | 2.3542 | 16.00 | 6.37 | 2.3631 | CO | 188 | 2451 | 1469 | - |
| J011601.43050503.9 | 3.1825 | 15.53 | 6.24 | 3.1875 | Ly-Spike | 94 | 2291 | 1240 | - |
| J015222.58+323152.7 | 2.7859 | 15.76 | 5.39 | 2.7925 | Ly-Spike | 136 | 3677 | 980 | - |
| J022052.11+013711.1 | 3.1376 | 15.75 | 6.24 | 3.1375 | Ly-Halo | 328 | 2613 | 576 | - |
| J080547.66+454159.0 | 2.3258 | 15.51 | 6.32 | 2.3127 | Ly-Spike | 109 | 2667 | 524 | 4982 |
| J082224.01+583932.8 | 2.5469 | 15.37 | 4.81 | 2.5667 | Ly-Spike | 65 | 5474 | 3246 | - |
| J082536.31+200040.3 | 2.0938 | 16.77 | 4.74 | 2.0881 | Ly-Spike | 211 | 3265 | 473 | - |
| J082653.42+054247.3 | 2.5734 | 15.18 | 6.01 | 2.5780 | CO | 205 | 2434 | 369 | 3420 |
| J083200.20+161500.3 | 2.4472 | 14.98 | 6.74 | 2.4249 | CO | 300 | 3082 | 297 | 5258 |
| J083448.48+015921.1 | 2.5942 | 14.86 | 5.99 | 2.5850 | CO | 209 | 2863 | 198 | 4426 |
| J084447.66+462338.7 | 2.2168 | 15.15 | 5.96 | 2.2226 | Ly-Spike | 161 | 1656 | 225 | - |
| J085039.50+515831.0 | 1.8914 | 15.62 | 4.97 | 1.9003 | Mg ii | 65 | 1145 | 1062 | - |
| J085229.65+524730.8 | 2.2674 | 16.48 | 4.74 | 2.2526 | Ly-Spike | 64 | 1291 | 322 | - |
| J090014.07+532148.7 | 2.1098 | 17.00 | 7.31 | 2.1042 | Mg ii | 47 | 4296 | 756 | - |
| J090306.18+234909.8 | 2.2635 | 16.91 | 5.02 | 2.2686 | Mg ii | 144 | 2481 | 372 | - |
| J091303.90+234435.2 | 2.4195 | 16.41 | 5.31 | 2.4335 | Ly-Spike | 145 | 2190 | 448 | 2099 |
| J092049.59+282200.9 | 2.2959 | 15.95 | 4.83 | 2.2976 | Ly-Spike | 197 | 1048 | 99 | - |
| J092604.08+524652.9 | 2.3467 | 17.13 | 4.71 | 2.3516 | Ly-Spike | 86 | 3053 | 634 | - |
| J093638.41+101930.3 | 2.4531 | 15.42 | 6.17 | 2.4523 | Ly-Spike | 172 | 1271 | 196 | - |
| J095033.51+211729.1 | 2.7447 | 16.33 | 5.52 | 2.7430 | Ly-Spike | 272 | 1387 | 86 | - |
| J101326.23+611219.9 | 3.7028 | 15.17 | 5.91 | 3.7061 | Ly-Spike | 281 | 5133 | 2945 | - |
| J101533.65+631752.6 | 2.2255 | 16.39 | 5.48 | 2.2337 | Ly-Spike | 130 | 2012 | 394 | - |
| J102353.44+580004.9 | 2.5972 | 15.97 | 5.11 | 2.5996 | Ly-Spike | 116 | 2107 | 120 | - |
| J104718.35+484433.8 | 2.2751 | 15.57 | 5.30 | 2.2767 | Ly-Spike | 158 | 2521 | 33 | - |
| J104754.58+621300.5 | 2.5361 | 16.25 | 5.08 | 2.5566 | Ly-Spike | 105 | 5081 | 2382 | - |
| J110202.68000752.7 | 2.6261 | 17.05 | 4.87 | 2.6261 | Ly-Spike | 121 | 3767 | 311 | - |
| J111346.10+185451.9 | 2.5160 | 17.07 | 4.62 | 2.5188 | Ly-Spike | 127 | 986 | 125 | - |
| J111516.33+194950.4 | 2.7924 | 17.04 | 4.96 | 2.7989 | Ly-Spike | 247 | 1739 | 197 | - |
| J111729.56+462331.2 | 2.1317 | 15.55 | 6.26 | 2.1309 | Ly-Spike | 395 | 3053 | 390 | - |
| J112124.55+570529.6 | 2.3834 | 14.98 | 5.07 | 2.3885 | Ly-Spike | 28 | 1780 | 392 | - |
| J113721.46+142728.8a | 2.3008 | 15.13 | 4.87 | 2.3025 | CO | 98 | 4734 | 2158 | - |
| J113834.68+473250.0a | 2.3105 | 15.85 | 6.09 | 2.3146 | Ly-Spike | 177 | 3296 | 1202 | 3928 |
| J113931.09+460614.3 | 1.8202 | 15.30 | 6.44 | 1.8182 | Mg ii | 47 | 1239 | 110 | - |
| J114508.00+574258.6 | 2.7904 | 14.27 | 4.84 | 2.8747 | Ly-Halo | 38 | 9103 | 8655 | - |
| J121253.47+595801.2 | 2.5841 | 15.85 | 4.95 | 2.5619 | Ly-Spike | 107 | 1402 | 181 | - |
| J121704.70+023417.1 | 2.4163 | 15.43 | 5.59 | 2.4280 | CO | 181 | 2604 | 850 | 2640 |
| J122000.68+064045.3 | 2.7963 | 16.57 | 4.88 | 2.7732 | Ly-Spike | 113 | 1047 | 63 | - |
| J123241.73+091209.3 | 2.3814 | 14.39 | 6.76 | 2.4050 | CO | 225 | 4787 | 3526 | 7026 |
| J124106.97+295220.8 | 2.7935 | 16.49 | 5.35 | 2.7976 | Ly-Spike | 138 | 2600 | 1382 | - |
| J124738.40+501517.7 | 2.3858 | 16.53 | 4.97 | 2.4014 | Ly-Spike | 135 | 3268 | 909 | - |
| J125019.46+630638.6 | 2.4016 | 16.42 | 5.47 | 2.4049 | Ly-Spike | 242 | 1881 | 0 | - |
| J125944.55+240708.3 | 2.1660 | 16.04 | 4.60 | 2.1665 | Mg ii | 46 | 4284 | 115 | - |
| J130114.46+131207.4 | 2.7867 | 16.26 | 5.11 | 2.7892 | Ly-Spike | 186 | 1877 | 347 | - |
| J130630.66+584734.7 | 2.2970 | 16.71 | 5.01 | 2.2986 | Ly-Spike | 331 | 1133 | 30 | - |
| J130936.14+560111.3 | 2.5687 | 15.47 | 6.45 | 2.5794 | Ly-Spike | 161 | 3630 | 519 | - |
| J131047.78+322518.3 | 3.0168 | 15.05 | 5.26 | 3.0164 | Ly-Spike | 226 | 2794 | 914 | - |
| J131330.67+625957.2 | 2.3681 | 17.50 | 4.67 | 2.3714 | Ly-Spike | 82 | 1589 | 49 | - |
| J131351.23+345405.3 | 1.9718 | 15.17 | 4.64 | 1.9706 | Mg ii | 18 | 2397 | 98 | - |
| J131628.32+045316.2 | 2.1446 | 15.55 | 5.74 | 2.1598 | CO | 63 | 3010 | 898 | - |
| J131833.76+261746.9 | 2.2721 | 16.39 | 4.91 | 2.2746 | Ly-Spike | 150 | 1280 | 23 | - |
| J132654.95000530.1 | 3.3241 | 15.17 | 4.75 | 3.3068 | Ly-Spike | 77 | 1607 | 56 | - |
| ERQ Name | W3 | – | C iv REW | C iv FWHM | C iv shift | [O iii] v98 | |||
|---|---|---|---|---|---|---|---|---|---|
| (mag) | (mag) | indicator | (Å) | (km s-1) | (km s-1) | (km s-1) | |||
| J133611.79+404522.8 | 2.0793 | 14.10 | 6.51 | 2.0882 | Mg ii | 20 | 6154 | 2724 | - |
| J134254.45+093059.3a | 2.3430 | 15.92 | 4.90 | 2.3470 | CO | 66 | 3246 | 1558 | 4779 |
| J134417.34+445459.4 | 3.0359 | 15.54 | 6.78 | 3.0408 | Ly-Spike | 310 | 2871 | 1152 | - |
| J134800.13025006.4 | 2.2495 | 15.91 | 5.70 | 2.2374 | CO | 87 | 3654 | 1059 | 4221 |
| J135557.60+144733.1a | 2.7037 | 15.71 | 4.71 | 2.6880 | Ly-Spike | 118 | 2958 | 252 | - |
| J135608.32+073017.2 | 2.2691 | 16.52 | 5.08 | 2.2716 | Ly-Spike | 110 | 2043 | 117 | 1767 |
| J143159.76+173032.6 | 2.3765 | 16.02 | 5.82 | 2.3880 | Ly-Spike | 177 | 2084 | 170 | - |
| J143853.61+371035.3 | 2.3931 | 15.81 | 5.50 | 2.3981 | Mg ii | 29 | 3115 | 137 | - |
| J144932.66+235437.2 | 2.3428 | 16.79 | 4.73 | 2.3453 | Ly-Spike | 98 | 1352 | 95 | - |
| J145113.61+013234.1 | 2.7734 | 14.77 | 5.67 | 2.8130 | Ly-Halo | 87 | 6231 | 3376 | - |
| J145148.01+233845.4 | 2.6214 | 15.01 | 5.51 | 2.6348 | Ly-Halo | 89 | 4166 | 3040 | - |
| J150117.07+231730.9 | 3.0254 | 16.20 | 5.90 | 3.0204 | Ly-Spike | 231 | 4035 | 1940 | - |
| J152941.01+464517.6 | 2.4201 | 15.92 | 4.82 | 2.4189 | Ly-Spike | 159 | 1896 | 151 | - |
| J153108.10+213725.1 | 2.5689 | 16.92 | 5.23 | 2.5639 | Ly-Spike | 213 | 2767 | 253 | - |
| J153446.26+515933.8 | 2.2650 | 17.01 | 4.73 | 2.2658 | Ly-Spike | 127 | 1156 | 95 | - |
| J154243.87+102001.5 | 3.2150 | 15.62 | 6.58 | 3.2166 | Ly-Spike | 114 | 3901 | 2303 | - |
| J154743.78+615431.1 | 2.8682 | 16.81 | 4.89 | 2.8674 | Ly-Spike | 128 | 1177 | 10 | - |
| J154831.92+311951.4 | 2.7364 | 16.91 | 4.82 | 2.7462 | Ly-Spike | 127 | 3050 | 1151 | - |
| J155725.27+260252.7 | 2.8201 | 16.91 | 4.92 | 2.8217 | Ly-Spike | 56 | 1182 | 1 | - |
| J164725.72+522948.6 | 2.7193 | 16.40 | 5.23 | 2.7206 | Ly-Spike | 124 | 1905 | 29 | - |
| J165202.64+172852.3 | 2.9425 | 14.91 | 5.39 | 2.9548 | Ly-Halo | 125 | 2403 | 1285 | 2534 |
| J170558.64+273624.7 | 2.4483 | 15.48 | 5.13 | 2.4461 | Ly-Halo | 157 | 1301 | 267 | - |
| J171420.38+414815.7 | 2.3419 | 16.65 | 4.70 | 2.3303 | Ly-Spike | 130 | 3816 | 816 | - |
| J211329.61+001841.7 | 1.9961 | 16.08 | 7.05 | 1.9998 | Ly-Spike | 171 | 1565 | 226 | - |
| J220337.79+121955.3 | 2.6229 | 15.50 | 6.21 | 2.6229 | Ly-Spike | 266 | 1070 | 110 | - |
| J221524.00005643.8 | 2.5086 | 16.06 | 6.17 | 2.5093 | CO | 153 | 4280 | 1394 | 3877 |
| J222307.12+085701.7a | 2.2890 | 15.65 | 5.60 | 2.2902 | CO | 77 | 3661 | 1130 | 7760b |
| J223754.52+065026.6 | 2.6088 | 16.17 | 5.79 | 2.6117 | Ly-Spike | 141 | 1391 | 11 | - |
| J232326.17010033.1 | 2.3561 | 15.22 | 7.19 | 2.3805 | CO | 256 | 3989 | 2756 | 6458 |
2.1 Systemic Redshift Priorities
Some ERQs in our sample have available more than one of the systemic redshift indicators mentioned above. We choose a single value of for each quasar based on the following priorities. The CO(4-3) emission line has highest priority because it forms (primarily) in dense molecular clouds inside the host galaxies. Although there can be gas motions within the galaxies, we expect the CO line centroids to have velocities similar to the central black holes/quasars (see Hamann et al. 2023 in prep. for discussion). Thus we adopt the CO line centroids provided by Hamann et al. (2023, in prep.), measured from spatially-integrated spectra, for when available.
Second priority for , if a CO(4-3) measurement is not available, is a narrow Ly emission line arising from the spatially-resolved ERQ halo/circumgalactic medium (as measured from Keck-KCWI observations by Lau et al., 2022; Gillette et al., 2023). Redshifts determined this way are denoted by “Ly-halo” in the indicator column in Table 1. We specifically derive redshifts from the spatially-averaged Ly emission from extended regions around the ERQs that exclude the central 1 arcsecond diameter. Excluding the central regions is a precaution to avoid potential i) rapid gas flows near the galactic nucleus, and ii) Ly absorption features appearing along direct sight lines toward the central quasar.
One important result from our studies of ERQ halos with Keck-KCWI (Lau et al., 2022; Gillette et al., 2023) was to confirm the speculation by Hamann et al. (2017) that the narrow Ly emission spikes seen (with surprising frequency) in aperture spectra of ERQs form in their inner halos. In particular, the narrow Ly spikes in aperture spectra consistently have profiles and redshifts very similar to the spatially-resolved halo emission in the KCWI data.
Our third priority for values, when neither CO nor spatially-resolved Ly data are available, are a narrow Ly spike in aperture spectra of the ERQs. Lau et al. (2022) discussed ERQ J000610121501 is a good example, where a distinct narrow Ly spike in aperture spectra clearly forms in the inner halo, and confirmed by mapping data from Keck-KCWI. Gillette et al. (2023) discusses a wider range of cases, and include some where aperture spectra show the profile of narrow Ly spike emitted from the halo blends smoothly into the broad Ly emission line of the quasar. We selected the 59 ERQs from Hamann et al. (2017) with Ly spikes attributable to halo emission based on the appearance of a single narrow emission peak with FWHM < 1,000 km s-1 that is well-measured above the noise and shows no indications of overlying Ly absorption that might distort the emission spike profile. The centroids of these spikes provide . Although we give these values a lower priority than estimates from spatially-resolved Ly halo data, their typical uncertainties are 200 km s-1based on both the line measurement accuracies and our experience comparing these Ly spikes to spatially-resolved Ly emission from ERQ halos (Lau et al., 2022; Gillette et al., 2023). Quasars with determined this way are denoted by “Ly-spike” in Table 1.
Lowest priority are the eight ERQs with measurements from their low-ionization Mg ii 2800 broad emission lines (from a large general study of quasar emission-line blueshifts by Gillette et al. 2023c in prep.). We consider these to be the least reliable redshifts because, unlike normal blue quasars, the low-ionization emission lines in ERQs can also be involved fast outflows leading to large blueshifts (see Hamann et al., 2018, also Section 4 below). None of these quasars with well-measured Mg ii lines also have CO or Ly measures. We note five quasars with CO, or Ly, redshifts and also low-ionization lines with have visibly obvious peak/centroids in Mg ii or O i 1304, indicated in Table 1.
2.2 Potential Biases
Before discussing emission blueshifts, we consider potential biases in the properties of our ERQ subsamples. The ALMA CO and KCWI Ly-halo observations both tended to favor ERQs with large C iv REWs (100 Å) and relatively broad C iv profiles (FWHM 2000 km s-1). This represents the majority of ERQs having exotic spectral line/outflow properties (Section 1 of Hamann et al., 2017; Perrotta et al., 2019). We also tried to include sources with the reddest – colors among ERQs. Altogether, however, these samples span a wide range of ERQs because we wanted to examine a range, and because observational constraints tended to randomize the samples with respect to C iv properties (e.g., source brightness limits, scheduling constraints, and requirements for low declinations and a very narrow redshift range (near 2.4) for the ALMA CO observations). Therefore, while these samples do intentionally include some of the most extreme ERQs, e.g., J123241+091209 and J232326010033 with fast [O iii] outflows (Zakamska et al., 2016; Perrotta et al., 2019) and J114508+574258 with a previously-known large C iv blueshift (Hamann et al., 2017), they should be overall approximately representative of the majority of ERQs with FWHM(C iv) 2000 km s-1. We also note that any remaining tendency for large C iv REWs in these sample might, if anything, favor small C iv blueshifts because large C iv REWs are known to correlate strongly with small blueshifts in the general quasar population (Richards et al., 2011; Coatman et al., 2016; Coatman et al., 2019; Rankine et al., 2020; Temple et al., 2023, Gillette et al. 2023c in prep., also Section 3.1).
There is, however, a substantial bias in the sample of 59 ERQs selected to have a narrow Ly spike in their BOSS spectra. There are two reasons for this. First, selecting for a narrow spike in Ly strongly favors ERQs whose entire Ly profile is narrow and whose other “broad” emission lines, including C iv 1549, are also unusually narrow (e.g., compared to the average for ERQs). Second, narrow C iv emission lines correlate strongly with smaller C iv blueshifts (Figure 1, also Richards et al., 2011; Coatman et al., 2016; Coatman et al., 2019; Rankine et al., 2020; Temple et al., 2023, and Gillette et al. 2023c in prep.). The net effect is that this sample is biased towards both narrower C iv lines and smaller C iv blueshifts than the general ERQ population (see Section 2.2 for more discussion).
3 Emission-line Blueshifts & Outflow Speeds
3.1 C iv Blueshifts
Table 1 lists C iv blueshifts relative to for every ERQ in our sample. We use the C iv emission-line wavelengths preferred by Hamann et al. (2017), namely, the midpoint in the fitted line profiles at their half-maximum heights, and a rest wavelength equal to the average for the doublet, 1549Å. Midpoint wavelengths are the same as the centroid for symmetric profiles, but they avoid possible asymmetries, blueshifted absorption or noise problems in the line wings that would affect the centroid values.
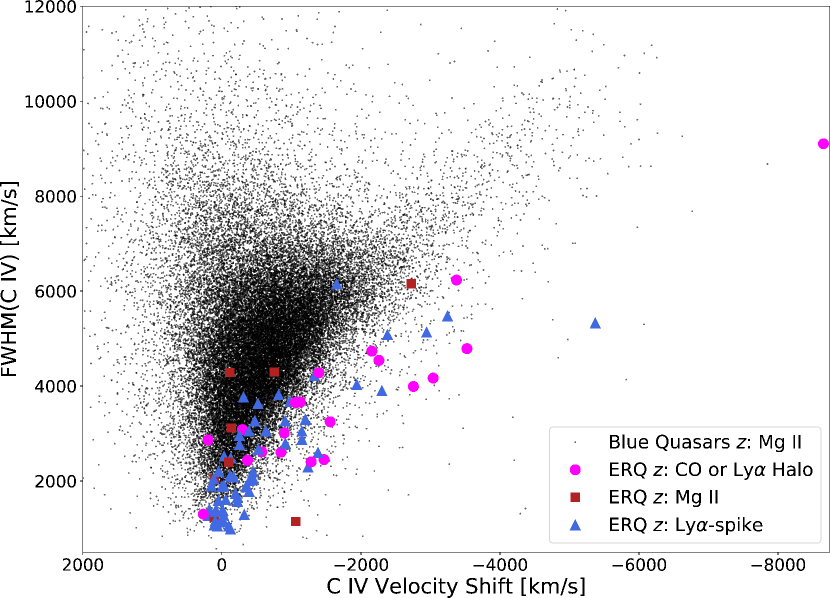
Figures 1 and 2 plot the C iv blueshifts versus FWHM(C iv) and REW(C iv), respectively, for ERQs compared to the normal blue quasar sample (Section 2). Notice that the “Ly-spike" sample of ERQs strongly favors narrow C iv emission lines (Figure 1). This is not representative of the ERQs overall in (Hamann et al., 2017, see also Section 2). However, if we consider only sources with FWHM(C iv) 2000 km s-1 in the Ly-spike sample (orange triangles in Figure 2), the distribution of C iv blueshifts in that subsample, and its behavior in the 3-dimensional space that includes FWHM(C iv) and REW(C iv), closely resemble the ERQs in the CO and Ly-halo samples (which all have FWHM(C iv) 2000 km s-1).
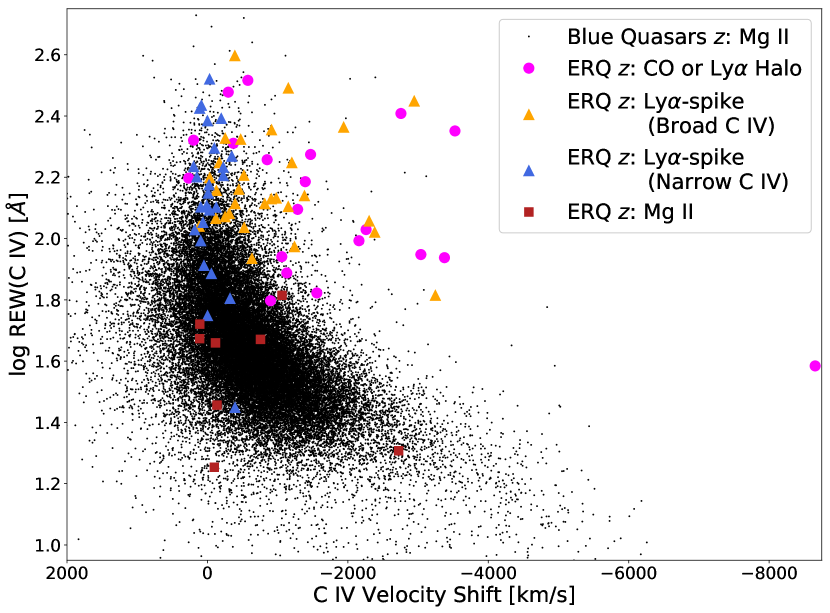
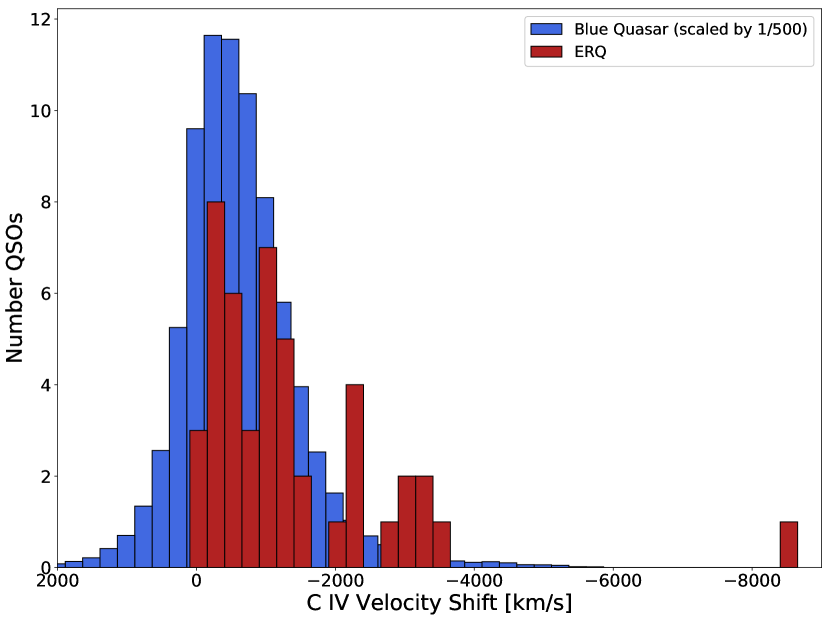
Figure 3 and 4 compare the C iv blueshift and REW distributions, respectively, of ERQs to the blue quasar sample. The ERQs in these figures are from the combined sample of 74 sources with from either CO, Ly-halo, or a Ly-spike with the additional constraint FWHM(C iv) 2000 km s-1.
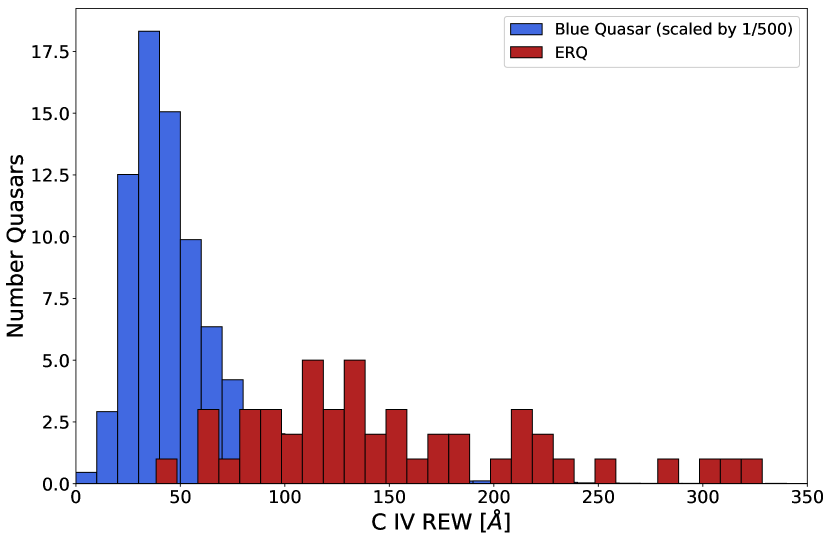
We can see from these figures that ERQs stand out from normal/blue quasars in several ways. First, ERQs have large C iv blueshifts at much larger REW(C iv) and somewhat smaller FWHM(C iv) than normal blue quasars (Figures 2 and 1, respectively). It is well known that large C iv blueshifts correlate strongly with small C iv REWs (Figure 2) and large FWHMs (Figure 1) in normal blue quasars (Richards et al., 2011; Coatman et al., 2016; Coatman et al., 2019; Rankine et al., 2020; Temple et al., 2020; Temple et al., 2023, Gillette et al. 2023c in prep.). The ERQs behave differently. They also exhibit a trend for larger blueshifts tied to larger FWHMs (seen in Figure 1) but, for any given blueshift, the ERQ population is offset toward smaller FWHMs. J114508+574258 is the ERQ with the largest C iv blueshift, at 8655 km s-1 (Table 1), and has one of the smallest C iv REWs and largest FWHMs among all ERQs (Hamann et al., 2017). These properties are consistent the direction of the trends in blue quasars. However, the C iv line in J114508+574258 is substantially broader and at least 4 times larger in REW than expected from trends in blue quasars (Figures 1 and 2). The ERQ samples overall are dramatically offset toward larger REWs than blue quasars, especially at large blueshifts. For example, for quasars with C iv blueshifts 2000 km s-1, the average REW among ERQs is 124Å compared to only 24Å for the blue quasar sample.
Another important difference is the larger fraction of ERQs with large blueshifts compared to the blue quasar population (Figure 3). For example, if we consider all ERQs with well-measured in our study (excluding only those based on Mg ii), the fraction with blueshifts 2000 km s-1 is 12 out of 82, or 14.63 percent per cent. If we further exclude sources with FWHM(C iv) < 2000 km s-1 from our Ly-spike sample, to be more representative of the majority of ERQs in Hamann et al. (2017), we find that 12 out of 54 (22.22 per cent) have blueshifts 2000 km s-1. In contrast, only 0.23 per cent of the 39909 blue quasars in our comparison sample have blueshifts in this range. Richards et al. (2011) find a similar number, with only 21 (0.13 per cent) out of 15,779 quasars having blueshift 2000 km s-1 in their SDSS sample.
3.2 Revised [O iii] Outflow Speeds
Table 1 provides recomputed [O iii] outflow velocities, v98 when available, using our improved systemic redshifts. The [O iii] data are from Perrotta et al. (2019) except for one quasar, J222307+085701, for which we present an [O iii] measurement for the first time (from Lau et al. in prep.). Systemic redshifts used previously by Perrotta et al. (2019) are based on the best redshift indicator available at that time, namely, either H, low-ionization UV emission lines, or distinct narrow components in the [O iii] (see their Table 1). Although not discussed explicitly by those authors, a few of the redshifts based on “low-ions" also considered a narrow core in the Ly emission line, if one was present, similar to our analysis in Section 2.
Out of 15 ERQs with [O iii] data from Perrotta et al. (2019) in our samples, 10 have revised redshifts different from the previous values by 200 km s-1. This is generally good agreement for the purpose of studying high-speed quasar outflows. However, 4 have larger revised redshifts by 500 km s-1 and 3 of those have larger revised redshifts by 1000 km s-1. This implies substantially larger outflow speeds than the previous estimates. In the 4 ERQs with the largest changes, the [O iii] v98 values jumped from 2034 to 2534 km s-1 in J165202+172852, from 5480 to 6458 km s-1 in J232326010033, from 2872 to 3877 km s-1 in J221524005643, and from 5580 to 7026 km s-1 in J123241+091209 (cf. Table 1 here and Table 4 in Perrotta et al., 2019). All 4 of these ERQs with the largest shifts do not have narrow emission features in the quasar spectra, such that the previous redshift estimates came from H or low-ionization UV emission lines.
Five quasars with CO, or Ly, redshifts and low-ionization lines with have visibly obvious peak/centroids in Mg ii or O i. We measure velocity shifts of these low-ionization lines with respect to the most reliable emission lines available. These ERQs include J113721+142728, J113834+473250, J134254+093059, J135557+144733, and J222307+085701, with respective relative velocities of 218, 62, 145, 278, and 285km s-1. We discuss implications of these velocity shifts in Section 4.
One ERQ in our study with [O iii] data from Perrotta et al. (2019), J083448+015921, has a revised redshift that is lower by 653 km s-1. This revision changes the v98 estimate from 5079km s-1 in Perrotta et al. (2019) to 4426 km s-1 here. This is surprising because both the CO(4-3) emission line and the low-ionization UV lines in the quasar spectrum, notably O i 1304, appear reasonably strong and well-measured. Perrotta et al. (2019) do not provide uncertainties on their redshift estimates, but a visual inspection suggests that they should be <200 km s-1 (at 3). The formal uncertainty in the CO measurement be Hamann et al. (2023 in prep.) is 7.3 km s-1. It seems unlikely that the redshift difference is caused by infall in the low-ionization broad emission lines relative to the quasar. We conclude that it might be due to a real kinematic offset between the quasar and the molecular gas emitting CO(4-3) in the quasar’s host galaxy.
4 Summary & Discussion
We present a sample of 82 ERQs that have improved estimates for redshift in order to better constrain outflow velocities from comparisons to previous line measurements. These comparisons are subject to selection biases (see Section 2.2), but overall we confirm ERQs have a higher incidence of large C iv blueshifts accompanied by large REWs and smaller line widths than blue quasars. Blueshfts >2000 km s-1 are present in 12/54 (22.22 per cent) of ERQs with the most robust indicators. ERQs with blueshifts >2000 km s-1 are substantially offset in C iv REW and FWHM from typical blue quasars in the same velocity range, with ERQ averages of REW = 124Å and FWHM = 5274km s-1, compared to blue quasar averages REW = 24Å and FWHM = 6973km s-1.
Our systemic redshifts compared to the previous estimates by Perrotta et al. (2019) already identifies 4 out of 15 ERQs in our sample with blueshifts in their H and low-ionization UV lines ranging from 500 to 1500 km s-1. This is a lower limit to the true fraction of ERQs with large blueshifts in these lines because some of the estimates in Perrotta et al. (2019) relied on narrow emission spikes in [O iii], which agree well with our redshift estimates because they also form in extended environments around the quasars. Thus it appears that a significant fraction of ERQs have large blueshifts throughout their broad emission-line regions. This property of ERQs differs from the situation in normal blue quasars, where fast outflows in the broad emission-line regions are both much rarer than ERQs and primarily limited to the high-ionization gas emissions (e.g., C iv, Richards et al., 2011; Coatman et al., 2019; Rankine et al., 2020).
The extreme nature of the outflows in ERQs might explain some of their other spectral properties, such as the large C iv REWs, e.g., owing to more extended broad emission-line regions that have larger covering factors and reprocess more continuum light from the central quasars, and their peculiar wingless C iv profiles, e.g., if they form mostly in outflows instead of virialized gas near the inner accretion disk (Hamann et al., 2017). It is also interesting to consider that the exceptionally fast [O iii] winds in ERQs might be an outer, lower-density extension to the broad emission-line outflows.
It remains unclear why ERQs tend to have faster/more powerful outflows than normal blue quasars, but there are two factors that might contribute. One is higher Eddington ratios, which can provide a greater radiative driving force compared to gravity. Another is softer UV continuum, where the weaker far-UV flux helps to maintain moderate ionization levels and substantial opacities in the outflow for radiative driving to be seen in the near-UV. There is strong observational evidence for both of these factors leading to faster outflows in normal blue quasars. For example, the He ii 1640 emission-line REW roughly measures the ionizing flux at energies eV relative to the near-UV continuum, on which the line sits, inversely correlates with larger C iv emission-line blueshifts (Richards et al., 2011; Rankine et al., 2020; Temple et al., 2023, Gillette et al. 2023c in prep.) and faster C iv broad absorption-line (BAL) outflows (Baskin et al., 2013; Hamann et al., 2018; Rankine et al., 2020). This inverse relation is consistent with softer UV spectra playing an important role in outflows, and is indicated in hyper-luminous blue quasars (Vietri, G. et al., 2018). It has been shown that larger Eddington ratios can also correlate with larger C iv blueshifts (Baskin & Laor, 2005; Coatman et al., 2016; Rankine et al., 2020; Temple et al., 2023, Gillette et al. 2023c in prep.).
More work is needed to determine if these trends also apply to ERQs and, moreover, if their extreme outflows result from them being at an extreme end of the trends found in blue quasars (e.g., with larger Eddington ratios or softer UV continua). Previous studies have found no significant trend in [O iii] outflow speed with Eddington ratio (as measured from H) among ERQs (see Figure 7 in Perrotta et al., 2019). Unfortunately, there are unique obstacles to testing these trends for ERQs. One is that their emission-line REWs are anomalously large, and He ii is at least partly involved in that tendency (see Figure 8 in Hamann et al., 2017), which could confuse the relationship of this line with larger C iv blueshifts. Another challenge is that Eddington ratios require black hole mass estimates, which are derived normally from one of the broad emission lines like Mg ii. We have shown above that ERQ lines like Mg ii could have kinematics dominated by outflows, instead of virial motions in the local gravity, and thus making them unreliable for black hole mass determinations. Furthermore, obtaining bolometric luminosities necessary for Eddington ratios poses a greater challenge for ERQs compared to normal blue quasars, because their intrinsic SEDs are potentially atypical. Nonetheless, we confirm the extreme properties of ERQ outflows, which motivates future efforts to understand what is the cause of their extreme nature and potential impacts on the host galaxy.
Acknowledgements
JG, FH, and MWL acknowledge support from the USA National Science Foundation grant AST-1911066. The data presented herein were obtained at the W. M. Keck Observatory, which is operated as a scientific partnership among the California Institute of Technology, the University of California and the National Aeronautics and Space Administration. The Observatory was made possible by the generous financial support of the W. M. Keck Foundation. Data presented herein were partially obtained using the California Institute of Technology Remote Observing Facility. The authors wish to recognize and acknowledge the very significant cultural role and reverence that the summit of Maunakea has always had within the indigenous Hawaiian community. We are most fortunate to have the opportunity to conduct observations from this mountain.
Data Availability
The data are available upon request.
References
- Baskin & Laor (2005) Baskin A., Laor A., 2005, Monthly Notices of the Royal Astronomical Society, 356, 1029
- Baskin et al. (2013) Baskin A., Laor A., Hamann F., 2013, Monthly Notices of the Royal Astronomical Society, 432, 1525
- Coatman et al. (2016) Coatman L., Hewett P. C., Banerji M., Richards G. T., 2016, Monthly Notices of the Royal Astronomical Society, 461, 647
- Coatman et al. (2019) Coatman L., Hewett P. C., Banerji M., Richards G. T., Hennawi J. F., Prochaska J. X., 2019, Monthly Notices of the Royal Astronomical Society, 486, 5335
- Costa et al. (2014) Costa T., Sijacki D., Haehnelt M. G., 2014, MNRAS, 444, 2355
- Dekel et al. (2009) Dekel A., et al., 2009, Nature, 457, 451
- Di Matteo et al. (2005) Di Matteo T., Springel V., Hernquist L., 2005, Nature, 433, 604
- Faucher-Giguère & Kereš (2011) Faucher-Giguère C.-A., Kereš D., 2011, MNRAS, 412, L118
- Fumagalli et al. (2014) Fumagalli M., Hennawi J. F., Prochaska J. X., Kasen D., Dekel A., Ceverino D., Primack J., 2014, ApJ, 780, 74
- Gillette et al. (2023) Gillette J., Lau M. W., Hamann F., Perrotta S., Rupke D. S. N., Wylezalek D., Zakamska N. L., Vayner A., 2023, Compact and Quiescent Circumgalactic Medium and Ly Halos around Extremely Red Quasars (ERQs) (arXiv:2303.12835)
- Glikman et al. (2015) Glikman E., Simmons B., Mailly M., Schawinski K., Urry C. M., Lacy M., 2015, The Astrophysical Journal, 806, 218
- Hamann et al. (2017) Hamann F., et al., 2017, MNRAS, 464, 3431
- Hamann et al. (2018) Hamann F., Herbst H., Paris I., Capellupo D., 2018, Monthly Notices of the Royal Astronomical Society, 483, 1808
- Hopkins et al. (2006) Hopkins P. F., Hernquist L., Cox T. J., Di Matteo T., Robertson B., Springel V., 2006, ApJS, 163, 1
- Hopkins et al. (2008) Hopkins P. F., Hernquist L., Cox T. J., Kereš D., 2008, The Astrophysical Journal Supplement Series, 175, 356
- Hopkins et al. (2016) Hopkins P. F., Torrey P., Faucher-Giguère C.-A., Quataert E., Murray N., 2016, Monthly Notices of the Royal Astronomical Society, 458, 816
- Kereš et al. (2009) Kereš D., Katz N., Fardal M., Davé R., Weinberg D. H., 2009, MNRAS, 395, 160
- Lau et al. (2022) Lau M. W., Hamann F., Gillette J., Perrotta S., Rupke D. S. N., Wylezalek D., Zakamska N. L., 2022, Monthly Notices of the Royal Astronomical Society, 515, 1624
- Li et al. (2017) Li J., et al., 2017, The Astrophysical Journal, 846, 79
- Liu et al. (2013) Liu G., Zakamska N. L., Greene J. E., Nesvadba N. P. H., Liu X., 2013, MNRAS, 436, 2576
- Nelson et al. (2015) Nelson D., Genel S., Vogelsberger M., Springel V., Sijacki D., Torrey P., Hernquist L., 2015, MNRAS, 448, 59
- Perrotta et al. (2019) Perrotta S., Hamann F., Zakamska N. L., Alexandroff R. M., Rupke D., Wylezalek D., 2019, MNRAS, 488, 4126
- Rankine et al. (2020) Rankine A. L., Hewett P. C., Banerji M., Richards G. T., 2020, Monthly Notices of the Royal Astronomical Society, 492, 4553
- Richards et al. (2011) Richards G. T., et al., 2011, The Astronomical Journal, 141, 167
- Ross et al. (2015) Ross N. P., et al., 2015, MNRAS, 453, 3932
- Rupke & Veilleux (2011) Rupke D. S. N., Veilleux S., 2011, ApJ, 729, L27
- Rupke & Veilleux (2013) Rupke D. S. N., Veilleux S., 2013, ApJ, 768, 75
- Sanders et al. (1988) Sanders D. B., Soifer B. T., Elias J. H., Neugebauer G., Matthews K., 1988, ApJ, 328, L35
- Shen et al. (2008) Shen Y., Greene J. E., Strauss M. A., Richards G. T., Schneider D. P., 2008, The Astrophysical Journal, 680, 169
- Shen et al. (2016) Shen Y., et al., 2016, ApJ, 831, 7
- Somerville et al. (2008) Somerville R. S., Hopkins P. F., Cox T. J., Robertson B. E., Hernquist L., 2008, Monthly Notices of the Royal Astronomical Society, 391, 481
- Stacey et al. (2022) Stacey H. R., Costa T., McKean J. P., Sharon C. E., Rivera G. C., Glikman E., van der Werf P. P., 2022, Monthly Notices of the Royal Astronomical Society
- Suresh et al. (2019) Suresh J., Nelson D., Genel S., Rubin K. H. R., Hernquist L., 2019, MNRAS, 483, 4040
- Temple et al. (2020) Temple M. J., Banerji M., Hewett P. C., Rankine A. L., Richards G. T., 2020, Monthly Notices of the Royal Astronomical Society, 501, 3061
- Temple et al. (2023) Temple M. J., et al., 2023, Testing AGN outflow and accretion models with CIV and HeII emission line demographics in z=2 quasars (arXiv:2301.02675)
- Vietri, G. et al. (2018) Vietri, G. et al., 2018, A&A, 617, A81
- Wright (2006) Wright E. L., 2006, PASP, 118, 1711
- Wu et al. (2018) Wu J., et al., 2018, ApJ, 852, 96
- Zakamska et al. (2016) Zakamska N. L., et al., 2016, MNRAS, 459, 3144
- Zakamska et al. (2019) Zakamska N. L., et al., 2019, Monthly Notices of the Royal Astronomical Society, 489, 497