Temporal and Latitudinal Variation in Penumbra-Umbra Ratios of the Sunspots: Analyses of RGO, Kodaikanal and Debrecen Databases
keywords:
Sun: Sunspot cycles, Sun: Sunspot area, Sun: Penumbra-umbra ratio, Method: Distribution analysis, Method: Statistical analysis1 Introduction
It has been known almost for two hundred years that the occurrence of sunspots is cyclic, although not strictly periodic. The length of the sunspot cycle (SC) has varied between 9.0 and 13.7 years. The shape of the sunspot cycle has also changed somewhat. Waldmeier noticed the asymmetry of sunspot cycles, with the ascending phase being typically shorter than the declining phase, and that there is an anti-correlation between cycle amplitude and the length of the ascending phase of the cycle (Waldmeier, 1935, 1939). The number of sunspots has been observed, at least, since the 17th century, although the measurements in the early days were scarce and somewhat inaccurate. These early observations include also hand-drawn figures, but these are only for short periods (Neuhäuser, Arlt, and Richter, 2018; Carrasco et al., 2021, 2022). The positions and areas of the sunspots have been systematically recorded by the Royal Greenwich Observatory (RGO) since 1874 (Hathaway, 2013; Mandal et al., 2020). Recently, efforts have been done to estimate the sunspot areas and sometimes even trying to separate umbra and penumbra structures from the early drawings (see the excellent review by Artl and Vaquero, 2020). Since the late 19th century photographic recordings have been done in many observatories. As stated earlier the Royal Greenwich Observatory (RGO) started recordings in 1874 and continued these until 1976 (Hathaway, 2013), Kodaikanal observatory in India has taken white-light images of the sunspots since 1904 (Ravindra et al., 2013; Mandal et al., 2017; Jha et al., 2022), Mt. Wilson has collections from 1917 up to 1982 (Howard, Gilman, and Gilman, 1984; Bogdan et al., 1988), and Debrecen continued the recordings of RGO from 1974 until today (Baranyi et al., 2001; Győri, Ludmány, and Baranyi, 2017).
There have been some studies of penumbra-umbra ratio () of the sunspots during the 20th century. Nicholson (1933) and Waldmeier (1939) found consistent results with each other that decreased as the sunspot size increased. Jensen, Nordø, and Ringnes (1955) reported also a slight decrease of -values as a function of sunspot size but that was higher during maxima than minima of the cycles. During cycle minima the variation of the -values was also smaller with increasing sunspot size. Antalová (1971) noticed that is an increasing function of the sunspot size and in double maxima cycles the ratio is higher in the first maximum than in the second maximum. She also stated that -values do not change with heliographic latitude.
Hathaway (2013) studied the daily records of sunspot group areas compiled by the Royal Observatory, Greenwich from May of 1874 through 1976. He found that, on average, increases from about 5 to 6 with the group area increasing from 100 to 2000Hem, and does not change with latitude or phase of the cycle. He, however, found a peculiar change of with time such that it decreased smoothly from more than 7 in 1905 to lower than 3 by 1930 and then increased again to over 7 in 1961. Carrasco et al. (2018) studied sunspot data from the catalogue published by the Coimbra Astronomical Observatory (CAO) for the period 1929 – 1941. They could not find such kind of change during the analyzed period. There were also significant differences in -values for the smaller groups between the RGO and CAO analyses. They state that the main differences are in the measurements of the umbra area, and while CAO instrument and methods did not change during the period 1929 – 1941, there were changes in RGO arrangements, which could have affected the discrepancy of the results.
Jha, Mandal, and Banerjee (2019) and Jha et al. (2022) have studied -values from the recently published Kodaikanal digitized white-light images from 1904 to 2017. They have also compared their results to the -values of RGO and Debrecen datasets for the same period. They found that increases from 5.5 to 6 as the sunspot size increases from 100 to 2000 Hem. They did not find any systematic trend in smaller (100 Hem) sunspots as was reported earlier in the results from RGO database by Hathaway (2013). Furthermore, they found that the average does not show variation as a function of latitude. They compare time-series calculated from Kodaikanal dataset to the time-series calculated from RGO and Debrecen sunspot datasets. It seems that for the sunspots 100 Hem, -values for Kodaikanal data fluctuate between 4 to 5 all the time and for sunspots 100 Hem between 5 to 6, while for the other two datasets (RGO and Debrecen) the variation is much larger. So Kodaikanal sunspot dataset seems to be more homogeneous than the other two datasets.
Recently Hou et al. (2022) published an article where they analyze the recently digitized sunspot drawings observed from Yunnan Observatories (1957 – 2021) in order to study for the Solar Cycles 19 – 24. They found that is 6.63 0.98, and its probability distribution fits very well to the log-normal distribution function. They did not notice any dependence of the -value on the latitude or the phase of the cycle.
In this study we analyze the latitudinal distribution and temporal evolution of sunspot penumbra-umbra ratio () of SC12 – SC23 (occasionally also SC24, which is, however, only until 2017). To get more data for solid statistics, we superimpose separately the even and odd cycles. To this end we harmonize the duration of the cycles such that all have the same length 128 months, which is about the average for the Solar Cycles 16 – 23, i.e. the interval for the Kodaikanal dataset. This paper is organized as follows. Section 2 presents the databases used in this study. In Section 3 we study the -values of Debrecen dataset for Cycles 21 – 24. Section 4 deals with the -values of RGO Cycles 12 – 20 and Section 5 the -values of Kodaikanal Cycles 16 – 24. In Section 6 we compare the results for the overlapping intervals of the aforementioned datasets and give our conclusions in Section 7.
2 Sunspot Area Databases
In the analyses of sunspot area we use three databases. The longest dataset for umbral and total sunspot areas is recently published Kodaikanal database (Mandal et al., 2017; Jha et al., 2022), which is reconstructed from the white-light images of the same observatory since 1904. Because there are gaps before 1921, and Cycle 24 is incomplete, we use this dataset mainly for the Solar Cycles 16 – 23. Notice that this data contains areas of separate sunspots. Another database is that of the Royal Observatory, Greenwich-USAF/NOAA Sunspot Data for the years 1874 – 2016. This database contains, among others, time, latitude and whole area size (in millionths of solar hemisphere, Hem) for individual sunspots for SC12 – SC23, and also umbra sizes of the sunspots for SC12 – SC20 (Hathaway, 2013). We use here the data for Solar Cycles 12 – 20, i.e the period which contains the whole and umbra areas of the sunspot group data. The third dataset is the Debrecen Photoheliographic Data (DPD), which consist of daily, group and sunspot data (Baranyi et al., 2001; Győri, Ludmány, and Baranyi, 2017). Here we use whole areas and umbra areas of the sunspot group data data, marked in the database with “g”. Because Debrecen database seems to be most precise for the recent Solar Cycles 21 – 24, we use it as a preliminary database. The minima and lengths for the Solar Cycles 12 – 24 used in this study are listed in Table 1.
| Sunspot cycle | Fractional | Year and month | Cycle length |
|---|---|---|---|
| number | year of minimum | of minimum | [years] |
| 12 | 1879.0 | 1878 December | 10.6 |
| 13 | 1889.6 | 1889 August | 12.1 |
| 14 | 1901.7 | 1901 September | 11.8 |
| 15 | 1913.5 | 1913 July | 10.1 |
| 16 | 1923.6 | 1923 August | 10.1 |
| 17 | 1933.7 | 1933 September | 10.4 |
| 18 | 1944.1 | 1944 February | 10.2 |
| 19 | 1954.3 | 1954 April | 10.5 |
| 20 | 1964.8 | 1964 October | 11.7 |
| 21 | 1976.5 | 1976 June | 10.2 |
| 22 | 1986.7 | 1986 September | 10.1 |
| 23 | 1996.8 | 1996 October | 12.2 |
| 24 | 2009.0 | 2008 December | 10.9 |
| 25 | 2020 | 2019 December |
3 Debrecen Sunspot Group Dataset
Figure 1 shows the temporal distribution of penumbra-umbra ratio, q, for Solar Cycles 21 – 24 (Cycle 24 only until 19th June, 2018) of Debrecen sunspot group data. In order to get more data to a more solid statistics, we harmonize the solar cycles having each 128 months, which is about their average cycle-length during the longest database in this study, i.e. Kodaikanal Solar Cycles 16 – 24. We then study separately the superimposed cycles of the aforementioned period for Debrecen data data. The blue vertical errorbars show the standard deviation at each point of the monthly measurements. Interestingly there is a huge valley at the maximum region of the cycles, i.e. around 40-50 months. To analyze this valley in more detail we plot separately the temporal distributions for areas smaller or equal to 100 Hem (small) and over 100 Hem (large). Figure 2 shows for small and large category sunspot groups as blue (red errorbars) and black (magenta errorbars) curves, respectively. The valley exists in both categories but are somewhat deeper in the small category groups (when studying in more detail, it turned out that the decrease is deepest for groups between 50 – 100 Hem). We believe that this decrease in the is related to the Gnevyshev gap (GG) (Gnevyshev, 1967) at about 35 – 40 % from the start of the cycles (Takalo and Mursula, 2018). Figure 3a shows the number of small (blue) and large (red) sunspot groups during Cycles 21 – 23 (Cycle 24 is omitted, because it is incomplete). Note that the number of large groups decreases more than the number of small groups during the GG. This result is consistent with the result by Takalo (2020a) that GG is more visible in large than in small sunspots. It is then understandable that when the relative number of smaller sunspot groups increases, the -values are lower at the GG-region. There is another drop after 60 months but it is caused mainly by Cycle 24, when large groups disappear abruptly after the cycle maximum on 2014. Although the errorbars are quite wide, the shape of the penumbra-umbra curves are very obvious regarding that small groups dominate at the beginning and at the end of the cycles and large groups are relatively more abundant during the maximum of the cycles (see the inset of Figure 3a). The mean -value for small groups (100 Hem) is 5.44 (standard deviation, std=0.90), for large groups (100 Hem) 6.09 (std=0.82) and for all groups (Fig. 1) 5.74 (std=0.82). Note that the standard deviation in the brackets here and later is different from the errorbars in the figures, i.e. it is calculated from the average monthly (or average latitudinal) -values during the cycles, i.e. the larger this std is the more variation (trends) there is in the distribution in the -values.
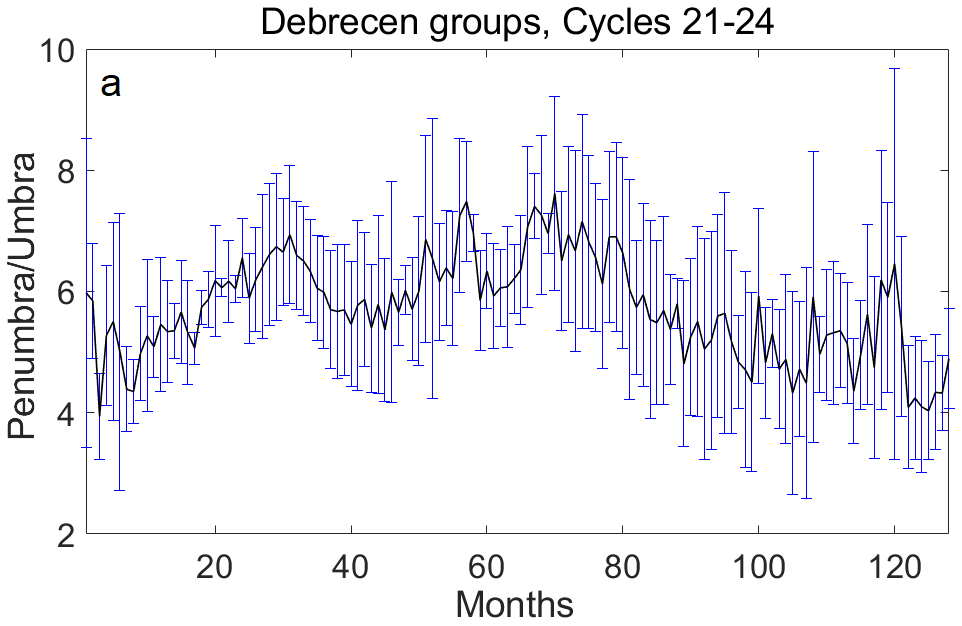
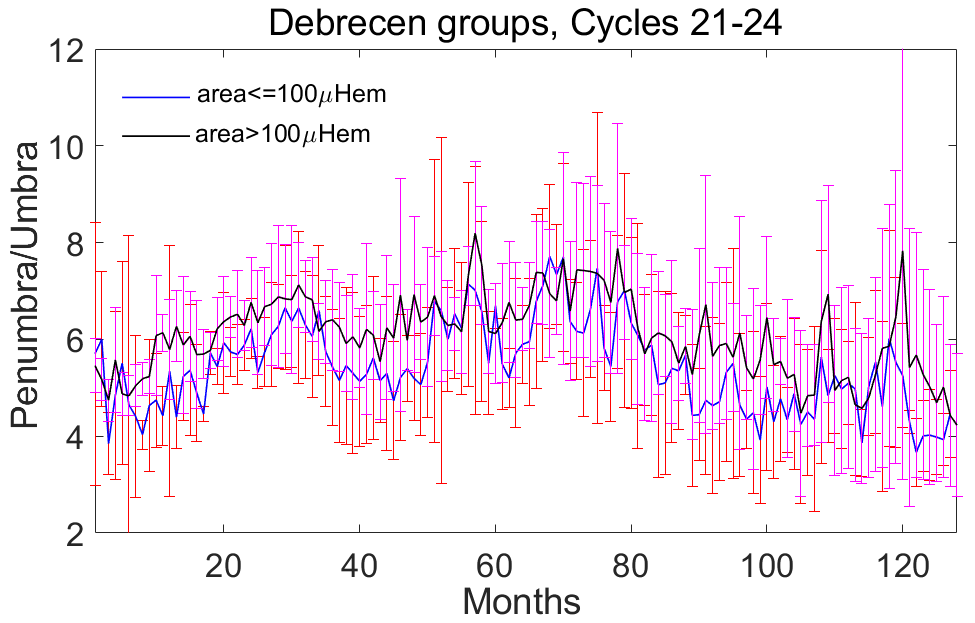

Figure 4a shows the Debrecen latitudinal distribution for the even and odd cycles SC21 – SC24. The -graph for the even cycles has a valley around zero latitude, except that of different values at -3 degrees of latitude. The maximum values seem to be between 10 to 20 degrees at both hemispheres. This is also the region, where the larger sunspot (100 Hem) are most abundant (see Figure 4b). It is, however, clear that the penumbra-umbra ratio is smaller near the Equator of the Sun. This is due to the smaller size of sunspots dominating near the Equator, which leads also to a smaller -value. Note from the inset of Figure 3b that the ratio of small/large sunspots is about four between -2 – 2 degrees while is is under 2 from 5 to 25 degrees in both hemispheres. It is also evident that the odd cycles have higher -values than the even cycles. This is because the odd cycles (21, 23) have more larger category sunspot groups than the even cycles (22, 24). Figure 4b shows the latitudinal number of large sunspot group for even (blue) and odd (black) cycles. Note that the difference of -values is largest at the latitudes in which the difference in number of groups is also largest. Figure 4b shows also that the number of large groups has a local minimum at or near 15 degrees of latitude. This is especially clear for even cycles. This is consistent with the results of Takalo (2020a, b), that large sunspots and sunspot groups have local minima at the time when the average latitude of sunspots crosses 15 degrees of latitude (Takalo, 2020b). We believe that this in turn coincides with the Gnevyshev gap in the SSN and sunspot areas. The mean -values for the sunspot groups of even and odd Cycles 21 – 24 between latitudes -35 – 35 are 5.53 (std=0.56) and 6.33 (std=0.55), respectively.

4 Kodaikanal Sunspot Dataset
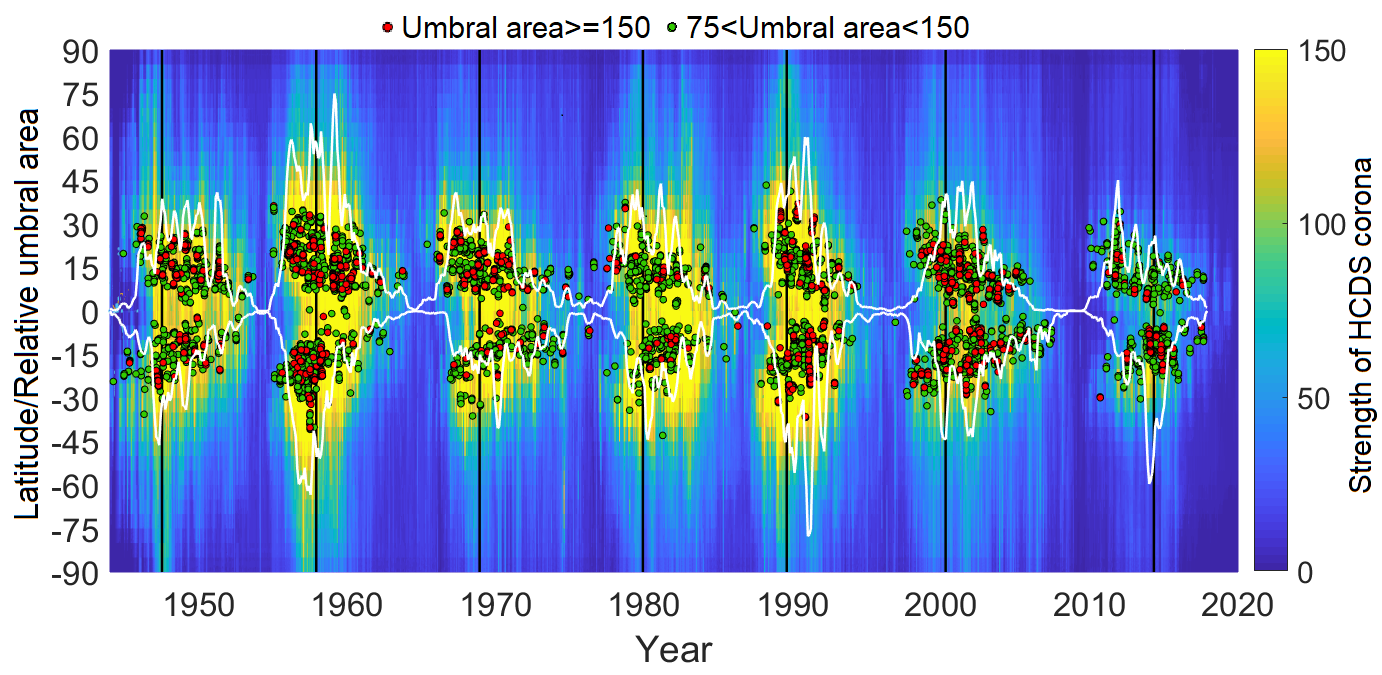
We start the study of the Kodaikanal dataset with a plot of the hemispheric umbral areas in Figure 5 for Solar Cycles 18 – 24 (note that Cycle 24 is incomplete). The reason why we concentrate in this figure on this period is the base-map, which shows the so-called Homogeneous Coronal Data Set (HCDS). The HCDS is the irradiance of the Sun as a star in the coronal green line (Fe XIV, 530.3 nm). It is derived from ground-based observations of the green corona made by the network of coronal stations (Kislovodsk, Lomnický Štít, Norikura, and Sacramento Peak). The coronal intensities have been measured at 72 points at five-degree separation starting from North Pole counterclockwise around the Sun at a height around 50 arcsec. The values are calibrated to the center of the solar disk to get absolute values of intensity, i.e. absolute coronal units (ACU). One ACU represents the intensity of the continuous spectrum of the center of the solar disk in the width of one Ångström at the same wavelength as the observed coronal spectral line (1 ACU = 3.89 Wm-2 sr-1 at 530.3 nm) (Minarovjech, Rušin, and Saniga, 2011; Takalo, 2022). This database exists only for SC18 – 24 and the temporal and spatial intensities of this corona are shown as a colorbar on the right-side of the figure. The green and red dots are sunspots with umbral area 75 to 150Hem and greater or equal than 150Hem, respectively (we do not show the smaller sunspots here for clarity such that the corona is also visible). The white curves show the (relative) hemispheric total umbral areas, and the vertical black lines the official maxima of the solar cycles. Significant information can be extracted from Figure 5. It is evident that the corona and stronger sunspots are located simultaneously, although corona covers larger latitudinal region. It is seen that the maximal corona starts at latitudes 35 – 40 degrees similarly to sunspots, but migrates both towards the Equator and poleward during cycle evolution, although as fainter toward the Poles than equatorside. It is also seen that the strongest Solar Cycle 19 is most symmetric around the cycle in corona and sunspot in the northern hemisphere, while most of the largest sunspots in the southern hemisphere are located in the ascending phase of the cycle. The other cycles, except Cycle 24, have a prolonged tail such that the majority of the large sunspots are after the cycle maximum. Solar Cycle 24 has hemispheric asymmetry such that the largest northern hemisphere sunspots exist before the cycle maximum and southern hemisphere sunspots locate around the cycle maximum. Note also, that Solar Cycles 23 and 24 have much fainter HCDS corona than other cycles.
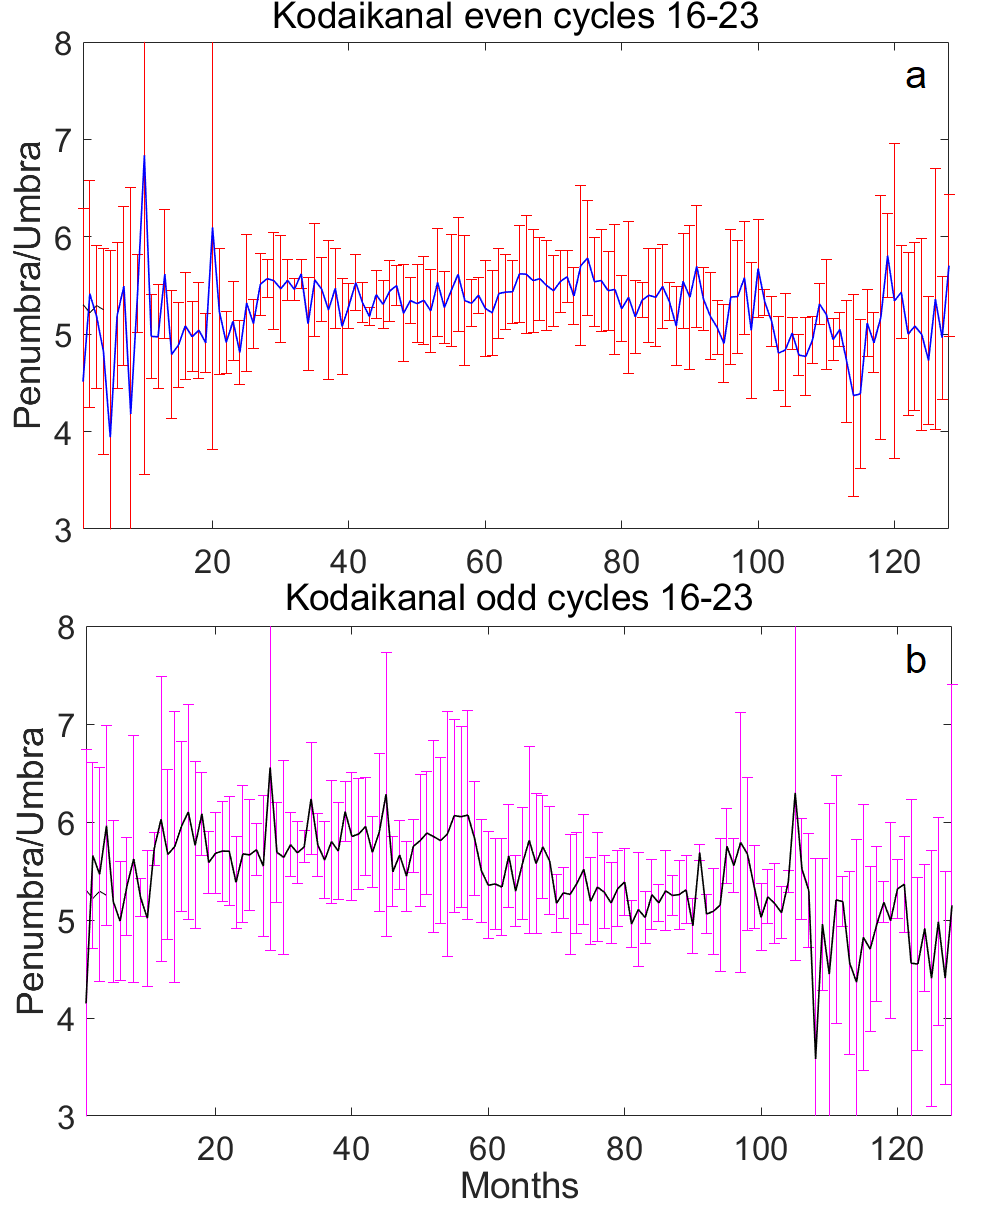
The recently published Kodaikanal sunspot dataset is the longest sunspot set containing also areas of sunspot umbras recorded on a single station. We again harmonize Solar Cycles 16 – 23 having each 128 months. Figures 6a and b show the penumbra umbra ratio () for the even and odd cycles for all sunspots of SC16 – SC23. These figures show that the odd cycles have moderately higher ratio than the even cycles in the ascending phase of the average cycle. This means that odd cycles have considerable more large sunspots in the ascending phase than after the maximum. On the other hand the shape of the -graph for the even cycles reminds more the shape of the sunspot cycle itself, i.e, largest sunspots are in the middle of the cycle. The error limits are smaller than for Debrecen data, especially for the even cycles. The mean for even and odd cycles are 5.27 and 5.43 with standard deviations 0.36 and 0.47 calculated from the monthly -values, respectively.
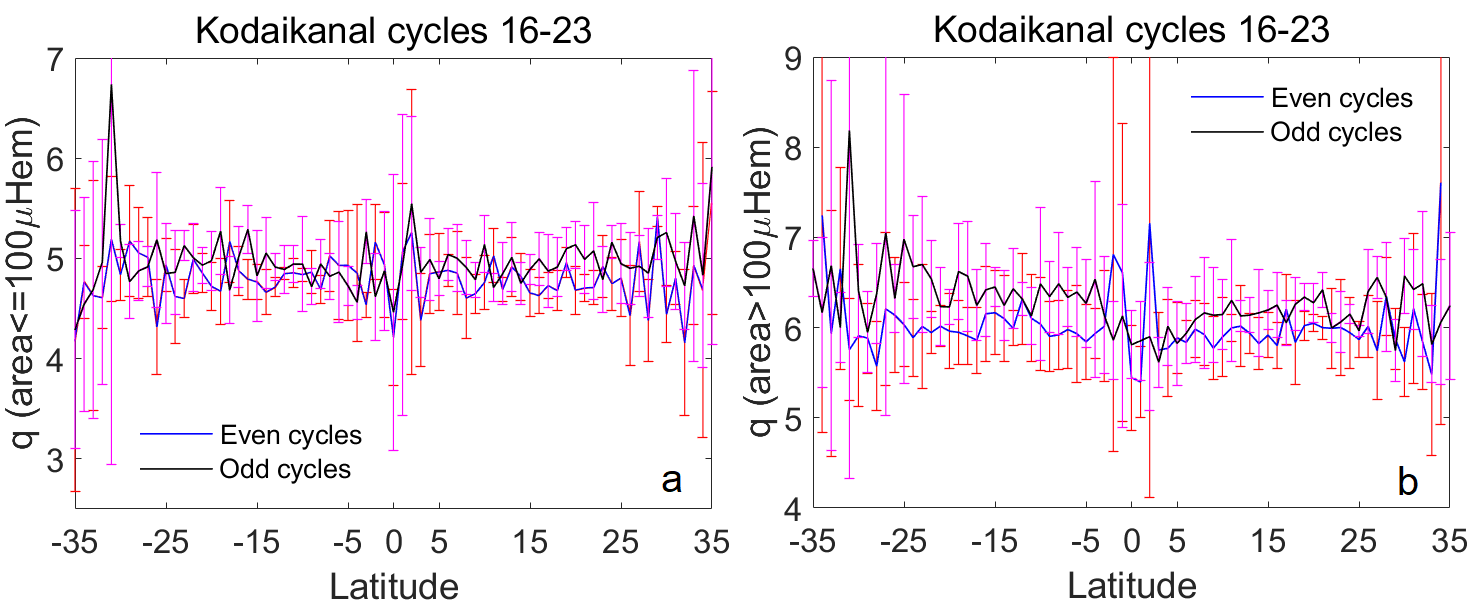
Figures 7a and b show the latitudinal penumbra-umbra ratio for sunspots smaller than 100 Hem and for sunspots larger than 100 Hem of even (blue with red errorbars) and odd (black with magenta errorbars) cycles. We restrict again the latitudes between -35 and 35 degrees, because the small number of umbral data (the divisor in the calculation of penumbra-umbra ratio) causes quite wild behavior at larger latitudes. Note that the error limits are nevertheless large around zero latitude and at latitudes higher than 25 degrees. The latitudinal distribution of -values is quite flat for small sunspots but have more variation for large sunspots. Note that for large category odd cycles there is again a valley around zero latitude, but there are bad values (very wide errorbars) on both sides of the zero latitude for the even cycles. The mean values for between -35 to 35 degrees of smaller category and larger category sunspots are for the even cycles 4.79 (std=0.32) and 6.02 (0.37), and for the odd cycles 5.00 (std=0.48), 6.29 (0.36), respectively.
5 RGO Sunspot Group Dataset
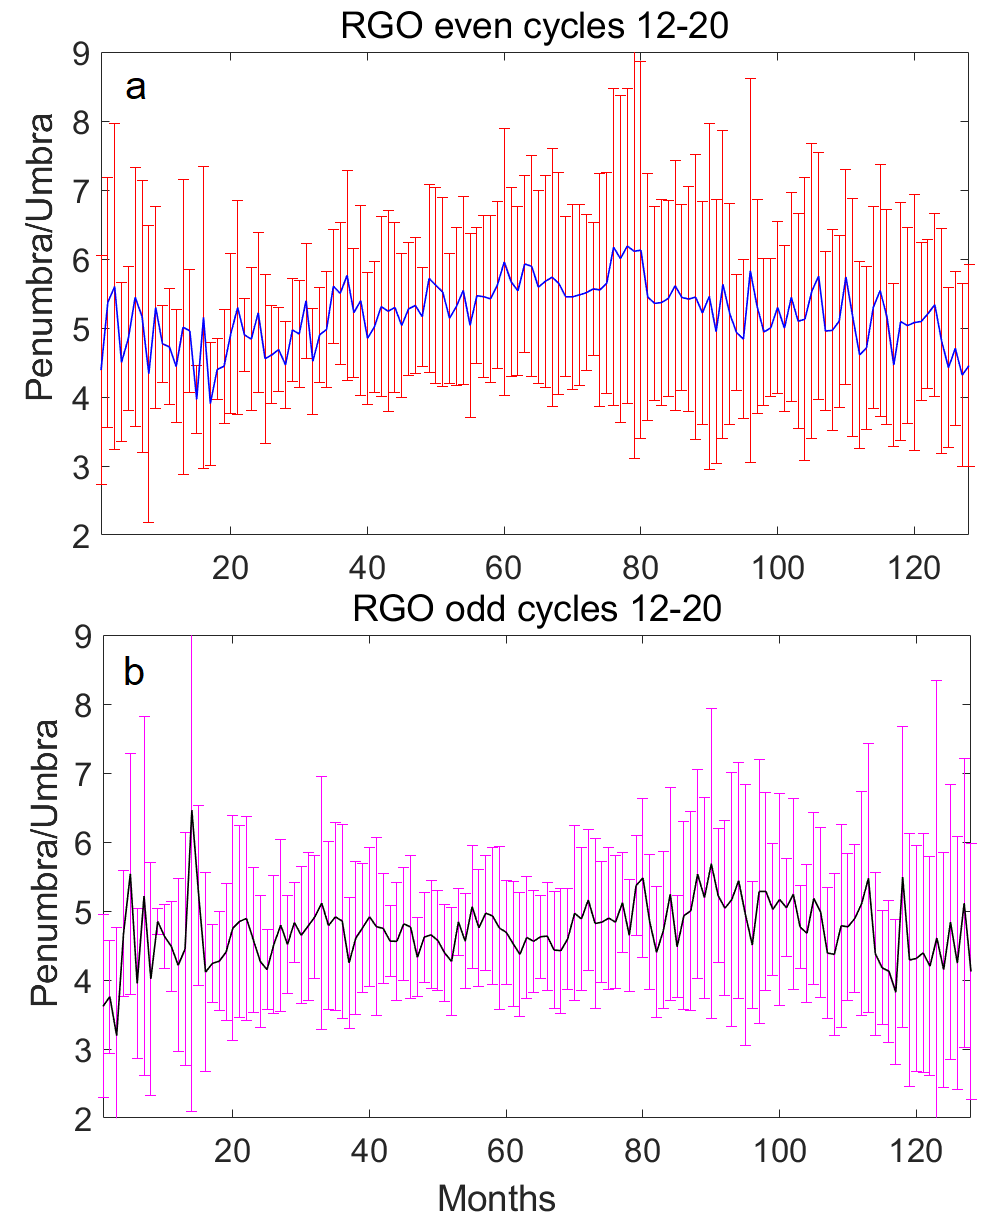
The Royal Greenwich Observatory (RGO) compiled sunspot group observations from a small network of observatories starting in May of 1874. These observations lasted until 1976 after which the measurement have been done in Debrecen. The RGO sunspot group dataset contains also umbra areas and that is why we can study penumbra-umbra ratios for the total Solar Cycles 12 – 20 using this dataset. We use the same common length for the cycles in order to compare the results with Kodaikanal distributions. Figures 8a and b show the temporal penumbra-umbra ratios of the RGO dataset for the even and odd cycles, respectively. In this case for the even cycles seems to be somewhat higher than for the odd cycles. The monthly -graph is flatter for the odd cycles than for the even cycles, but both have slightly higher values in the descending part of the cycles. The mean values for are 5.20 and 4.75 with standard deviations 0.46 and 0.41 for the even and odd cycles, respectively. Note that now (Cycles 12 – 20) even cycles have higher average -value than odd cycles, while for Kodaikanal (Cycles 16 – 23) even cycles have lower average -value than odd cycles.
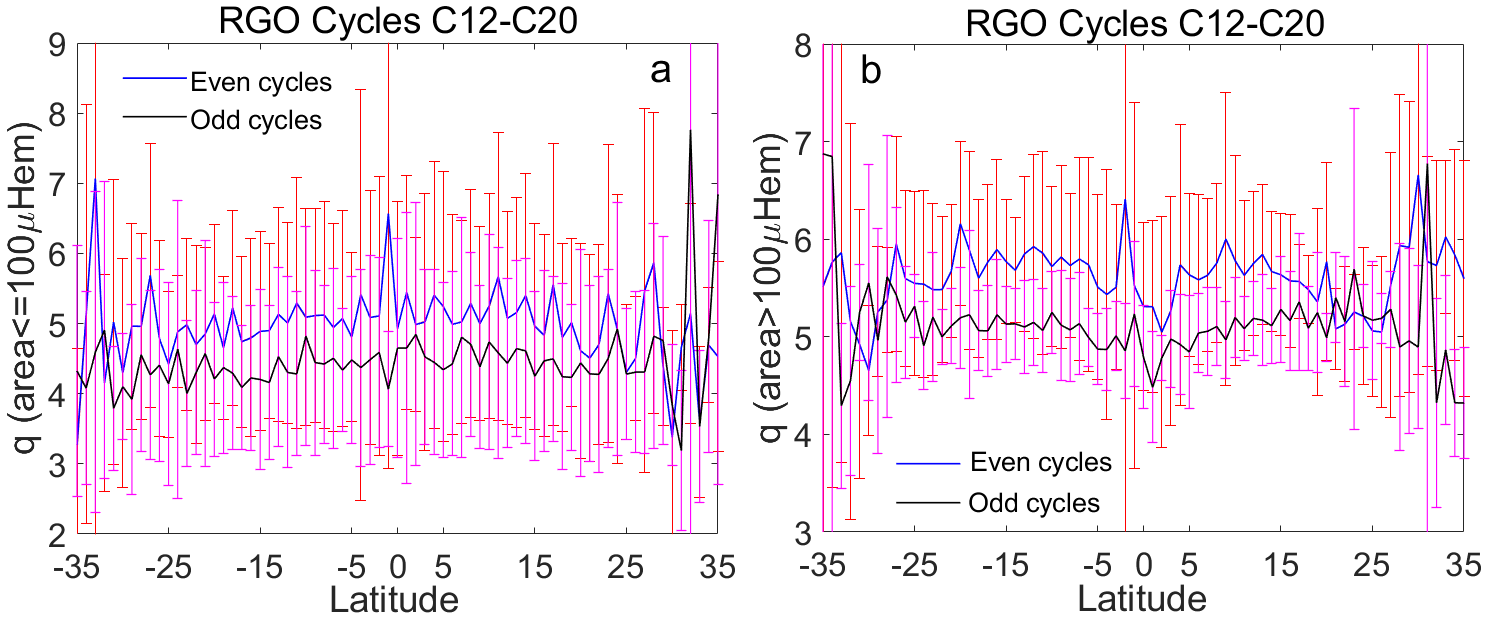
Figures 9a and b show the latitudinal penumbra-umbra ratios for sunspot groups smaller than 100 Hem and larger than 100 Hem, respectively. The overall shape of the ratio for small groups is flat, if not slightly convex upwards with no valleys or humps. There are, however, huge errorbars in the small category plots. These are due to the large variation in the RGO penumbra/umbra ratio, especially for small groups (Hathaway, 2013; Jha et al., 2022). As stated earlier, Carrasco et al. (2018) did not find such large variation in the study of Coimbra Astronomical Observatory measurements for the period 1929 – 1941. For larger sunspot groups there is a shallow valley around zero degrees, except a couple of anomalous values at negative low latitudes. The maxima are between 5 to 20 degrees of latitude for the even cycles, but are wider and flatter for the odd cycles. Note that, although there are valleys around zero latitude, they have just minor significance, because the errorbars for large group -values are also quite wide. The -values between -35 to 35 degrees for small and large groups are 4.97 (std=0.56), 4.47 (0.58) and 5.61 (0.33), 5.13 (0.45) for the even and odd cycles, respectively.
6 Comparison of Kodaikanal, RGO and Debrecen Sunspot Datasets
There are overlapping Cycles 16 – 20 in RGO and Kodaikanal datasets and Cycles 21 – 23 in Kodaikanal and Debrecen dataset. That is why it is appropriate to compare these intervals between those data. Figure 10 shows the penumbra-umbra ratios for RGO and Kodaikanal Solar Cycles 16 – 20. It is clear that Kodaikanal is moderately higher than RGO , except and the end of the average cycle. The shape of the -graph for Kodaikanal is quite similar to Kodaikanal even cycles (Figure 6) but the -graph of the RGO has no trends. This is because the -graphs for separate cycles have opposite trends (C16 decreasing, C17 increasing etc., see also Jha et al., 2022), which cancel each other when they are overlaid such that the sum is quite flat. The mean values for the average Cycle between 16 – 20 are 5.35 and 4.75 with standard deviations 0.33 and 0.26 for Kodaikanal and RGO cycles, respectively.
Figure 11 shows the -graphs for Kodaikanal and Debrecen sunspot datasets of Solar Cycles 21 – 24. We show only the errorbars of Kodaikanal -values, because the graph for Debrecen is same as in Figure 1. It is evident that Debrecen has higher values except at the very beginning and at the end of the cycles. Otherwise the -graph of Debrecen data has much more structure than the -graph of Kodaikanal data. The most interesting difference between these -graphs is the GG-related decrease around 40-50 months in Debrecen , which does not exist in Kodaikanal . Note that Kodaikanal is highest in the ascending phase of the cycle and has also a shallow valley in -values somewhat later than Debrecen, i.e. between 50 – 60 months. The mean -value for Debrecen is 5.90 (std=0.76), and mean -value for Kodaikanal is 5.34 (std=0.56).
Figures 12a and b show the total and umbral areas for Debrecen and Kodaikanal data, respectively. This figure may explain why Kodaikanal does not show the GG-related valley, which is so distinct in the Debrecen temporal . Debrecen data have a deep decrease in both total sunspot and umbral area between 42 – 51 months, which is related to GG-phenomenon. On the other hand, Kodaikanal data have two drops, first at 35 – 42 and second very short at Debrecen GG region (47 months). It turns out that the first is related to odd cycles and the second to even cycles. The latter drop is narrow, because odd cycles have maxima at the time of the even cycles minima. Neither of these seem, however, to cause the -value to decrease during the GG-regions. Note that Kodaikanal areas are calculated from separate sunspots and Debrecen areas from sunspot groups. We, however, have done similar a analysis also to Debrecen sunspot data (shown with “s” in the database), and it gives results consistent with the Debrecen -values of the groups.
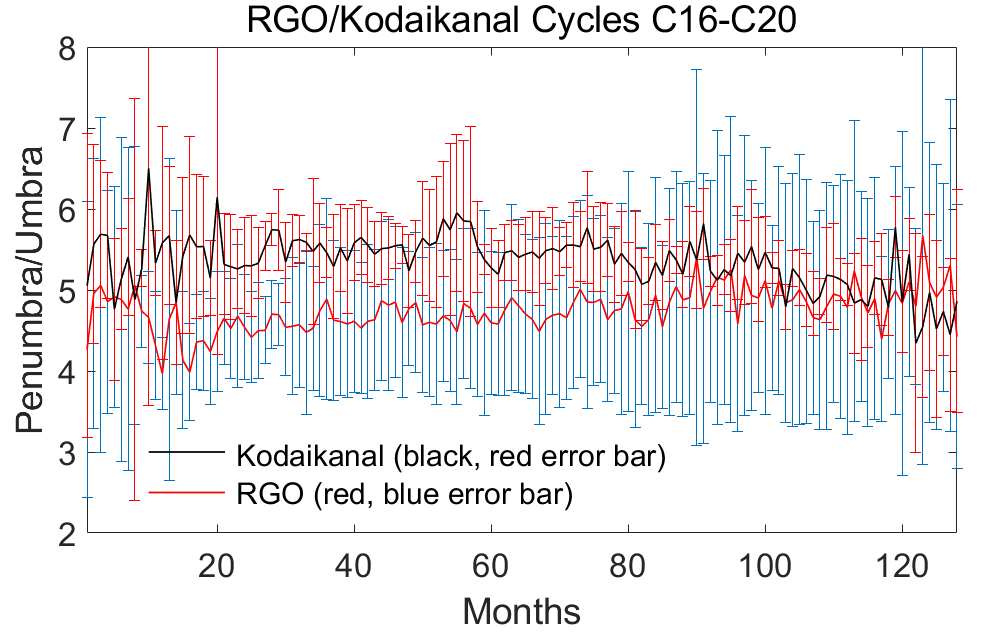
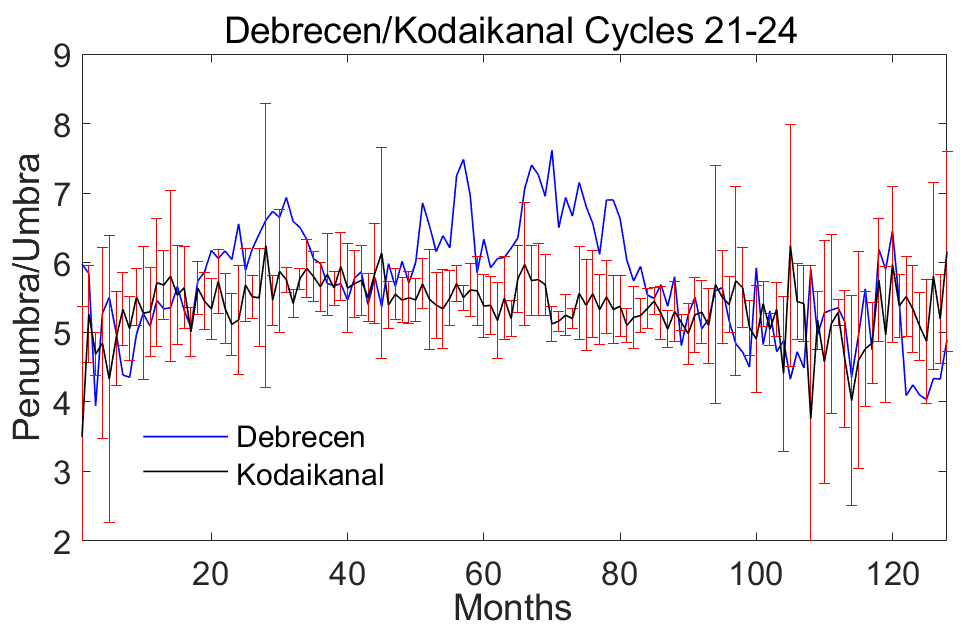
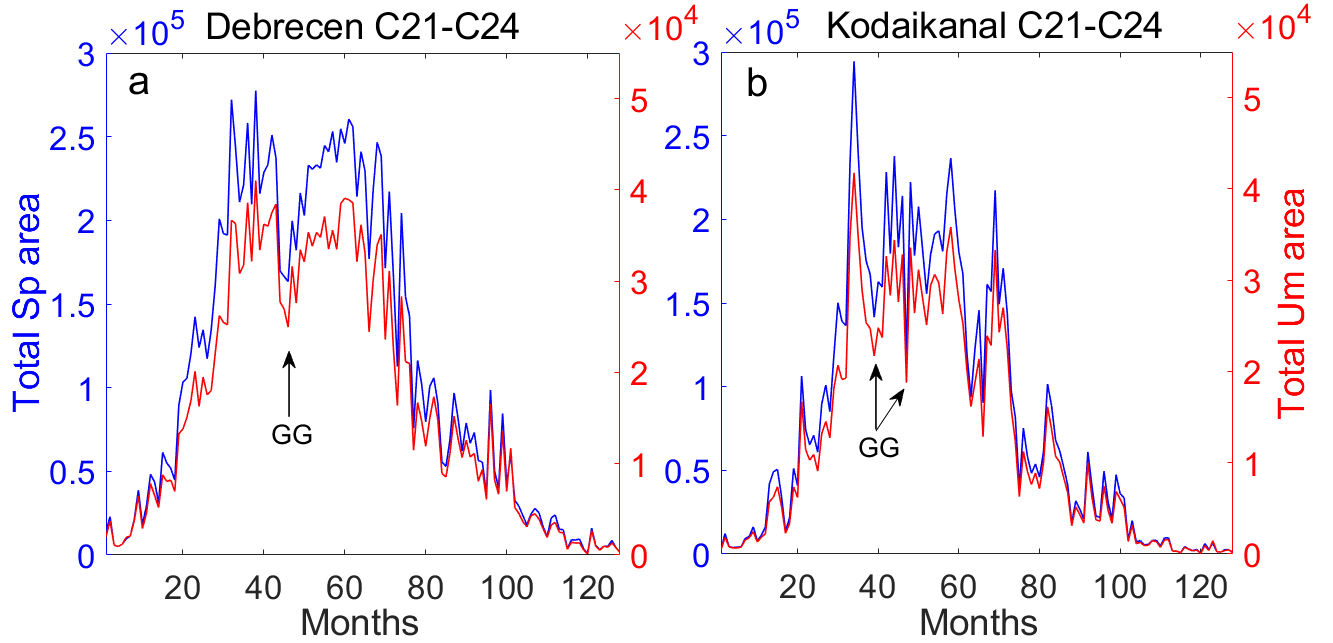
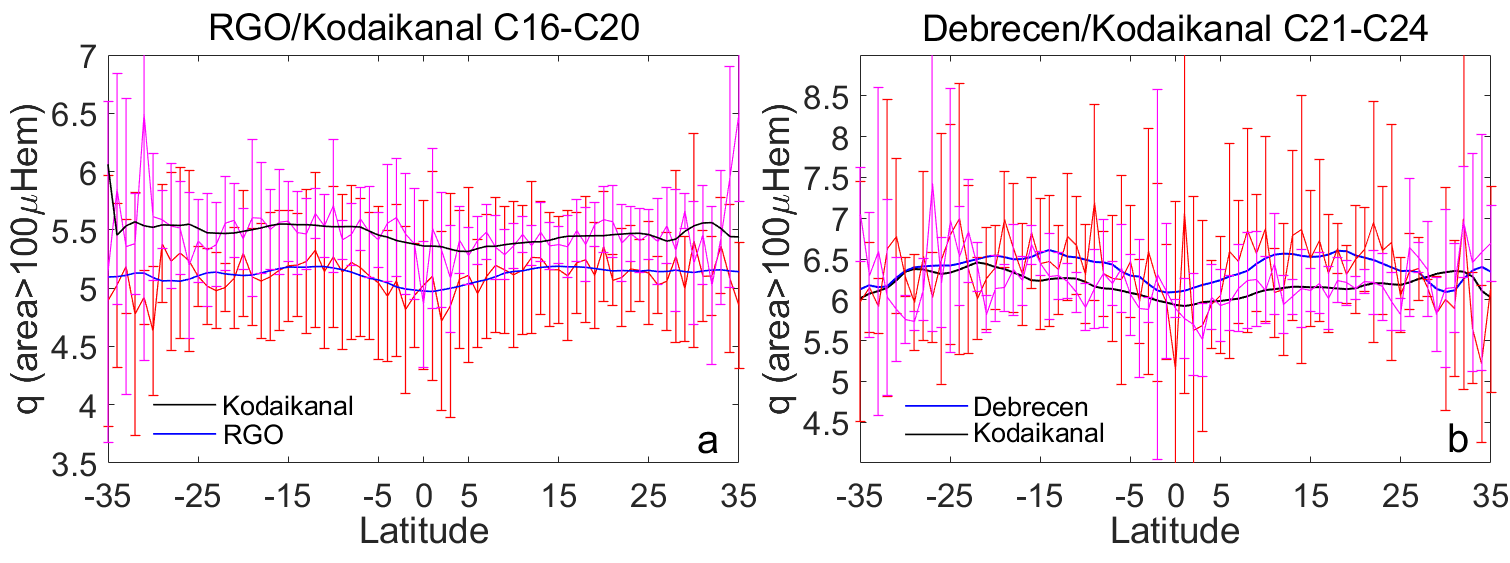
Figure 13a shows the comparison of RGO and Kodaikanal latutudinal -values for Cycles 16 – 20 with areas larger than 100 Hem. Here we also show a 13-point trapezoidal smoothing of the -values. Trapezoidal smoothing is a common moving average smoothing with end points of the window having half of the weight of the inner points. The smoothed shapes of the -graphs seem to be very similar with a shallow valley at the Equator. The average of the RGO is again smaller than the average of the Kodaikanal , i.e. mean values (standard deviations) are 5.11 (0.15) and 5.35 (0.15) for RGO and Kodaikanal, respectively. Figure 13b shows the comparison of Kodaikanal and Debrecen latutudinal -values for Cycles 21 – 24 with areas larger than 100 Hem. It is evident that the shape of the Kodaikanal -graph is very similar to that of the Kodaikanal -graph in Figure 13a with slightly deeper valley at the Equator in the smoothed curve. Note that the errorbars are behaving very wildly, especially for Debrecen, because the -values of the odd cycles are much higher than the -values of the even cycles. The Debrecen -graph is, however, still deeper at the Equator having clear maxima between 10 – 20 degres at both hemispheres. The mean -values (standard deviations) are 6.22 (0.34) and 6.36 (0.41) for Kodaikanal and Debrecen, respectively. It should, however, be noted that while it is understandable that the -values are smaller near the Equator, because sunspots and sunspot groups are smaller there than around 10 to 25 degrees of latitude, the error limits also so wide, that the confidence of this result is vague.
7 Conclusions
We have analyzed the penumbra-umbra ratio () of sunspot latitudinal and temporal distributions for RGO SC12 – SC20, Kodaikanal SC16 – SC23 (also incomplete cycle 24 until june 2018) and Debrecen dataset SC21 – SC24 (SC24 until the end of 2017), in order to get enough data for a solid statistics.
The analysis of -values for the Kodaikanal Cycles 16 – 24 shows that the odd cycles have considerable more large sunspots in the ascending phase than after the maximum. On the other hand, for the even cycles the shape of the -graph reminds more the shape of the sunspot cycle itself, i.e, largest sunspots are in the middle of the cycle. The mean -value for even and odd cycles are 5.27 and 5.43, respectively. On the contrary, our analysis shows that the sunspots under 100 Hem are quite evenly distributed throughout the cycle for both the odd and even sunspot cycles. The latitudinal for large category sunspots and all sunspots seems to change such that it is lowest around the Equator and increases slightly towards higher latitudes. The latitudinal change is, however, inside the errobars and we can say that it is insignificant. Our analysis shows again that for the small sunspots (100 Hem) the latitudinal distribution of is flat. The latitudinal average for all sunspots is same size as the temporal average q, i.e. 5.41 and 5.65 for the even and odd cycles, respectively.
The analysis of for the RGO Cycles 12 – 20 shows quite similar results, but now the -values for the even cycles are higher than for the odd cycles. The mean values for are now 5.20 and 4.75 for the even and odd cycles, respectively. Note, that the -values are moderately smaller for the RGO dataset than Kodaikanal dataset. The latitudinal analysis for RGO sunspot groups data confirms the aforementioned result, that is at lowest around Equator and increases towards higher latitudes for the large (100 Hem) groups. Note that the errorbars for RGO data are largest, because the level of the -values changes so much between cycles, especially for small category sunspot groups.
For Debrecen sunspot data we superimposed the Cycles 21 – 24 in the case of temporal evolution of the -values. This is because of the shorter interval, i.e less cycles in the Debrecen database than for the other datasets. In this case we find an interesting phenomenon. The shape of the -graph has two clear maxima and a deep valley between them for both small and large category sunspot groups. It turns out that the decrease in the -values is simultaneous to the drop of the total and umbral area of the Debrecen sunspot groups. We believe that this is related to Gnevyshev gap as the deepest point of the total and umbral area locates 36 % from the start of the cycle (Takalo and Mursula, 2018). The average -value for the Debrecen cycles is 5.74. The latitudinal -values for Debrecen sunspot groups have largest variation such that they are clearly lowest (except some bad values) at the Equator of the Sun. The decrease as calculated separately for the even and odd cycles seems to be deeper than the errorbars of one standard deviation. The mean values for the even and odd Cycles 21 – 24 between latitudes -35 – 35 are 5.53 and 6.33.

We have also compared the overlapping intervals of the RGO and Kodaikanal datasets for Cycles 16 – 20 and Kodaikanal and Debrecen datasets for Cycles 21 – 23. The results are consistent with the separately made analyses such that RGO has smallest -values and Debrecen highest -values. The reason for the differences in is probably difficulty in separating the border between umbra and penumbra, especially for sunspot groups (Steinegger, Bonet, and Vázquez, 1997). This issue is quite complicated and is not the scope of this study. Furthermore, Foukal (2014) states that the main reason why spot areas recorded using photographic or CCD observations are larger than those based on drawings seems to be that the areas of spots too small to draw are still individually measurable on good plates and CCD images.
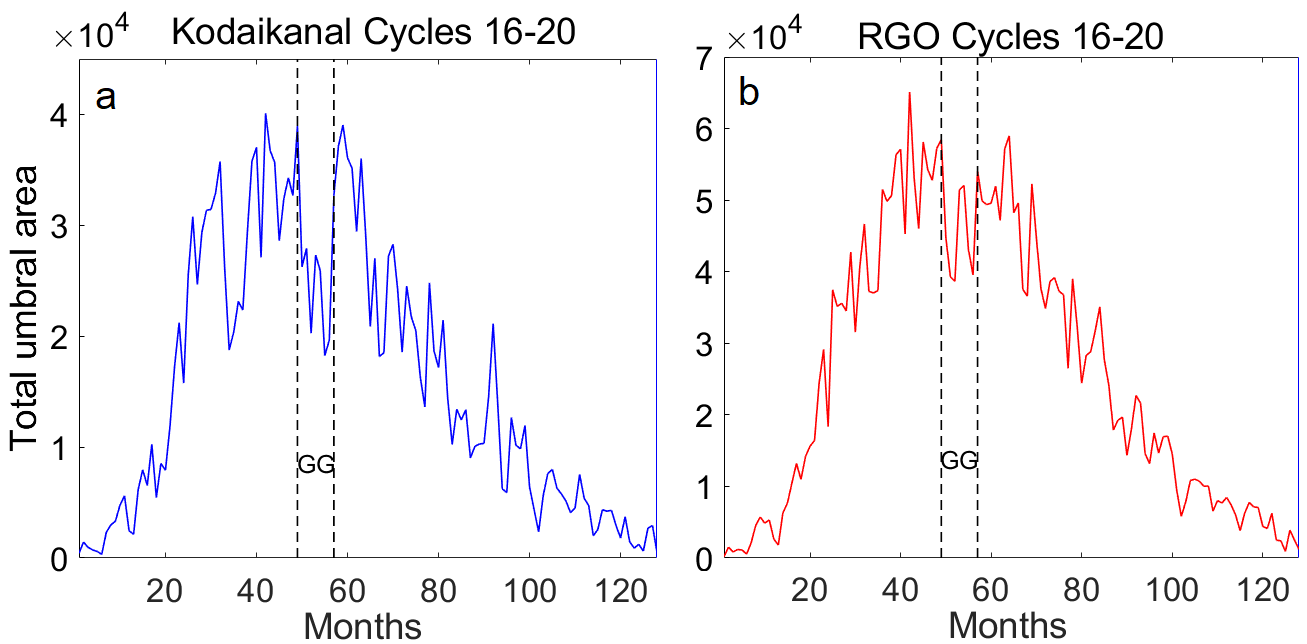
Debrecen dataset, however, seems to have smallest umbral areas, at least for large sunspots. The gradient method used in the analyses of Debrecen sunspot data is described in the article by Györi (1998). Debrecen dataset seems also to give most precise results in the sense that it shows also the effect of Gnevyshev gap in its temporal evolution of the -values. Gnevyshev gap is somehow related to the reversal of the magnetic field of the Sun. The basic reason for the GG is not the scope of this study, and it is an open question now, but some good attempts have been presented (Georgieva, 2011; Karak, Mandal, and Banerjee, 2018). There have also been suggestions about a relic field in the Sun (Bravo and Stewart, 1996; Mursula, Usoskin, and Kovaltsov, 2001; Song and Wang, 2005). If the relic field exists, it could maybe explain why GG is more intense in the even cycles than in the odd cycles (Takalo and Mursula, 2020; Takalo, 2020b, 2021). It should be noted that RGO and Kodaikanal datasets do not show the temporal decrease of the -values , although they both have a clear twofold GG in their total area as a function of time for Solar Cycles 16 – 20 (see Figure 15). Note that the GG region in this case is few months later than GG of Debrecen for Solar Cycles 21 – 24.
Kodaikanal research group uses their own procedure in defining the border, which is based on the threshold method introduced by Otsu (1979). Kodaikanal data seem to be most compactly located around the mean -value. This is seen in Figure 14, where we show the relative densities of RGO, Kodaikanal and Debrecen databases. Kodaikanal has by far the smallest standard deviation of the -distributions. Note that this standard deviation is related to the errorbars in the -graphs shown earlier for each databases. From these three datasets RGO seems to be most heterogeneous, which is seen also as a curious drop of -values in the first third of the 20th century (Hathaway, 2013, see also solarscience.msfc.nasa.gov/greenwch.shtml). Although the RGO data is one of the best sunspot area datasets, the drop in -values for spots smaller than 100 Hem has not been seen in any other datasets so far. Thus, one must proceed with caution when comparing -values between different observatories. It should also be noted, that corrections to the RGO database have been going on recently (Erwin et al., 2013).
Acknowledgements
The RGO sunspot area data are from RGO-USAF/
NOAA (solarscience.msfc.nasa.gov/greenwch.shtml), Kodaikanal database
from github.com/bibhuraushan/KoSoDigitalArchive and Debrecen sunspot
datasets from fenyi.solarobs.csfk.mta.hu/DPD/. The dates of the cycle maxima
were obtained from the National Geophysical Data Center (NGDC), Boulder, Colorado, USA (ftp.ngdc.noaa.gov), and the corona indices are retrieved from
www.ngdc.noaa.gov/stp/solar/corona.html
References
- Antalová (1971) Antalová, A.: 1971, The ratio of penumbral and umbral areas of sun-spots in the 11-year solar activity cycle. Bulletin of the Astronomical Institutes of Czechoslovakia 22, 352. ADS.
- Baranyi et al. (2001) Baranyi, T., Györi, L., Ludmány, A., Coffey, H.E.: 2001, Comparison of sunspot area data bases. Mon. Not. R. Astron. Soc. 323, 223. DOI. ADS.
- Bogdan et al. (1988) Bogdan, T.J., Gilman, P.A., Lerche, I., Howard, R.: 1988, Distribution of Sunspot Umbral Areas: 1917–1982. Astrophys. J. 327, 451. DOI. ADS.
- Bravo and Stewart (1996) Bravo, S., Stewart, G.A.: 1996, The solar magnetic cycle and the presence of an inclined relic field in the sun. Adv. Space Res. 17, 221. DOI. ADS.
- Carrasco et al. (2018) Carrasco, V.M.S., Vaquero, J.M., Trigo, R.M., Gallego, M.C.: 2018, A Curious History of Sunspot Penumbrae: An Update. Solar Phys. 293, 104. DOI. ADS.
- Carrasco et al. (2021) Carrasco, V.M.S., Gallego, M.C., Villalba Álvarez, J., Vaquero, J.M., Hayakawa, H.: 2021, Analyses of Early Sunspot Records by Jean Tarde (1615 - 1617) and Jan Smogulecki (1621 - 1625). Solar Phys. 296, 170. DOI. ADS.
- Carrasco et al. (2022) Carrasco, V.M.S., Munoz-Jaramillo, A., Gallego, M.C., Vaquero, J.M.: 2022, Revisiting Christoph Scheiner’s Sunspot Records: A New Perspective on Solar Activity of the Early Telescopic Era. Astrophys. J. 927, 11pp. DOI.
- Erwin et al. (2013) Erwin, E.H., Coffey, H.E., Denig, W.F., Willis, D.M., Henwood, R., Wild, M.N.: 2013, The Greenwich Photo-heliographic Results (1874 - 1976): Initial Corrections to the Printed Publications. Solar Phys. 288, 157. DOI. ADS.
- Foukal (2014) Foukal, P.: 2014, An Explanation of the Differences Between the Sunspot Area Scales of the Royal Greenwich and Mt. Wilson Observatories, and the SOON Program. Solar Phys. 289, 1517. DOI. ADS.
- Georgieva (2011) Georgieva, K.: 2011, Why the Sunspot Cycle Is Double Peaked. ISRN Astron.and Astrophys. 2011, 437838. DOI. ADS.
- Gnevyshev (1967) Gnevyshev, M.N.: 1967, On the 11-Years Cycle of Solar Activity. Solar Phys. 1, 107. DOI. ADS.
- Győri, Ludmány, and Baranyi (2017) Győri, L., Ludmány, A., Baranyi, T.: 2017, Comparative analysis of Debrecen sunspot catalogues. Mon. Not. R. Astron. Soc. 465, 1259. DOI. ADS.
- Györi (1998) Györi, L.: 1998, Automation of Area Measurement of Sunspots. Solar Phys. 180, 109. DOI. ADS.
- Hathaway (2013) Hathaway, D.H.: 2013, A Curious History of Sunspot Penumbrae. Solar Phys. 286, 347. DOI. ADS.
- Hou et al. (2022) Hou, J.-W., Zeng, S.-G., Zheng, S., Luo, X.-Y., Deng, L.-H., Li, Y.-Y., Chen, Y.-Q., Lin, G.-H., Feng, Y.-L., Tao, J.-P.: 2022, Chinese Sunspot Drawings and Their Digitization-(VII) Sunspot Penumbra to Umbra Area Ratio Using the Hand-Drawing Records from Yunnan Observatories. Res. Astron. Astrophys. 22, 095012. DOI. ADS.
- Howard, Gilman, and Gilman (1984) Howard, R., Gilman, P.I., Gilman, P.A.: 1984, Rotation of the sun measured from Mount Wilson white-light images. Astrophys. J. 283, 373. DOI. ADS.
- Jensen, Nordø, and Ringnes (1955) Jensen, E., Nordø, J., Ringnes, T.S.: 1955, Variations in the Structure of Sunspots in Relation to the Sunspot Cycle. Astrophysica Norvegica 5, 167. ADS.
- Jha, Mandal, and Banerjee (2019) Jha, B.K., Mandal, S., Banerjee, D.: 2019, Study of Sunspot Penumbra to Umbra Area Ratio Using Kodaikanal White-light Digitised Data. Solar Phys. 294. DOI.
- Jha et al. (2022) Jha, B.K., Hegde, M., Priyadarshi, A., Mandal, S., Ravindra, B., Banerjee, D.: 2022, Extending the sunspot area series from Kodaikanal Solar Observatory. Front. Astron. Space Sci. 9, 1019751. DOI. ADS.
- Karak, Mandal, and Banerjee (2018) Karak, B.B., Mandal, S., Banerjee, D.: 2018, Double Peaks of the Solar Cycle: An Explanation from a Dynamo Model. Astrophys. J. 866, 17. DOI. ADS.
- Mandal et al. (2017) Mandal, S., Hegde, M., Samanta, T., Hazra, G., Banerjee, D., Ravindra, B.: 2017, Kodaikanal digitized white-light data archive (1921–2011): Analysis of various solar cycle feature. Astron. Astrophys. 601, 18. DOI.
- Mandal et al. (2020) Mandal, S., Krivova, N.A., Solanki, S.K., Sinha, N., Banerjee, D.: 2020, Sunspot area catalogue revisited: Daily cross-calibrated areas since 1874. Astron. Astrophys. ADS.
- Minarovjech, Rušin, and Saniga (2011) Minarovjech, M., Rušin, V., Saniga, M.: 2011, The green corona database and the coronal index of solar activity. Contributions of the Astronomical Observatory Skalnaté Pleso 41, 137. ADS.
- Mursula, Usoskin, and Kovaltsov (2001) Mursula, K., Usoskin, I.G., Kovaltsov, G.A.: 2001, Persistent 22-year cycle in sunspot activity: Evidence for a relic solar magnetic field. Solar Phys. 198, 51. DOI. ADS.
- Neuhäuser, Arlt, and Richter (2018) Neuhäuser, R., Arlt, R., Richter, S.: 2018, Reconstructed sunspot positions in the Maunder minimum based on the correspondence of Gottfried Kirch. Astron. Nachrichten 339, 219. DOI. ADS.
- NGDC (2013) NGDC: 2013, Solar-indices, the data via anonymous FTP (ftp.ngdc.noaa.gov) from the National Geophysical Data Center (NGDC), Boulder, Colorado, USA.
- Nicholson (1933) Nicholson, S.B.: 1933, The Area of a Sun-Spot and the Intensity of Its Magnetic Field. Publ. Astron. Soc. Pac. 45, 51. DOI. ADS.
- Otsu (1979) Otsu, N.: 1979, A threshold selection method from gray-level histograms. IEEE Trans. Syst. Man Cybern. 9, 62.
- Ravindra et al. (2013) Ravindra, B., Priya, T.G., Amareswari, K., Priyal, M., Nazia, A.A., Banerjee, D.: 2013, Digitized archive of the Kodaikanal images: Representative results of solar cycle variation from sunspot area determination. Astron. Astrophys. 550, A19. DOI. ADS.
- Song and Wang (2005) Song, W.-B., Wang, J.-X.: 2005, Progress in the studies on a relic solar magnetic field. Progr. in Astron. 23, 205. ADS.
- Steinegger, Bonet, and Vázquez (1997) Steinegger, M., Bonet, J.A., Vázquez, M.: 1997, Simulation of Seeing Influences on the Photometric Determination of Sunspot Areas. Solar Phys. 171, 303. DOI. ADS.
- Takalo (2020a) Takalo, J.: 2020a, Comparison of latitude distribution and evolution of even and odd sunspot cycles. Solar Phys. 295. DOI.
- Takalo (2020b) Takalo, J.: 2020b, Temporal Distribution of Solar Cycle 24 Sunspot Groups: Comparison to Cycles 12-23. Ann. Geophys. 63. DOI.
- Takalo (2021) Takalo, J.: 2021, Comparison of Geomagnetic Indices During Even and Odd Solar Cycles SC17 – SC24: Signatures of Gnevyshev Gap in Geomagnetic Activity. Solar Phys. 296. DOI.
- Takalo (2022) Takalo, J.: 2022, Spatial and Temporal Distribution of Solar Green-Line Corona for Solar Cycles 18-24. Solar Phys. 297. DOI.
- Takalo and Mursula (2018) Takalo, J., Mursula, K.: 2018, Principal component analysis of sunspot cycle shape. Astron. Astrophys. 620. DOI.
- Takalo and Mursula (2020) Takalo, J., Mursula, K.: 2020, Comparison of the shape and temporal evolution of even and odd solar cycles. Astron. Astrophys. 636. DOI.
- Waldmeier (1935) Waldmeier, M.: 1935, Neue Eigenschaften der Sonnenfleckenkurve. Astron. Mitt. Zurich 14, 105.
- Waldmeier (1939) Waldmeier, M.: 1939, Die Zonenwanderung der Sonnenflecken. Astron. Mitt. Zurich 14, 470. ADS.