Relay Mining: Verifiable Multi-Tenant Distributed Rate Limiting
Abstract
Relay Mining presents a scalable solution employing probabilistic mechanisms and crypto-economic incentives to estimate RPC volume usage, facilitating decentralized multi-tenant rate limiting. Network traffic from individual applications can be concurrently serviced by multiple RPC service providers, with costs, rewards, and rate limiting governed by a native cryptocurrency on a distributed ledger. Building upon established research in token bucket algorithms and distributed rate-limiting penalty models, our approach harnesses a feedback loop control mechanism to adjust the difficulty of mining relay rewards, dynamically scaling with network usage growth. By leveraging crypto-economic incentives, we reduce coordination overhead costs and introduce a mechanism for providing RPC services that are both geopolitically and geographically distributed.
Keywords:
remote procedure call crypto-economic commit-reveal decentralization scalability blockchain rate limiting token bucket1 Introduction
The emergence of Software as a Service (SaaS) businesses has led to the widespread adoption of subscription-based services that developers interact with using Remote Procedure Calls (RPCs). Various frameworks and architectural patterns of RPCs, such as JSON-RPC, gRPC, REST APIs, and GraphQL, have been designed and developed to accommodate application needs. Typically, the development team, responsible for maintaining and financing the application’s usage, is charged based on their usage or the capacity of the tier to which they have subscribed [16].
Decentralized Applications (dApps) often require access to blockchain data, which can be obtained and verified by running a full node [3]. The complexity of maintaining and synchronizing a full node has rendered it impractical for most developers to manage themselves, and the resource requirements make it unsuitable for client devices such as smartphones or browsers. For instance, it is recommended to have at least 16GB of RAM, a 2TB SSD, and a 25Mbps download speed to run a go-ethereum client [10]. While light clients, initially introduced as Simple Payment Verification in the Bitcoin whitepaper, are under active development, numerous companies now specialize in providing and maintaining infrastructure to run full nodes, known as Node RPC providers [22].
Although this has enabled dApp development, it has also led to further centralization and trust delegation of data verification to a small number of large infrastructure providers, as discussed in various forums [21]. While efforts continue to make light clients efficient and readily available, there will still be a future need for block headers and proofs to be easily accessible via RPC services. It is important to note that while this paper focuses primarily on access to data nodes in the Web3 landscape, the ideas presented around Relay Mining can extend to any services exposed through an RPC interface.
1.1 Blockchain Throughput
The Blockchain Scalability Trilemma is a prevalent formulation employed to assess the trade-offs between a blockchain’s scalability, decentralization and security [6]. When evaluating the scalability of a Layer 1 (L1) chain, the most commonly used metrics are Transactions-Per-Second (TPS) and Time-to-Finality (TTF). These metrics offer a direct insight into the maximum number of writes occurring on the underlying distributed ledger, presenting a clear picture of the network’s capacity and usage as shown in Table 1.
1.2 Data Availability & MEV
Two key concepts that directly influence and result from a blockchain’s throughput are Data Availability and Maximal Extractable Value (MEV). The Data Availability Problem addresses the issue of ensuring that data published in a new block is accessible throughout the network [1], which is one of many factors affecting blockchain throughput and scalability. MEV refers to the maximum value that can be extracted from block production through transaction reordering in excess of fees and is closely related to these metrics [11]. Although this paper does not delve into these two concepts, it is essential to note that RPC Node Providers enhance Data Availability guarantees by increasing Data Redundancy of full nodes, while also having the potential to participate in MEV from transactions initiated by dApps.
1.3 RPC Node Providers
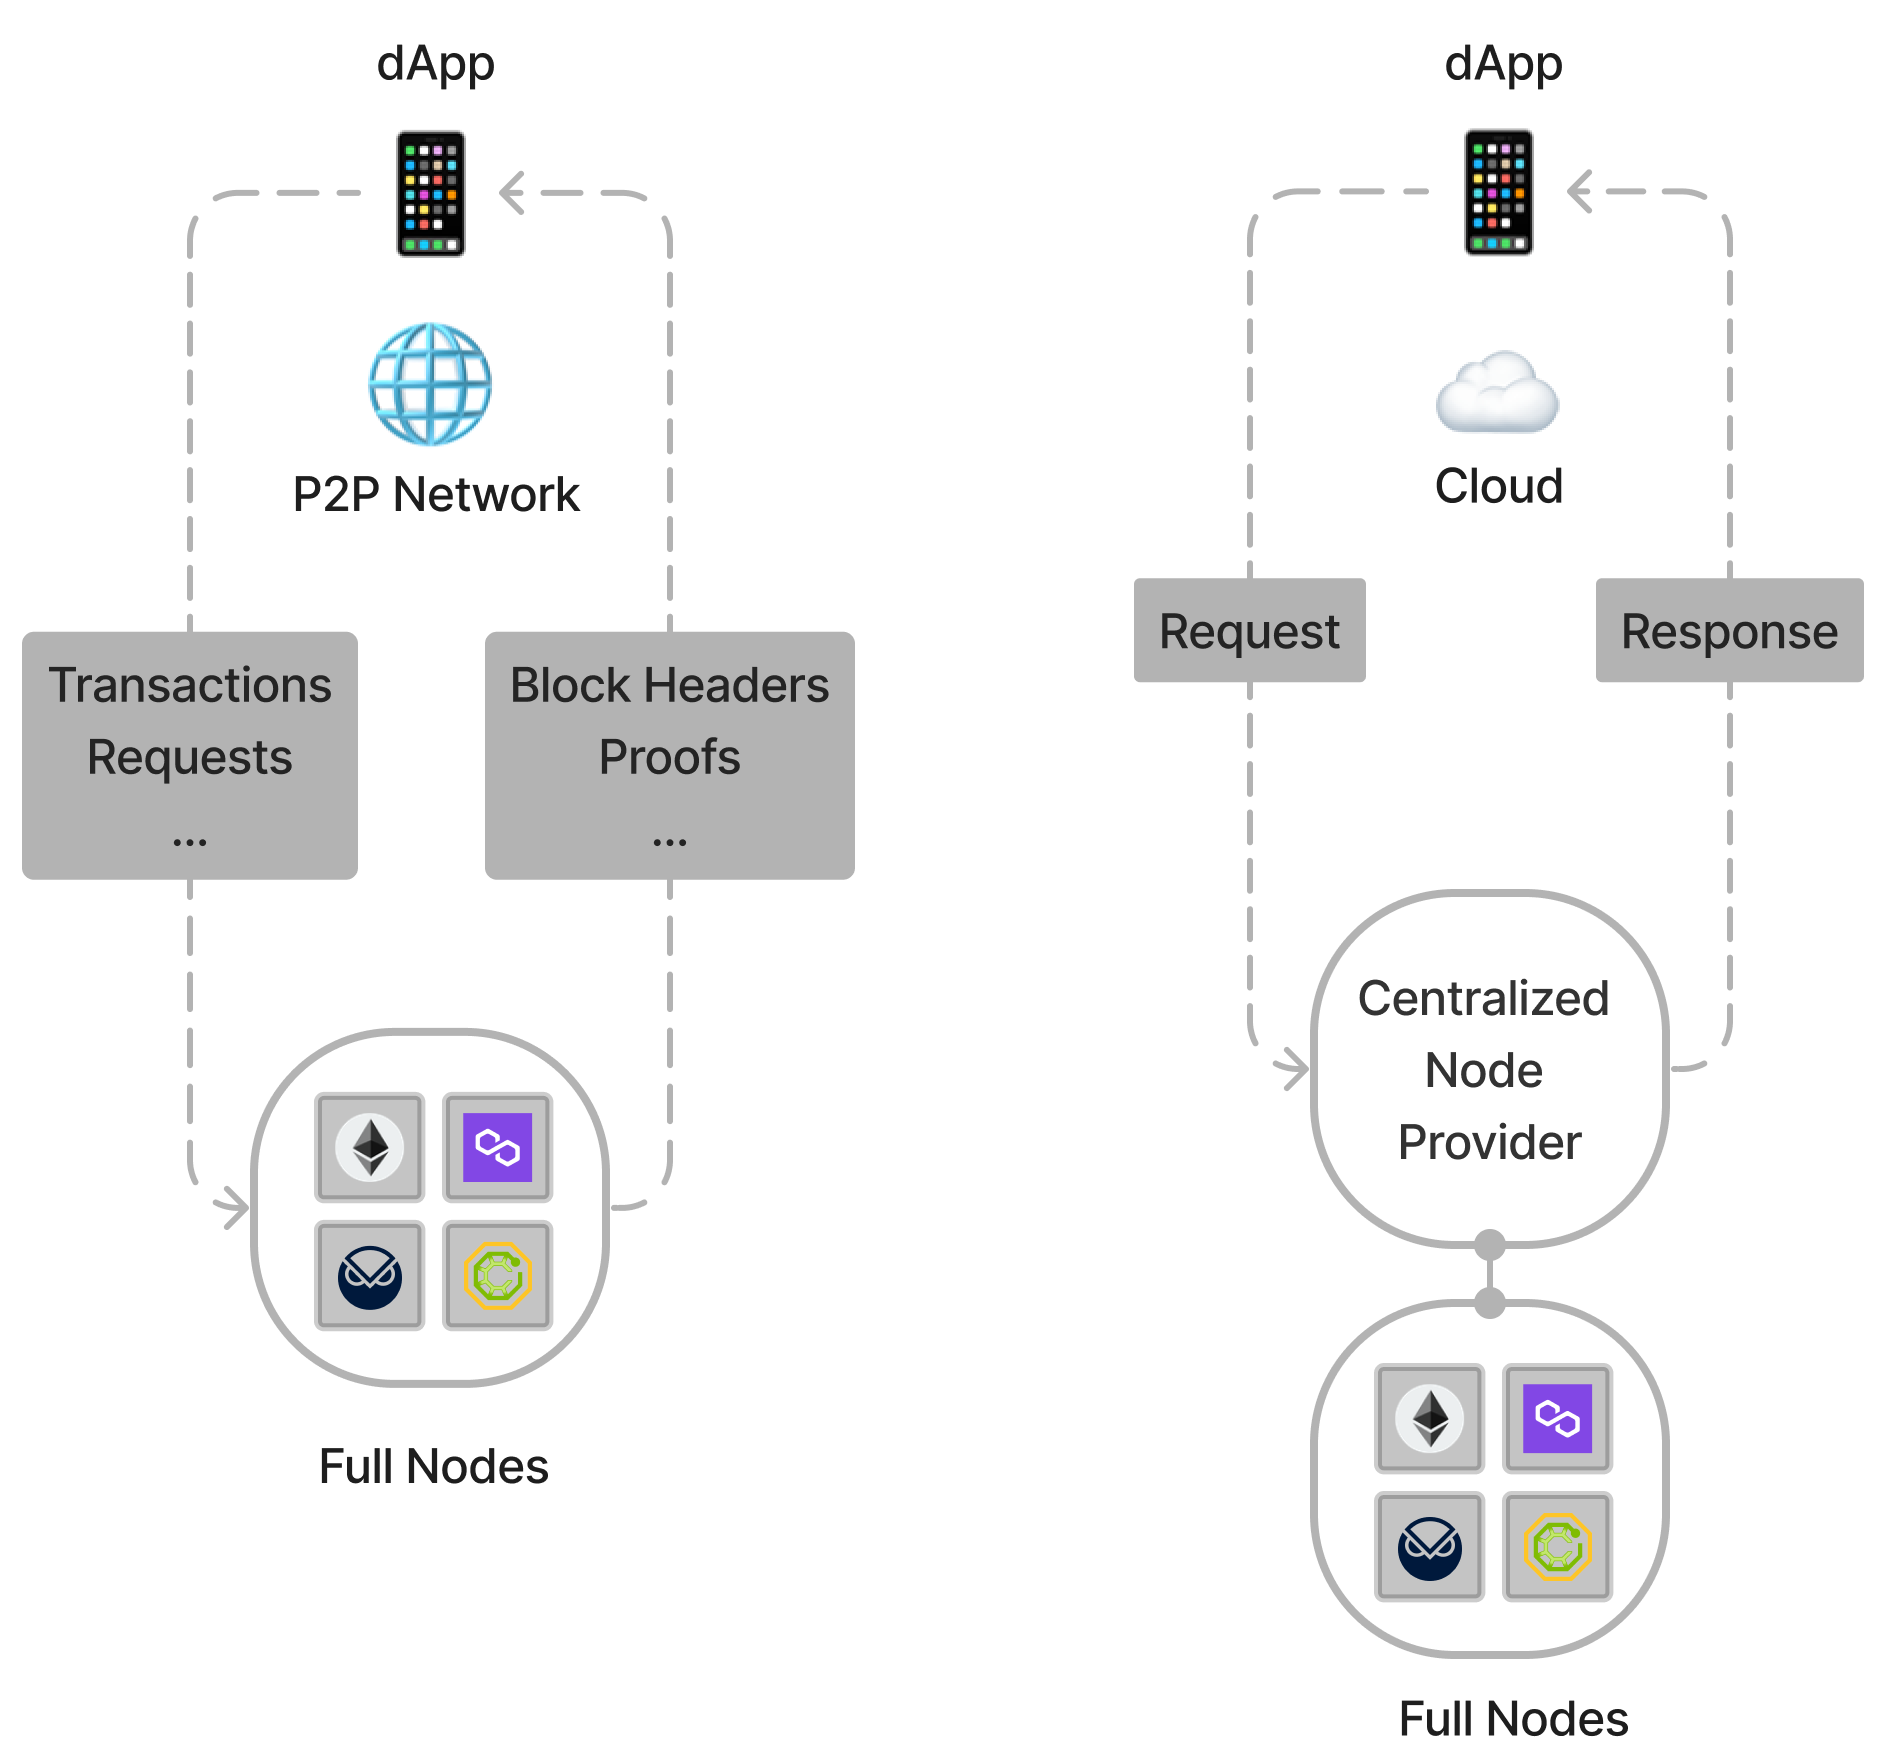
While the Scalability Trilemma addresses the problems of scaling writes to an L1 blockchain in a decentralized and verifiable manner, the majority of requests serviced by node providers involve reads on a much larger scale. This necessitates provisioning and maintaining highly scalable and decentralized infrastructure. Table. 2 displays the traffic handled by some of the largest node providers in 2023. Managing billions of daily requests, most of which are reads, poses distinct challenges which have primarily been addressed via a Web2 SaaS approach as shown in Fig. 1.
| Infura | Alchemy | Ankr | Pocket Network | |
|---|---|---|---|---|
| Requests Per Day | 7B | ?? | 8B | 1.5B |
| Latency / Round-Trip-Time (sec) | 0.77 | 0.61 | 0.67 | 0.76 |
| Availability / Uptime | 99.99% | ?? | 99.99% | 99% |
2 Problem Statement
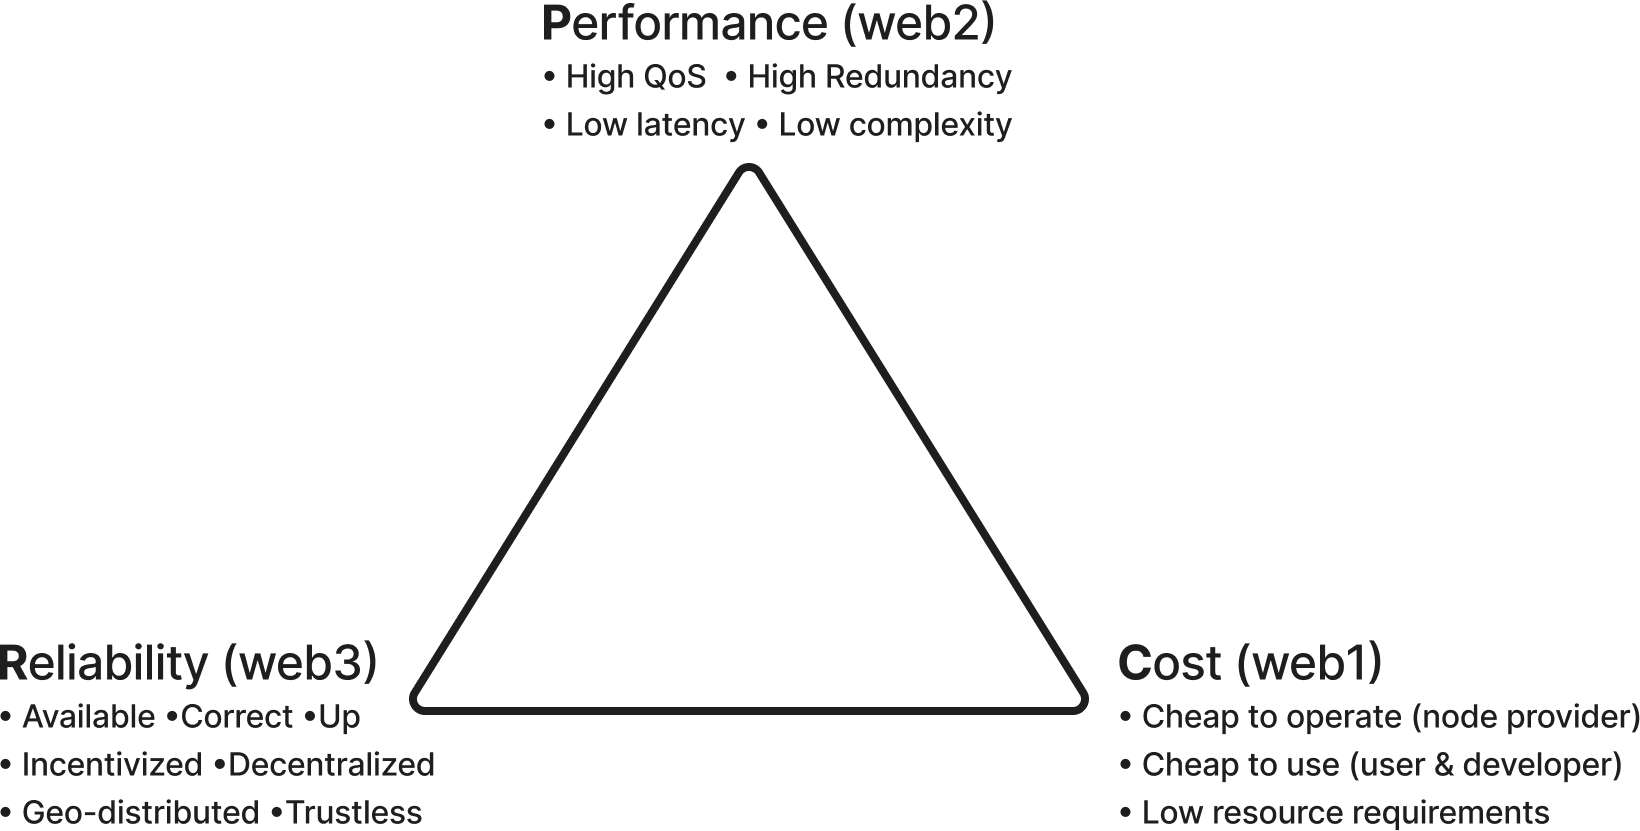
The RPC Trilemma [23] evaluates the trade-offs among Reliability, Performance, and Cost that node providers and dApp developers must consider when providing or choosing a service, as illustrated in Fig. 2.
On-chain crypto-economics, either Block Proposal or MEV, create incentives for full-node operation by offering opportunities to modify writes to a distributed ledger. As most dApps primarily rely on read operations, Data Availability guarantees alone are insufficient for providing reliable and performant access to data based on mathematical or altruistic needs. Consequently, there is a demand for incentivized and verifiable on-chain solutions to address this issue.
This paper aims to present an approach to one of the problems in this domain, Relay Mining, in order to enable decentralized and probabilistically verifiable rate limiting and volume estimation of servicing RPC requests in a multi-tenant economy.
3 Experience & Motivation
Pocket Network, launched on July 28th, 2020, is a decentralized RPC protocol built on top of Tendermint BFT [13]. In this paper, we aim to utilize its current design, several years of production data, and existing plans for future iterations of the protocol as a driving example to address the problem statement outlined in Section 2.
3.1 Network Stats
Since its genesis on October 22, 2021, up to the current date (May 10, 2023), Pocket Network has processed over 465 billion successful relays. During this period, the number of served relays per day increased from approximately 1.5 million to 1.5 billion, with a peak of 2 billion on May 8, 2023. The total relay traffic is composed of an increasing number of blockchains, currently supporting 50, distributed over 14 gateways, and over 12 major, with many minor, infrastructure providers across all continents. The performance from May 3, 2023, to May 10, 2023, on the dominant blockchains is presented in table 3.
| Blockchain | Share of Total Traffic [%] | Volume [relays] | Avg. TPS | Peak TPS | Avg. Latency [ms] | Success Rate [%] |
|---|---|---|---|---|---|---|
| Ethereum | 8300 | 16500 | 138 | 99.7039 | ||
| Polygon Mainnet | 3200 | 4700 | 130 | 99.7200 | ||
| DFKchain Subnet | 1800 | 2400 | 121 | 99.4618 | ||
| Gnosis - xDai | 1500 | 2200 | 152 | 99.8337 |
The network is composed of 20,000 nodes; however, this number does not correlate with the number of deployed blockchain nodes. The current version of the protocol cannot verifiably prove the real number of blockchain nodes, as the Servicers are permissionless, but a rough estimate can be obtained through the nodes’ service domains. The largest Servicer group has approximately 5,000 nodes (about 25% of the network), followed by two others with around 2,500 nodes each (about 12.5% of the network each). Then, the number of nodes by domain decreases. Around 90% of the network is held by 14 independent domains. Assuming no blockchain node is shared among node runners 111This is a fair assumption given the competitive play between node runners. and that each node runner has at least two nodes per staked blockchain 222Accounting for redundancy or geographical distribution of blockchain nodes., the Pocket Network has more than 30 independent blockchain servers on each of the main served blockchains. It is important to note that this is only an estimation; however, the number is significant in terms of decentralization and reliability.
3.2 Network Actors
Current and future iterations of the Pocket Network employ different protocols actors with different responsibilities, as shown in Appendix I. In the context of Relay Mining, however, we are only concerned with Applications, which pay for access to RPC services using the native cryptocurrency, and Servicers, which earn rewards in exchange for handling those requests in the native cryptocurrency.
3.3 Scaling Limitations
The existing protocol implementation of the Pocket Network mainnet resembles the solution presented in Section 6. However, there are a few key distinctions around the data structures selected for the commitment, as well as the introduction of difficulty modulation and volume estimation. In particular, the key issues and difference of the existing implementation relative to the algorithm presented by Relay Mining are [25] [26]:
-
1.
A balanced (complete) Merkle Tree is currently used instead of a Sparse Merkle Tree.
-
2.
The Merkle Tree implementation selected (IAVL) is inefficient in terms of proof sizes, storage, as well as processing [14].
-
3.
Every single relay processed by a Servicer is committed locally instead of using the hash collision mechanism described below.
-
4.
The leaves in the locally built tree are sorted (for replay protection) prior to insertion leading to additional inefficiency and security repercussions [30].
-
5.
Due to the reasons above, the majority of each block ( 70%) is composed of Merkle Proofs.
-
6.
The addition of new Applications and Services (i.e. blockchains) cannot be permissionless, as it would lead to additional state bloat.
4 Related Work
4.1 Rate Limiting Algorithms
Most rate-limiting algorithms can be categorized as either Token Bucket algorithms (e.g., Leaky Bucket) or Window-based algorithms (e.g., Fixed Window, Sliding Window) [24]. Much of the existing work and literature that extends these to Distributed Rate Limiting (DRL) was captured in [20] [27], with two primary goals: 1. Finding a tradeoff between rate-limiting accuracy and communication overhead between brokers, 2. Reducing the DRL penalty on the end-user in exchange for accuracy. Although these approaches are valuable, they assume that the brokers or service providers, despite being geographically distributed, are not decentralized in terms of ownership and assume non-Byzantine guarantees.
4.2 Distributed Rate Limiting
Although the solutions discovered by the team at Washington University in St. Louis [20] do not directly apply to Relay mining, their formulation, as shown in Section 5, is relevant. They distilled common Token Bucket rate-limiting algorithms into two key parameters when managing communication between Clients and Brokers:
-
r: The rate at which tokens are generated. This bounds the long-term rate of message services.
-
b: The maximum number of tokens that can be accumulated. This bounds the maximum burst of messages that can be sent.
Their work on Scalable Real-Time Messaging (SRTM) encapsulated the following principles in reducing the Distributed Rate Limit (DRL) penalty:
-
Concentration: Identification of the smallest number of brokers for message servicing to meet the network’s Service Level Objectives (SLOs).
-
Max-min: Maximization of the minimum workload assigned to each broker.
-
Correlation-awareness: Assignment of publishers to brokers to minimize inter-publisher correlation and reduce message burstiness.
4.3 Rate Limiting in Web3
To the authors’ knowledge, no other multi-tenant decentralized RPC node provider network currently operates in production. Centralized node operators such as Alchemy employ subscription tiers and compute units to manage rate limiting. This strategy, however, relies on centralization and does not necessitate on-chain proof and verification [2]. Compute units measure the total computational resources that applications utilize on platforms, rather than tallying individual requests. Another protocol in development, Lava, also intends to implement compute units for rate limiting [7], but details of this implementation remain undisclosed. The lack of an existing decentralized RPC provider in production underscores the unique and complex challenges involved in maintaining decentralization while achieving on-chain proof and verification.
5 Rate Limiting Formulation
In order to present our approach to rate limiting in the context of Relay Mining, we will draw analogs from the concepts above to primitives in Pocket Network.
The primary actors of concern are:
-
Application: The client sending RPC requests (real-time messages) to one or more Servicers (brokers).
-
Servicers: Distributed multi-tenant brokers responsible for handling and responding to RPC requests from the Application.
Parameters r and b map directly to on-chain values:
-
AppStake(r): A proxy into the maximum number of requests an Application can make across all current and future sessions across all valid Servicers. This directly relates to the Application’s on-chain stake using the network’s native token and can be increased through up-staking.
-
RelaysPerSession(b): The maximum number of requests an Application can make across all Servicers in a single session.
The core SRTM principles map directly to on-chain parameters:
-
ServicersPerSession(Concentration): The smallest number of Servicers that can handle an Application’s requests in a specific session to meet the network’s Service Level Objectives (SLO). These can include Quality of Service (QoS), decentralization, fairness, etc…
-
RelaysPerServicerPerSession(Max-min): The maximum number relays a single Servicer can handle in a single session.
-
SessionData(Correlation-awareness): Random assignment of an Application to a subset of valid Servicers for the duration of the session.
6 Relay Mining
Relay Mining is a multi-step mechanism designed to ensure fair and permissionless distribution of work between a single Application and multiple Servicers. Utilizing data and parameters stored on the distributed ledger (i.e., on-chain data), this process provides incentive-driven rate limiting for the Application without necessitating additional communication between Servicers. A combination of commit-and-reveal mechanisms and probabilistically requested membership proofs is employed to verify the amount of work completed. Furthermore, a dynamic difficulty modulation is used to scale the network’s capacity as it organically expands. Fig. 3 illustrates the four stages of a Session Lifecycle.
6.1 Session Lifecycle
Applications and Servicers must stake a certain balance and the service(s) that they plan to access and provide, respectively. Note that the maximum long-term rate that the Application can receive is proportional to . This is shown in Step 1 of Fig. 3.
Any Session (a periodic of time determined by a specific number of blocks) determines which Servicers can receive a reward for servicing an Application’s request. This is done with the assumption of the Random Oracle Model and uses on-chain data as entropy [4] as shown in Step 2 of Fig. 3. Note that the maximum number of messages that can be serviced by each individual Servicer per session is . Per the work described in [20], enforceable sub-buckets are not implemented and . Due to the lack of guarantee that the sub-token count of each individual Servicer will be exhausted, a margin is provided, and a negative Application balance becomes theoretically possible. In this unlikely scenario, an Application would need to rotate the keys associated with its dApp in order to continue using the services provided by the network, and additional mitigations are reserved for future work.
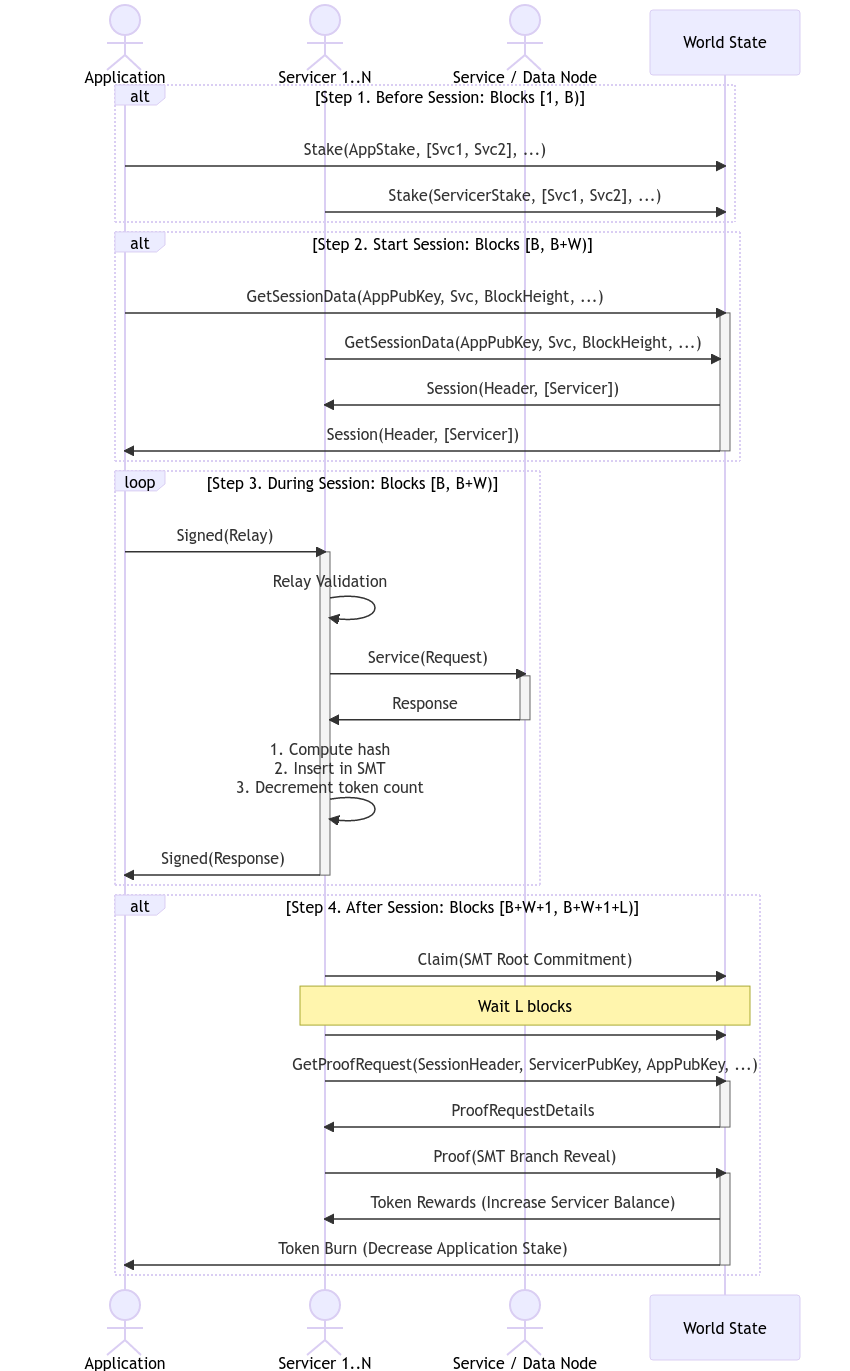
6.2 Payable Relay Accumulation
Proposition 1 in [20] demonstrated that in the context of highly dynamic workloads, splitting tokens into sub-buckets such that and can never improve the running sum of message delays. However, building on the work of [27], who investigated probabilistic DRL, we can deduce that there is always an inherent tradeoff between absolute system accuracy and communication cost. Considering the possibility and added complexity of potential Byzantine actors in a multi-tenant, decentralized, and permissionless system, we opt for the tradeoff of accuracy in exchange for reducing coordination costs. In Algorithm 1, represents the maximum overhead that can cause an Application’s stake to be negative at the end of a Session. This is shown in the first half of Step 3 in Fig. 3.
6.3 Claim & Proof Lifecycle
The second part of Steps 3 & 4 in Fig. 3 provides an overview of the Claim & Proof lifecycle implemented via a commit-and-reveal scheme.
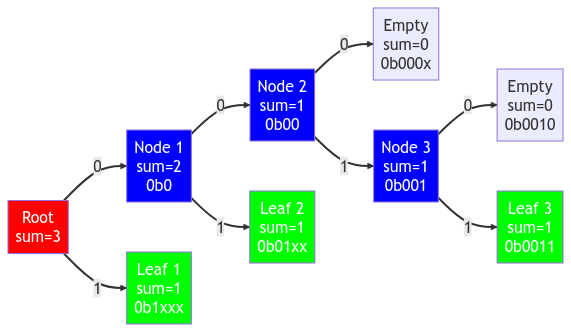
Once a valid payable relay is serviced, assuming the of using a collision-resistant hash function matches the difficulty for that chain/service as described in Section 6.4, it is committed for the purposes of volume estimation into a Merkle Tree Data Structure backed by a Key-Value storage engine. In order to avoid the compute overhead of tree re-balancing on every insertion, while maintaining efficient proof sizes, a Sparse Merkle Trie implementation [15], based on Diem’s Jellyfish Merkle Tree sparse optimizations [28], is used. The value stored on every leaf is the data structure, pointed to by the , whose bits act as the path to the leaf in the Trie. This approach guarantees space and compute efficiency, as well as preventing replay attacks through unique leaf guarantees without the need to maintain sorted leaves [30]. The only other modification that will be made to this Trie is that it will be implemented as a Sparse Merkle Sum Trie, so the sum of all the volume-applicable relays are committed to by the root [29] as shown in Fig. 4.
Several blocks after the Servicer submits a Claim to the tree Commitment via an on-chain transaction, there is a time window during which it must also reveal its proof of a randomly selected branch from the tree. Since the tree is not complete, the leaves are not indexed, and the set of all leaves is unknown to anyone but the Servicer’s local state, a random branch must be requested through other means. Using on-chain data (e.g., Block Hash) determined after the commitment, a random set of bits equal to the key’s length is generated in the Random Oracle Model [4], and the closest membership proof of an existing leaf that can be found must be revealed and submitted. For example, if the random set of bits is , the tree is traversed until it retrieves the membership proof for Leaf 3 in Fig. 4 with the key .
6.4 Probabilistic Volume Estimation
In a decentralized network where the exact count of processed relays is not tracked, we have to estimate the actual number of relays from sampled data. Consider the number of observed claims for a specific blockchain, denoted by bk, as a random variable following the binomial distribution:
| (1) |
Here, represents the total number of processed relays and denotes the hash collision probability given the current blockchain difficulty. We can then derive the value of as follows 333For clarity, the subscript is dropped in the remaining part of this work. Unless otherwise stated, all variables should be interpreted as per-blockchain.:
| (2) |
This estimation is particularly accurate for large numbers of trials and higher probabilities [5], a scenario that is not difficult to achieve in the context of relay mining. The difficulty (and hence ) is controlled by the expected number of claims per block and the number of relays is typically very high 444As per our observations, refer to section 3.1 for details..
6.5 Difficulty Modulation
The proposed method for difficulty modulation follows Bitcoin’s approach [22], which uses a proportional control of an average of the controlled variable to adapt the current hash collision probability [18].
The modulation of difficulty can be described by algorithm 2. The method involves tracking the number of estimated total relays, denoted as , and modulating the hash collision probability to reach a target number of claims . The Exponential Moving Average (EMA) parameter and the number of blocks between updates control the responsiveness of the algorithm, or the speed at which the difficulty adapts to new relay volumes.
The values assigned to these variables are not fixed and are estimated based on empirical observations. They are subject to change to accommodate the dynamic nature of relay volumes.
6.6 dApp Work Estimation
A key component of the protocol method is the correct estimation of work performed by a decentralized Application (dApp). This estimation is crucial for accurately processing the service payments from the dApp, which involves token burning, and for rewarding the Servicers, which involves token minting.555For simplicity, we assume a one-to-one mapping from an on-chain Application actor to a single dApp making RPC requests, though in theory, multiple dApps could leverage the key of a single Application.
As explained in Section 6.5, the difficulty modulation relies on estimating the total relays per block on a given chain, where each chain can have multiple dApps. Given that the total number of relays is distributed among staked dApps, it is important to consider how edge cases could influence the bias and variability of the dApp relay volume estimation.
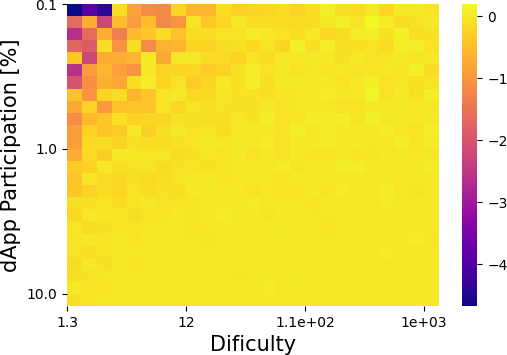
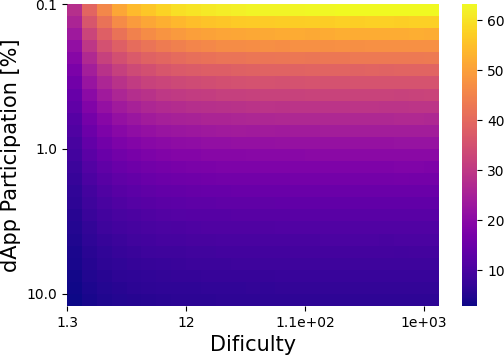
An experiment was conducted to examine this. Using a target of claims per block, the variability and bias of the estimated number of relays were calculated. The difficulty (inverse of hash collision probability ) ranged from relays per claim to relays per claim, and the dApp participation ranged from to of total blockchain traffic. For each test point, a total of draws from the resulting variable were sampled. The bias and variability of the estimated dApp traffic were then calculated as follows:
| (3) |
then:
| (4) |
and
| (5) |
The resulting bias and variability are illustrated in heat maps in Fig.5a and Fig.5b, respectively. We observe that the bias is close to zero across most of the sample space. Only when the number of is extremely low does bias become noticeable, but even then it remains above . Conversely, variability is higher, particularly when the dApp participation drops below , under which conditions is grows rapidly.
7 Experimentation on Pocket Network V0
The proposed schema is expected to work under almost any kind of relay volumes and variations. This kind of relay volume variations can be easily obtained from the Pocket Network v0, as all relay data is tracked on its blockchain. Using it, it is possible to have an insight of how is the behaviour of the relay mining approach on real traffic data and know the expected errors and bias of implementing it.
The analysis include the bias, variation and transitory effects in the estimation of the blochchain traffic for four different served blockchains with different volume sizes and transitions. The used parameters were the same as presented in algorithm 2. The main findings are summarized in table 4, the complete analysis is shown in the Appendix II. It can be seen that the transient effects on the target number of claims are significant but short lived, however the estimation of the total relay volume (responsible of controlling the difficulty) does not spike, ensuring an effective control of the proposed strategy.
| Event Duration [blocks] | Min/Max Claims | Min/Max Target Error [%] | Accumulated Target Error by Block [claims] | Min/Max Volume Estimation Error [%] | |
|---|---|---|---|---|---|
| Steady High Volume | 3000 | 6789 / 20710 | -32.11 / 107.10 | 7 | -3.23 / 4.17 |
| Soft surge | 175 | 7804 / 14496 | -21.96 / 44.96 | 620 | -2.91 / 3.04 |
| Step drop | 44 | 1305 / 88963 | -86.95 / 789.63 | 170 | -1.92 / 3.45 |
| Step surge | 24 | 499 / 13897 | -95.01 / 38.97 | -60 | -5.21 / 2.59 |
8 Future Work & Implementation
Relay Mining sets the foundation for future advancements in the realm of decentralized rate limiting. Two potential avenues for further exploration include:
Compute Units: By assigning different weights to the leaves in the Merkle Sum Tree, rate limiting can be customized on a per-request basis, enabling more granular control over computational resources.
Websockets: Adapt Relay Mining to accommodate long-lived connections, such as websockets, by applying rate limiting to data transferred over the network at periodic snapshots rather than individual requests. This would enhance the versatility of the rate limiting approach to cater to a wider range of application requirements.
9 Discussion & Conclusions
This paper introduces Relay Mining, a novel algorithm designed to scale efficiently to handle tens of billions of individual RPC requests daily. These requests are proven on a decentralized ledger via a commit-and-reveal scheme. The solution can account for the aggregate volume across all current Web3 Node RPC providers and comes equipped with an inbuilt difficulty modulation to dynamically adapt to the growing traffic in the Web3 industry.
Relay Mining builds upon the insights, performance, and data from the Pocket Network—a decentralized RPC network that has been operating a live mainnet for nearly two years at the time of writing. The network adeptly manages approximately 1.5 billion requests daily from over a dozen independent service providers servicing more than 50 blockchains. For secure and efficient insertions, and to meet random membership proof requirements, a Sparse Merkle Trees (SMTs) with probabilistic leaf insertions was adopted.
Relay Mining’s design and mechanism incorporate principles from Scalable Real-Time Messages (SRTM) [20], aiming to alleviate Distribute Rate Limiting (DRL) penalties through concentration, max-min, and correlation awareness between Applications and Servicers. To our knowledge, this is the first DRL mechanism that leverages crypto-economic incentives to enable multi-tenant rate limiting capable of accounting for Byzantine actors.
This work demonstrates that the algorithm performs best under high relay volumes, a typical scenario in decentralized RPC networks. Although a slight bias exists for applications with exceptionally low comparative volume (less than of total blockchain traffic), this bias is minimal (under ). Furthermore, the estimation variance in these circumstances does not present a significant issue for the protocol itself, as it self-regulates with other low-traffic applications. Should the issue of extremely low-traffic applications become a concern, specific implementation mechanisms can be introduced to address it.
Finally, it is important to note that several relevant concepts in decentralized RPC networks—such as response integrity, Quality of Service enforcement, and extensions to general-purpose compute units—though outside the scope of this paper, are complementary to the problems that Relay Mining addresses.
References
- [1] Mustafa Al-Bassam. What is data availability. https://coinmarketcap.com/alexandria/article/what-is-data-availability, 2022.
- [2] Inc Alchemy Insights. Alchemy docs - compute units. https://docs.alchemy.com/reference/compute-units, 2022.
- [3] Inc Alchemy Insights. Pros and cons of running your own n. https://www.alchemy.com/overviews/running-your-own-node, 2023.
- [4] Mihir Bellare and Phillip Rogaway. Random oracles are practical: A paradigm for designing efficient protocols. In Proceedings of the 1st ACM Conference on Computer and Communications Security, CCS ’93, page 62–73, New York, NY, USA, 1993. Association for Computing Machinery.
- [5] Saul Blumenthal and Ram C Dahiya. Estimating the binomial parameter n. Journal of the American Statistical Association, 76(376):903–909, 1981.
- [6] Vitalik Buterin. Why sharding is great: demystifying the technical properties. https://vitalik.ca/general/2021/04/07/sharding.html, 2021.
- [7] Yair Cleper and Gil Binder. Lava: A decentralized rpc network for blockchains, 2022.
- [8] Fiag DAO. Rpc meter. https://beta.rpcmeter.io/ethereum/miami, 2023.
- [9] Dfinity. L1 comparison - internet computer wiki. https://wiki.internetcomputer.org/wiki/L1_comparison, 2022.
- [10] ethereum.org. go-etherum - hardware requirements. https://geth.ethereum.org/docs/getting-started/hardware-requirements, 2023.
- [11] ethereum.org. Maximal extractable value (mev). https://ethereum.org/en/developers/docs/mev/, 2023.
- [12] Fabio Wehb Ferrari. Ankr becomes one of the first rpc providers to the aptos blockchain, 2022.
- [13] Interchain Foundation. What is tendermint? https://docs.tendermint.com/v0.34/introduction/what-is-tendermint.html, 2021.
- [14] Interchain Foundation. Iavl+ tree, 2022.
- [15] Zhenhuan Gao, Yuxuan Hu, and Qinfan Wu. Jellyfish merkle tree, 2021.
- [16] SalesForce Inc. What is saas - software as a service. https://www.salesforce.com/in/saas/, 2023.
- [17] Inc. Infura. The path to scalability, 2021.
- [18] laanwj, fanquake, Pieter Wuille, Hennadii Stepanov, Gavin Andresen, Andrew Chow, John Newbery, Jonas Schnelli, J), Jon Atack, Cory Fields, Carl Dong, Ryan Ofsky, Matt Corallo, Luke Dashjr, Sebastian Falbesoner, João Barbosa, Suhas Daftuar, Samuel Dobson, Non-Github User Bitcoin Commits, Gregory Maxwell, Gloria Zhao, Vasil Dimov, Anthony Towns, Alex Morcos, Sjors Provoost, James O’Beirne, kallewoof, Gregory Sanders, and Amiti Uttarwar. bitcoin/bitcoin. Github, 5 2023.
- [19] Aptos Labs. Aptos explorer. https://explorer.aptoslabs.com/?network=mainnet.
- [20] Chong Li, Jiangnan Liu, Chenyang Lu, Roch Guerin, and Christopher D. Gill. Impact of distributed rate limiting on load distribution in a latency-sensitive messaging service, 2021.
- [21] Moxie Marlinspike. My first impressions of web3. 2022.
- [22] Satoshi Nakamoto. Bitcoin: A peer-to-peer electronic cash system. Decentralized business review, page 21260, 2008.
- [23] Pocket Network. Building better rpc service: What is the rpc trilemma? https://www.blog.pokt.network/rpc-service-and-the-rpc-trilemma/, 2023.
- [24] Jason Ngan. 4 rate limit algorithms every developer should know, 2022.
- [25] Daniel Olshansky and Nguyen Andrew. pokt-network/pocket-core - reward protocol, 2022.
- [26] Daniel Olshansky and Ramiro R. Colmeiro. pokt-network/pocket-core - probabilistic proofs, 2022.
- [27] Barath Raghavan, Kashi Vishwanath, Sriram Ramabhadran, Kenneth Yocum, and Alex C. Snoeren. Cloud control with distributed rate limiting, 2007.
- [28] Celestia Development Team. Sparse merkle trees. https://github.com/celestiaorg/smt, 2021.
- [29] Plasma Core Team. Merkle sum tree block structure, 2019.
- [30] Alin Tomescu. Why you should probably never sort your merkle tree’s leaves. GitHub repository, 2023.
Appendix I
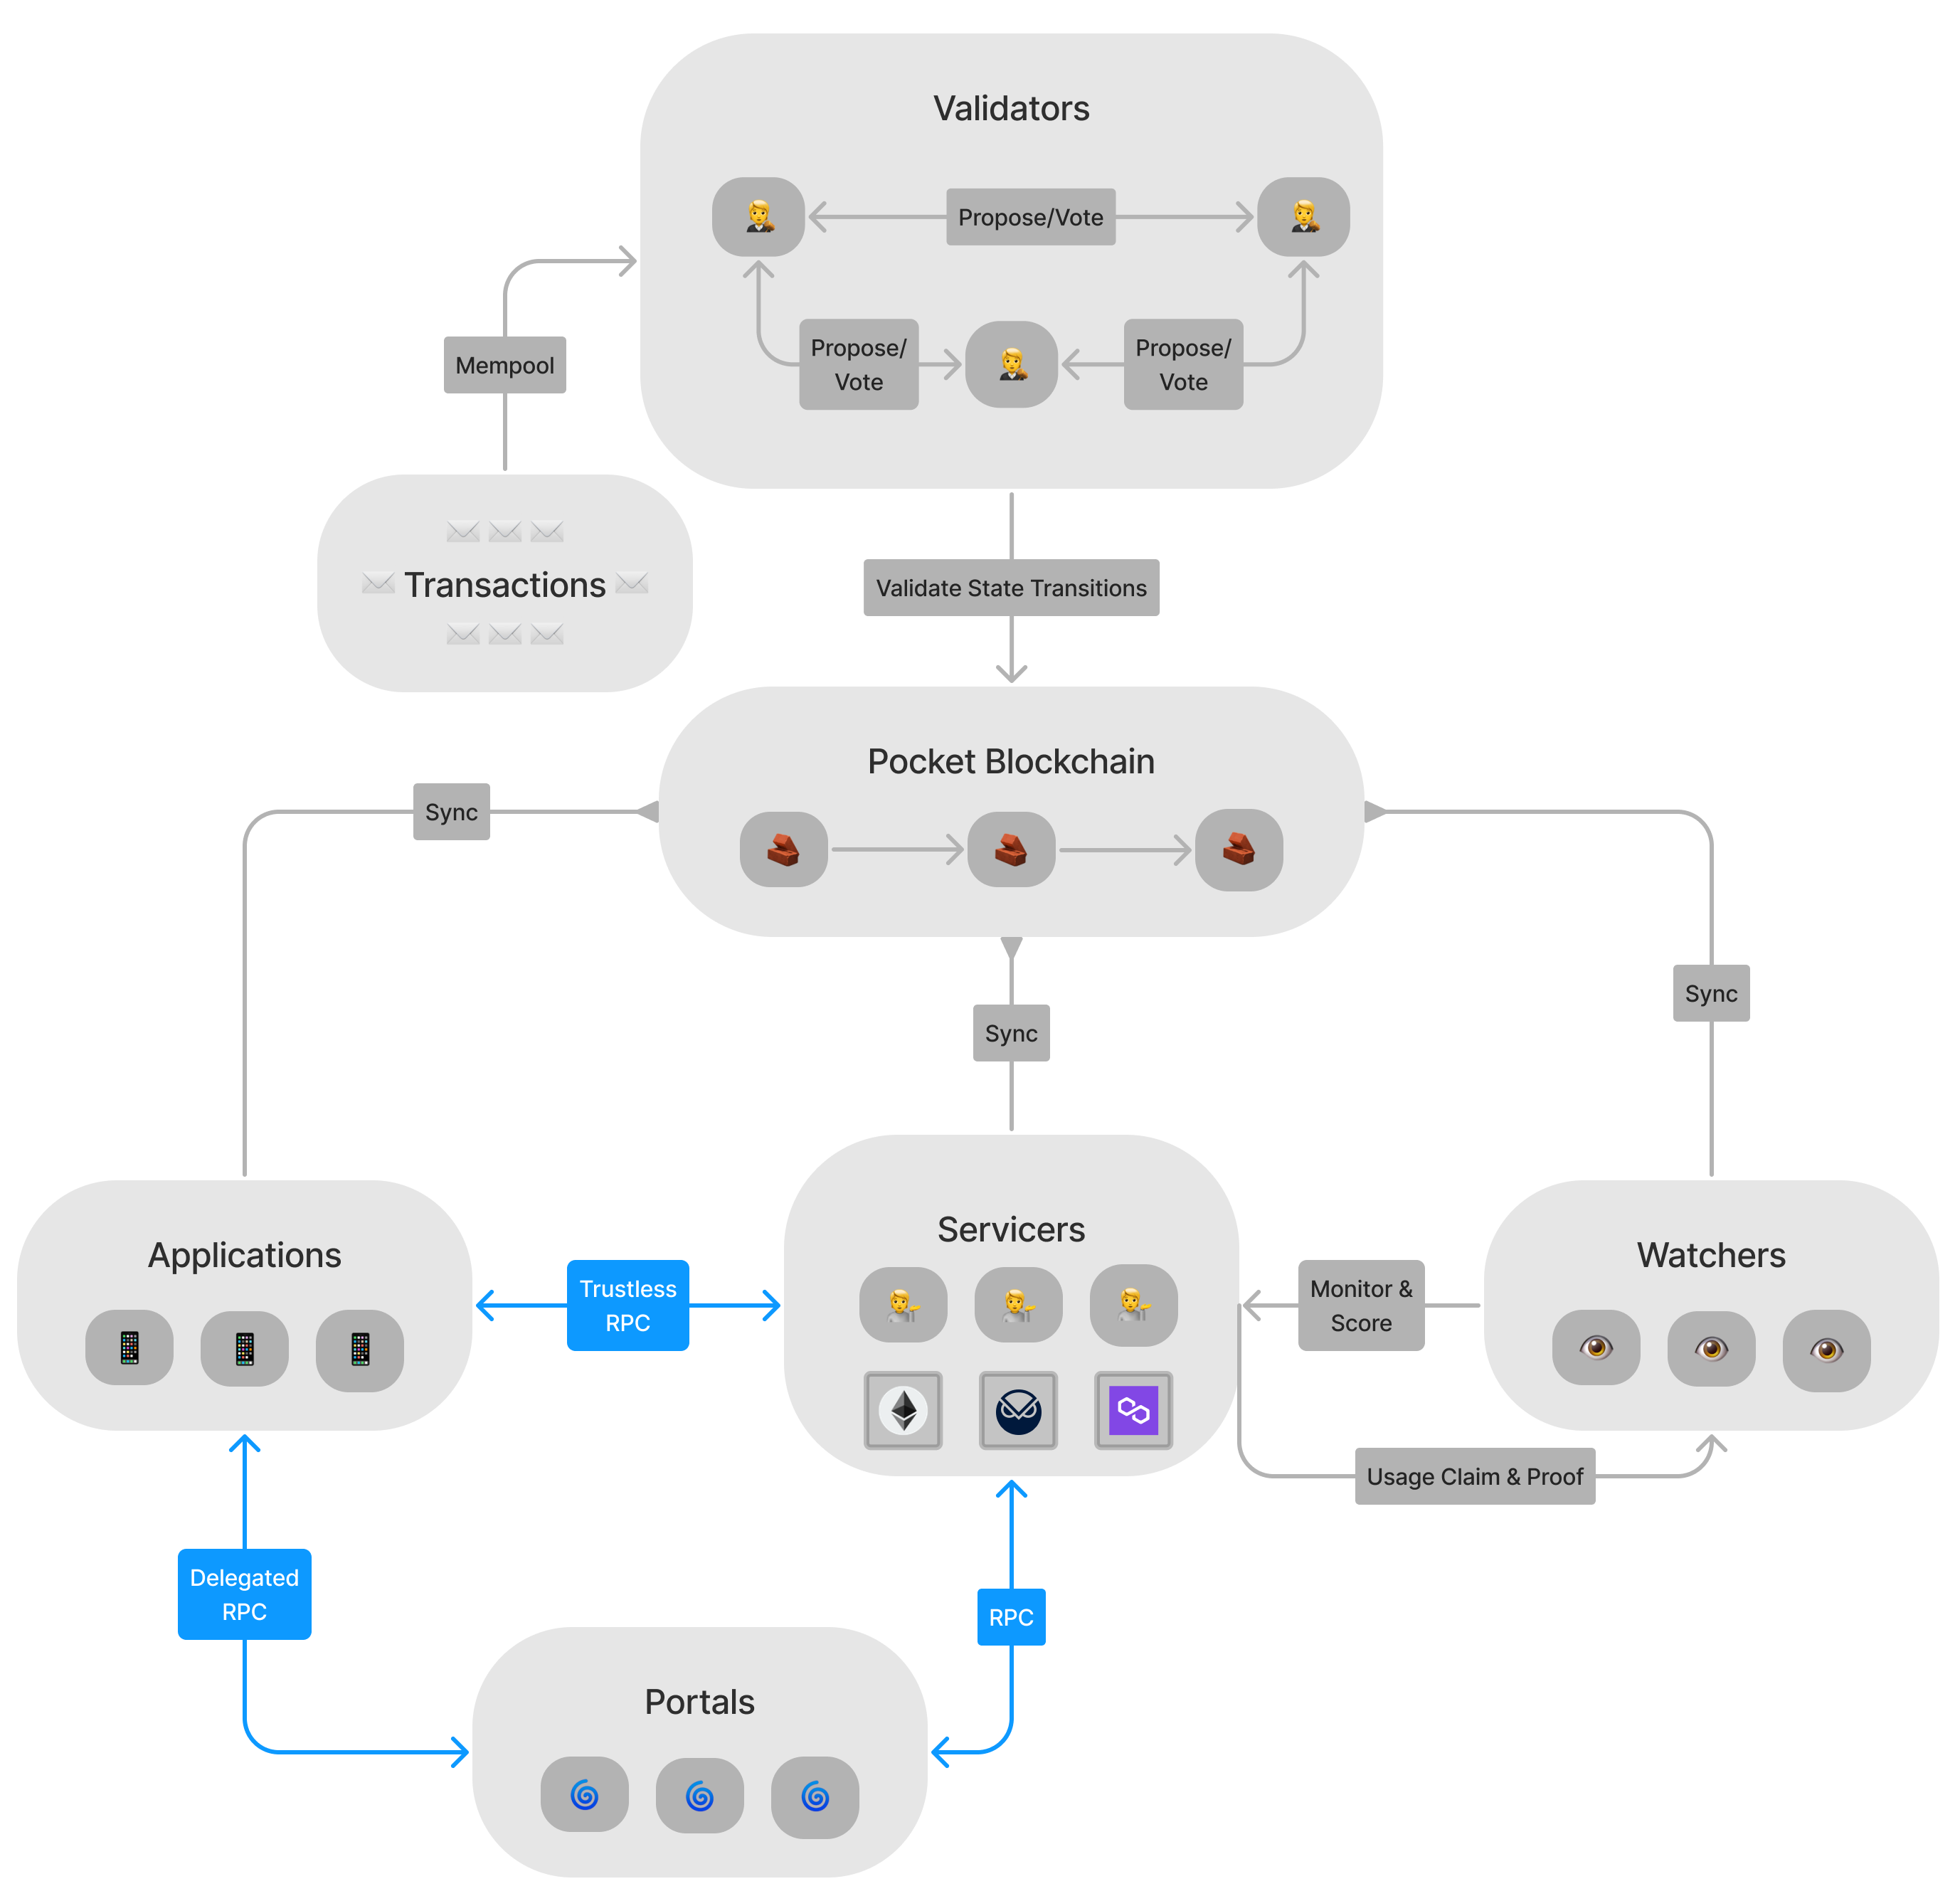
Fig. 6 illustrates the interaction and responsibilities between the various protocol actors in Pocket Network. It is important to note that in the current, live iteration of the protocol, the Portals and the Watchers are off-chain and consolidated as a single entity. The roles of all the actors are outlined below. In the context of Relay Mining, the key item to note is that Applications pay for access to RPC services, and Servicers earn in exchange for handling those requests.
-
Validator - Validates BFT state transitions of the distributed ledger
-
Servicer - Provides access to an RPC service and earns rewards in native cryptocurrency
-
Watcher - Makes periodic Quality of Service (QoS) checks of Servicers
-
Application - Pays for access to RPC service in native cryptocurrency
-
Portal - Optionally proxies requests on behalf of the Application and provides secondary off-chain services
Appendix II
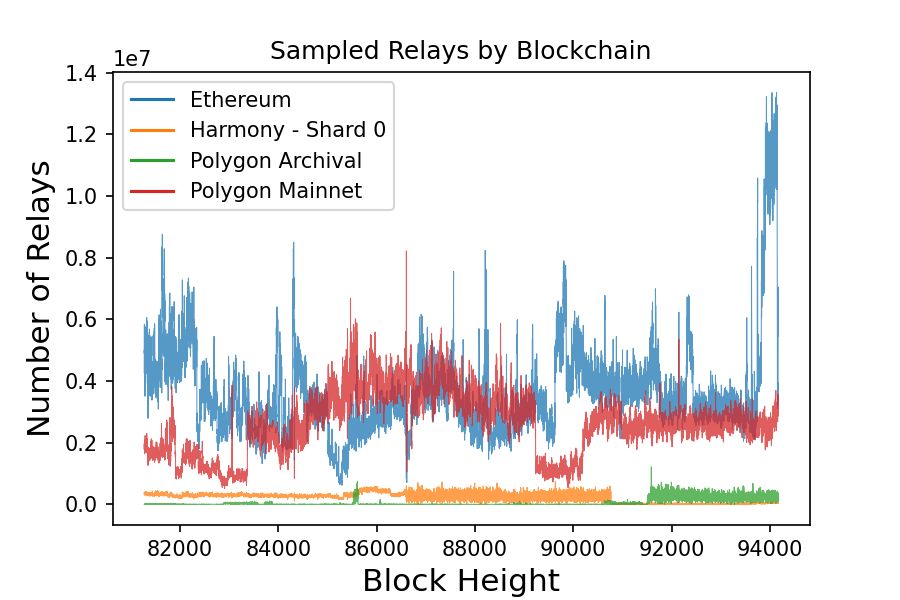
The relay mining framework was simulated over real-world data obtained from the Pocket Network v0 blockchain. The simulation has the objective of estimating the deviations that are likely to be observed under different network behaviours, for this we selected for blockchains with different behaviours, under a period of blocks ( days). The selected networks were: Ethereum, Harmony Shard 0, Poligon Mainnet and Polygon Archival, the evolution of the traffic for each of them can be seen in Fig. 7.
These cases were analyzed using the following configuration:
-
Target claims by block :
-
Exponential Moving Average decay :
-
Number of blocks between updates :
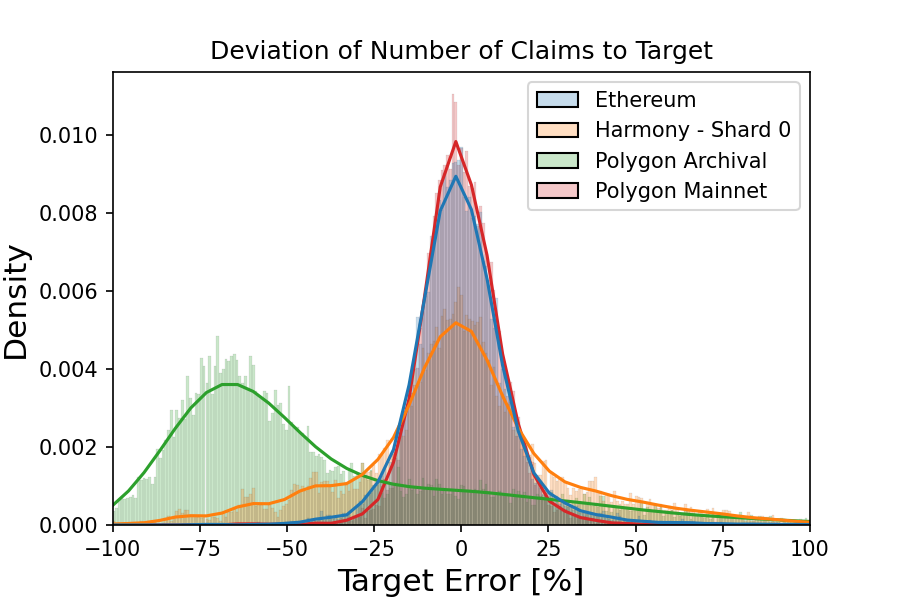
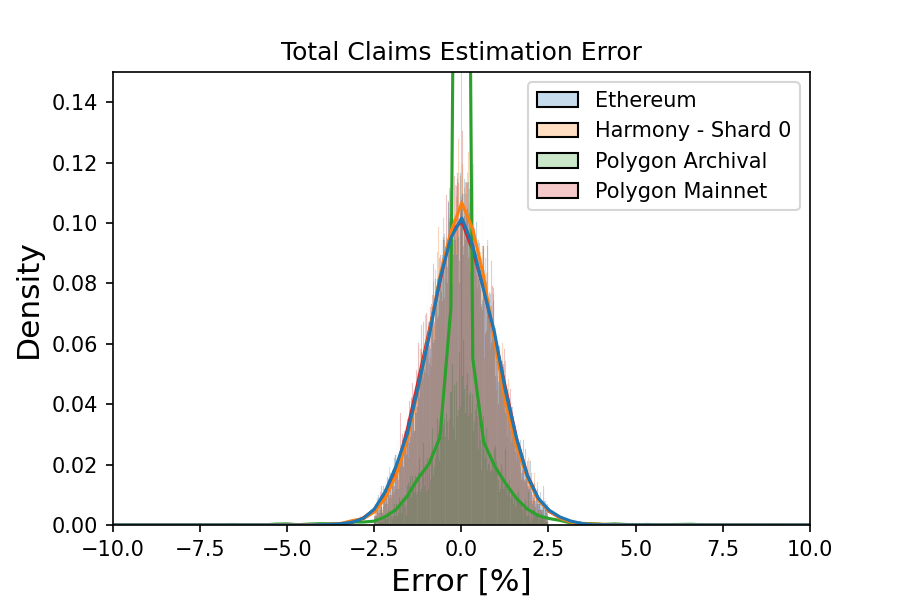
The process replicated the algorithm 2 to update the difficulty and calculated the errors in the number of claimed relays versus the selected target , also the error of the real number of relays to the estimated number of relays . Using this data it is possible to calculate the error to visualize the distribution of these errors in Fig. 8 and Fig. 9, respectively.
It is also to analyze the transient effects on particular traffic behabiors. In the sampled blockchains data it is possible to observe four different cases:
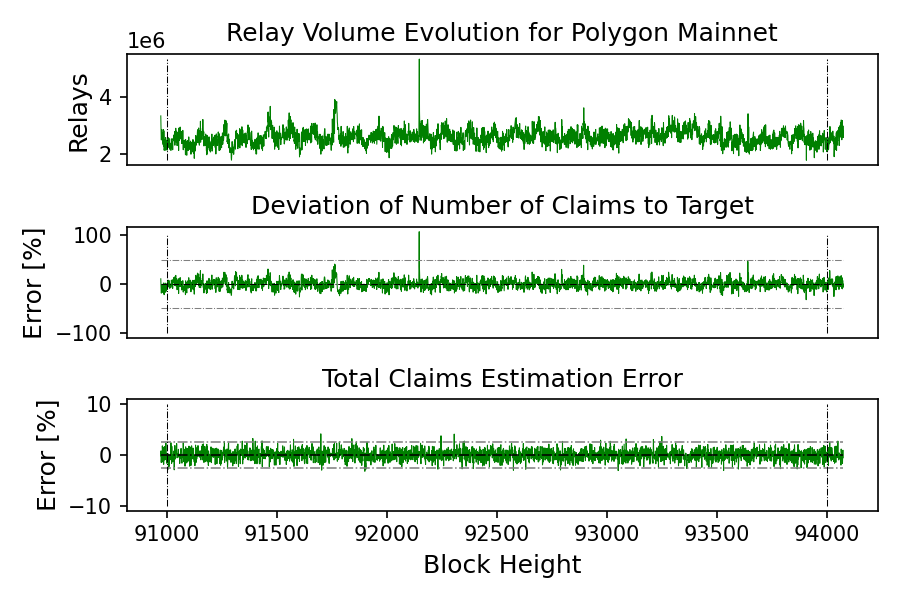
9.1 Steady High Volume - Polygon Mainnet
This is the expected normal behaviour, where the number of relays by block stay almost constant or varies with low frequency. A blockchain that had this behaviour in the observed period of blocks, from height to ( to ) was the Polygon Mainnet. In Fig. 10 a close-up of the process can be observed.
In this period the average target deviation was of , with a peak target deviation of . The accumulated error resulted in a total of extra claims, over blocks. The average volume estimation error was with a peak of .
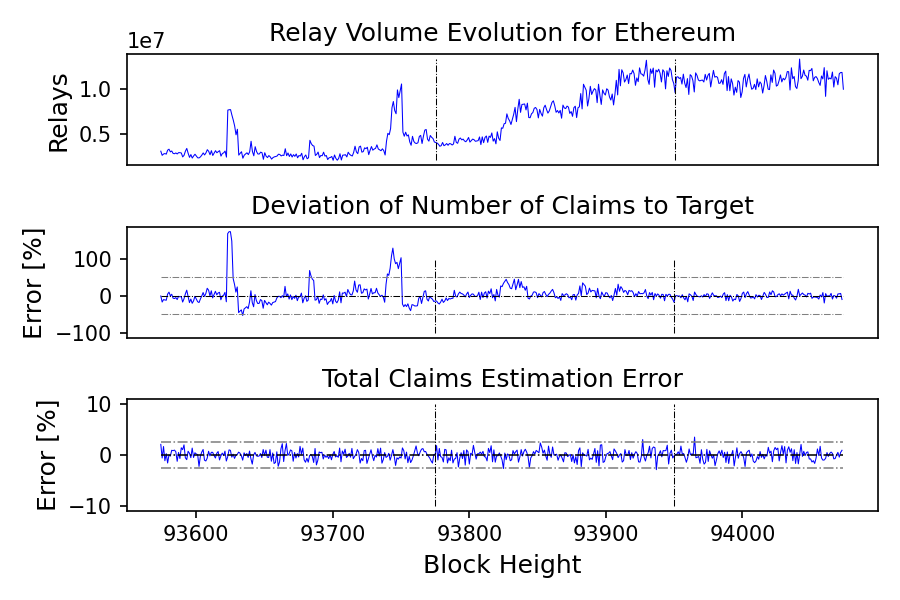
9.2 Soft Relay Surge - Ethereum
To illustrate this case we use the Ethereun data over the blocks to , this is from to , during this period the volume of the blockchain processed in the Pocket Network raised from to . The process was fast 666Compared to normal (non-step) increases observed in the network. and steady. In Fig. 11 a close-up of the process can be observed.
In this period the average target deviation was of , with a peak target deviation of . The accumulated error resulted in a total of extra claims, over blocks. The average volume estimation error was with a peak of .
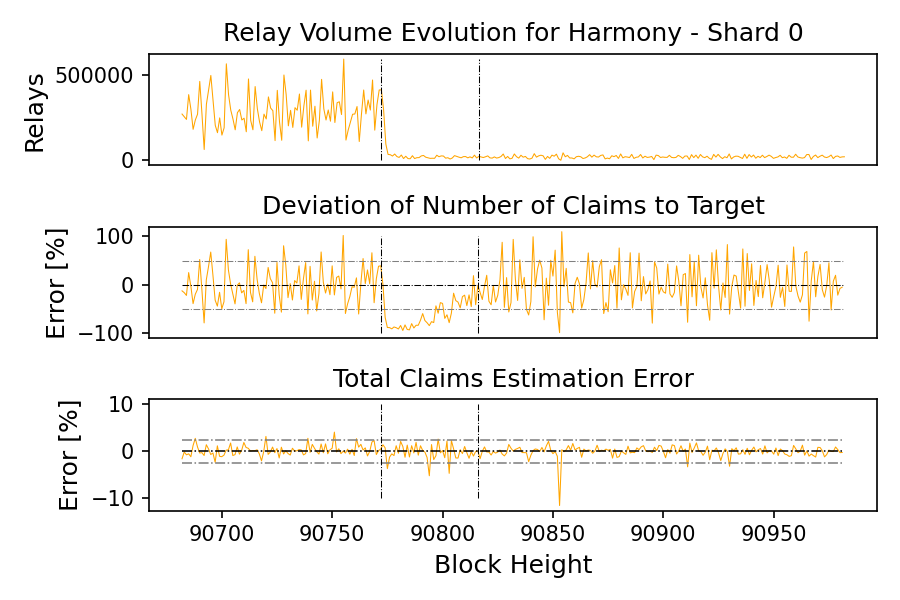
9.3 Step Relay Drop - Harmony Shard 0
An step drop in relays occur when a major source of relays stop requesting data. This effect was observed at height () for the Harmony Shard 0 blockchain, where the traffic dropped from to in less than four blocks. In Fig. 12 a close-up of the process can be observed.
In this period the average target deviation was of , with a peak target deviation of . The accumulated error resulted in a total of less claims, over blocks. The average volume estimation error was with a peak of .
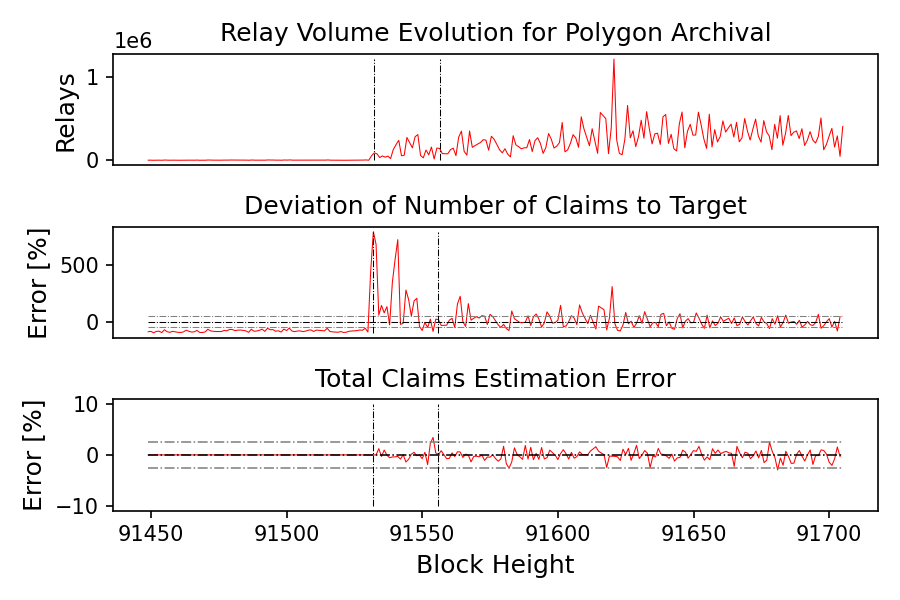
9.4 Step Relay Surge - Polygon Archival
This case is typical when a new chain is introduced in the ecosystem, the evolution number of relays resembles an step function. This behaviour was observed recently, at height () for the blockchain Polygon Archival. This blockchain moved from to relays per block. In Fig. 13 a close-up of the process can be observed.
In this period the average target deviation was of , with a peak target deviation of . The accumulated error resulted in a total of extra claims, over blocks. The average volume estimation error was with a peak of .