Panchromatic simulated galaxy observations from the NIHAO project
Abstract
We present simulated galaxy spectral energy distributions (SEDs) from the far ultraviolet through the far infrared, created using hydrodynamic simulations and radiative transfer calculations, suitable for the validation of SED modeling techniques. SED modeling is an essential tool for inferring star formation histories from nearby galaxy observations, but is fraught with difficulty due to our incomplete understanding of stellar populations, chemical enrichment processes, and the non-linear, geometry dependent effects of dust on our observations. Our simulated SEDs will allow us to assess the accuracy of these inferences against galaxies with known ground truth. To create the SEDs, we use simulated galaxies from the NIHAO suite and the radiative transfer code SKIRT. We explore different sub-grid post-processing recipes, using color distributions and their dependence on axis ratio of galaxies in the nearby universe to tune and validate them. We find that sub-grid post-processing recipes that mitigate limitations in the temporal and spatial resolution of the simulations are required for producing FUV to FIR photometry that statistically reproduce the colors of galaxies in the nearby universe. With this paper we release resolved photometry and spatially integrated spectra for our sample galaxies, each from a range of different viewing angles. Our simulations predict that there is a large variation in attenuation laws among galaxies, and that from any particular viewing angle that energy balance between dust attenuation and reemission can be violated by up to a factor of 3. These features are likely to affect SED modeling accuracy.
1 Introduction
Understanding our place in the universe requires untangling the history of galaxies over cosmic time. This paper presents simulated observations of galaxies accounting for dust absorption, scattering, and emission, to test the spectral energy distribution (SED) modeling techniques that many investigators use to infer the growth and evolution of galaxies from observations.
Galaxy evolution research proceeds on two major, complementary avenues—the archaeological record of individual galaxies at redshift zero and look-back studies of how the population of galaxies changes over time. This paper concentrates on understanding the archaeological record.
Unraveling galaxy histories based on redshift zero observations through SED modeling is fraught with difficulty and ambiguity due to uncertainties in modeling star formation, stellar evolution, stellar structure, stellar atmospheres, chemical evolution, and dust (Conroy & Gunn, 2010; Conroy, 2013; Hayward & Smith, 2015; Lower et al., 2020). In this paper we will provide simulations that will help us to better understand these uncertainties, especially those related to dust.
A particularly informative property of a galaxy is its star formation rate (SFR), which tells us how rapidly the galaxy is converting gas into stars. Because young stellar populations emit much more strongly in the ultraviolet (UV) than do older populations, the UV luminosity emitted by stars is closely related to a galaxy’s SFR.
However, dust preferentially absorbs and scatters UV light relative to higher wavelengths and tends to be located near newly formed stellar populations (Salim & Narayanan, 2020). Thus, the observed UV luminosity is typically substantially less than the emitted luminosity. The combination of absorption and scattering due to a dusty medium between the observer and a source is known as extinction, and its wavelength dependence as the extinction curve. The extinction curve depends on the distribution of dust grain sizes and chemical composition. The dusty medium and the light sources are intermixed, so in a real system some sources experience more extinction than others. In addition, flux can be scattered by dust into the line of sight. In the presence of all of these effects, the ratio of the total observed to emitted flux is known as the attenuation. The attenuation’s dependence on wavelength can differ from the extinction curve of the dusty medium.
Correcting for the attenuation is a significant source of uncertainty in inferring the SFR of a galaxy. From galaxy to galaxy, and within galaxies, there is variation in the amount of dust, in the dust extinction curves, and in the geometry of dust relative to the stars. All of these differences can cause a substantial variation in the global attenuation curves. Of course, we have no real way of knowing the true attenuation curve of a galaxy, since we don’t have access to the emitted light before interacting with dust. This lack of a ground truth makes it impossible to test the accuracy of SED modeling inferences from observations alone.
In order to test our ability to infer physical properties of galaxies from observations, we need a data set for which ground truth is known, and from which we can test our inferences. The approach we take here is to perform radiative transfer on simulated galaxies to produce mock photometry whose underlying physical parameters are known. This process has its own difficulties, which stem from many of the same uncertainties as in SED modeling, as well as difficulties related to the limited spatial and temporal resolution of the simulations.
Several recent investigations have pursued this approach. Camps et al. (2016) and Trayford et al. (2017) describe methodology for generating mock photometry for EAGLE galaxies (Crain et al., 2015; Schaye et al., 2015) and present comparisons with local galaxies from the Herschel Reference Survey (Boselli et al., 2010). They find discrepancies in the color-color relations in the – wavelength regime, indicating that the simulated dust is being insufficiently heated. The EAGLE simulations (Schaye et al., 2015) do not model the cold gas phase of the interstellar medium (ISM), leading to an artificially smooth dust density structure which can result in less grey attenuation curves. Related work by Trčka et al. (2020) uses the same methodology described above with a more detailed comparison to observations from DustPedia and finds that their mock photometry has FUV and MIR luminosities that are consistently larger than observed galaxies at the same stellar mass. Kapoor et al. (2021) generate mock photometry for 30 galaxies from the Auriga project using a methodology similar to Trayford et al. (2017), but with some differences in the sub-grid treatment of star-forming regions. They also explore two different methods for assigning dust mass from the gas based on the temperature and density of the gas. Although they do compare some of their mock colors to observations, the presented comparisons are fairly limited in scope. The ISM in the Auriga galaxies is overly smooth on scales of a few hundred parsecs and does not reproduce the density structure of a multi-phase ISM (Marinacci et al., 2019).
As a step towards a more accurate accounting of the effects of dust when inferring star formation histories, we perform full radiative transfer using the Stellar Kinematics Including Radiative Transfer (SKIRT) (Camps & Baes, 2020) Monte Carlo radiative transfer code on simulated galaxies from the Numerical Investigation of Hundred Astrophysical Objects (NIHAO) project (Wang et al., 2015a), generating mock observations ranging from far-ultraviolet (FUV) to far-infrared (FIR) wavelengths. In contrast to the previous works described above, the simulated galaxies from the NIHAO suite do reproduce the density structure of a multi-phase ISM; however, the spatial smoothing of pc is still larger than the structures found in the observed ISM.
We expand on previous works by presenting a detailed comparison between our mock observations and observed photometry from the nearby universe under a variety of modeling assumption, sub-grid recipes, and free parameter choices. The simulated photometry of our final modeling choices will be made publicly available as a data product and will provide an excellent basis on which to test the accuracy of SFHs inferred from SED modeling methods.
In Section 2 we describe the NIHAO simulations, and in Section
3 we describe our use of SKIRT for radiative transfer.
In Section 4, we describe the procedure for calculating axis ratios from simulated r-band images.
In Section 5, we discuss how we
tune our parameters to reproduce the UV, optical, and infrared galaxy colors
and their axis ratio dependence as observed in DustPedia.
In Section 6, we present the results for the galaxy colors and
their axis ratio dependence, and the resulting attenuation curves. In Section 6.6, we draw particular attention to the apparent energy imbalances that realistic
galaxy geometries can cause between UV dust attenuation and IR dust emission, highlighting the deficiency in the assumption of perfect energy balance commonly made in SED modeling codes such as Prospector (Leja et al., 2017), MAGPHYS (Battisti et al., 2020), and CIGALE (Boquien et al., 2019).
We describe the data products available from this work in section 7. We summarize our
results in Section 8.
2 Simulations
In this paper we use redshift zero snapshots from the NIHAO project, a set of more than one hundred cosmological zoom-in hydrodynamical simulations which reproduce the stellar versus halo mass relation, and the star formation rate versus stellar mass relation across cosmic time (Wang et al., 2015a). These simulations are based on the -body smoothed particle hydrodynamics (SPH) solver gasoline2 (Wadsley et al., 2017). The code includes cooling from hydrogen, helium, and metal-lines in a uniform UV ionizing background (see Shen et al., 2010; Wang et al., 2015a, for more details), while feedback from supernovae and massive stars (the so-called Early Stellar Feedback) is implemented following Stinson et al. (2013). NIHAO galaxies also include AGN feedback (Blank et al., 2019) but for this study we limited ourselves to stellar feedback using the original sample of galaxies from Wang et al. (2015a).
Gas particles are allowed to form stars when their temperature is below and their density is above . In the NIHAO simulations, each star particle represents a population of stars of the same age and metallicity (inherited from the parent gas particles) with a distribution of masses given by the assumed (Chabrier, 2003) initial mass function (IMF).
The NIHAO simulations have proven to be very successful in reproducing several observed
scaling relations like the relation between stellar mass and halo mass (Wang et al., 2015b), the disk gas mass and disk size relation (Macciò et al., 2016), and the Tully-Fisher relation (Dutton et al., 2017), and have been recently quite successfully tested against a large variety of scaling relations based on the MaNGA sample (Arora et al., 2023).
3 Radiative Transfer
SKIRT is a radiative transfer code specifically designed for dusty astrophysical systems like galaxies. It contains modules for importing data from smooth-particle hydrodynamic (SPH) simulations. In the following subsections, we motivate and describe our choice of wavelength grids, source models, dust models, and sub-grid recipes used in this work. We tune the free parameters within these models by comparing to the DustPedia sample (Davies et al., 2017), which includes 875 galaxies in the nearby universe with over 40 aperture matched photometric bands ranging from the UV to millimeter wavelengths (Clark et al., 2018), and which will be described in Section 5.
3.1 Wavelength Grids
To simulate the radiative transfer, we must choose the wavelength grids on which to describe various components of the light: the source radiation, the local radiation field, the dust emission, and the observed (“instrument”) SED. In order to maximize computational efficiency without losing resolution, we decouple the choices of wavelength grids for these components. The paragraphs below describes these choices; other than the increased optical resolution in the final set of simulations, these choices follow the recommendations of Camps & Baes (2020).
For the source system, we set the wavelength grid to range from to with the same resolution as our source model, described in Section 3.2. For the radiation field wavelength grid, which is used to heat the dust at every medium system cell, we use the range to with 40 bins distributed evenly in log space. For the dust emission wavelength grid, we use a nested logarithmic wavelength grid with a coarse component between and with 308 bins, and a sub-grid component between and with 200 bins to give higher resolution in the region corresponding to polycyclic aromatic hydrocarbon (PAH) emission.
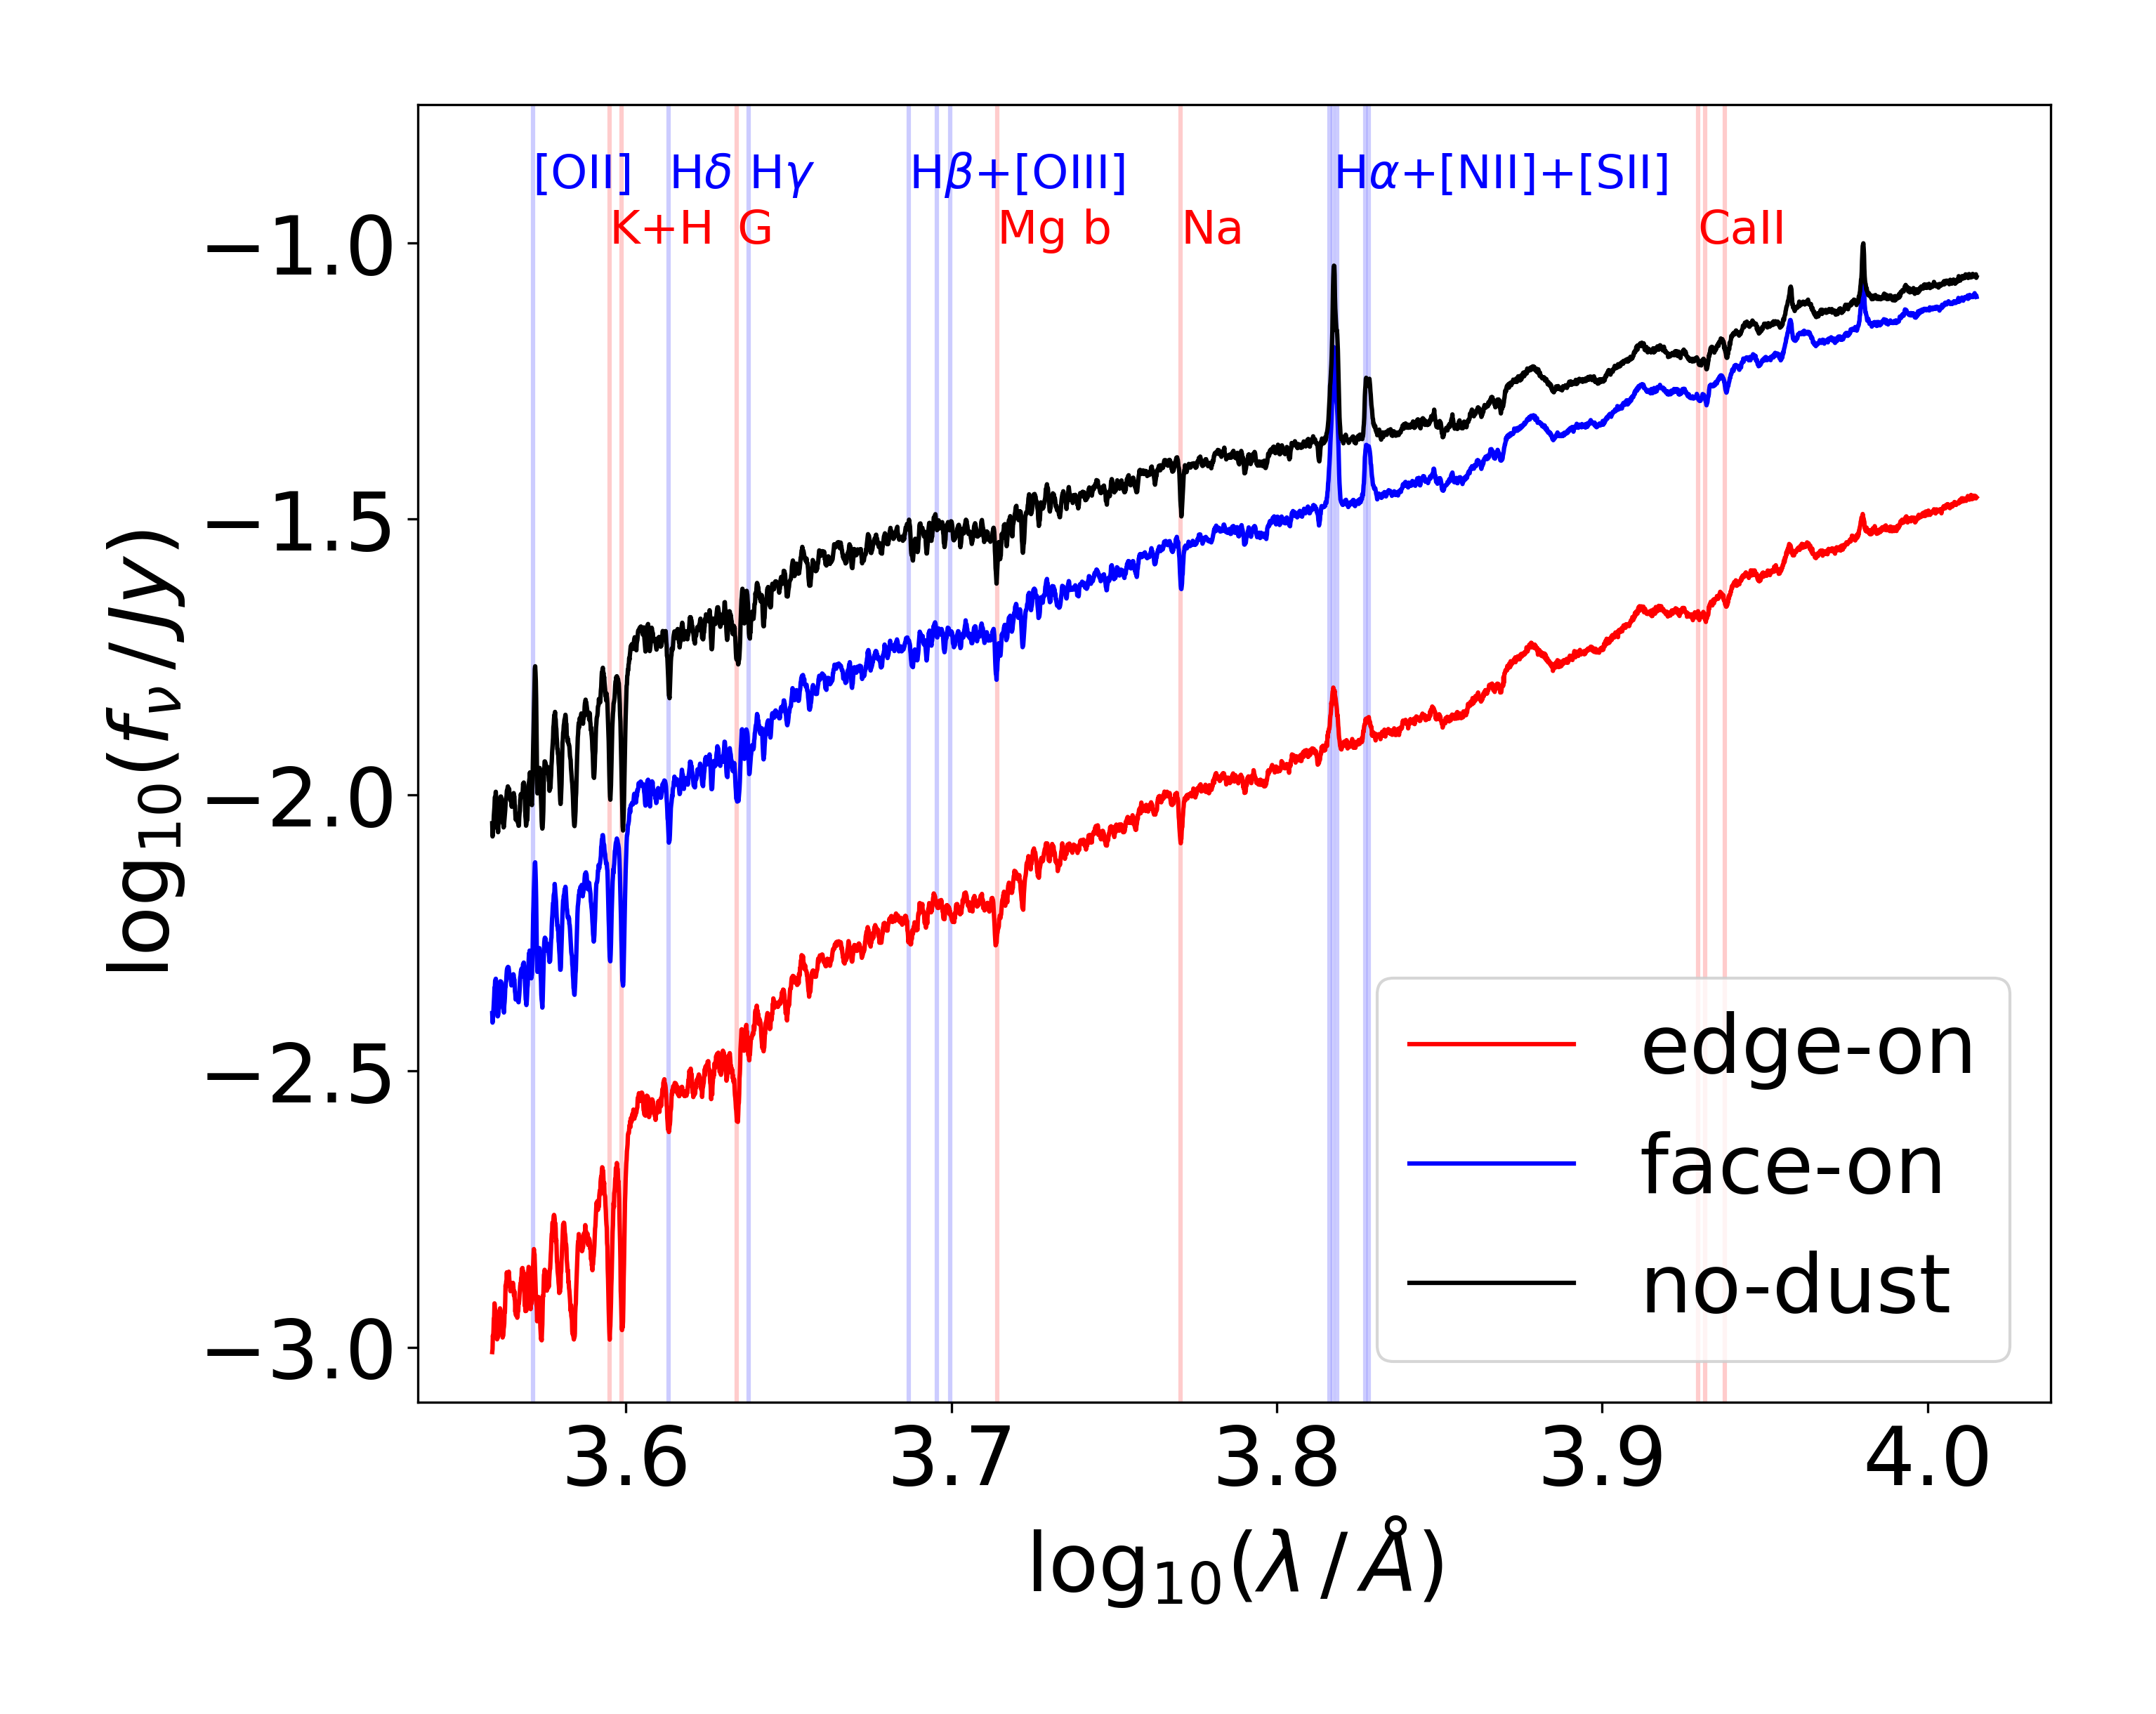
For our SED instrument wavelength grid, we use two different choices, one for tuning parameters and one to produce the final set of simulations presented here. For tuning parameters, we use 601 bins evenly distributed in log space between and . For producing the final presented set of simulations, we use the same grid except that we increase the SED instrument wavelength resolution between 3600 and 10,300 Å to a resolution of to match optical spectra from the Sloan Digital Sky Survey IV’s Mapping Nearby Galaxies at APO program (SDSS-IV MaNGA, Bundy et al. 2015; Blanton et al. 2017). See Figure 1 for visualization of the instrument wavelength range and resolution.

3.2 Source Model
For each star particle, we assign a spectral energy distribution (SED) from FSPS (Conroy et al., 2009; Conroy & Gunn, 2010; Foreman-Mackey et al., 2014) according to its age and metallicity, assuming a Chabrier initial mass function (IMF) (Chabrier, 2003), and weighted by its mass. We sample photons from the SED and launch them isotropically in the rest frame of the particle and subsequently Doppler shift them accordingly.
In the real universe, a cloud of cold gas will collapse gravitationally to form a population of stars. These populations of stars typically have total stellar masses between and , distributed according to a power law with index (Heyer et al., 2001). In contrast, the populations of stars in the simulations are represented by single-age, single metallicity star particles which typically have much larger masses. This approximation leads to star formation histories that are more stochastic than they would be if simulated at higher resolution. For old stellar populations, this effect is insignificant, but for young stellar populations, whose spectra change rapidly with slight changes in age, this effect will cause an unrealistically large variation in the resulting spectra.
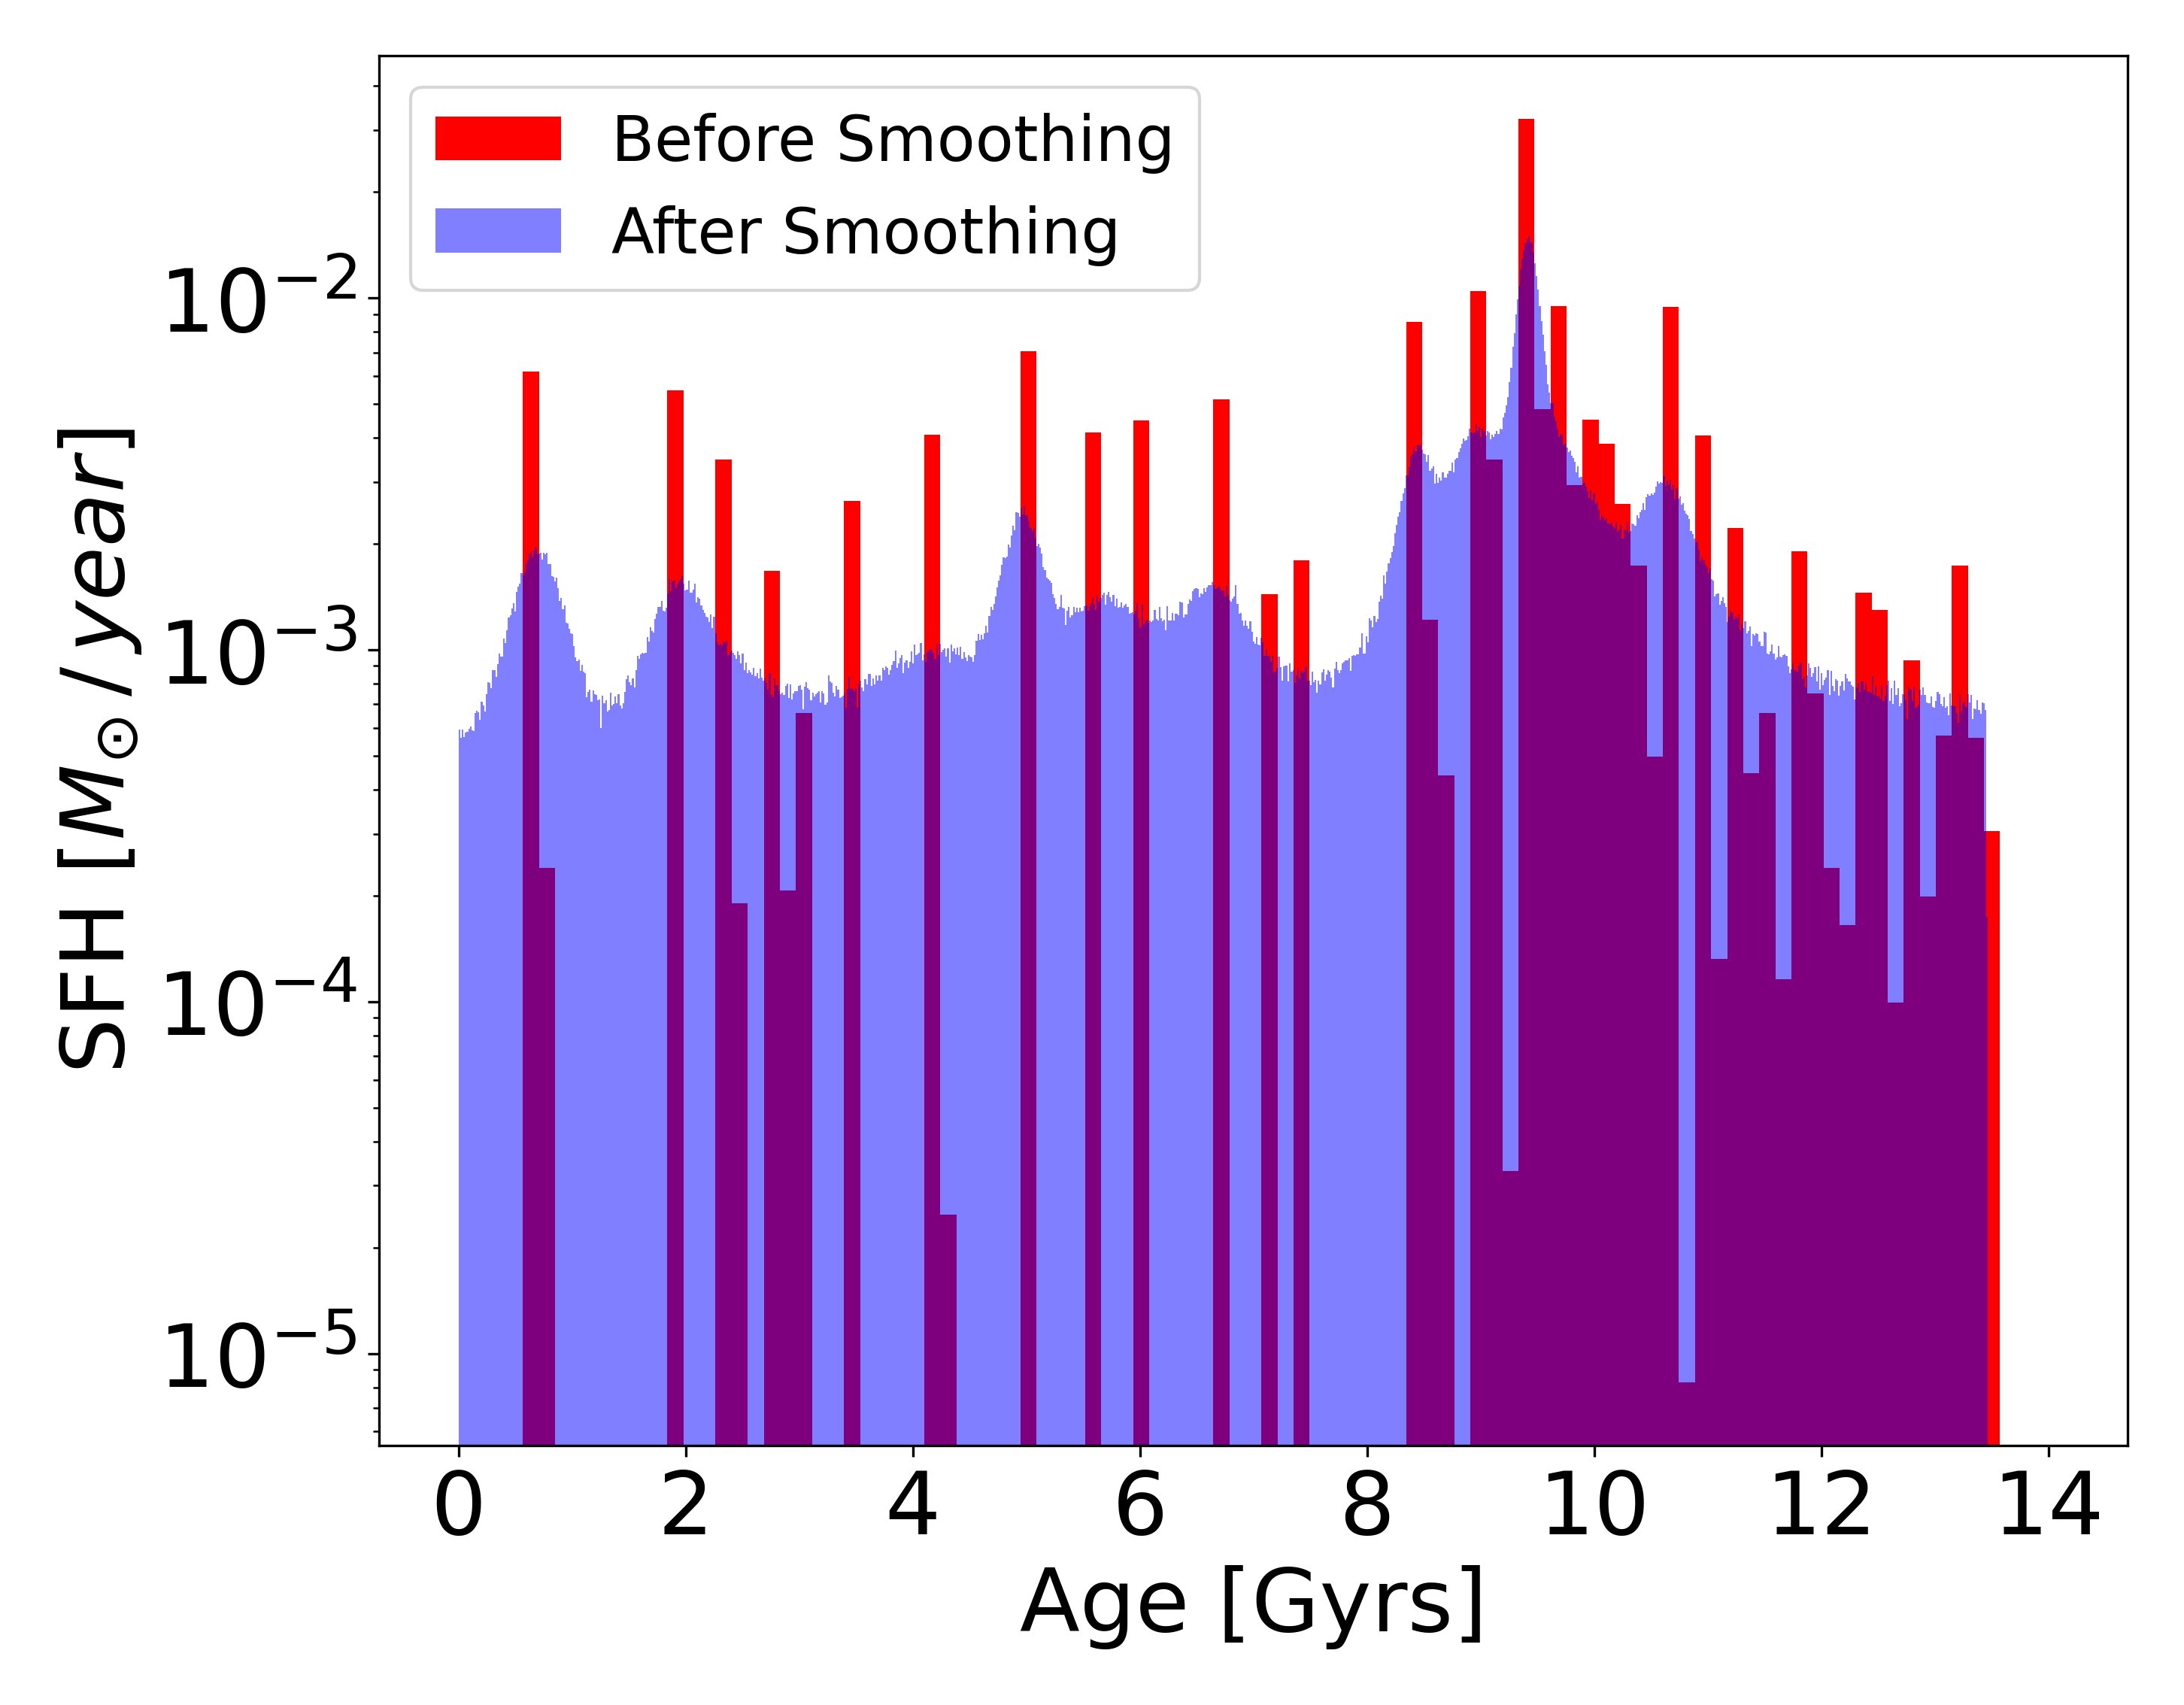
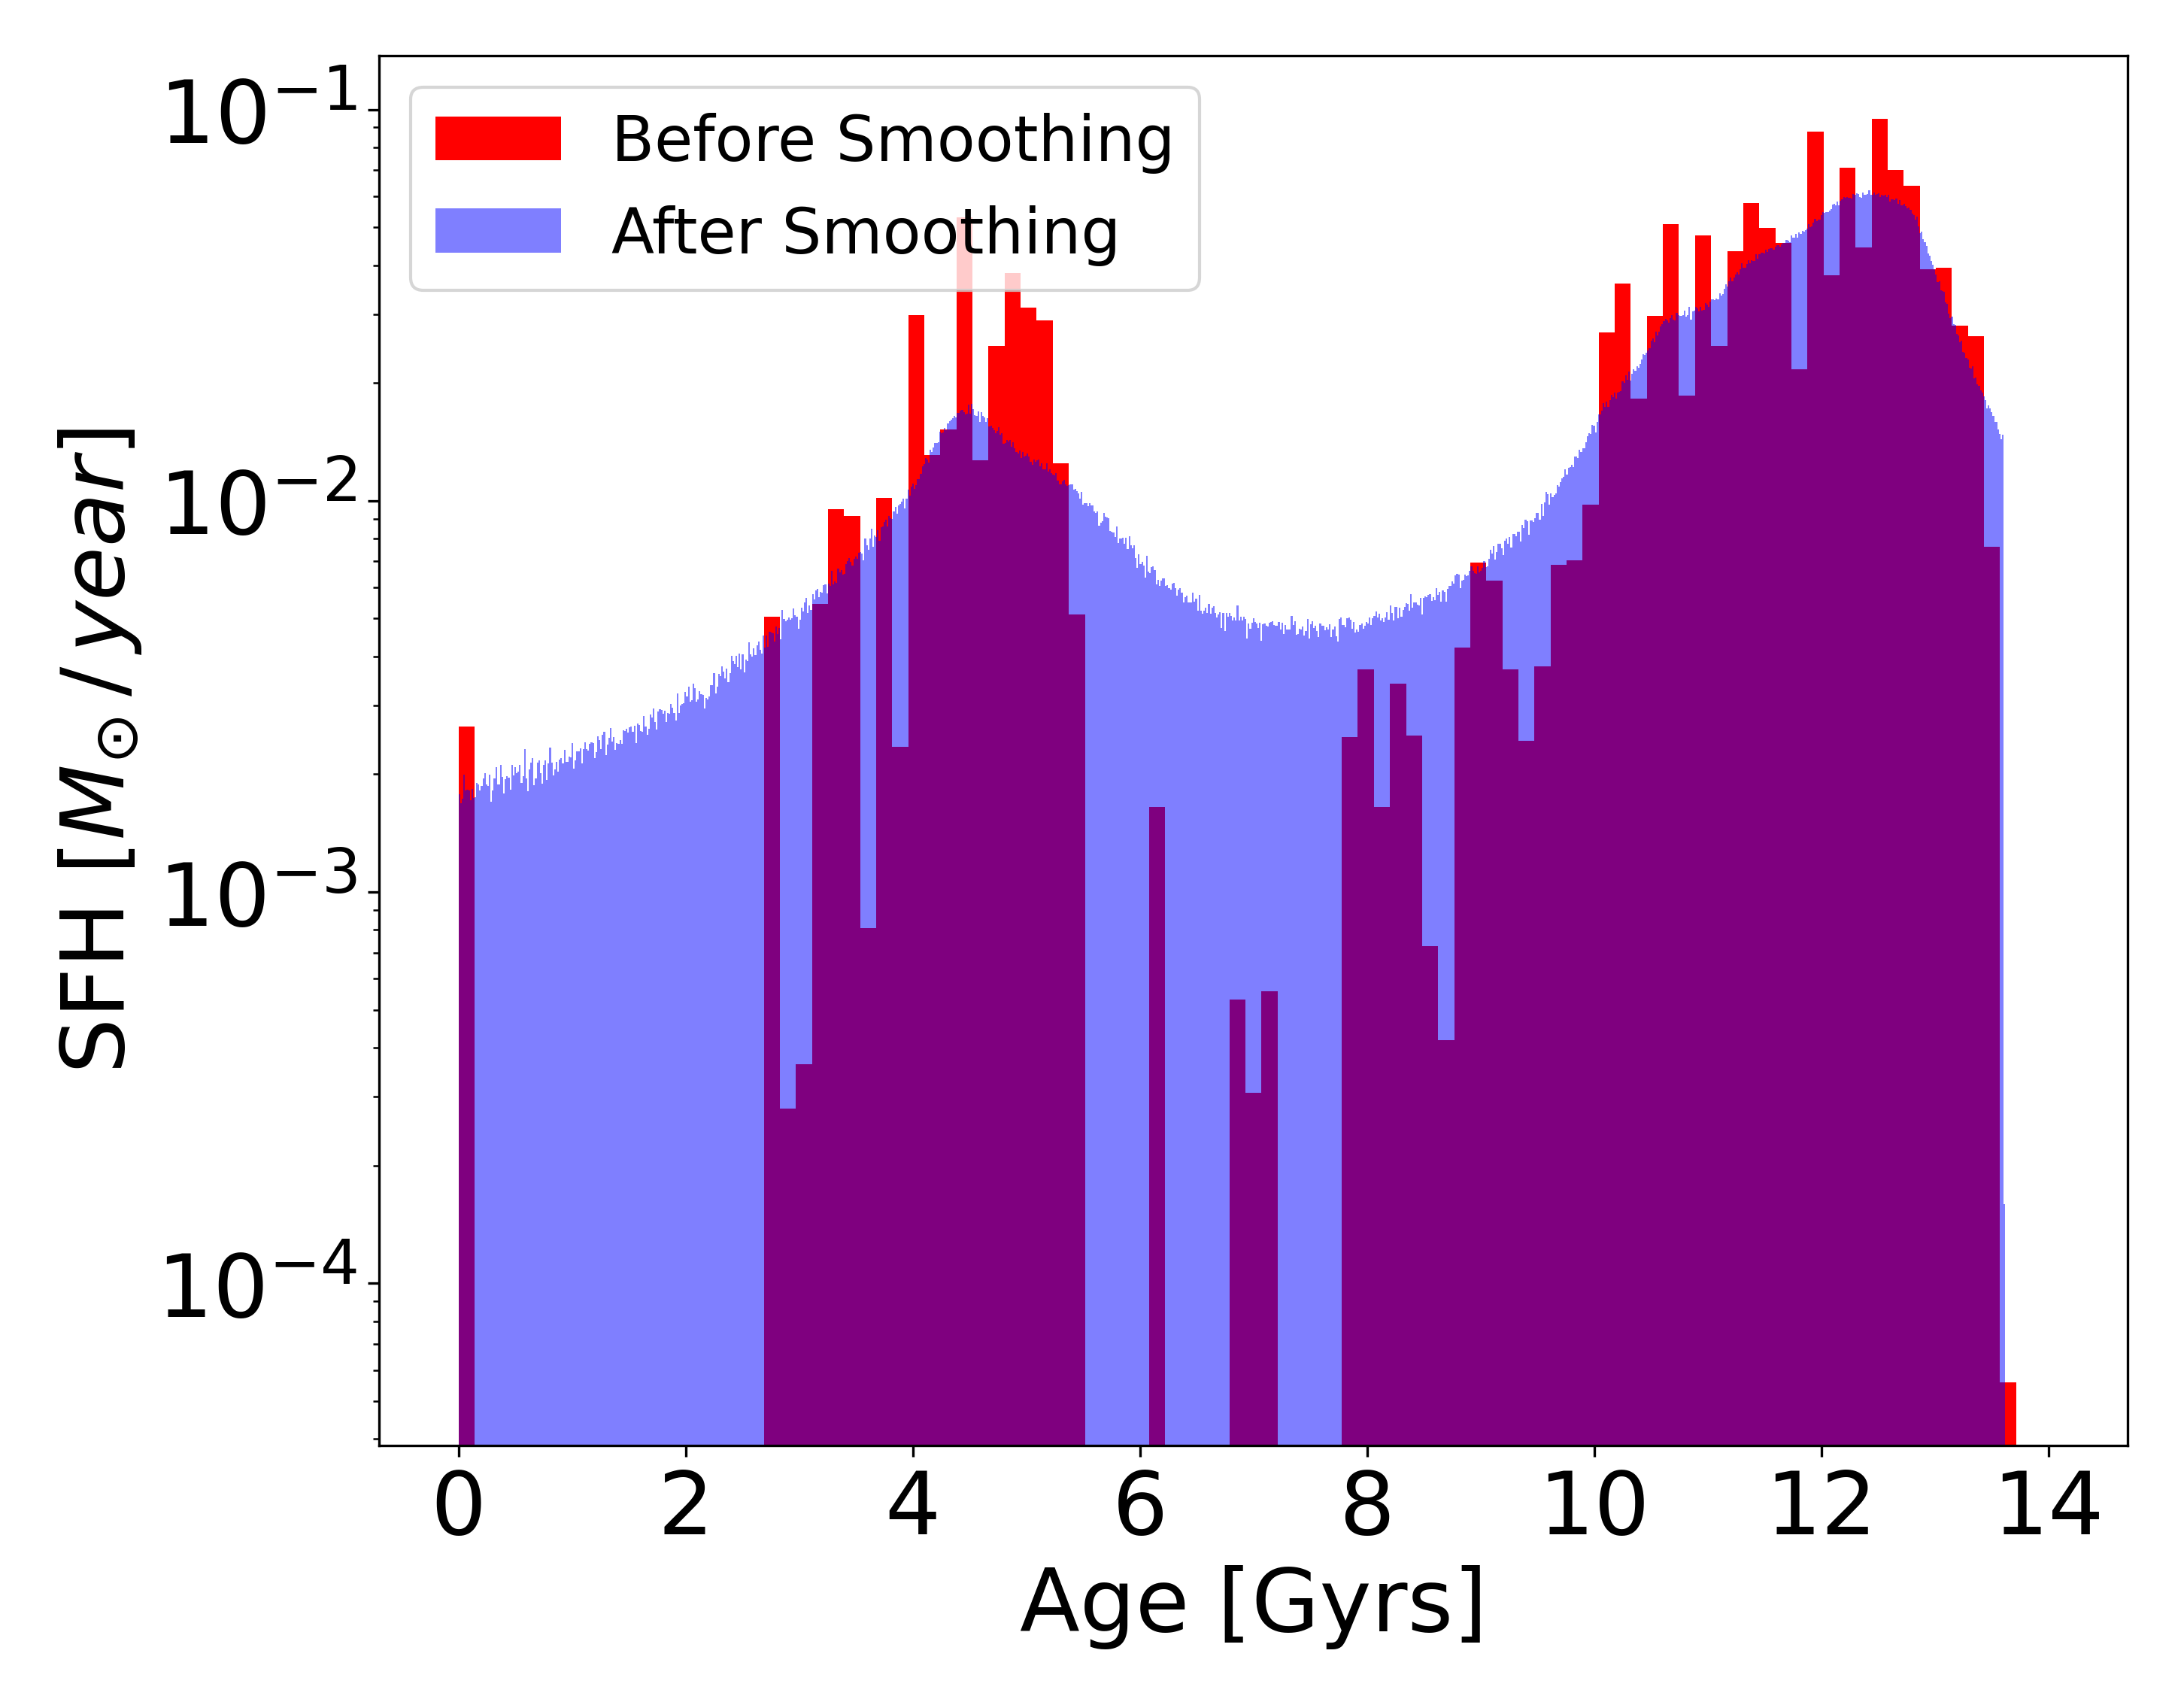
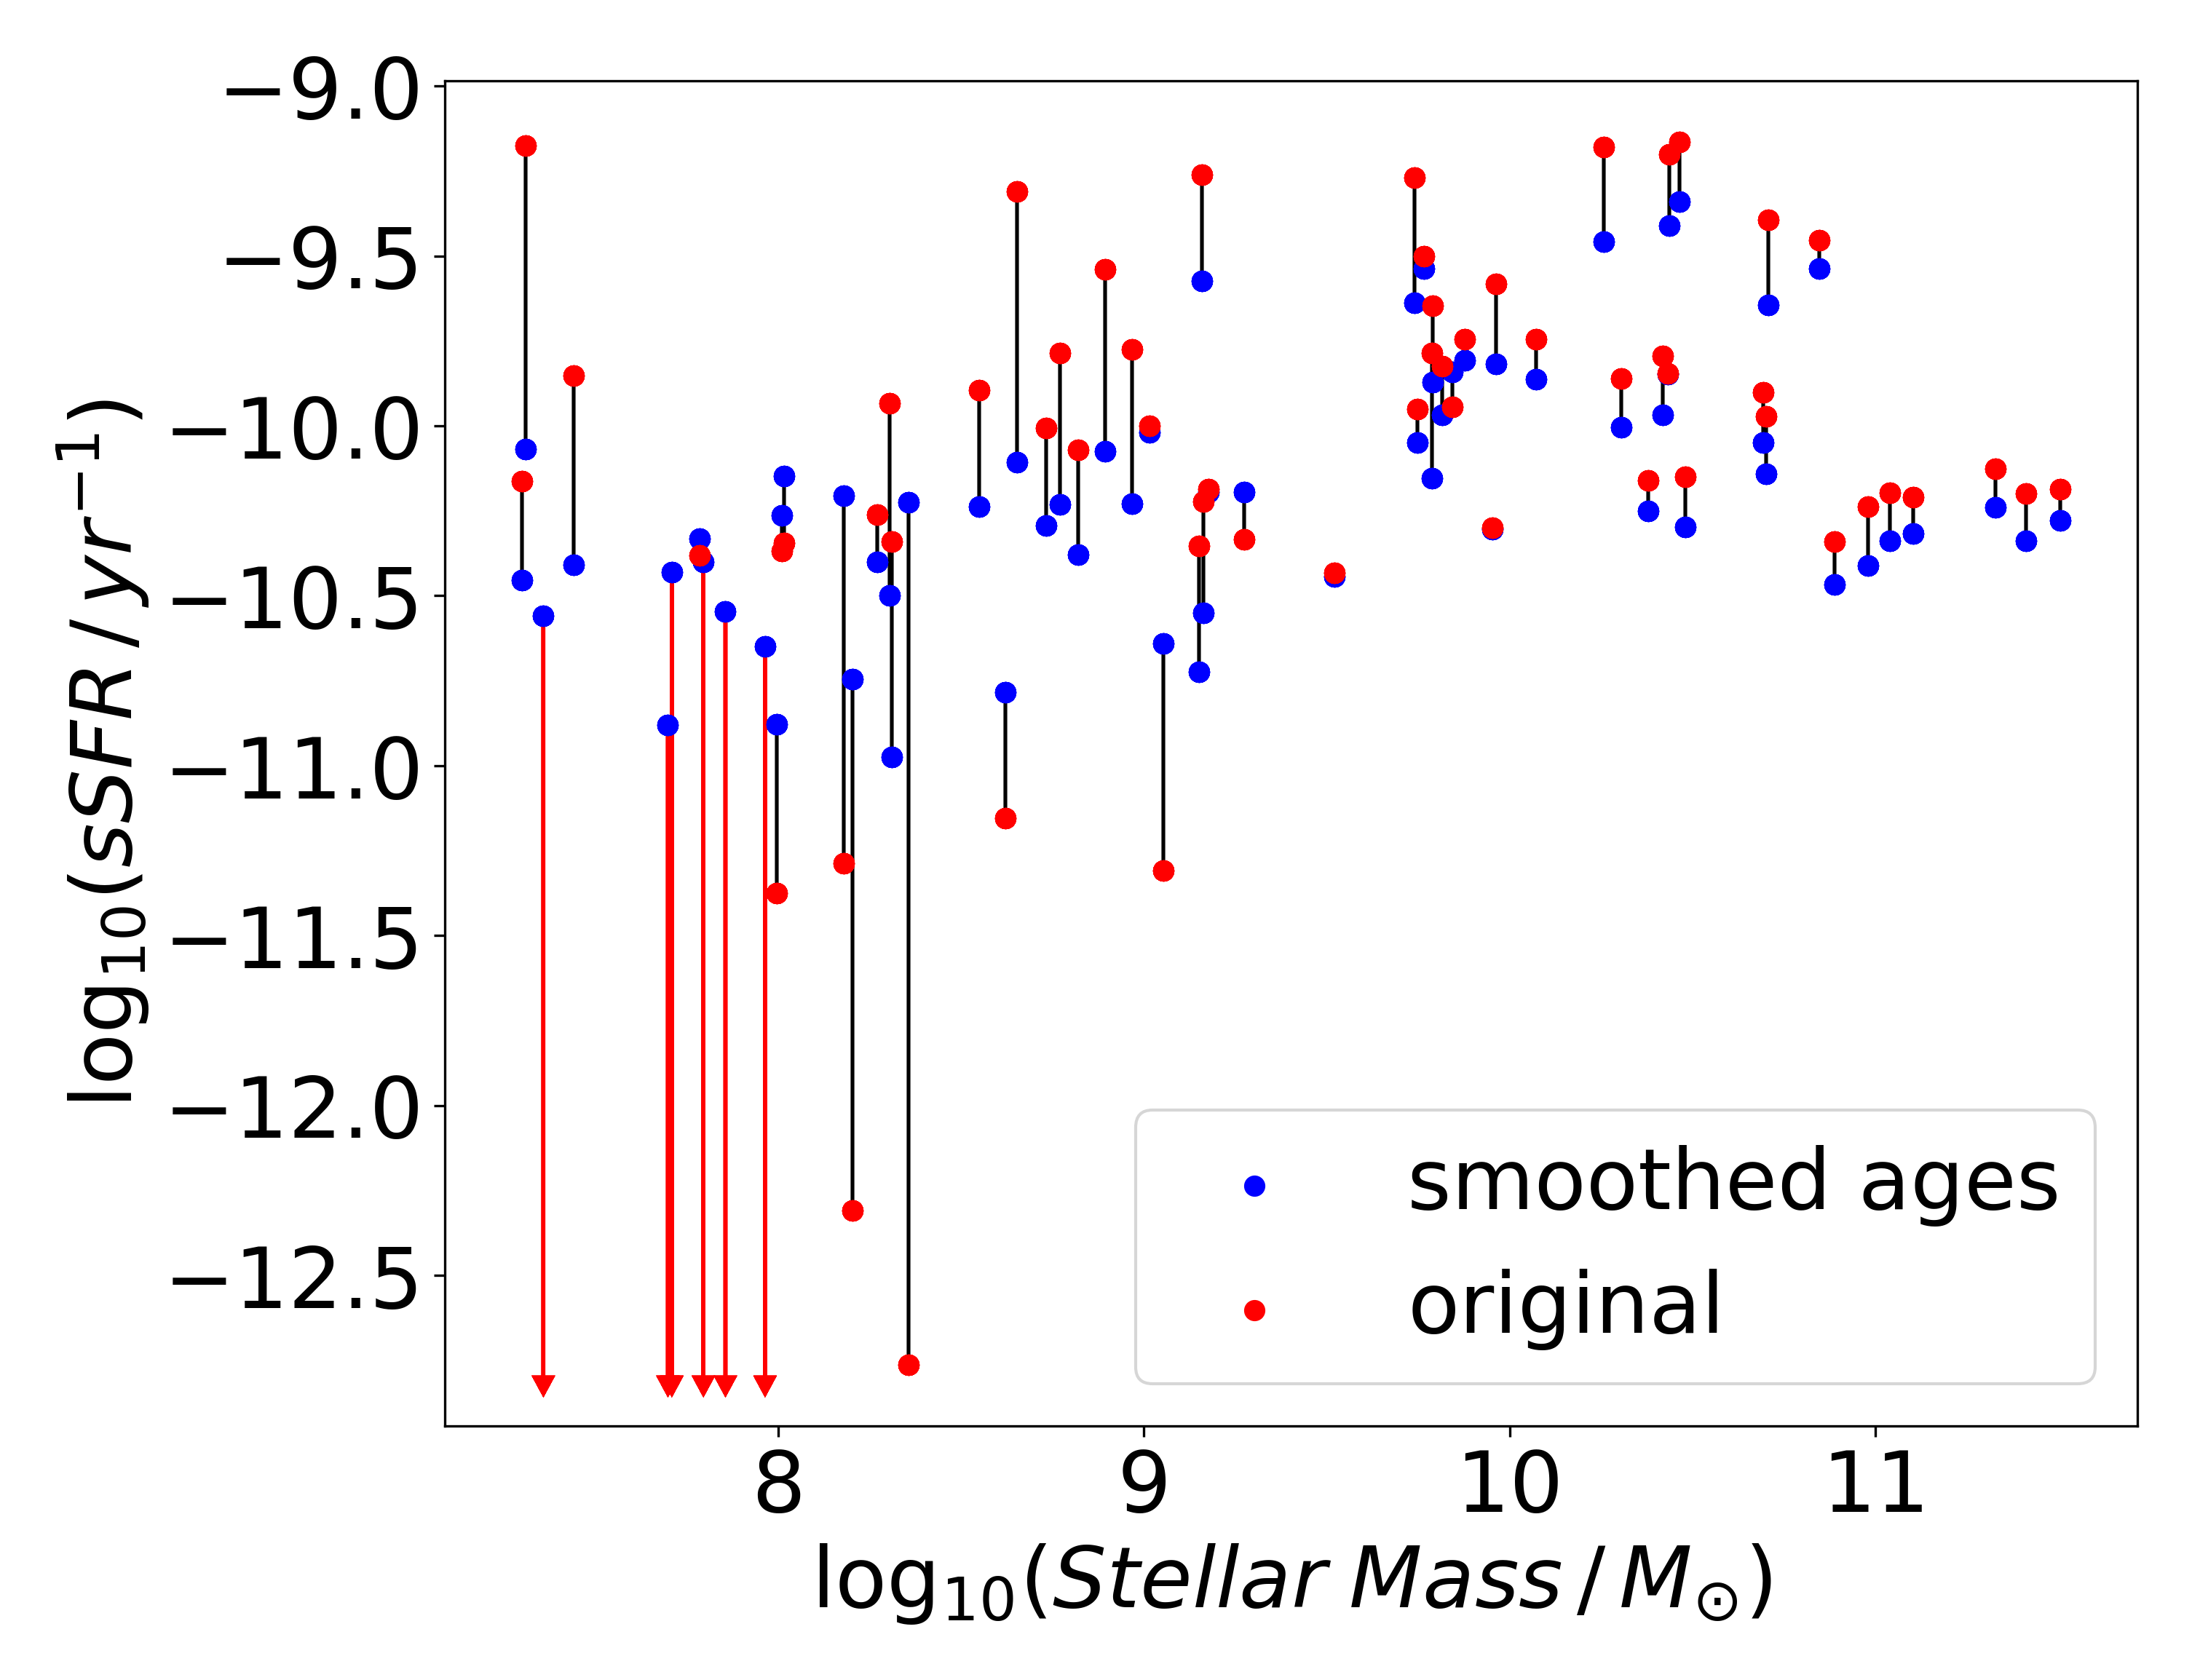
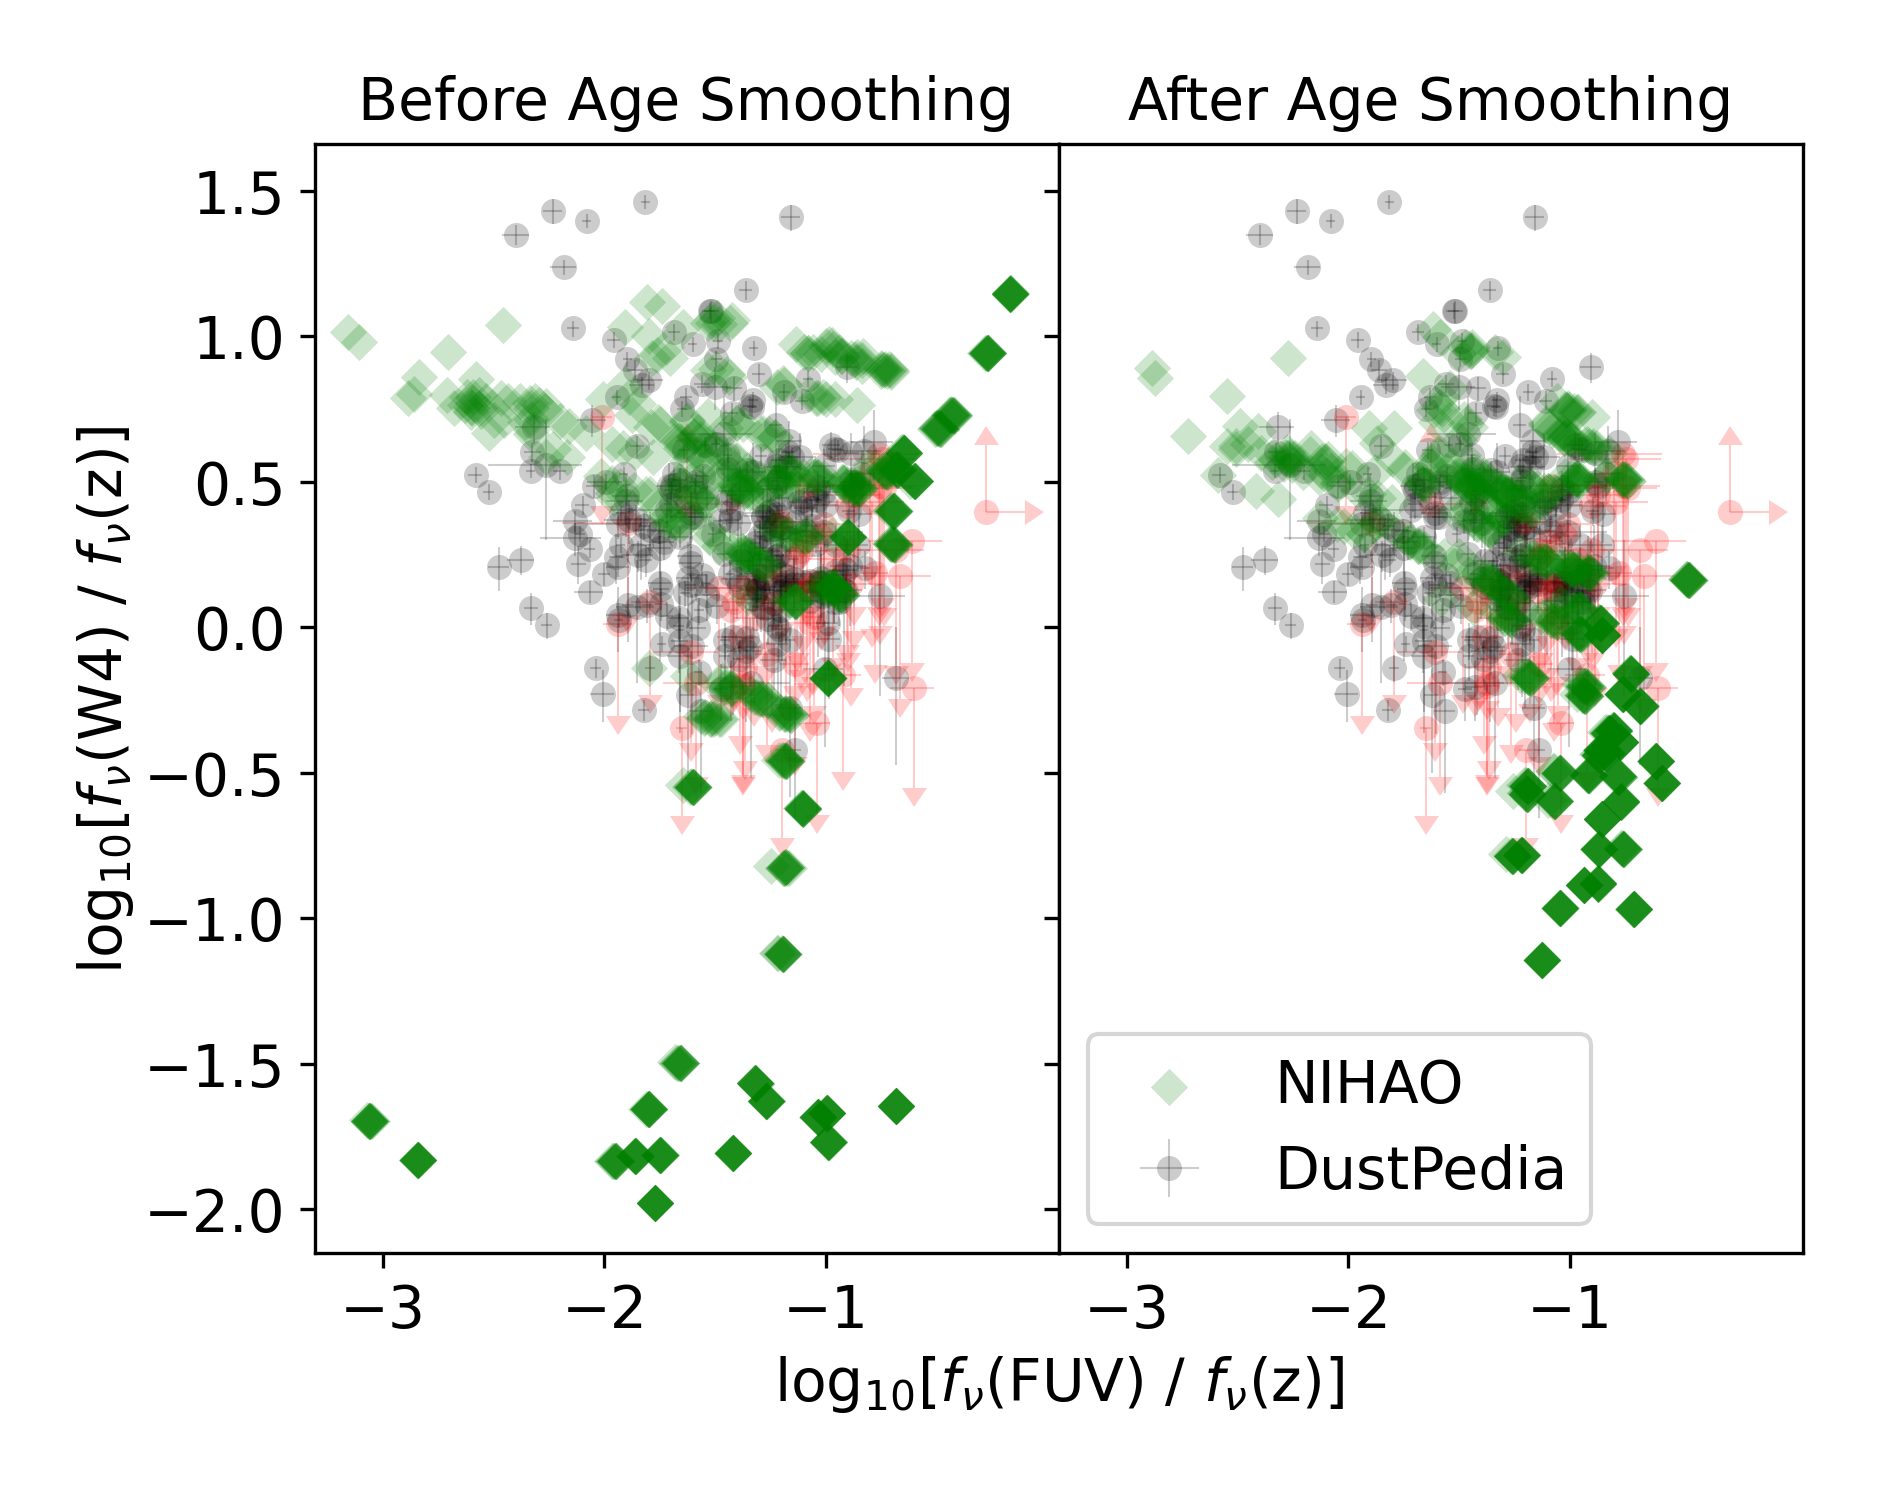
To mitigate this effect, we have developed and implemented a sub-grid recipe which effectively smooths out the simulated star-formation histories such that the typical difference in age between two neighboring (in the temporal sense) young star particles is less than Myr, the timescale on which these spectra show significant variation. To accomplish this, we replace each star particle with 50 new particles of equal mass (normalized to conserve total stellar mass) and with ages sampled from a normal distribution centered around the age of the parent particle. The standard deviation of the distribution is calculated as the larger of the two age differences between the parent particle and the younger and older neighbors, multiplied by a constant scaling parameter, . We also ensure that sampled particles have ages greater than and less than the age of the oldest parent particle by re-sampling any particles which do not meet these criteria. Through visual inspection of the smoothed SFHs, we found that and produce sufficiently high resolution distributions of young star particles while still retaining the characteristic features of the original SFHs (see Figure 2 for comparisons). The effect of this age smoothing procedure on the sSFR averaged over the last 100 Myrs is shown in Figure 3. We can see that most significant changes in sSFR occur in the lower mass galaxies. This is because these galaxies have fewer star particles, so when we only count star particles created in the last 100 Myrs, the scatter in the sSFR is dominated by the discreteness of the particles rather than physical effects within the simulation. Looking at Figure 4, we can see that the age smoothing procedure brings sSFR sensitive colors closer to the distribution of colors found in DustPedia.
For star particles younger than 10 Myrs, we also need to account for the absorption and emission by dust within photo-disassociation regions (PDRs) that result from the remaining birth clouds of newly formed stars. Because these regions are below the spatial resolution of the simulations, we adopt the commonly used method (Groves et al., 2008; Jonsson et al., 2010; Hayward & Smith, 2015; Trayford et al., 2017; Trčka et al., 2020; Kapoor et al., 2021) of assigning SEDs from MAPPINGS-III that already include the effects of photoionization and obscuration within these dense molecular clouds. The underlying stellar SEDs used in these calculations are from Starburst99 (Leitherer et al., 1999). The emergent SED spectra are characterized by age, metallicity, ISM pressure, and the PDR covering fraction. Age and metallicity are properties of the star particles in NIHAO. Following Kapoor et al. (2021), we stochastically sample compactness parameters, a measure of the density of regions, from the log-normal distribution with log C = 5 and a standard deviation of 0.4. We then calculate ISM pressures for each sampled compactness parameter using Equation 13 from Groves et al. (2008). The PDR covering fraction is calculated for each particle using the equation where is the age of the particle and is a free parameter of our model. We also introduce “ghost” gas particles with negative mass equal to 10 times the stellar mass of the parent particle to avoid double counting the dust in these regions, following Trayford et al. (2017).
We will produce “dust-free” spectra by excluding the interstellar dust associated
with simulation gas particles described in the next subsection. We produce
these spectra in order to calculate attenuation curves. However,
as noted in Figure 1, in the Groves et al. (2008) models for young
stellar particles there is some dust attenuation and IR emission, even when .
Because we only use the dust-free spectra to calculate attenuation, as
long as the attenuation internal to the young stellar particles is small
enough we can safely ignore this effect.
In order to quantify this attenuated energy, we calculate the energy between
912 Å and 2 microns for FSPS particles (which are truly dust-free) with
100 ages evenly spaced between 0 and 10 Myrs, and one MAPPINGS-III particle (which assumes a constant SFR over the past 10 Myrs), both normalized to
. We use FSPS here instead of Starburst99, which is the underlying SSP used in the MAPPINGS-III star-forming particles, because the version of Starburst99 used in SKIRT also includes IR emission and therefore must also have some of its energy attenuated already. From these calculations, we find that
3.41% of the energy in the MAPPINGS-III particle spectra has been attenuated relative
to FSPS. Furthermore, since only a small fraction of the stellar mass is
contained in these star-forming particles, we conclude that this
sub-grid attenuation in the “dust-free” spectra is insignificant to the resulting attenuation curves.
3.3 Dust Model
Because the NIHAO simulations do not directly model the dust population, we assume that each gas particle contains a dust mass given by a fixed fraction, the dust-to-metal ratio, of its mass in metals. We constrain the dust-to-metal ratio, the second free parameter of our model, by comparing the resulting photometry to the DustPedia sample. We also assume that no dust is present in gas above a maximum temperature of although the results presented in this paper are insensitive to changes of to this temperature.
To perform radiative transfer calculations, we discretize space using an OctTree spatial grid which we subdivide until each grid cell contains at most one gas particle. This discretization procedure is overridden by parameters which set the minimum and maximum allowed refinement levels. We set the minimum level to 6 and the maximum to 99, the largest allowed value, so that we don’t override the one gas particle per cell discretization procedure. Although lowering the minimum level has only a small effect on the global photometry, we choose this value for the purpose of generating higher resolution images in the diffuse ISM. Once the spatial grid has been set, each cell is considered to be uniform in its optical properties.
We utilize the THEMIS dust model (Jones et al., 2017) in our radiative transfer calculations. Of particular importance to this work, this dust model attributes different extinction curves depending on the density in each cell of gas, reflecting the evolution of dust in response to the physical conditions of the ISM, with more aggregated grains residing in denser regions. Rather than being tuned to fit astronomical observations, the dust optical properties in this model are determined from laboratory measurements of cosmic dust analogues. This model considers a two component dust population consisting of amorphous silicates and amorphous hydrocarbons. The silicate grains, which are half amorphous enstatite and half amorphous forsterite by mass, are assumed to follow a log-normal size distribution while the hydrocarbon grains are assumed to follow a combination of log-normal and power-law distributions. We use 15 size bins for both the silicate and the hydrocarbon populations, each of which is heated stochastically by the local radiation field as described in Camps et al. (2015). Relative to assuming local thermal equilibrium, the stochastic heating of grains has the effect of widening the distribution of dust temperatures since smaller grains will have higher temperatures and larger grains will have lower temperatures for a given radiation field.
4 Axis Ratios
In order to find viewing orientations that span the range of each galaxy’s axis ratios in an efficient way, we run separate radiative transfer simulations that only include star particles (no dust) and only store the -band fluxes, denoted here as , spatially resolved in 250250 pixels. For each simulated galaxy, the SKIRT parameter file is populated with 500 instruments with inclination and azimuth angles sampled uniformly on a sphere (the roll angle rotates along the line of sight and thus doesn’t affect axis ratios).
To calculate axis ratios for each orientation, we used a method based on flux-weighted moments of the dust free image. Since galaxies do not have purely elliptical profiles, the axis ratio is not a perfectly well-defined quantity. We are interested in the axis ratio of the disk, not the bar or bulge or the stellar halo, and have adjusted the flux weighting technique to be most sensitive to the disk region.
We first find the center of each image by taking the average position of the 50 brightest pixels. We then use the value of the brightest pixel as the maximum allowed flux value; all larger fluxes are set to this value so that they don’t dominate the fits. After normalizing the fluxes such that the maximum value is unity, we set all pixels with normalized fluxes value less than 0.01 to 0 to avoid fitting to the galactic outskirts. Next we scale the normalized pixel fluxes using so that the fits are sensitive to the light coming from disks, not only the brightest regions. Finally, we mask out pixels whose distance is less than 7 pixels away from the center () to keep pixels with small radii from dominating the fits.
Then we calculate the second moments of the adjusted fluxes, converting them to position angles and axis ratios using the method described by Lupton (1996). The second moments are:
| (1) | |||||
| (2) | |||||
| (3) |
In analogy to Stokes’ parameters for polarization, we define:
| (4) | |||||
| (5) |
Then the position angle and axis ratio can be written:
| (6) | |||||
| (7) |
The result of this analysis is a table of inclination and azimuth
angles and their corresponding axis ratios. From this table we select 10 orientations
for each galaxy which span its range of axis ratios as evenly as possible.
5 Validating Against Observed Galaxies
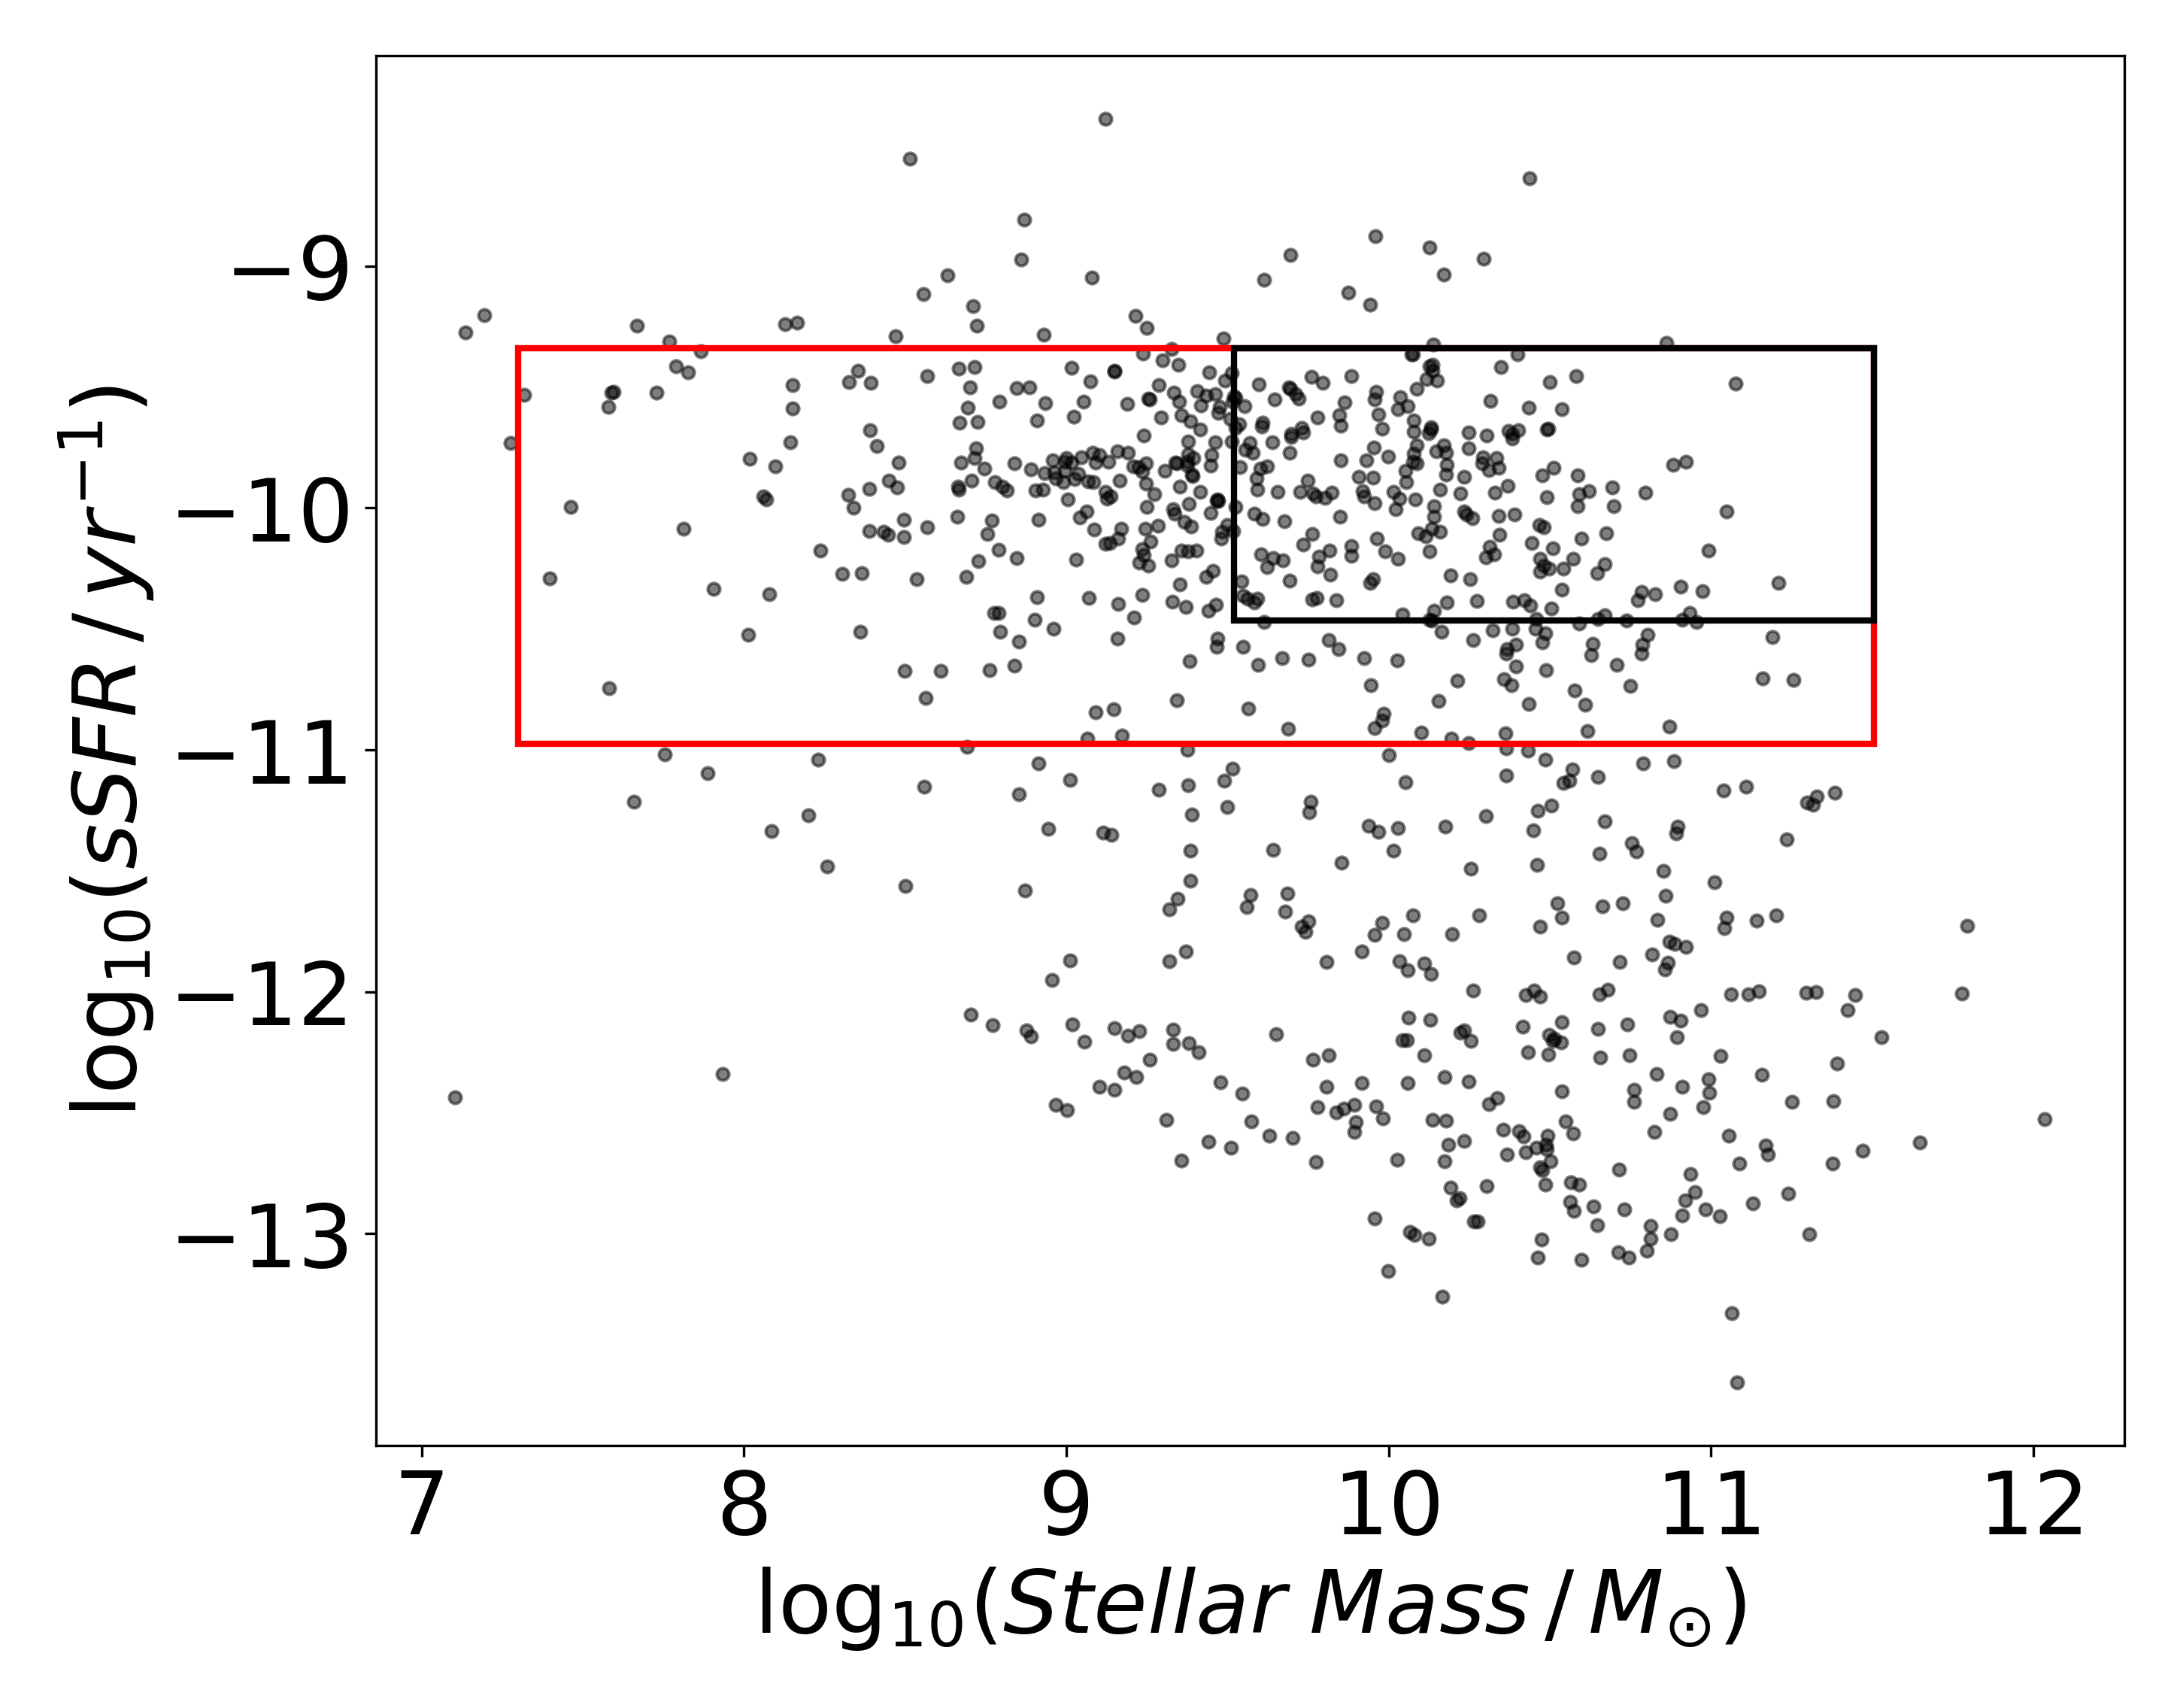
As mentioned in Section 3.2, we use the DustPedia sample (Davies et al., 2017) to validate our radiative transfer parameter choices. This sample includes mass and SFR estimates for each galaxy as inferred from CIGALE fits (Boquien et al., 2019). For the purpose of comparing these galaxies with the mock observations from the NIHAO sample, we exclude any simulated galaxy with a total stellar mass below . For all photometric comparisons presented in this work, we only include DustPedia galaxies with total stellar masses and sSFRs which fall within the range of the NIHAO galaxies being considered.
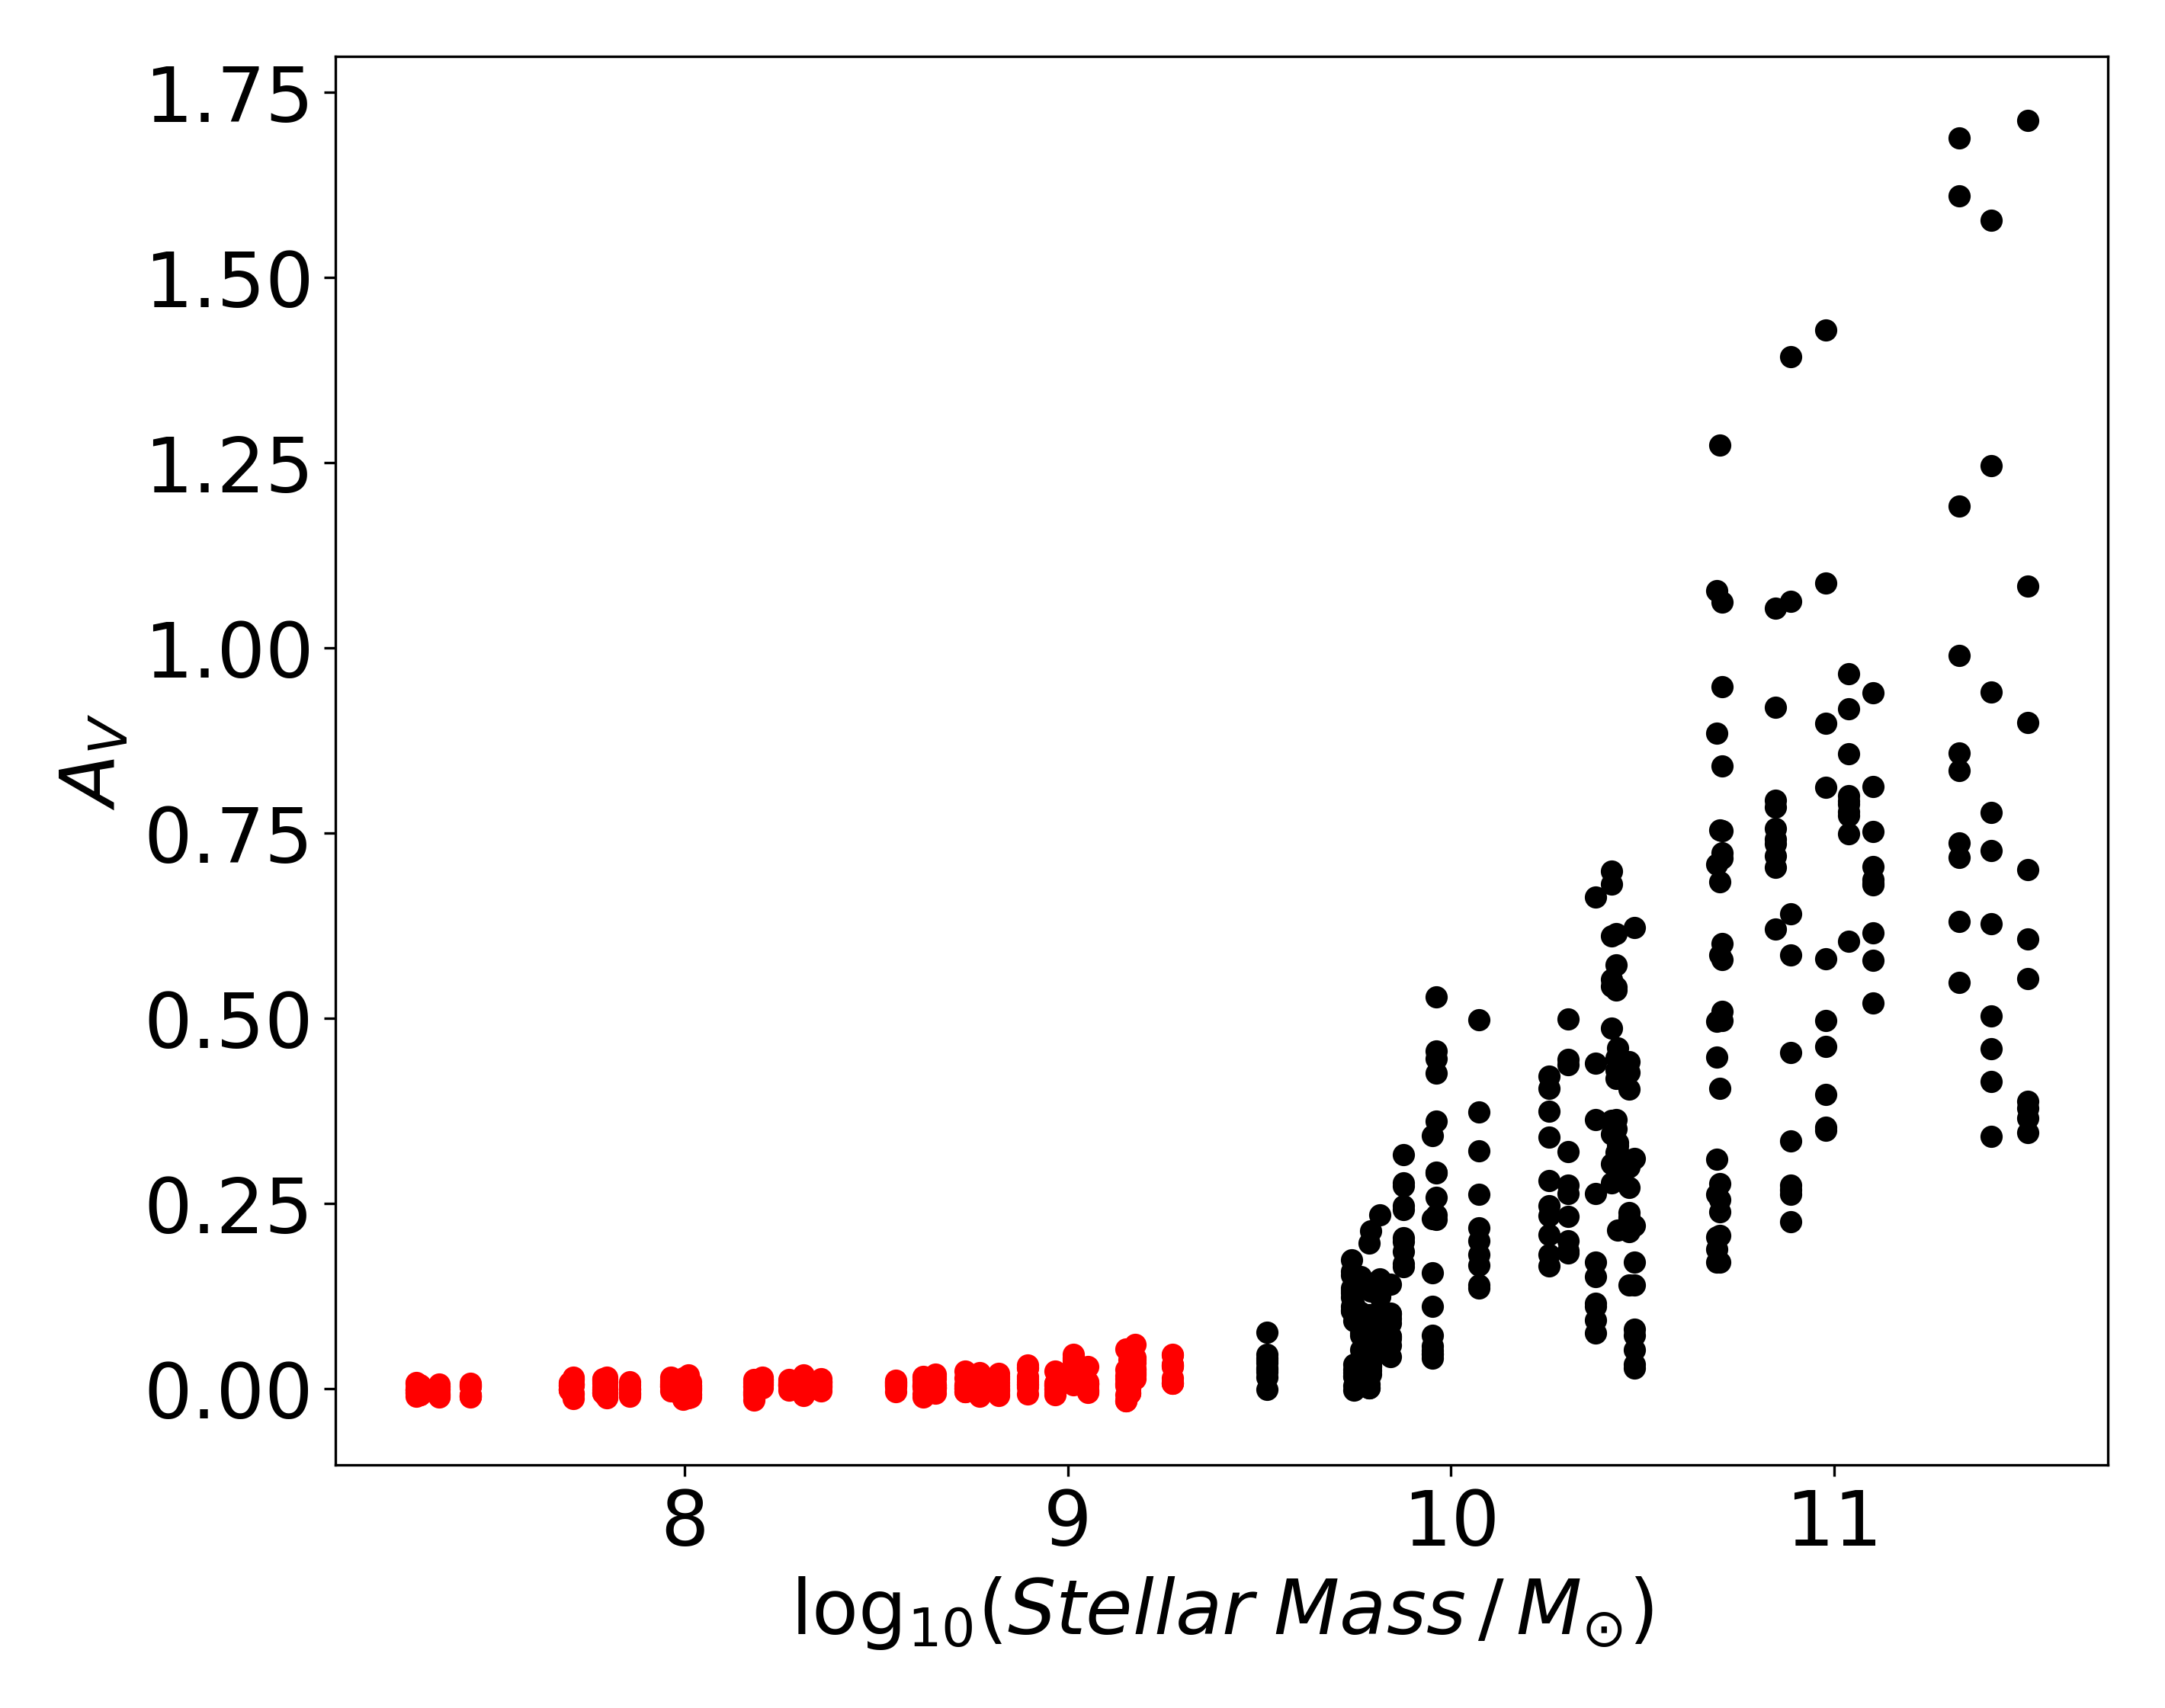
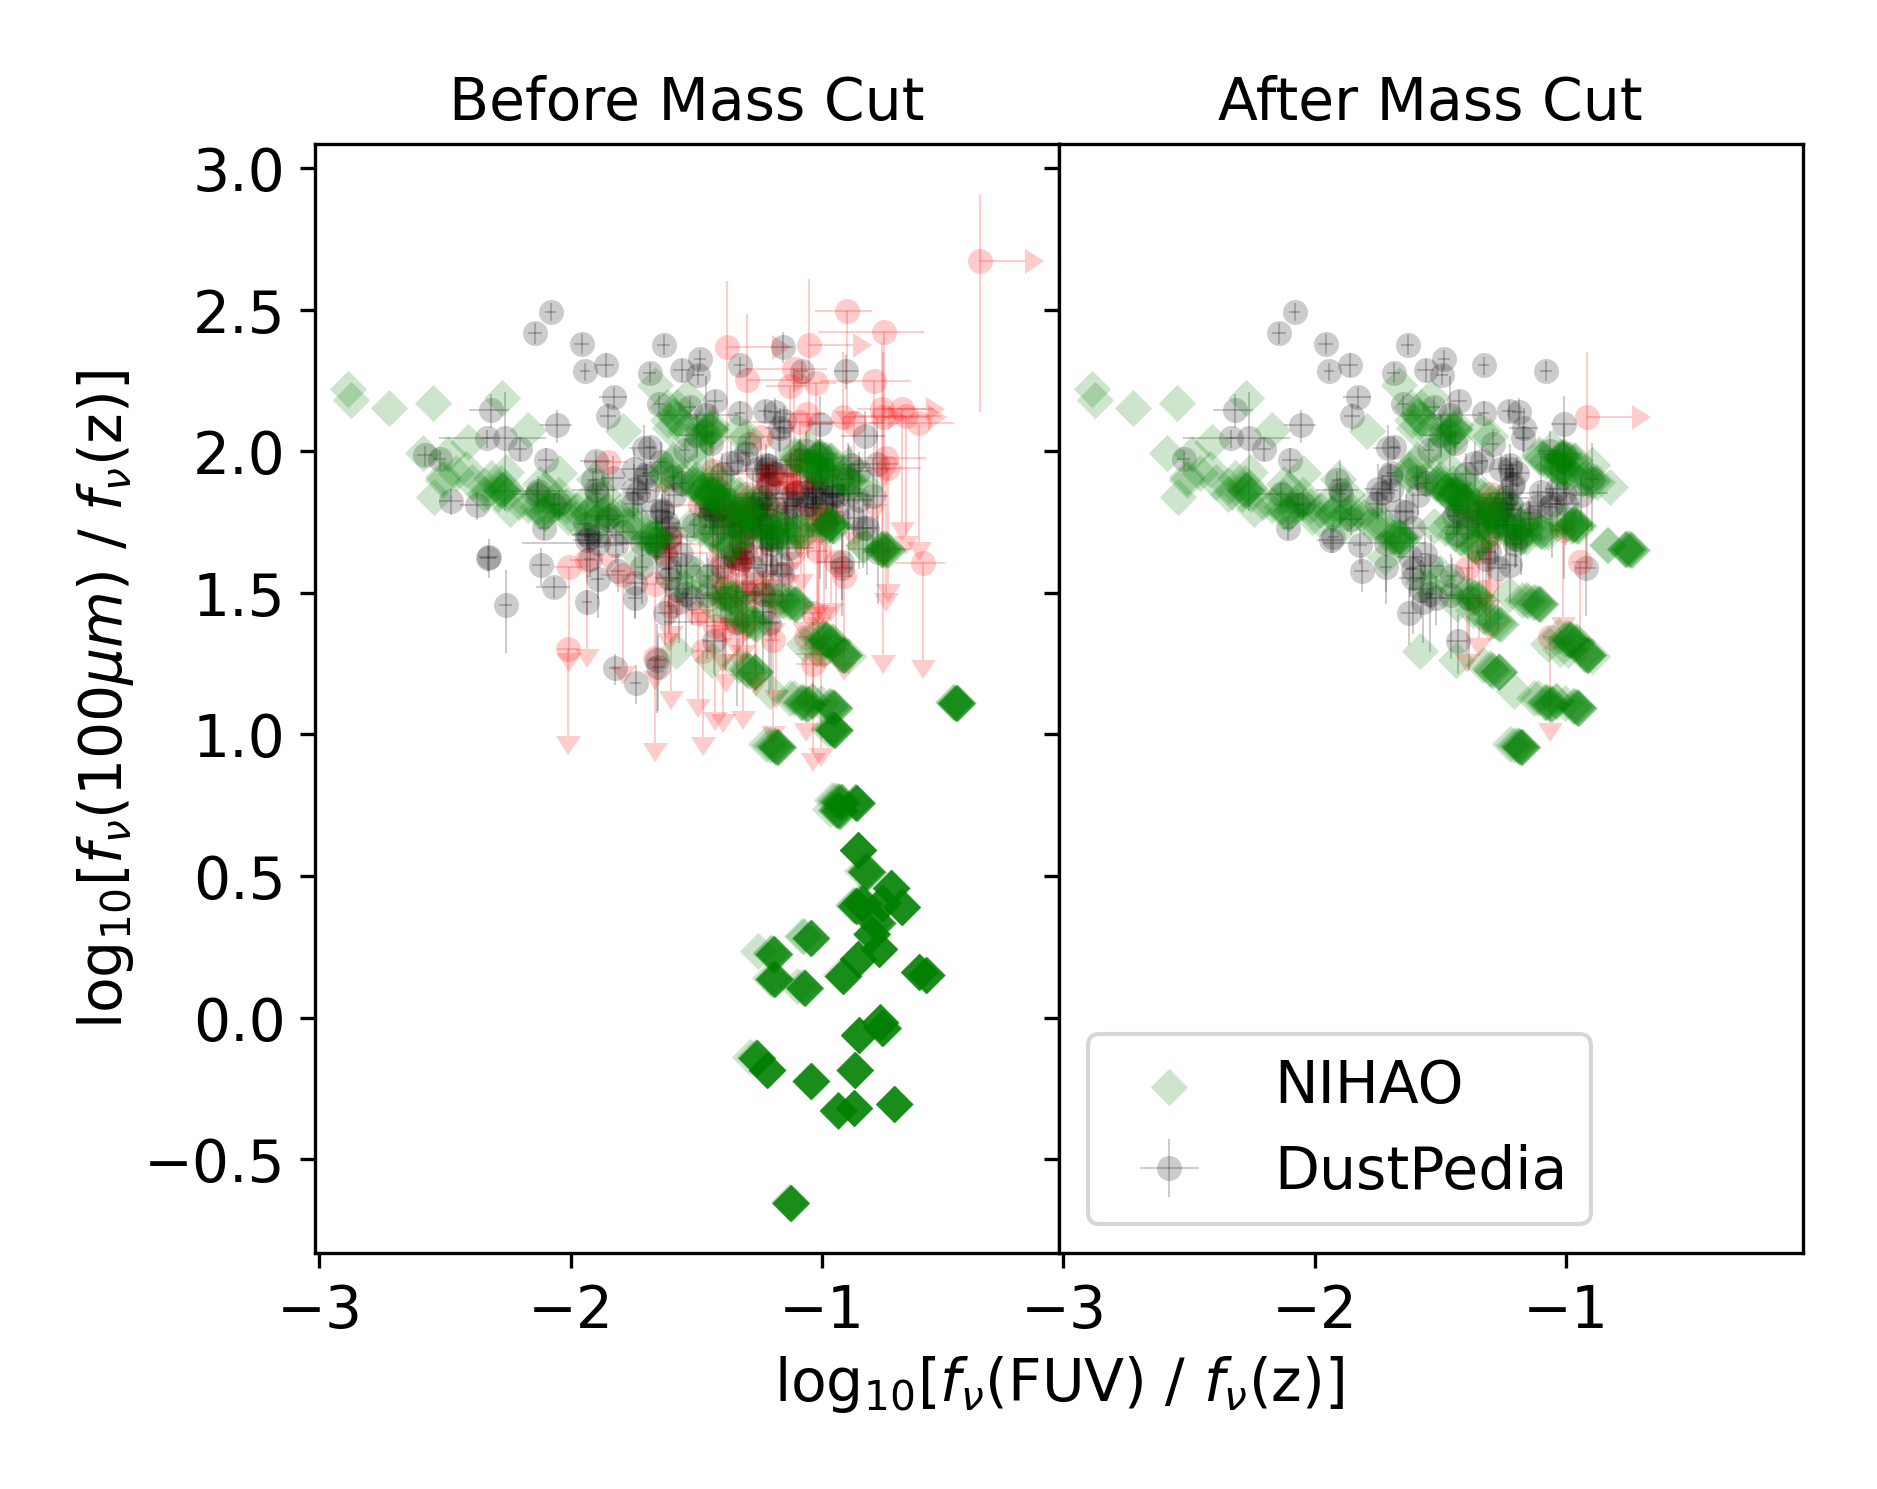
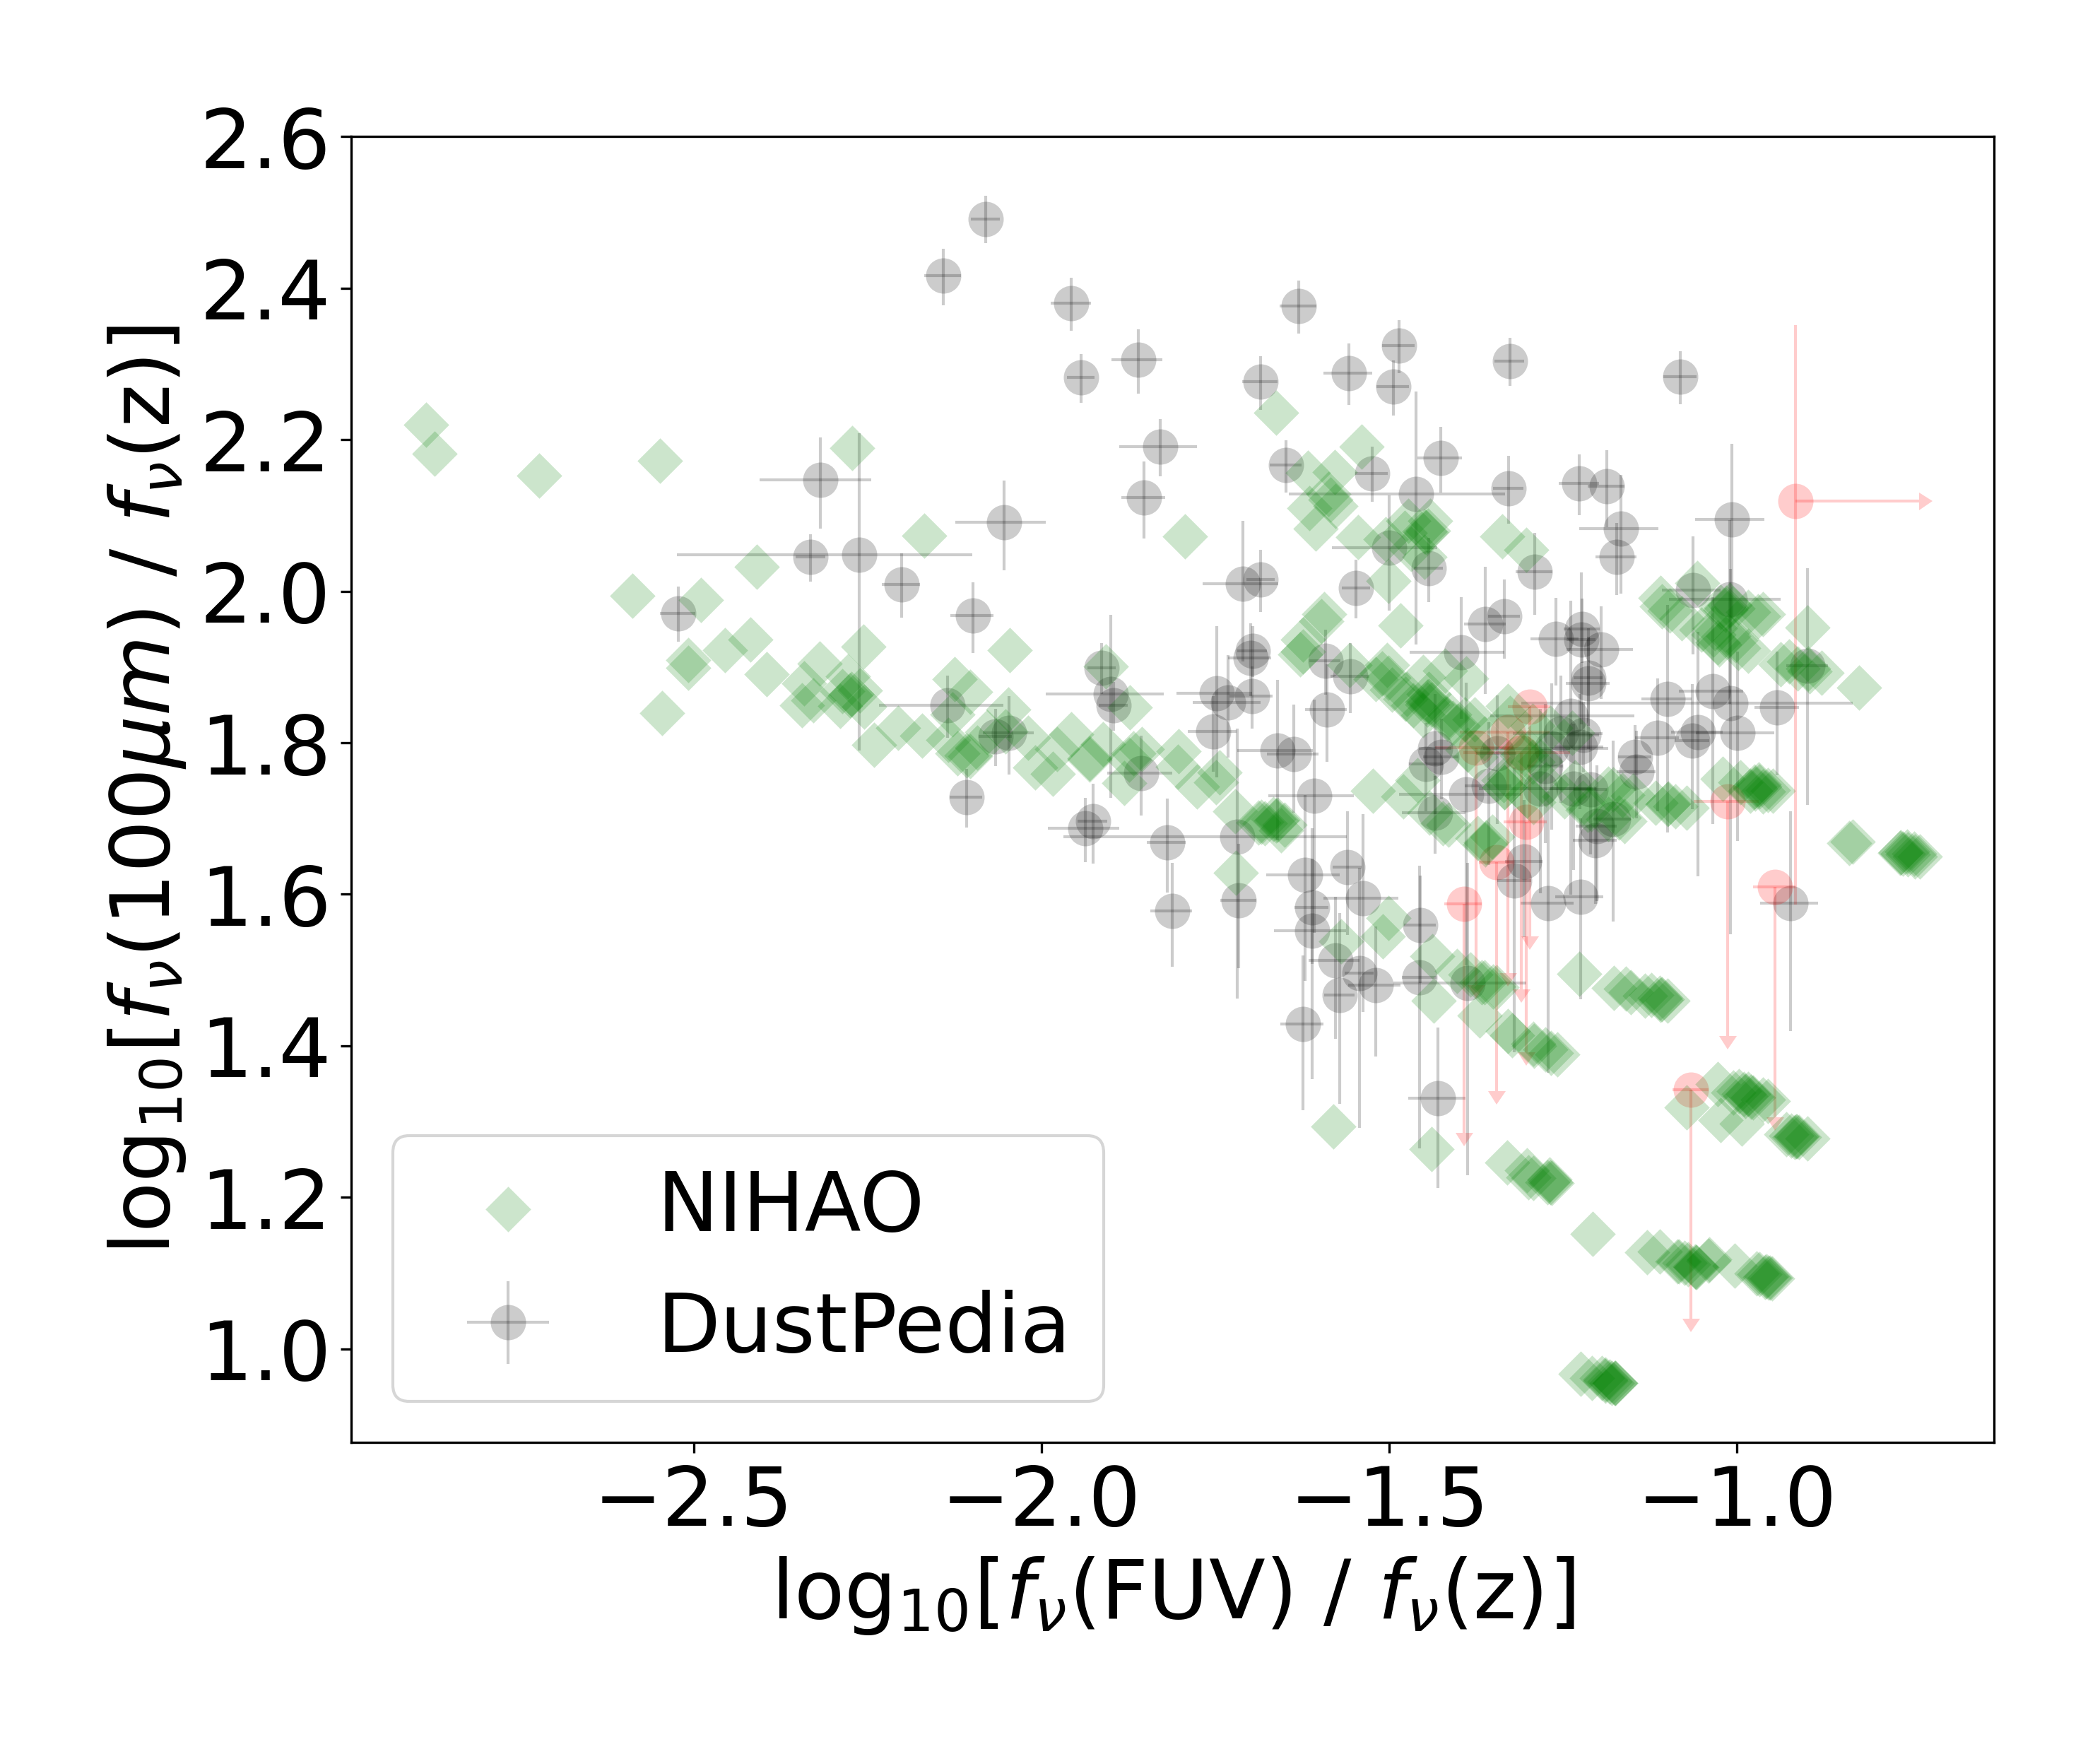
For the purpose of constraining our free model parameters, we only want to include DustPedia galaxies that are reliable in their FUV and IR photometry. Figure 5 shows the stellar masses and values, the difference between the attenuated and unattenuated V-band (Å) magnitudes, for all chosen orientations for all galaxies in our simulations. We can see a strong correlation between and stellar mass. In particular, we see that galaxies with stellar mass below experience very little attenuation regardless of axis ratio. These low value galaxies have a strong affect on dust-sensitive color-color plots. Figure 6 shows the distributions of vs. colors for DustPedia and NIHAO galaxies. The left panel shows both full samples, and the right panel shows the samples limited to galaxies with total stellar mass above . Red points represent DustPedia galaxies with one or more photometric fluxes that are consistent with zero at 2, and are plotted as upper or lower limits. Note that each plot only contains DustPedia galaxies that fall within the sSFR and stellar mass ranges of the corresponding NIHAO set. We can see from this figure that DustPedia galaxies which fall within the total stellar mass and sSFR ranges of the low mass NIHAO galaxies, but not the higher mass NIHAO galaxies, tend to only give upper limits on the colors. Because of this, these low mass NIHAO galaxies will not be useful in constraining our free model parameters. For the rest of this paper, unless otherwise stated, we will exclude NIHAO galaxies with from our analysis. See Figure 7 to see the distribution of inferred total stellar masses and sSFRs of the DustPedia galaxies, along with the NIHAO ranges before and after the exclusion of these low mass galaxies.
Given the radiative transfer model choices described above, there are two free parameters that need to be constrained by comparison to observations. The first is the dust-to-metal ratio, which acts as a scaling parameter for the amount of diffuse dust in the interstellar medium. The second is the birth cloud clearing time, which determines the covering fraction of sub-grid dust assumed to exist around the very youngest stellar populations as a function of their age.
By comparing color-color plots that are sensitive to the effects of dust between the DustPedia sample and our mock observations of the NIHAO galaxies, we can determine whether or not our parameter choices are producing realistic photometry. Whereas previous works (Camps et al., 2016; Trayford et al., 2017; Trčka et al., 2020; Kapoor et al., 2021) have tuned parameters to agree with observed color-color distributions, here we consider an additional constraint related to how galaxies’ colors depend on viewing angle (the effects measured by Maller et al. 2009, Masters et al. 2010, and Conroy et al. 2010). In particular, we perform separate linear fits to the dependence of and flux ratios on axis ratio for disk galaxies in NIHAO and DustPedia. The difference in slope of these fits between simulations and observations acts as a metric for determining the accuracy of our post-processing parameter space.
6 Results
In Section 6.1 we quantify how galaxy colors vary with axis ratio. In Section 6.2 we search the parameter space of our radiative transfer model and determine the parameters that best match observations. Once we have finalized our parameter choices, we present simulated galaxy images, color distributions, attenuation curves, and energy balance as a function of axis ratio (Sections 6.3, 6.4, 6.5, and 6.6).
6.1 Axis Ratio Color Plots
In this section, we determine the dependence of and flux ratios on axis ratio for DustPedia disk galaxies and NIHAO disk galaxies. For NIHAO galaxies, we define a disk galaxy as one whose minimum axis ratio across the sampled orientations is less than . For DustPedia, we use the morphological classifications included with the data and consider any numerical Hubble stage which is greater than or equal to 0 to be a disk galaxy. Qualitatively, we expect and colors to increase with increasing axis ratio, because the light emitted from stars will on average need to travel through more dust as our line of sight becomes more edge-on.
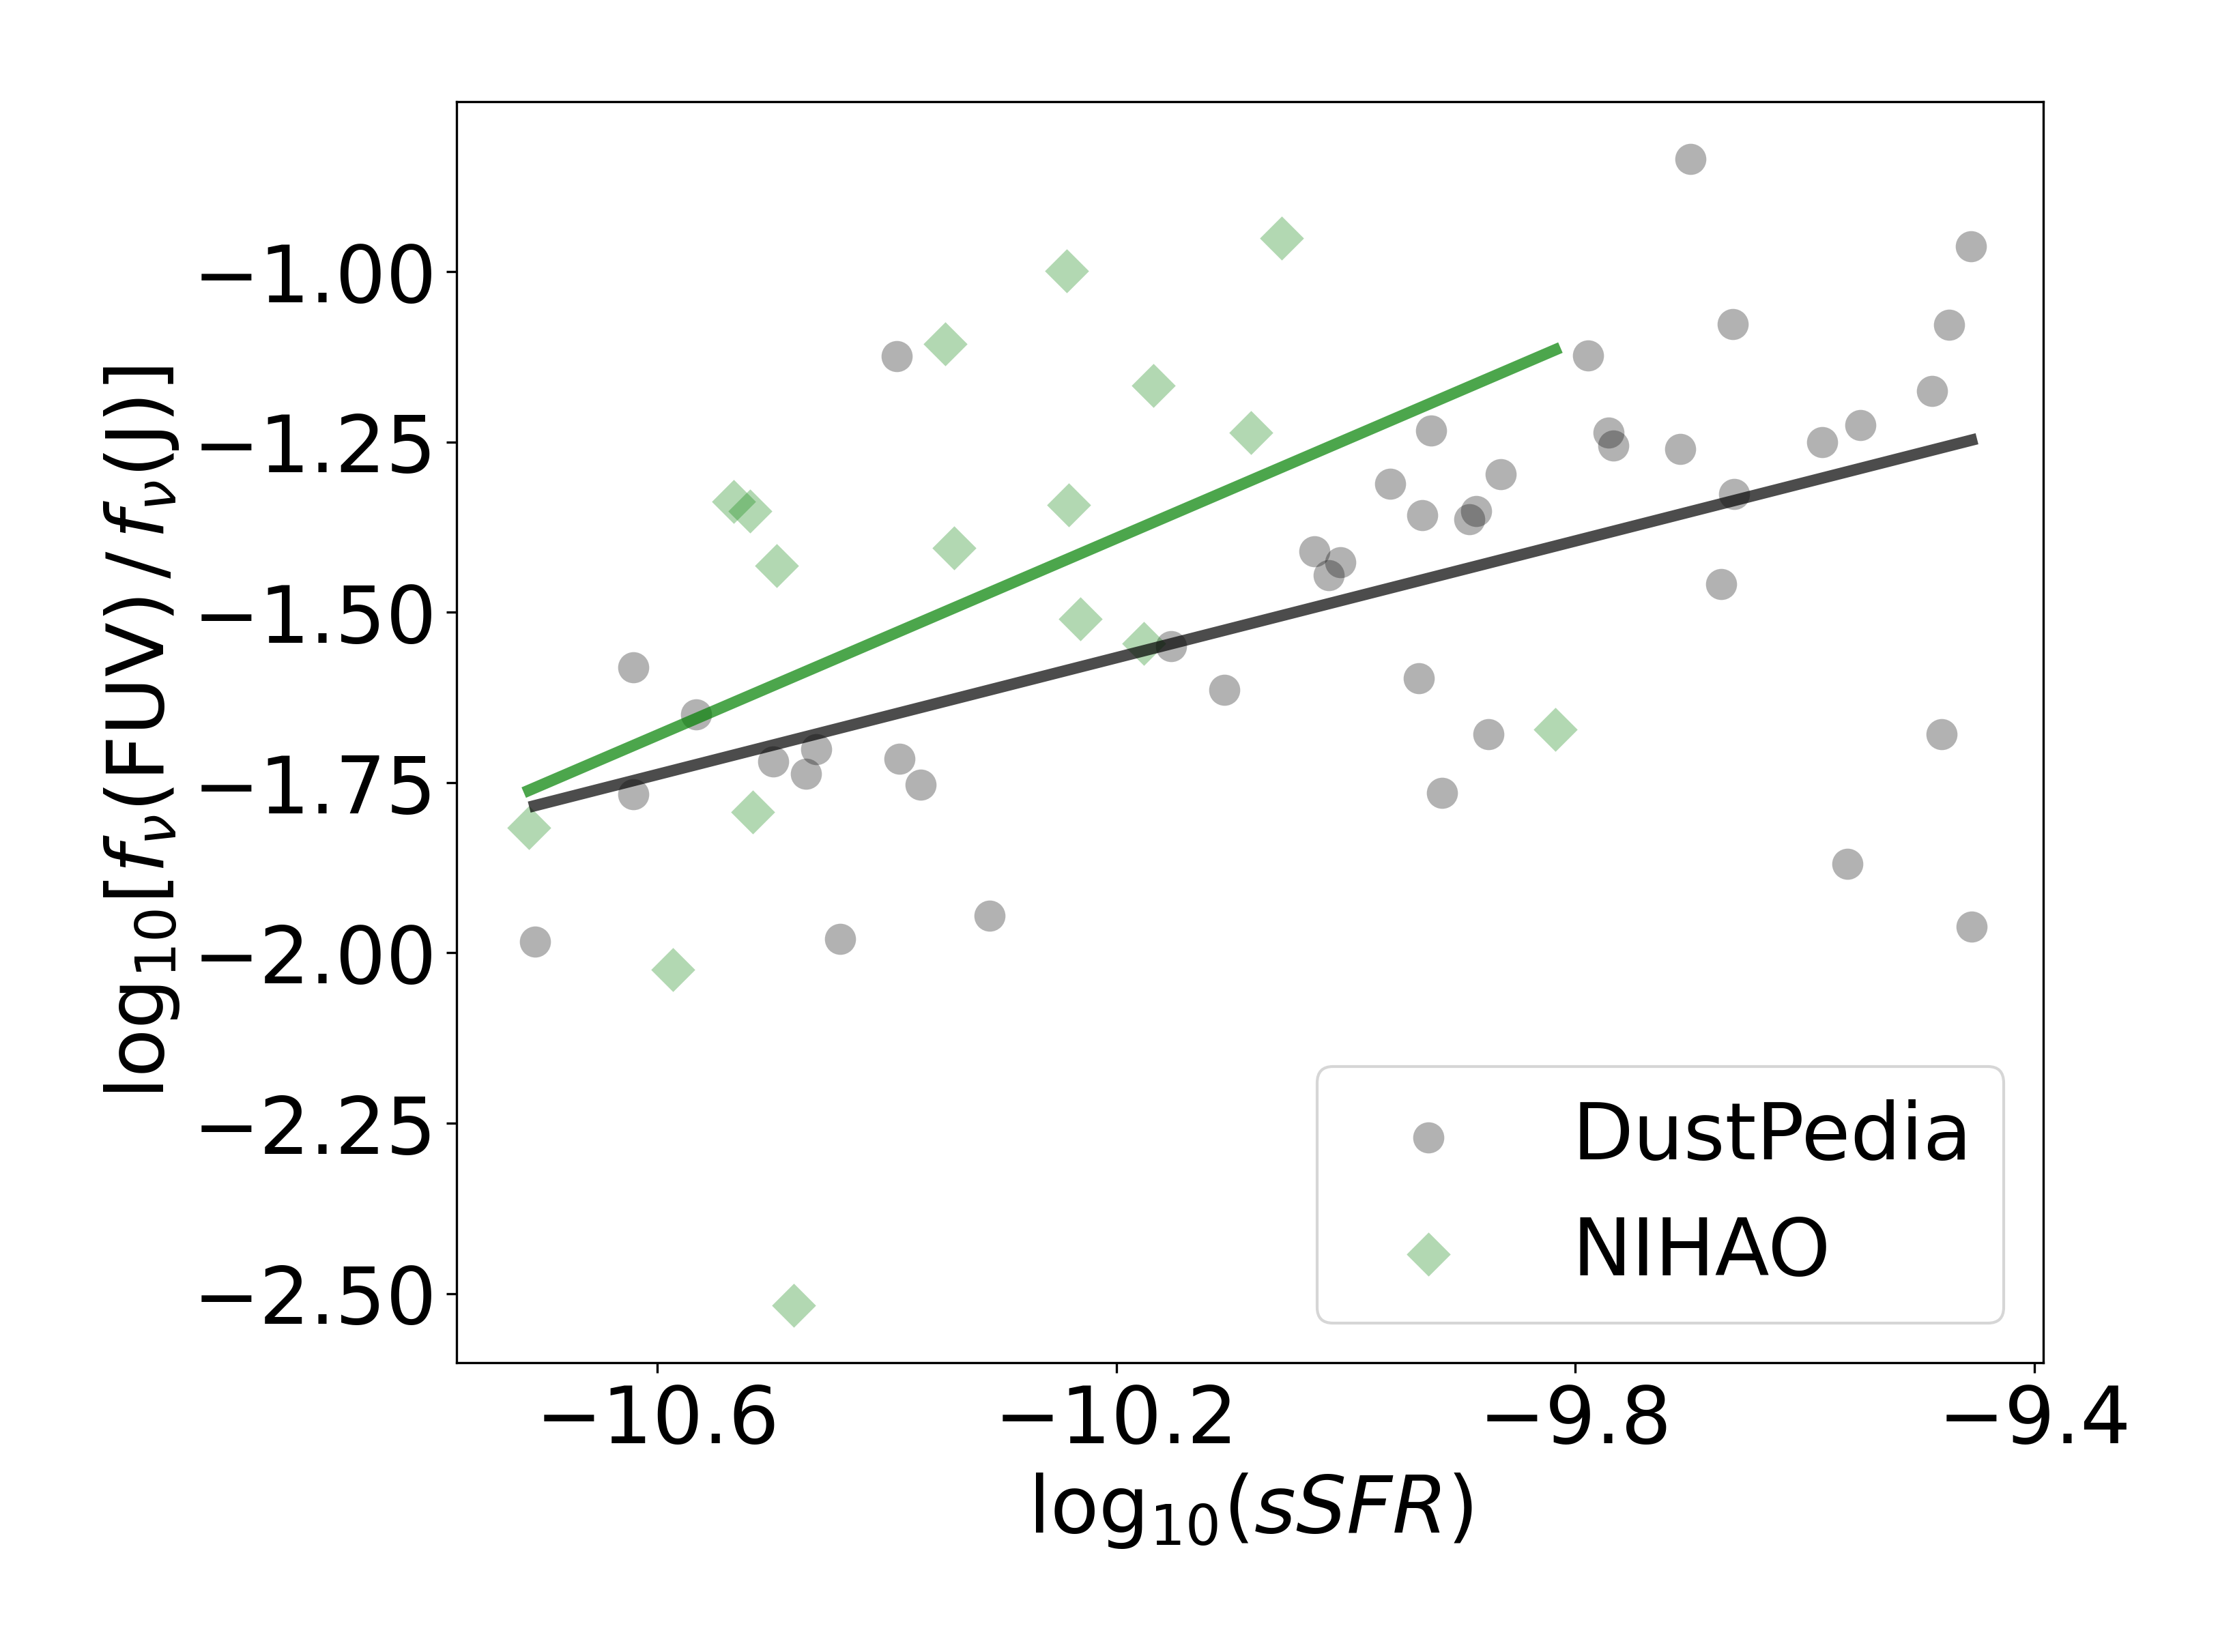
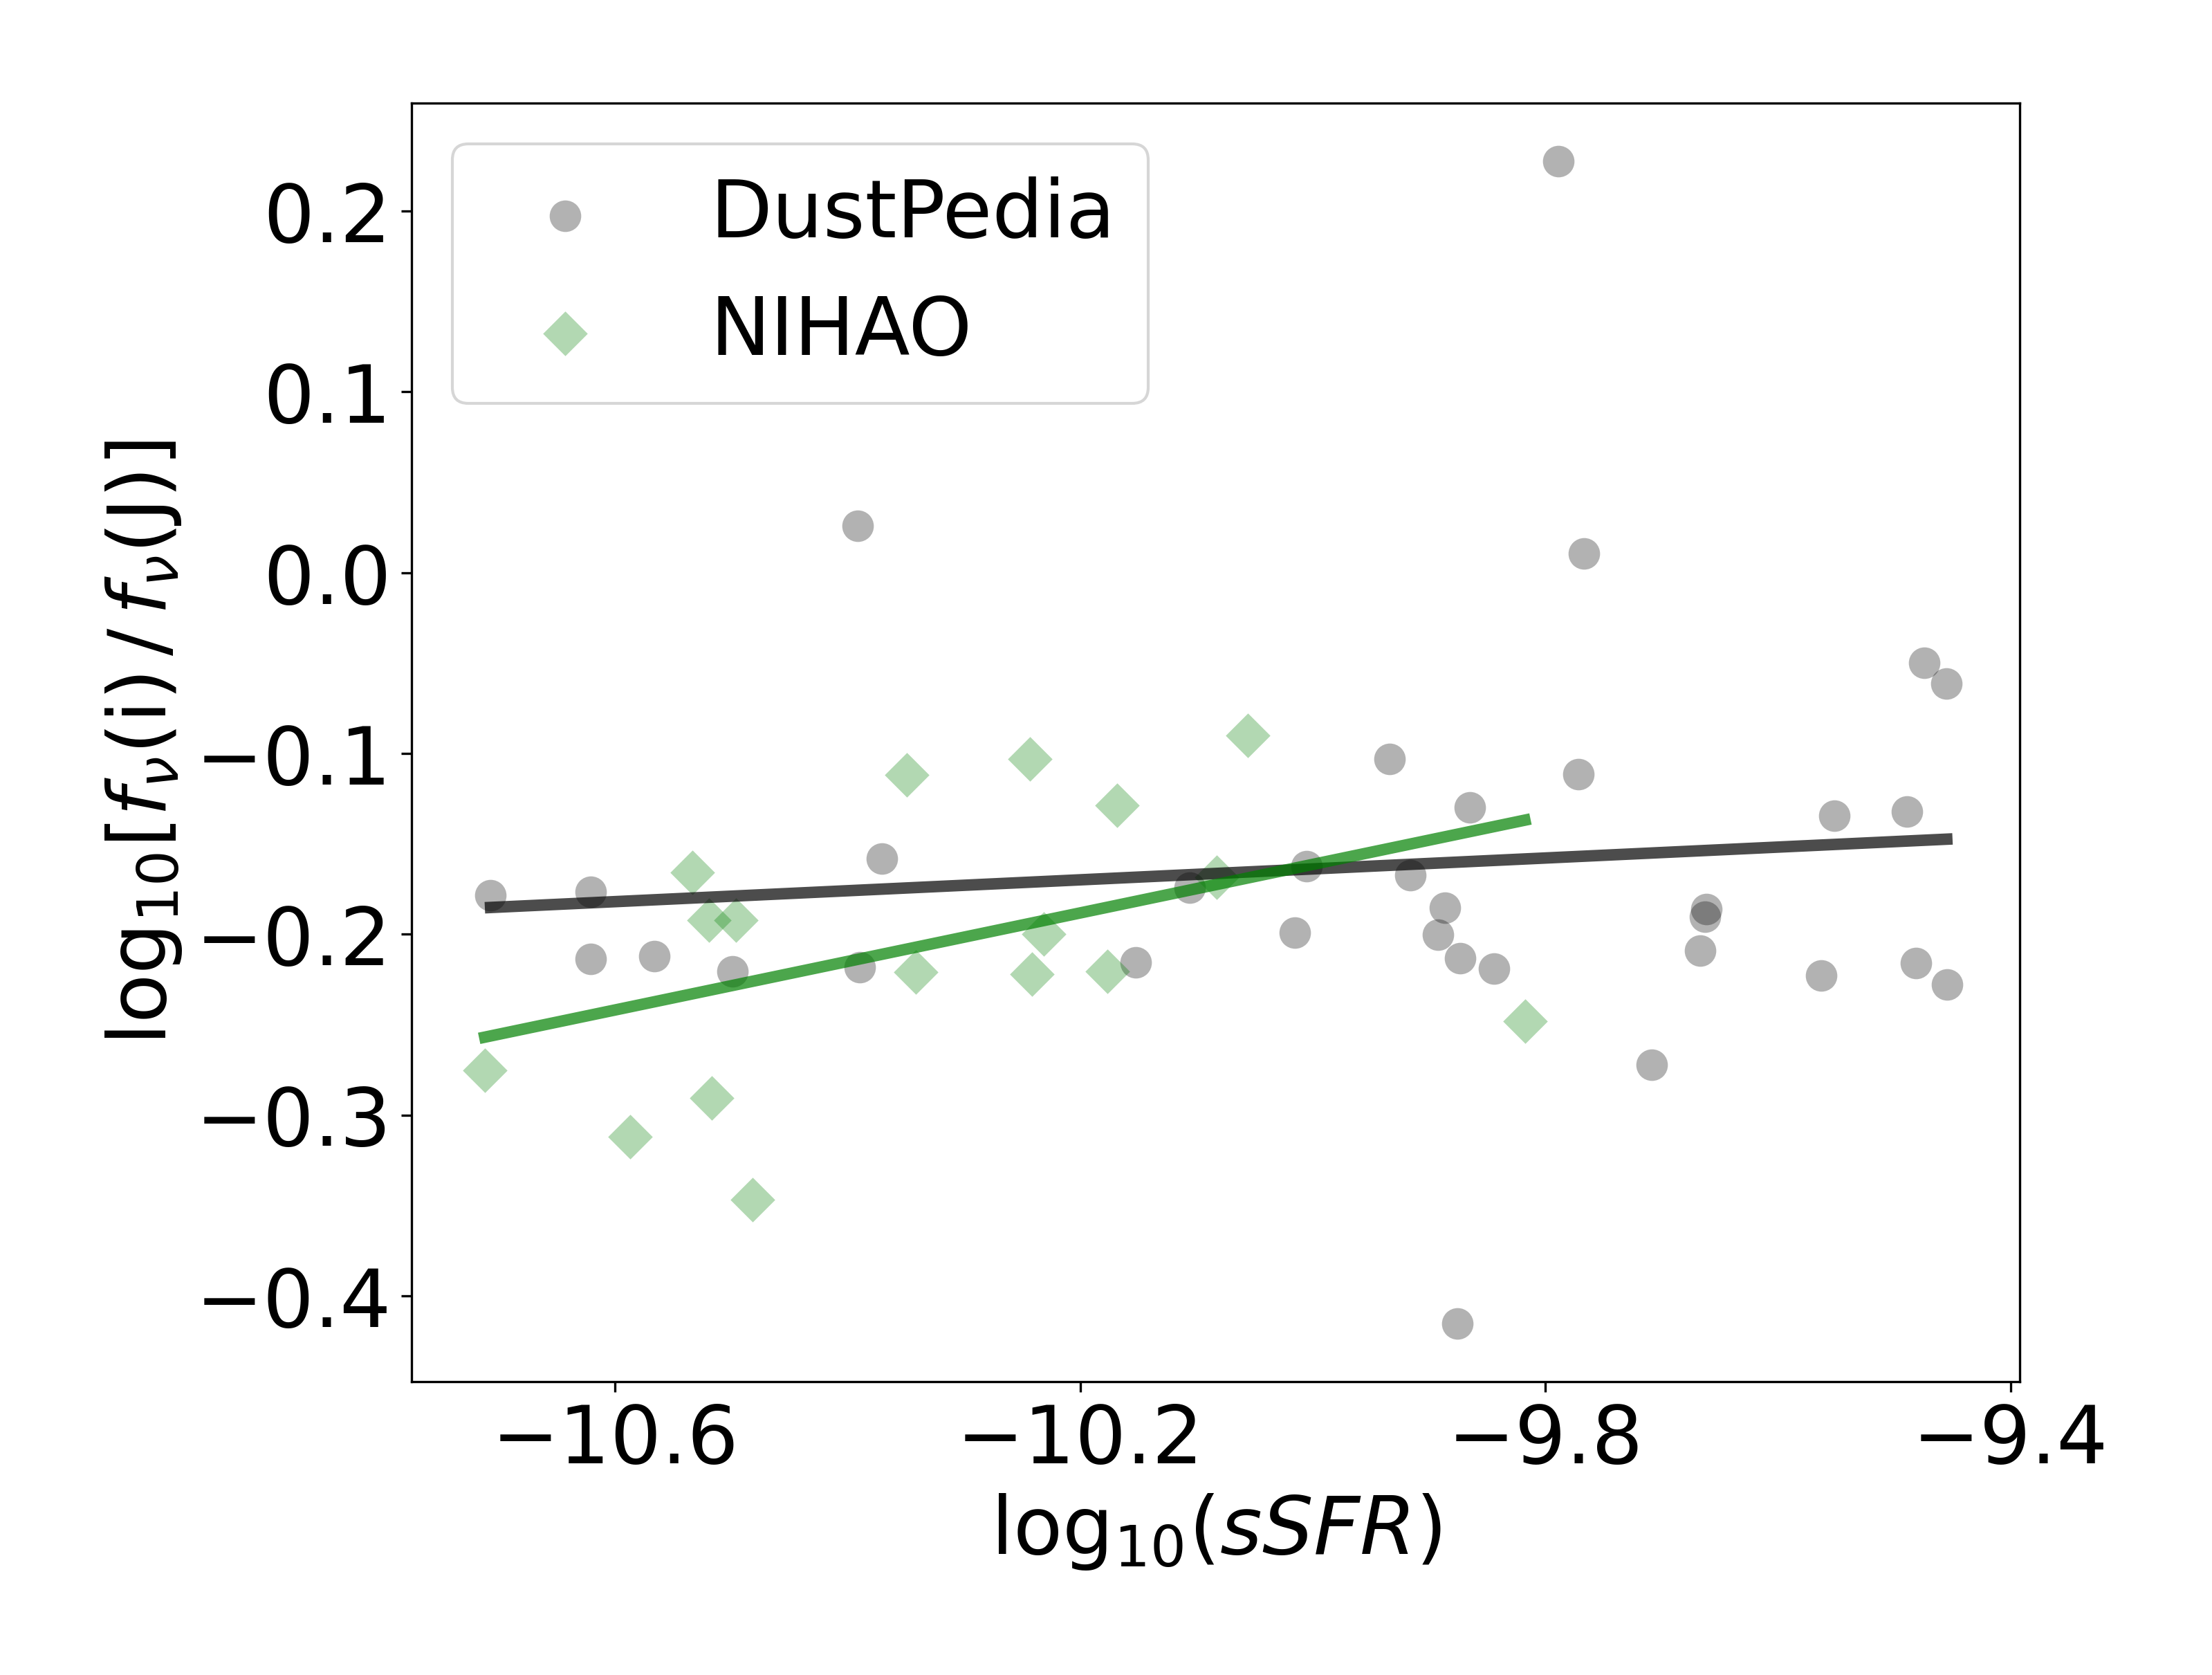
To make this comparison concrete, we consider how each galaxy’s colors vary with axis ratio relative to its expected face-on color. For the simulated galaxies, we can actually just orient our system to see what the face-on colors of any given galaxy are, but for galaxies in the real universe we cannot do this. For real galaxies, we use the sSFRs measured for the DustPedia face-on galaxies to establish a relationship between measured sSFR and face-on colors; we then use this relationship for all DustPedia galaxies to infer what the face-on color would have been. We use sSFR because it is an inferred intrinsic property of the galaxy—intrinsic in the sense that it should not depend on axis ratio—that relates relative closely to the flux ratios. This procedure assumes that inferences from the DustPedia CIGALE fits do not depend on axis ratio,
Figure 8 shows the colors and sSFRs of DustPedia face-on disk galaxies and NIHAO face-on disk galaxies (the latter under the free parameter choices of Myrs and ). We perform a linear regression of on in each sample. This fit allows us to estimate the face-on color of any disk galaxies in either sample based on its sSFR. We then define each galaxy’s color residuals relative to these inferred face-on colors.
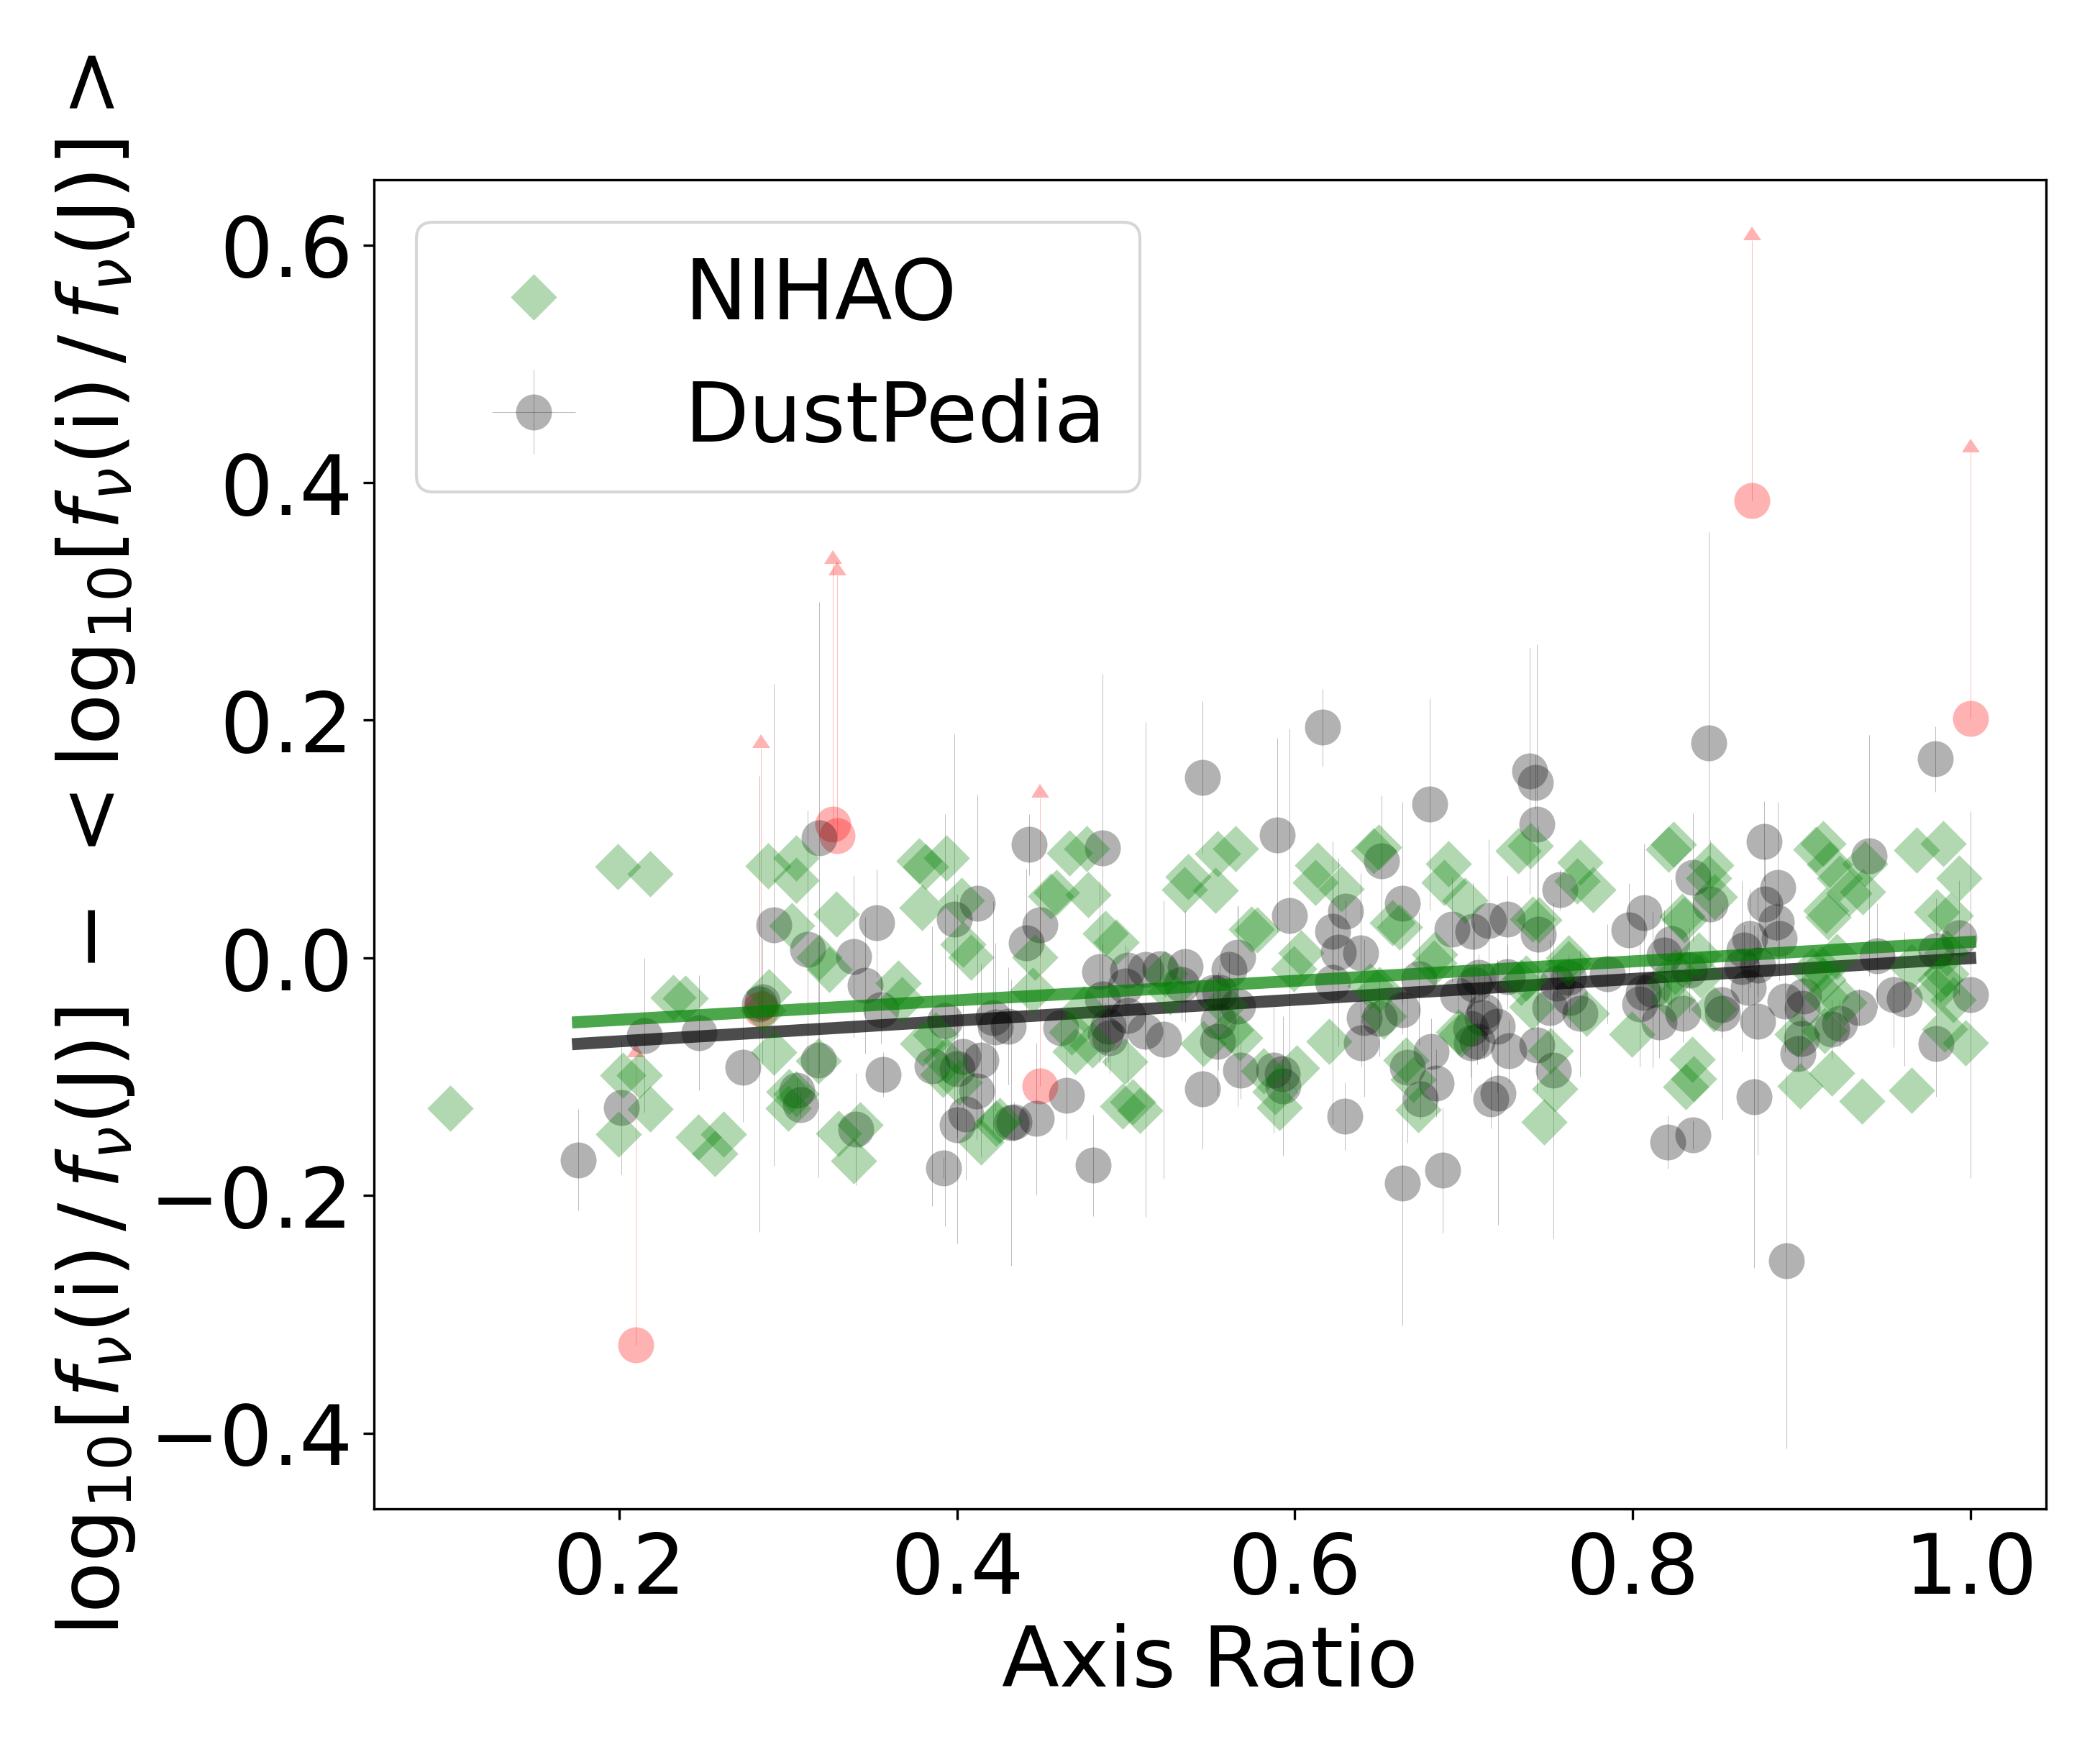
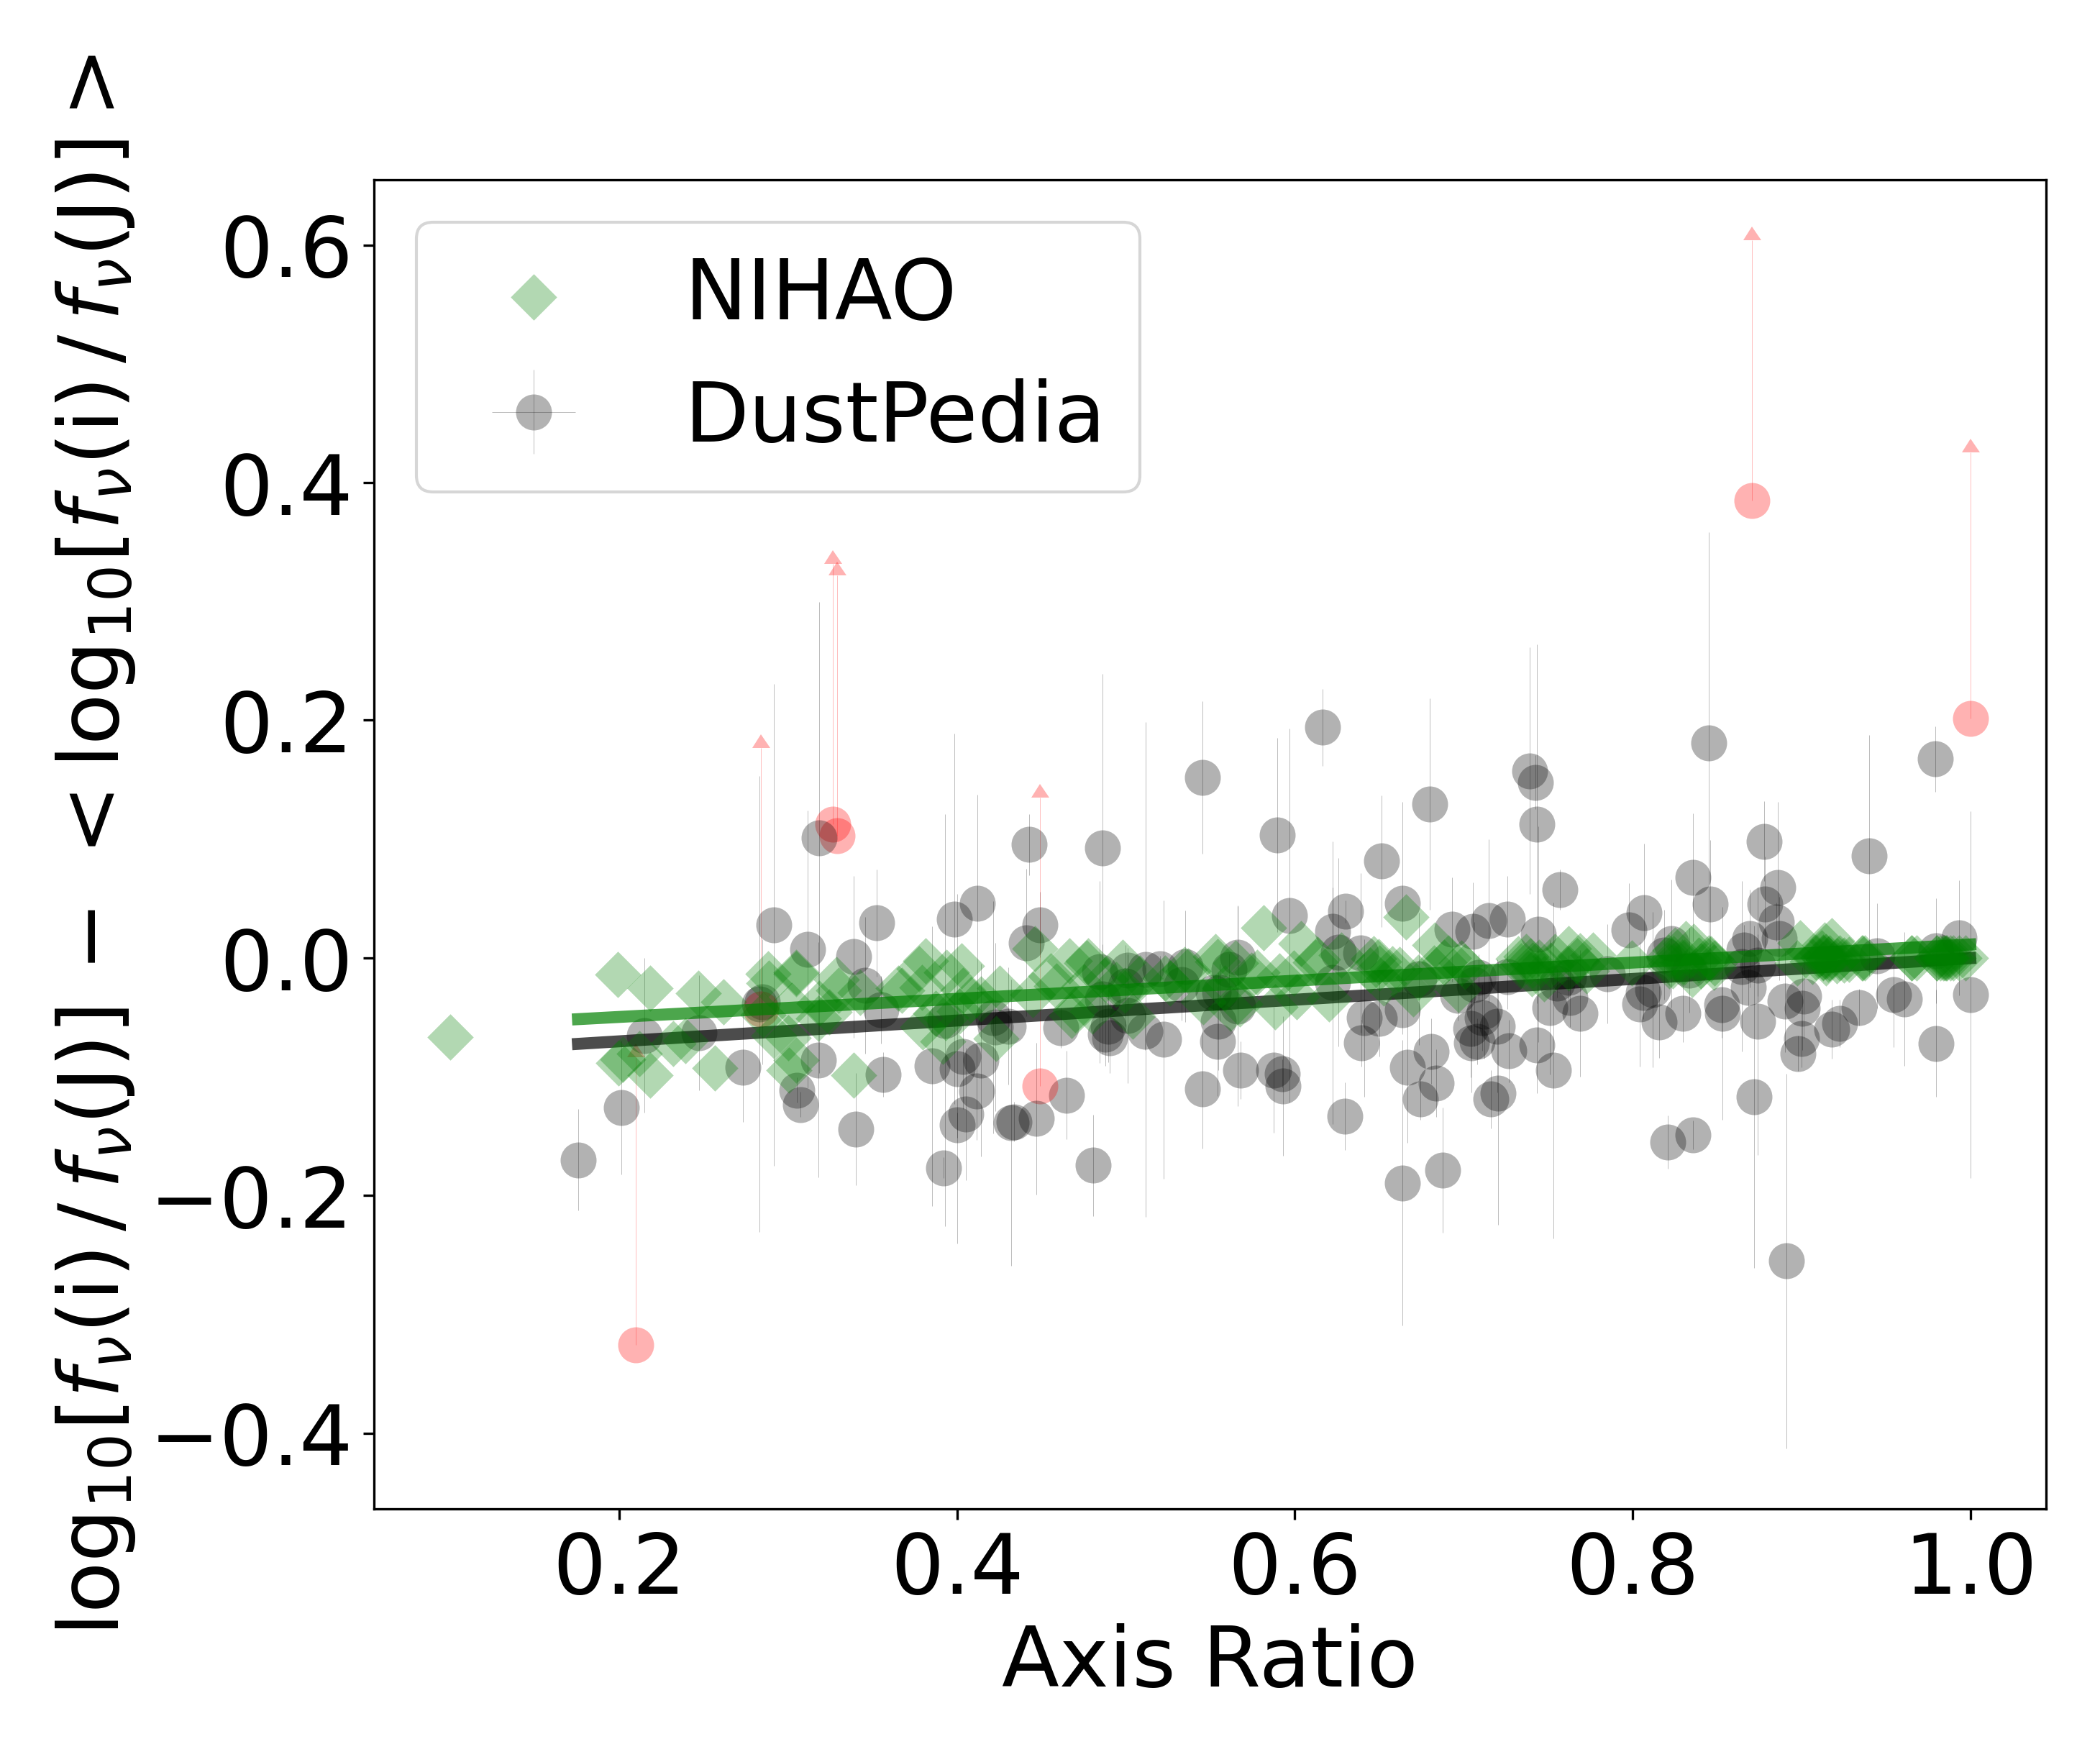
Figure 9 shows the distribution of these color residuals vs. axis ratio for NIHAO and DustPedia disk galaxies. These plots show the reddening effects measured by previous authors. We then perform linear regression of the residual on axis ratio for these two populations. In Section 6.2, we use the differences in slopes between DustPedia and NIHAO as a metric for constraining our free parameters.
The scatter around the lines in Figure 9 has some contribution from an intrinsic scatter of the amount of reddening at a given axis ratio, and the scatter in the color at a given sSFR. For the simulated galaxies, we can probe the intrinsic scatter around the axis ratio dependence more directly, since we know the actual face-on colors. To probe this intrinsic scatter, Figure 10 subtracts the actual face-on colors of each NIHAO galaxy to determine fiducial colors. The most obvious difference between Figures 9 and 10 is that, as we approach face-on orientations, we see the scatter in the NIHAO colors around the average go to zero. Notice however that the best-fitting slope is not likely to be affected by this choice, to the extent that the sSFR of the NIHAO galaxies do not correlate strongly with their axis ratios in the simulated observations.


6.2 Parameter Space
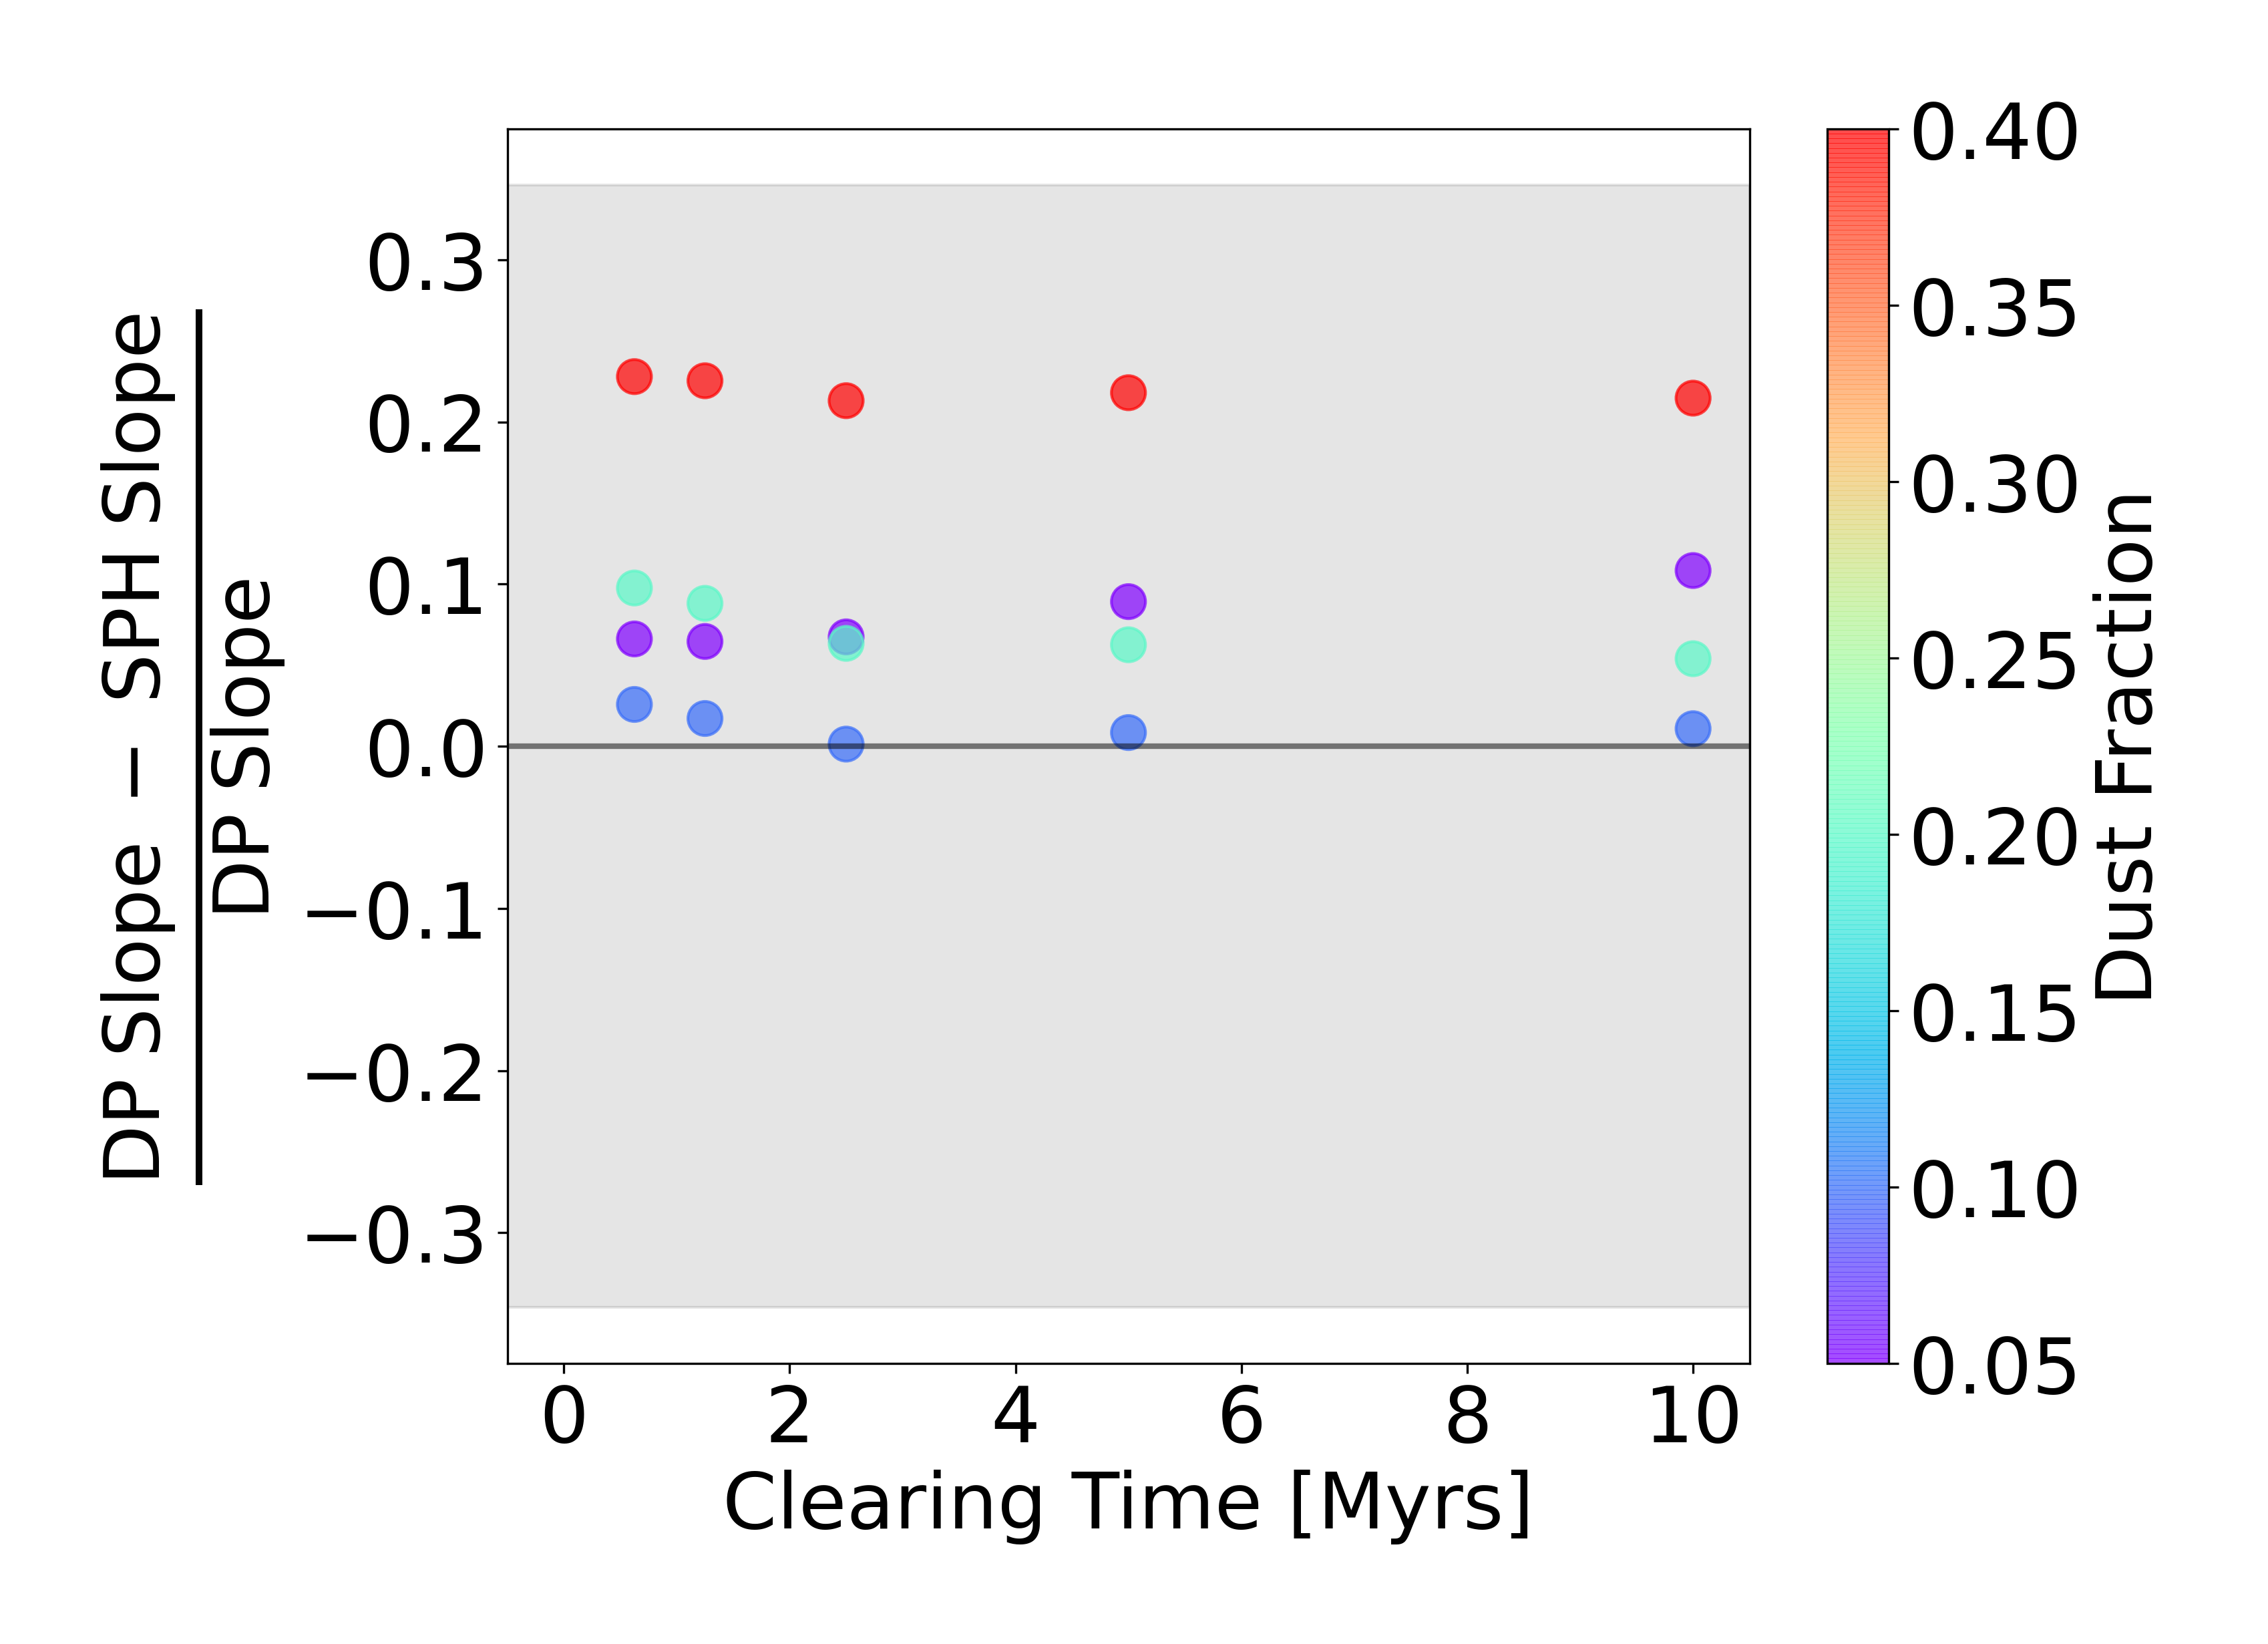
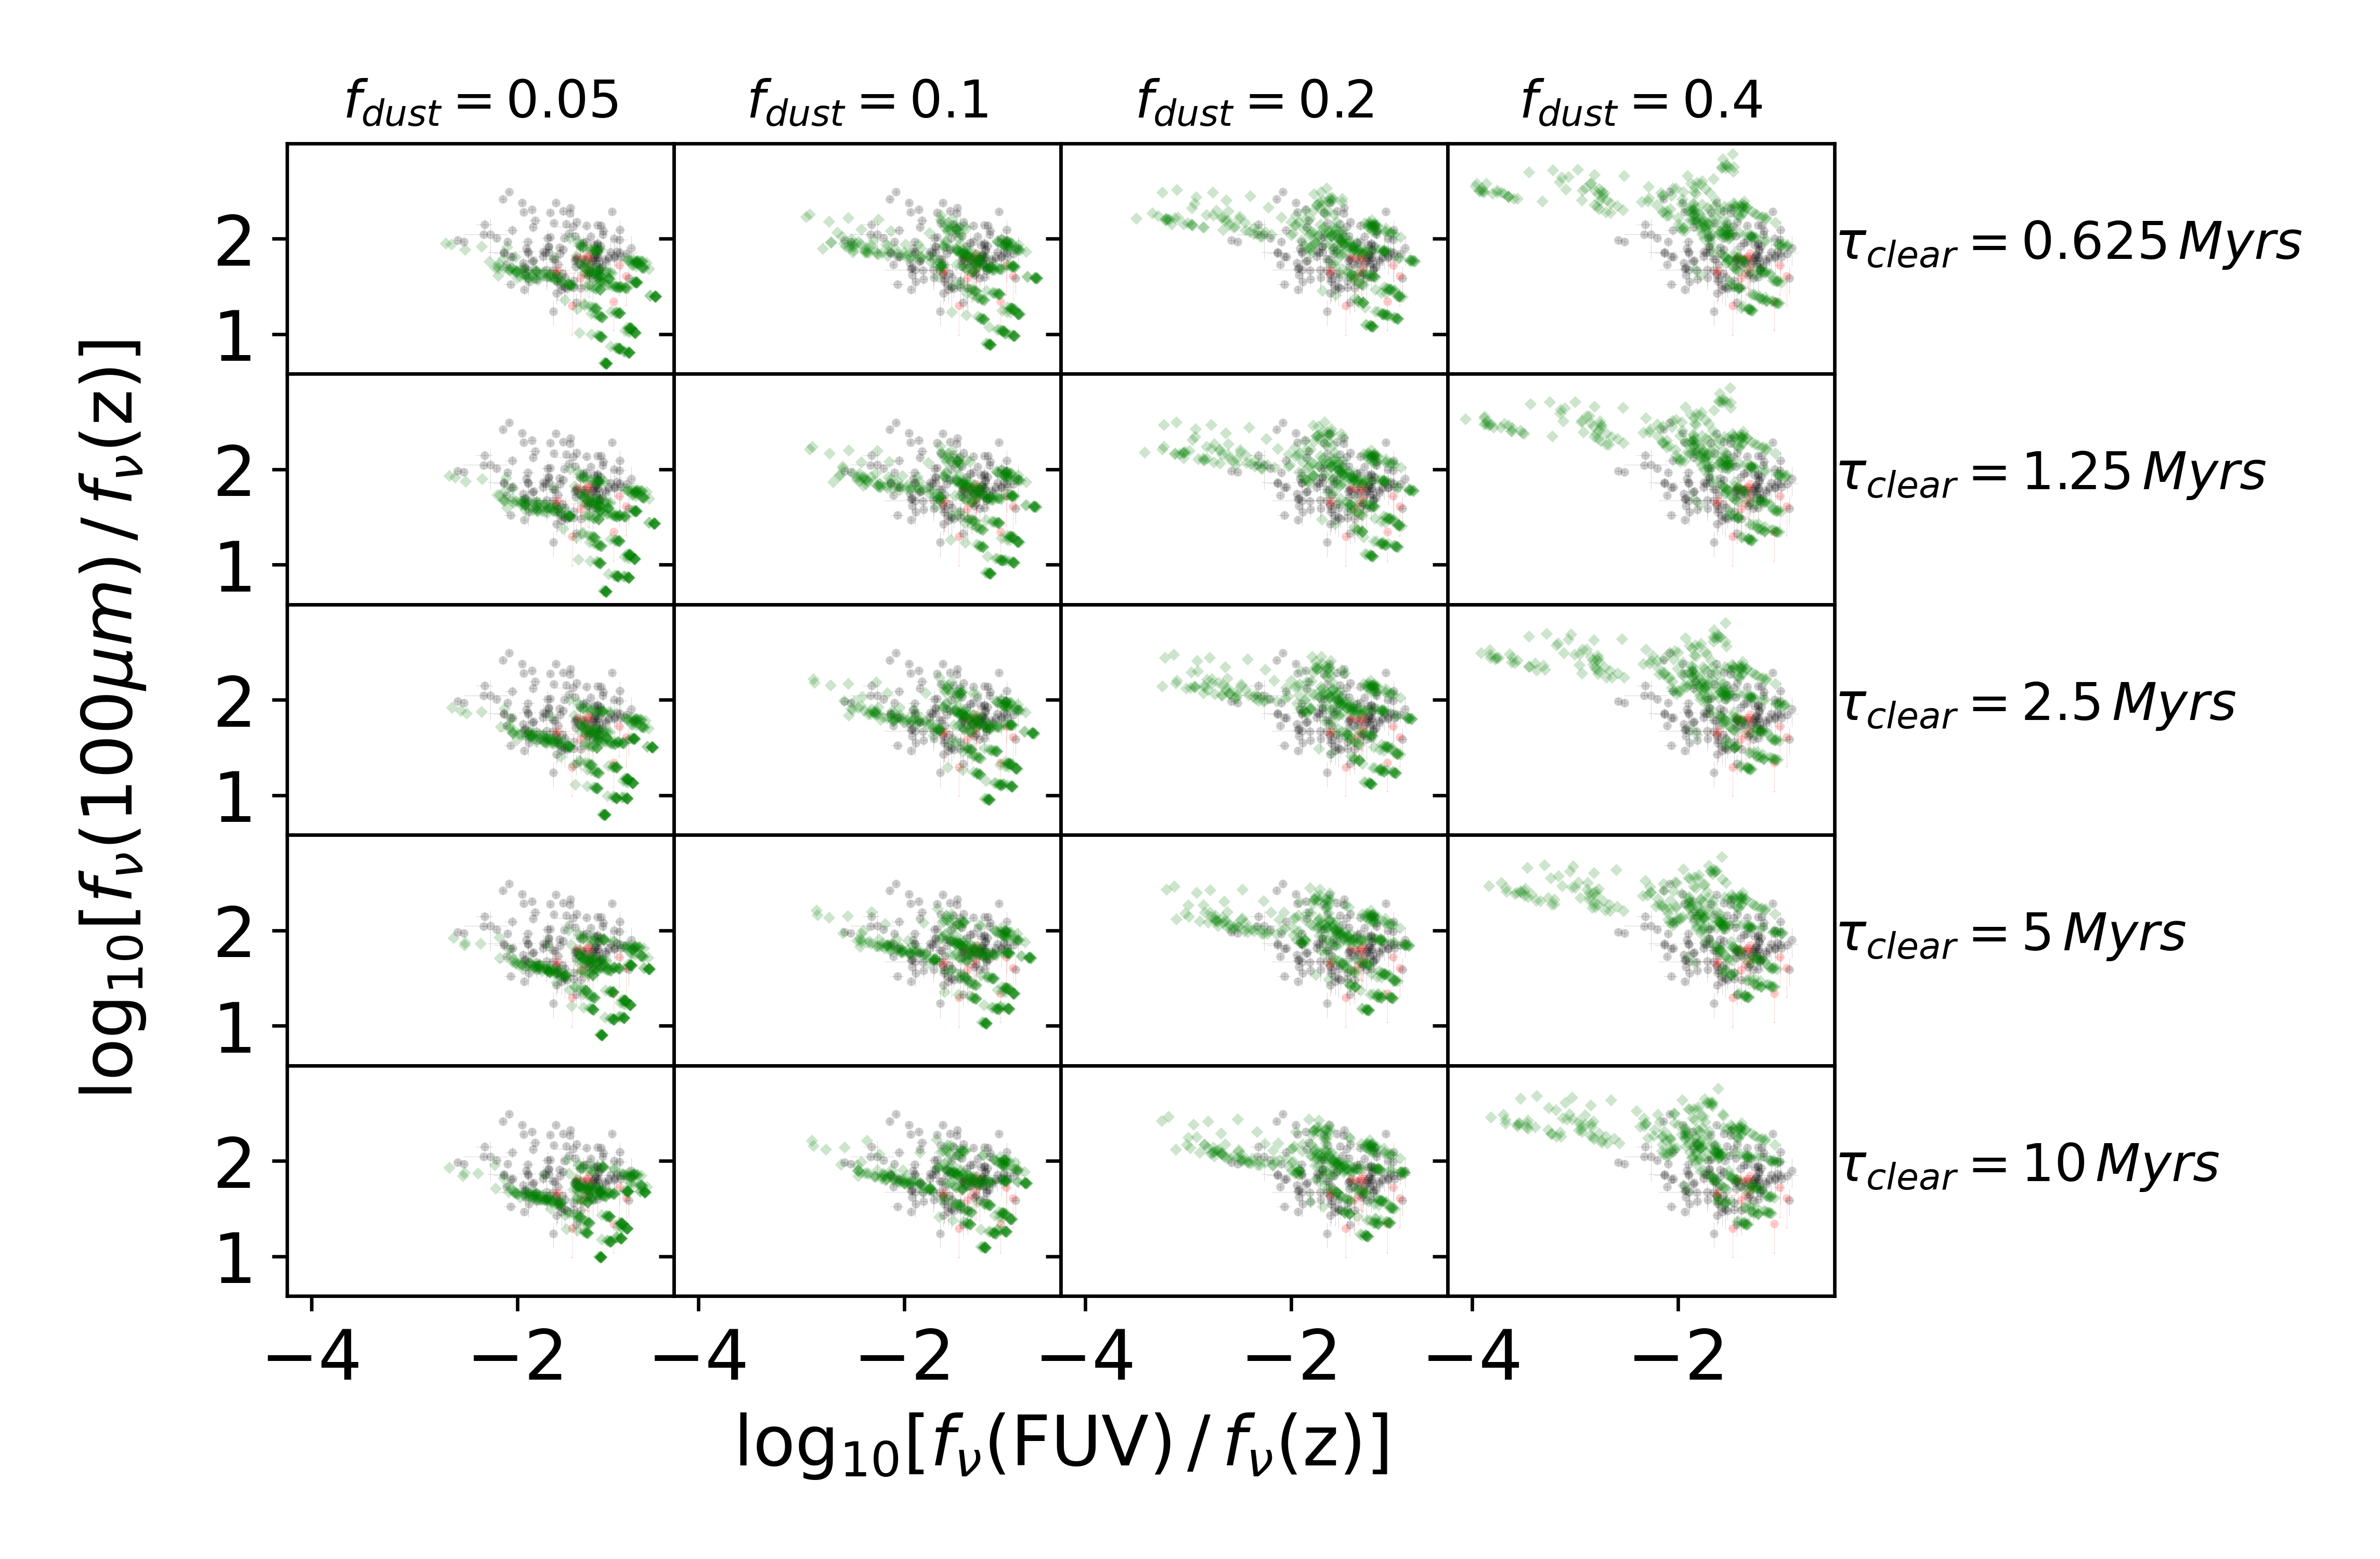
To determine our free parameters, the clearing time and the dust fraction, we test a grid of clearing times (horizontal axis) and dust fractions (symbol colors). Parameter values are evenly separated in log space: and Myrs. Figure 11 shows the fractional difference of the best-fitting color residual vs. axis ratio slopes between DustPedia and NIHAO disk galaxies corresponding to each grid point. The shaded region in this plot represents the standard error in the slope difference determined by bootstrap, averaged over all the data points, centered at . For each and , we calculate the bootstrap standard error by randomly sampling data points from NIHAO and DustPedia with replacement and repeatedly running the fitting procedures shown in Figures 8 and 9. The standard deviation of the fractional slope differences among 100 iterations of sampling with replacement and fitting gives the bootstrap standard error for each combination of and . Figure 12 shows the distribution of vs. flux ratios for DustPedia and NIHAO corresponding to each grid point.
In Figure 11, even though the bootstrap standard error is large enough to make all the data points consistent with , we can see that the fractional slope differences consistently show the best agreement with DustPedia. In Figure 12, we can also see that the column consistently shows the best agreement with DustPedia while different values of only have a small effect on the distribution of colors. Given this difficulty in constraining , we settle on an intermediate value of Myrs, leading to our final parameter choices of and Myrs.
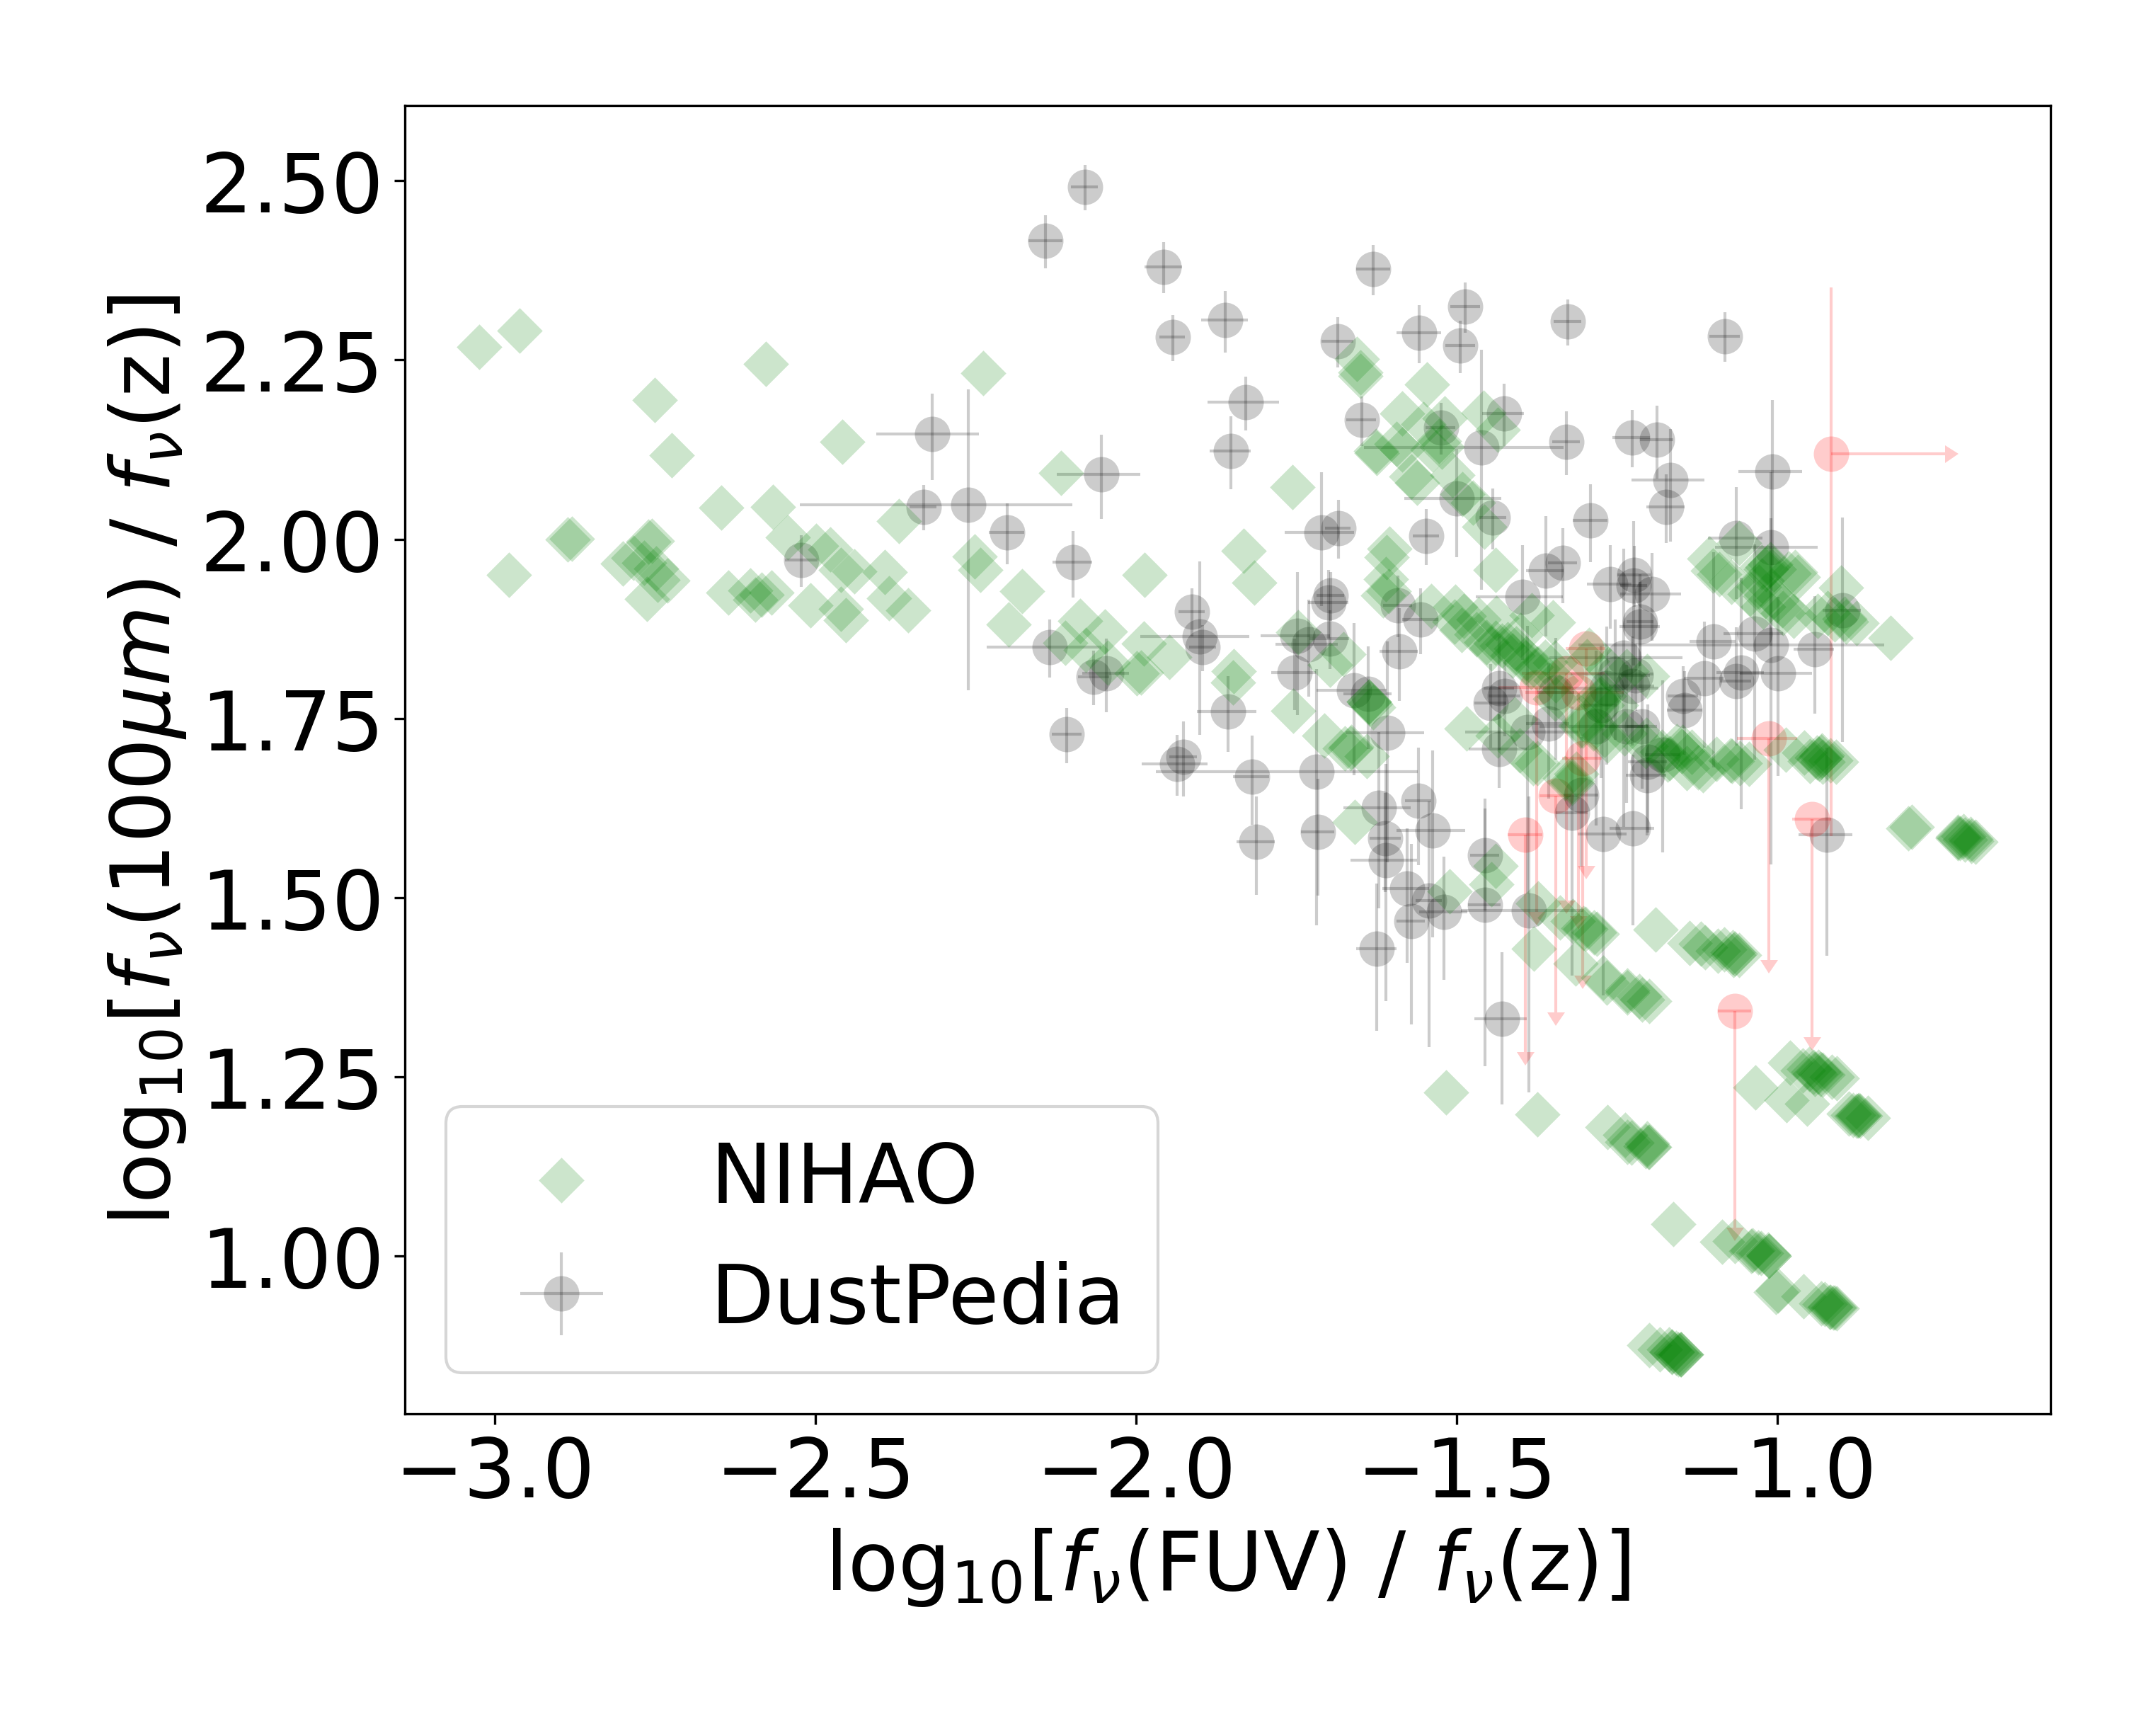
Using the same values of , we perform the same comparisons to the case of having no star-forming particles (all star particles are modeled with FSPS). In this case, the parameter space is only 1-dimensional and we find that has the best agreement with DustPedia galaxies.
6.3 Images
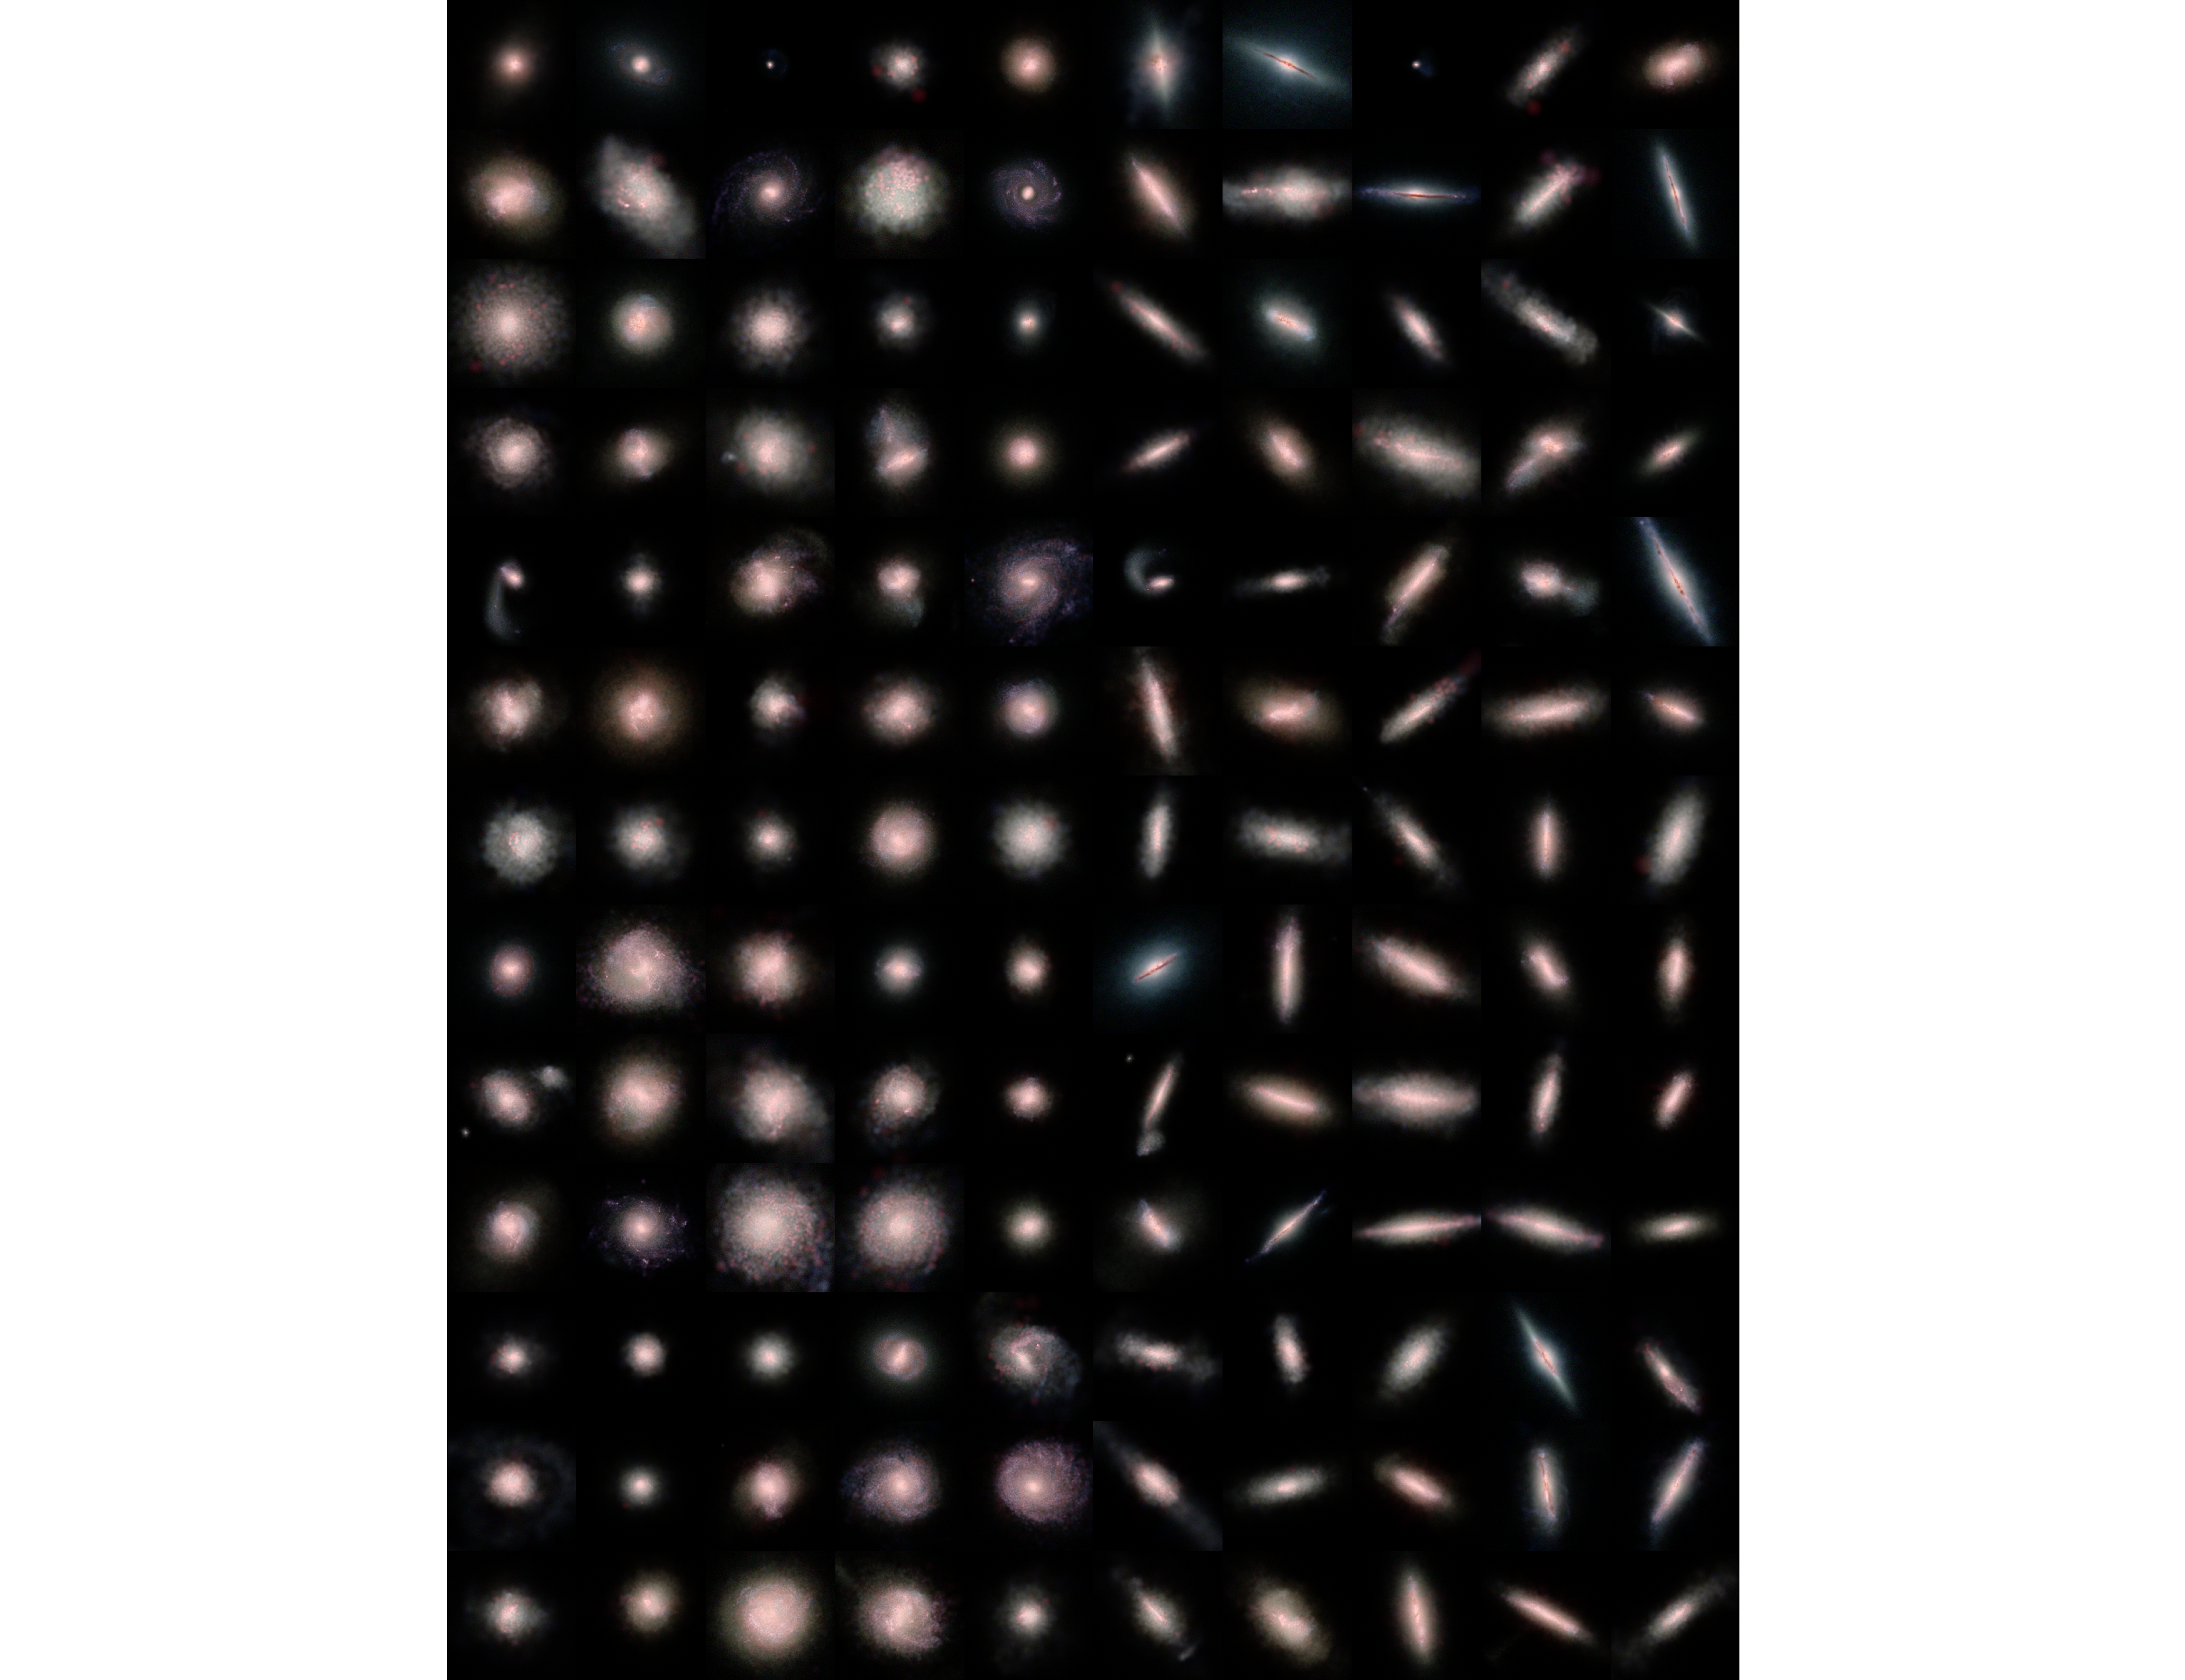
Figure 13 shows composite images of each NIHAO galaxy at their most face-on (left 5 columns) and most edge-on (right 5 columns) orientations. In order to keep the brightest pixels from dominating the images, each galaxy’s fluxes are individually truncated, normalized, and scaled by an arcsinh stretch. We create the image by setting the red channel equal to z-band and W4-band, the green channel equal to r-band, and the blue channel equal to g-band and FUV-band. Note that these choices are purely cosmetic and have no impact on any of the quantitative results in this work.
6.4 Color-color Plots
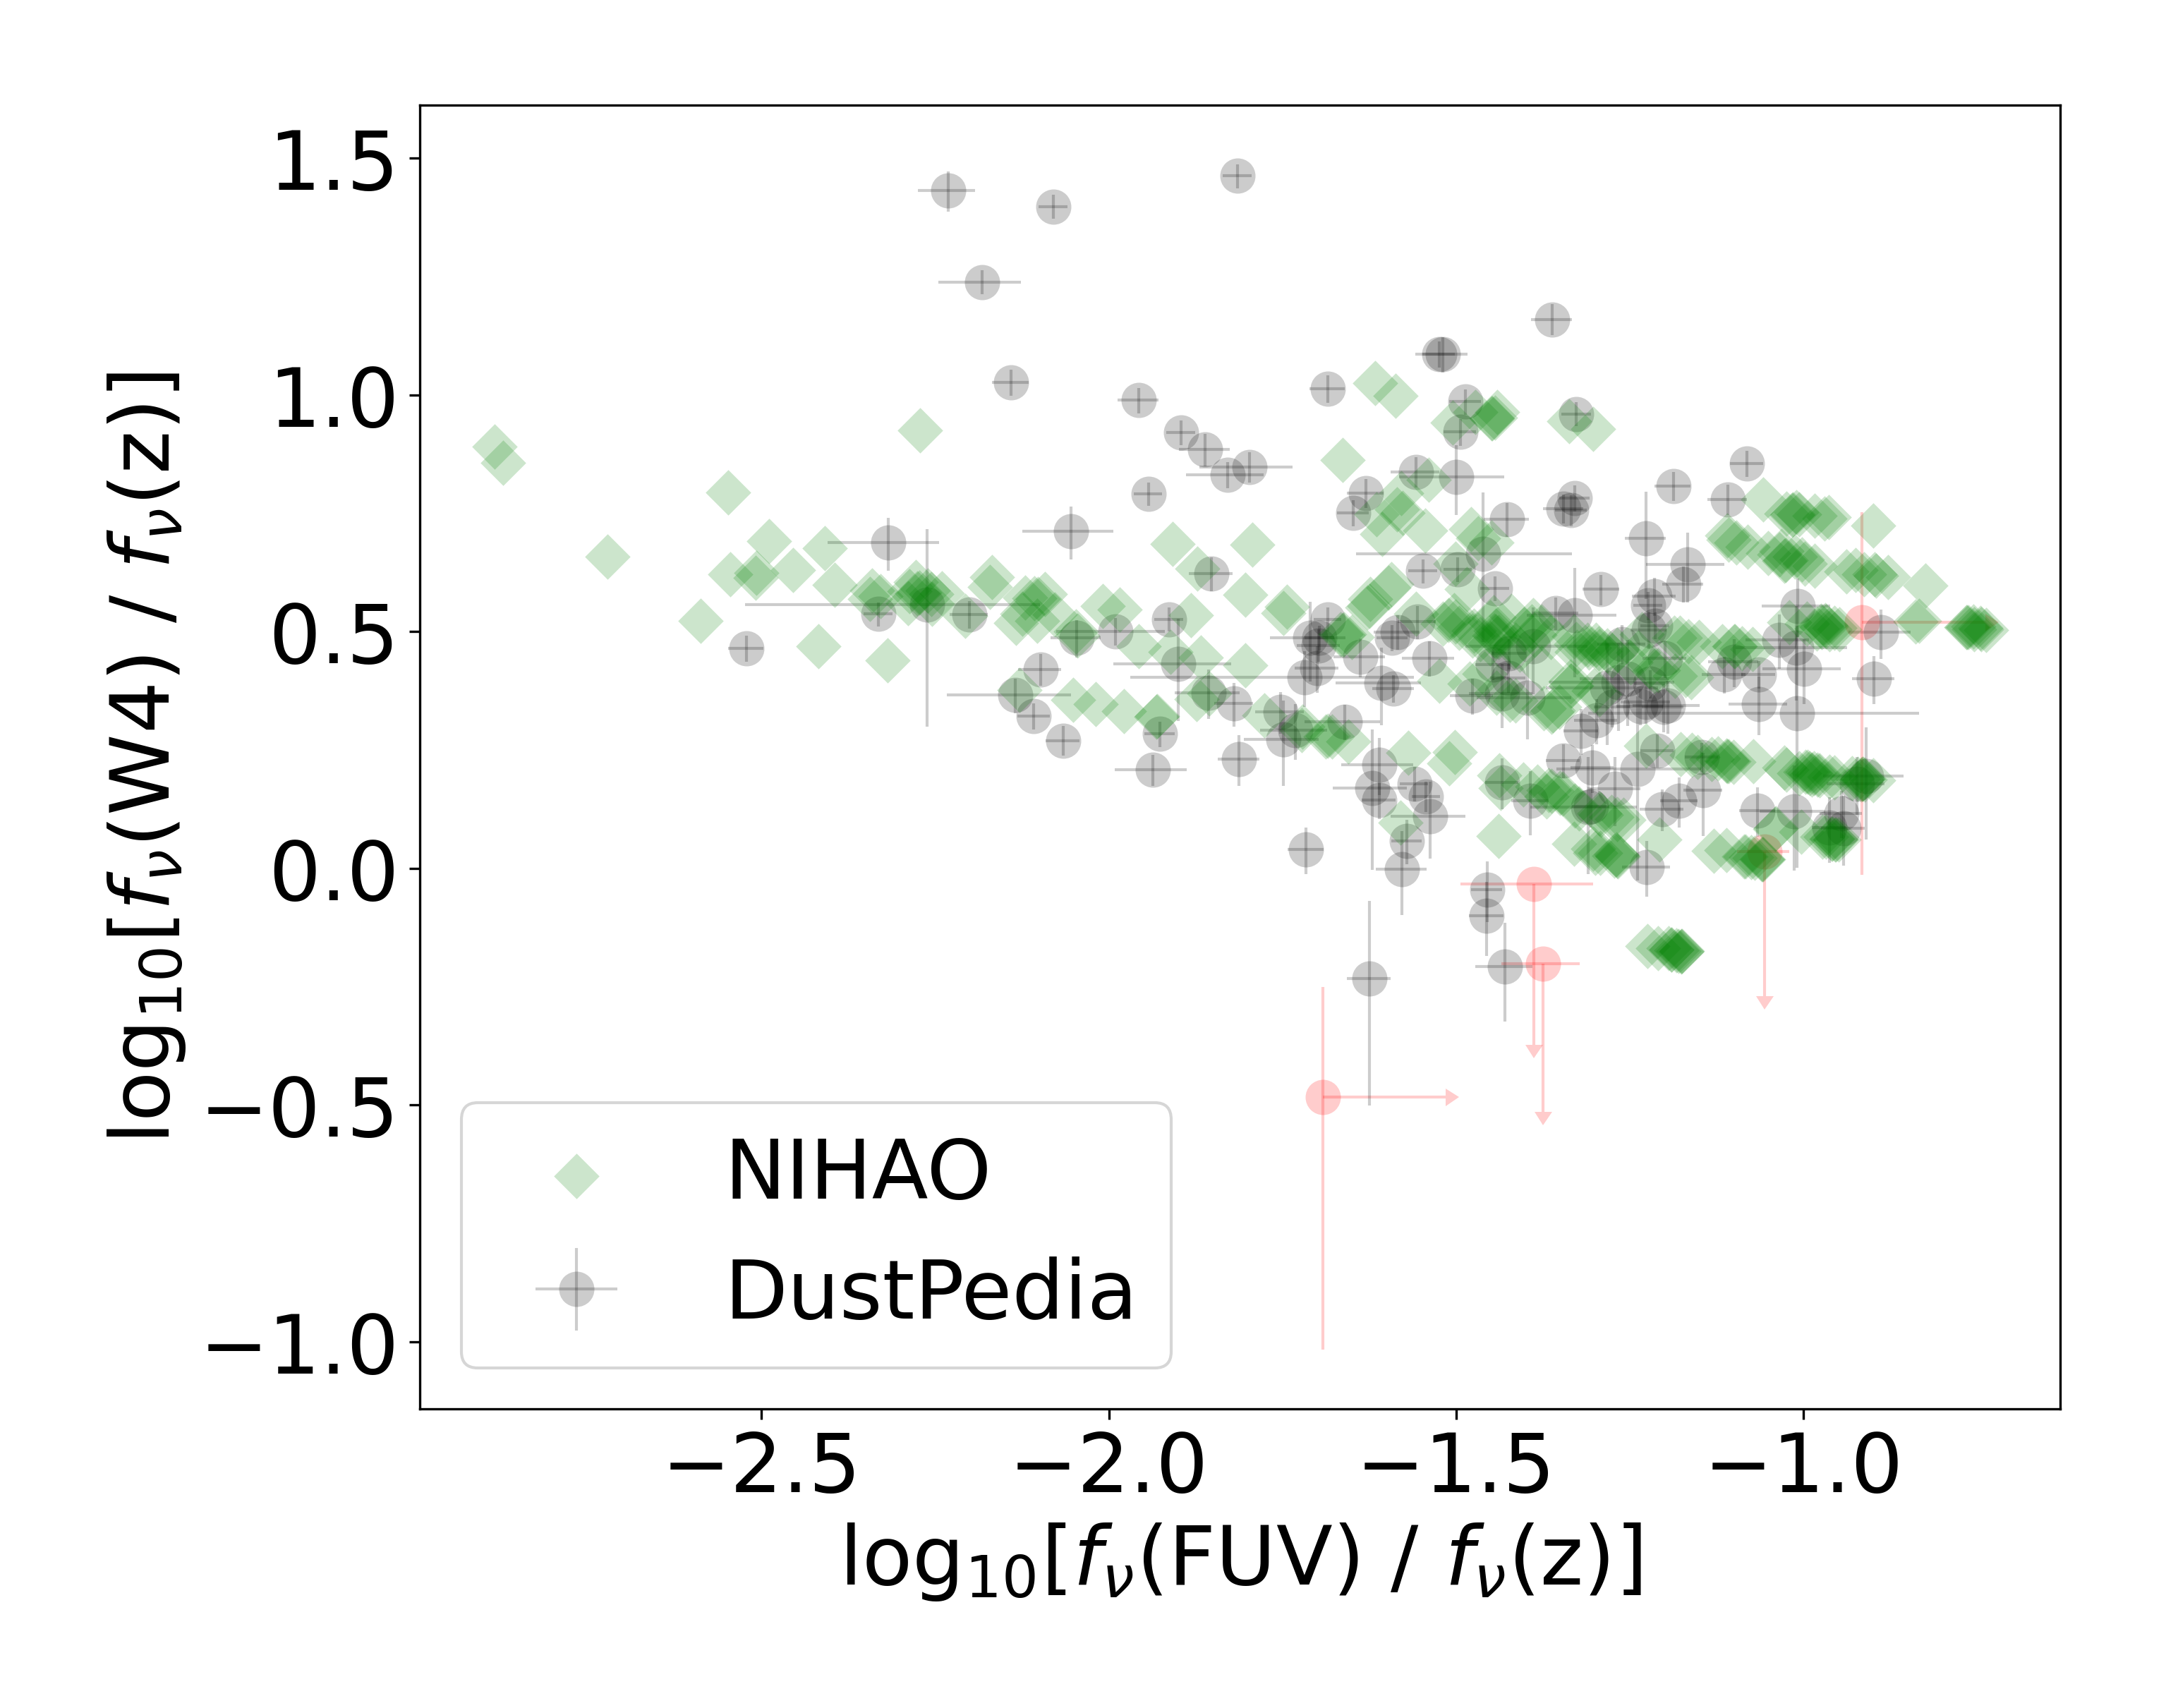
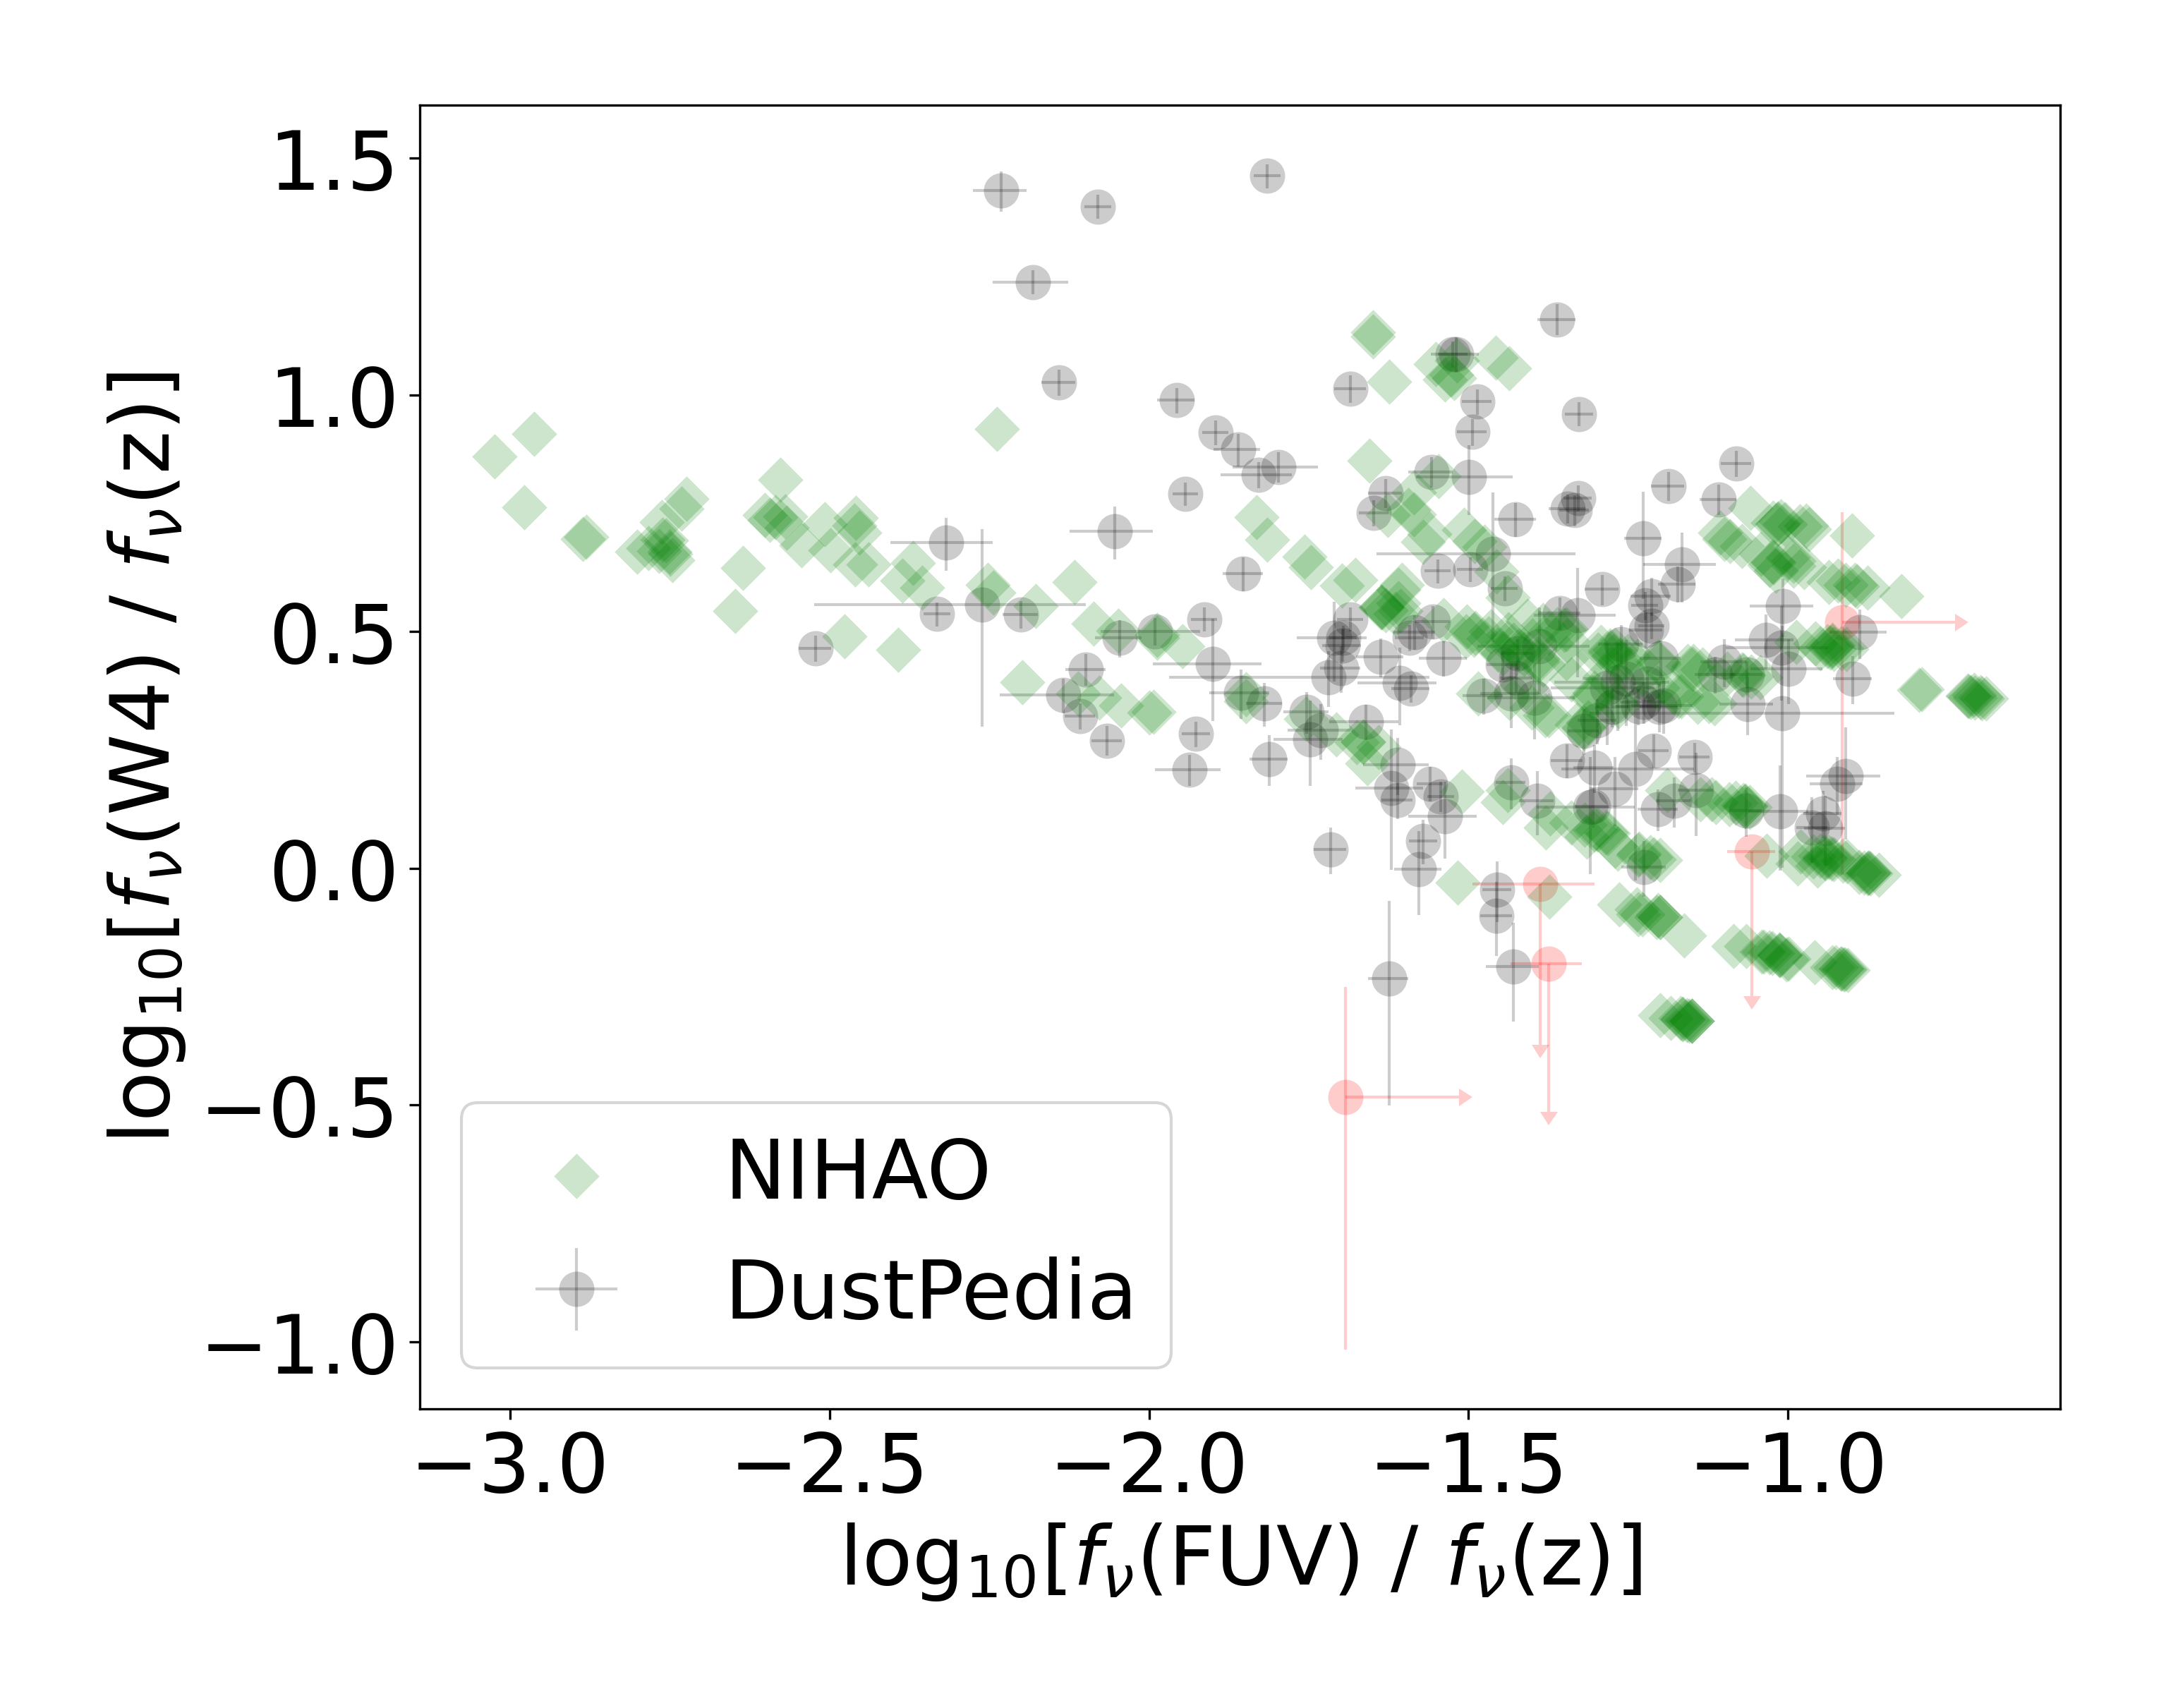
Looking at Figure 14, we can see that our best-fitting simulated parameters qualitatively match the DustPedia galaxies’ colors, with some outliers. While there are some galaxies that are deficient in both IR and FUV relative to optical light, we see that these discrepancies are even stronger when we don’t include star-forming particles in our modeling, which is shown in Figure 15. Whether the discrepancies in Figure 14 are due to limitations in the modeling of regions, the diffuse dust model, or are inherent to the simulated galaxies is unclear.
6.5 Attenuation curves
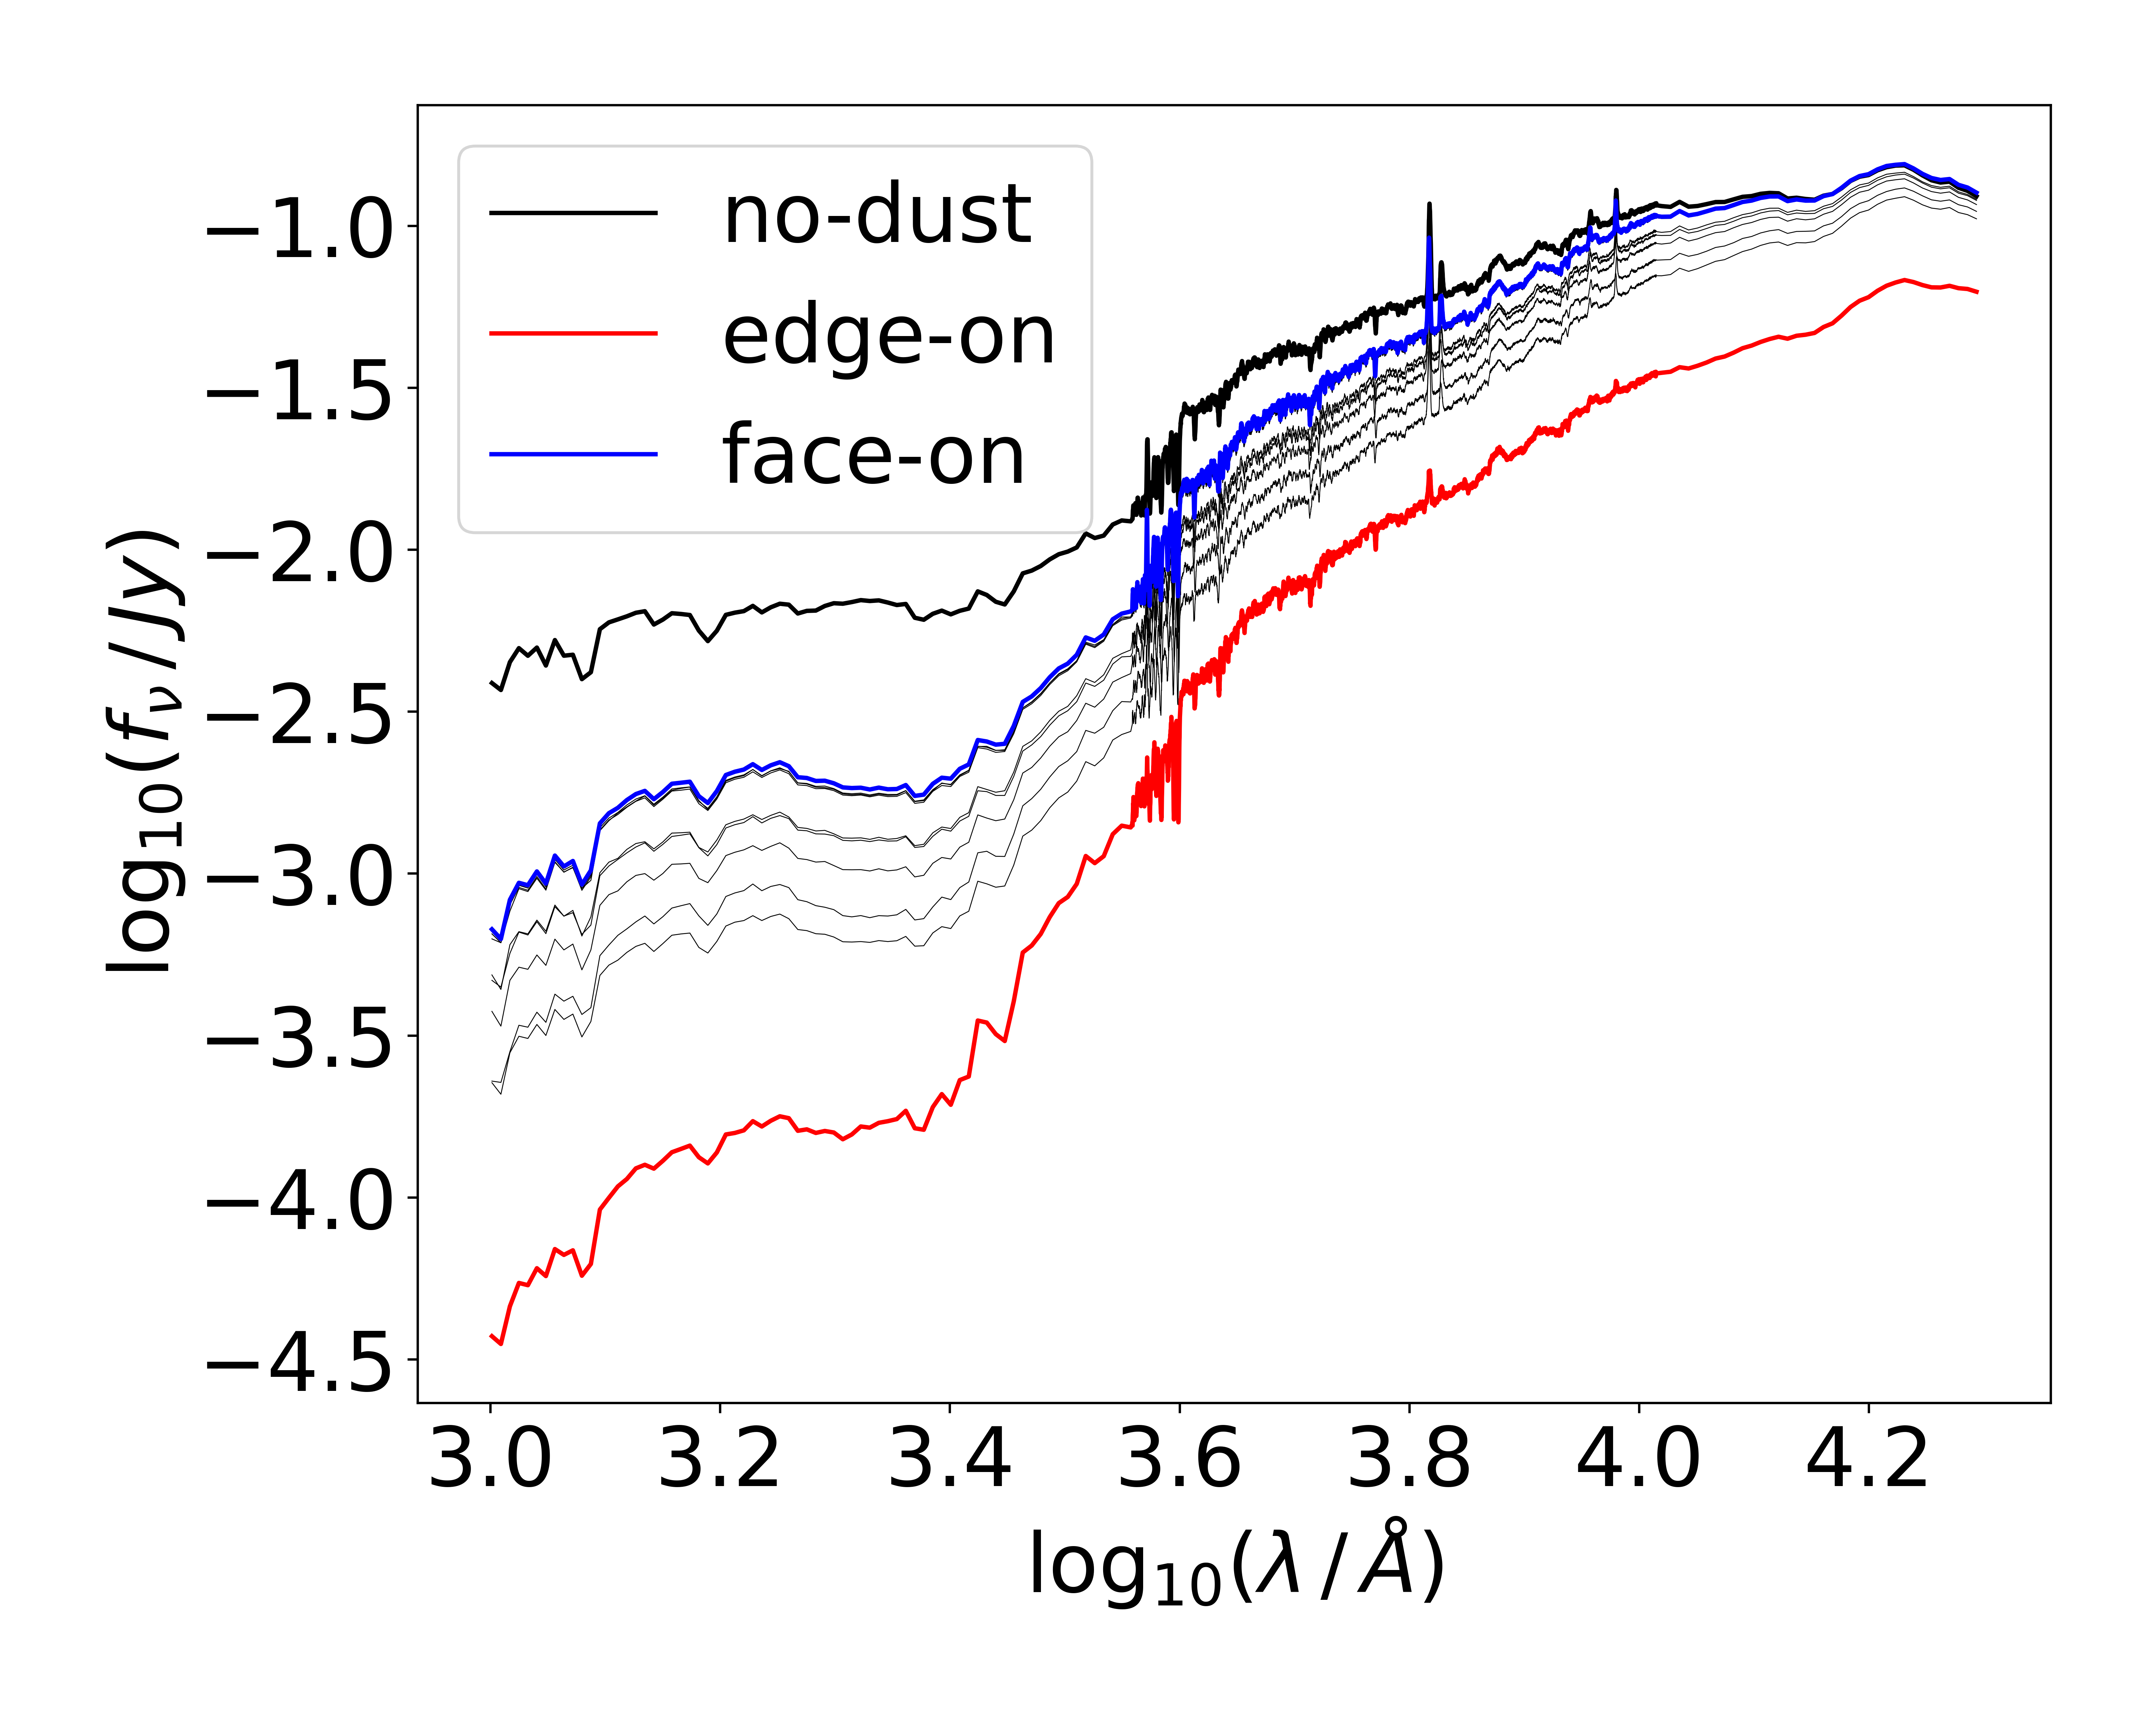
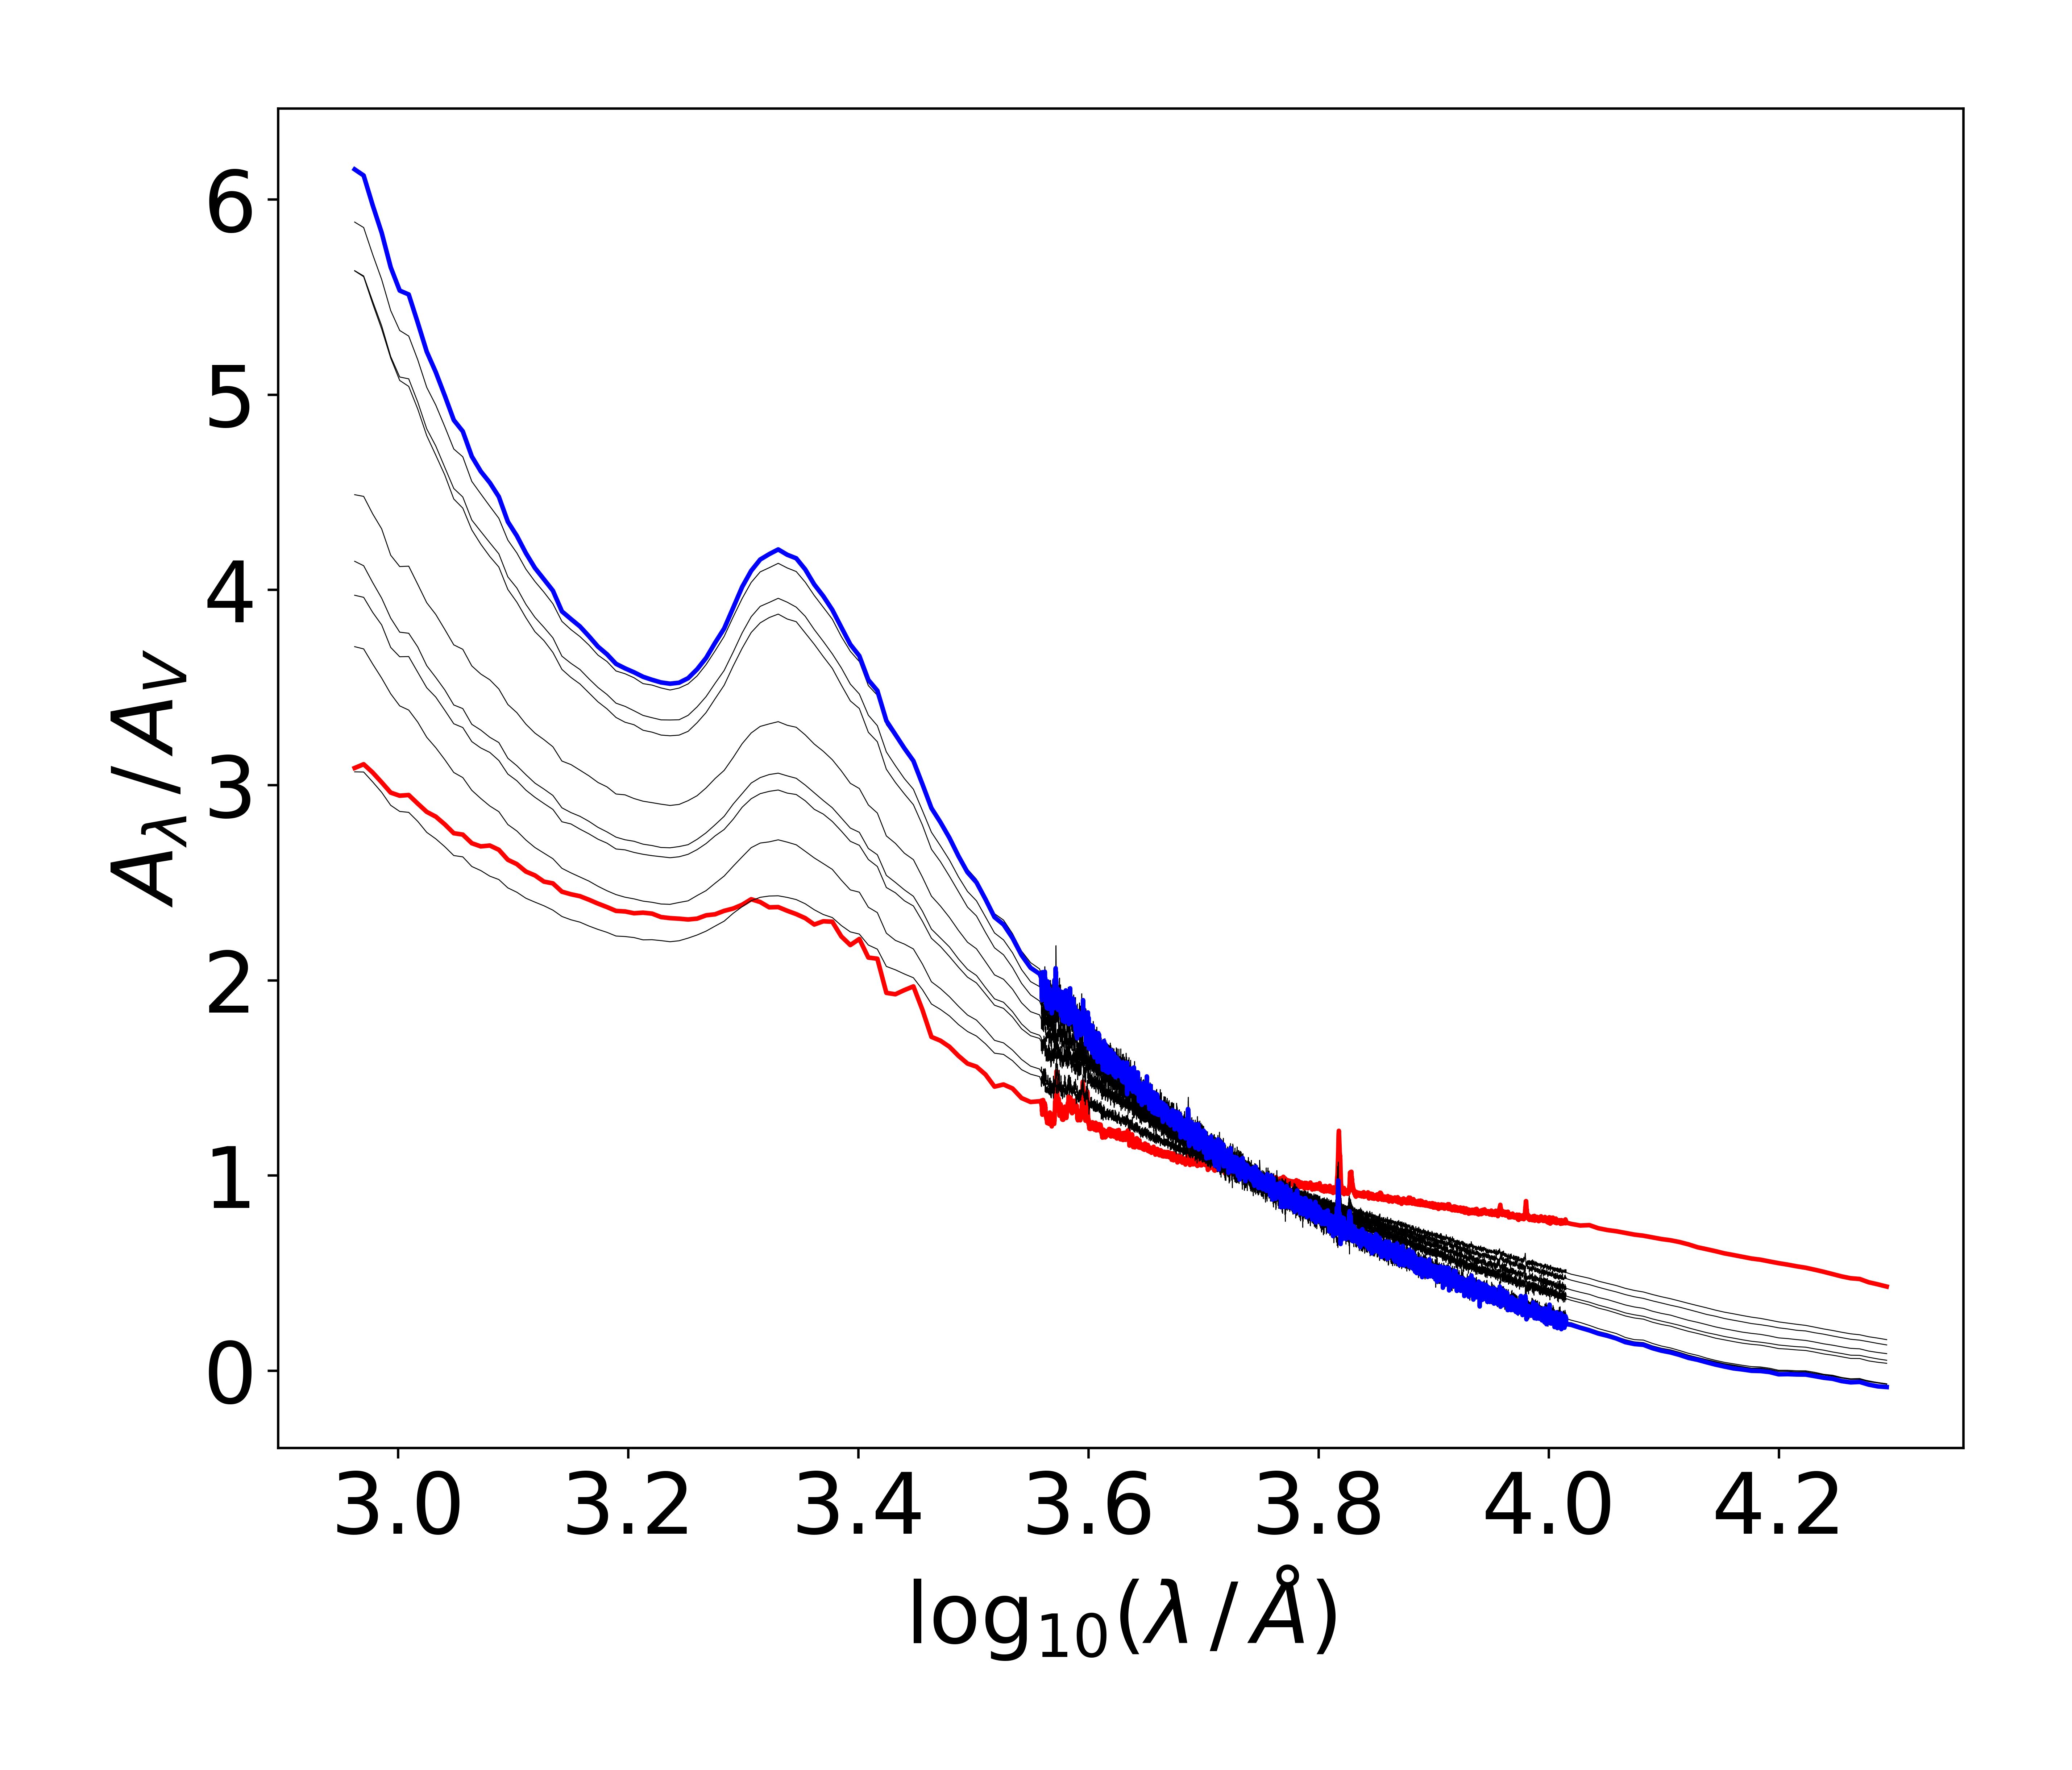
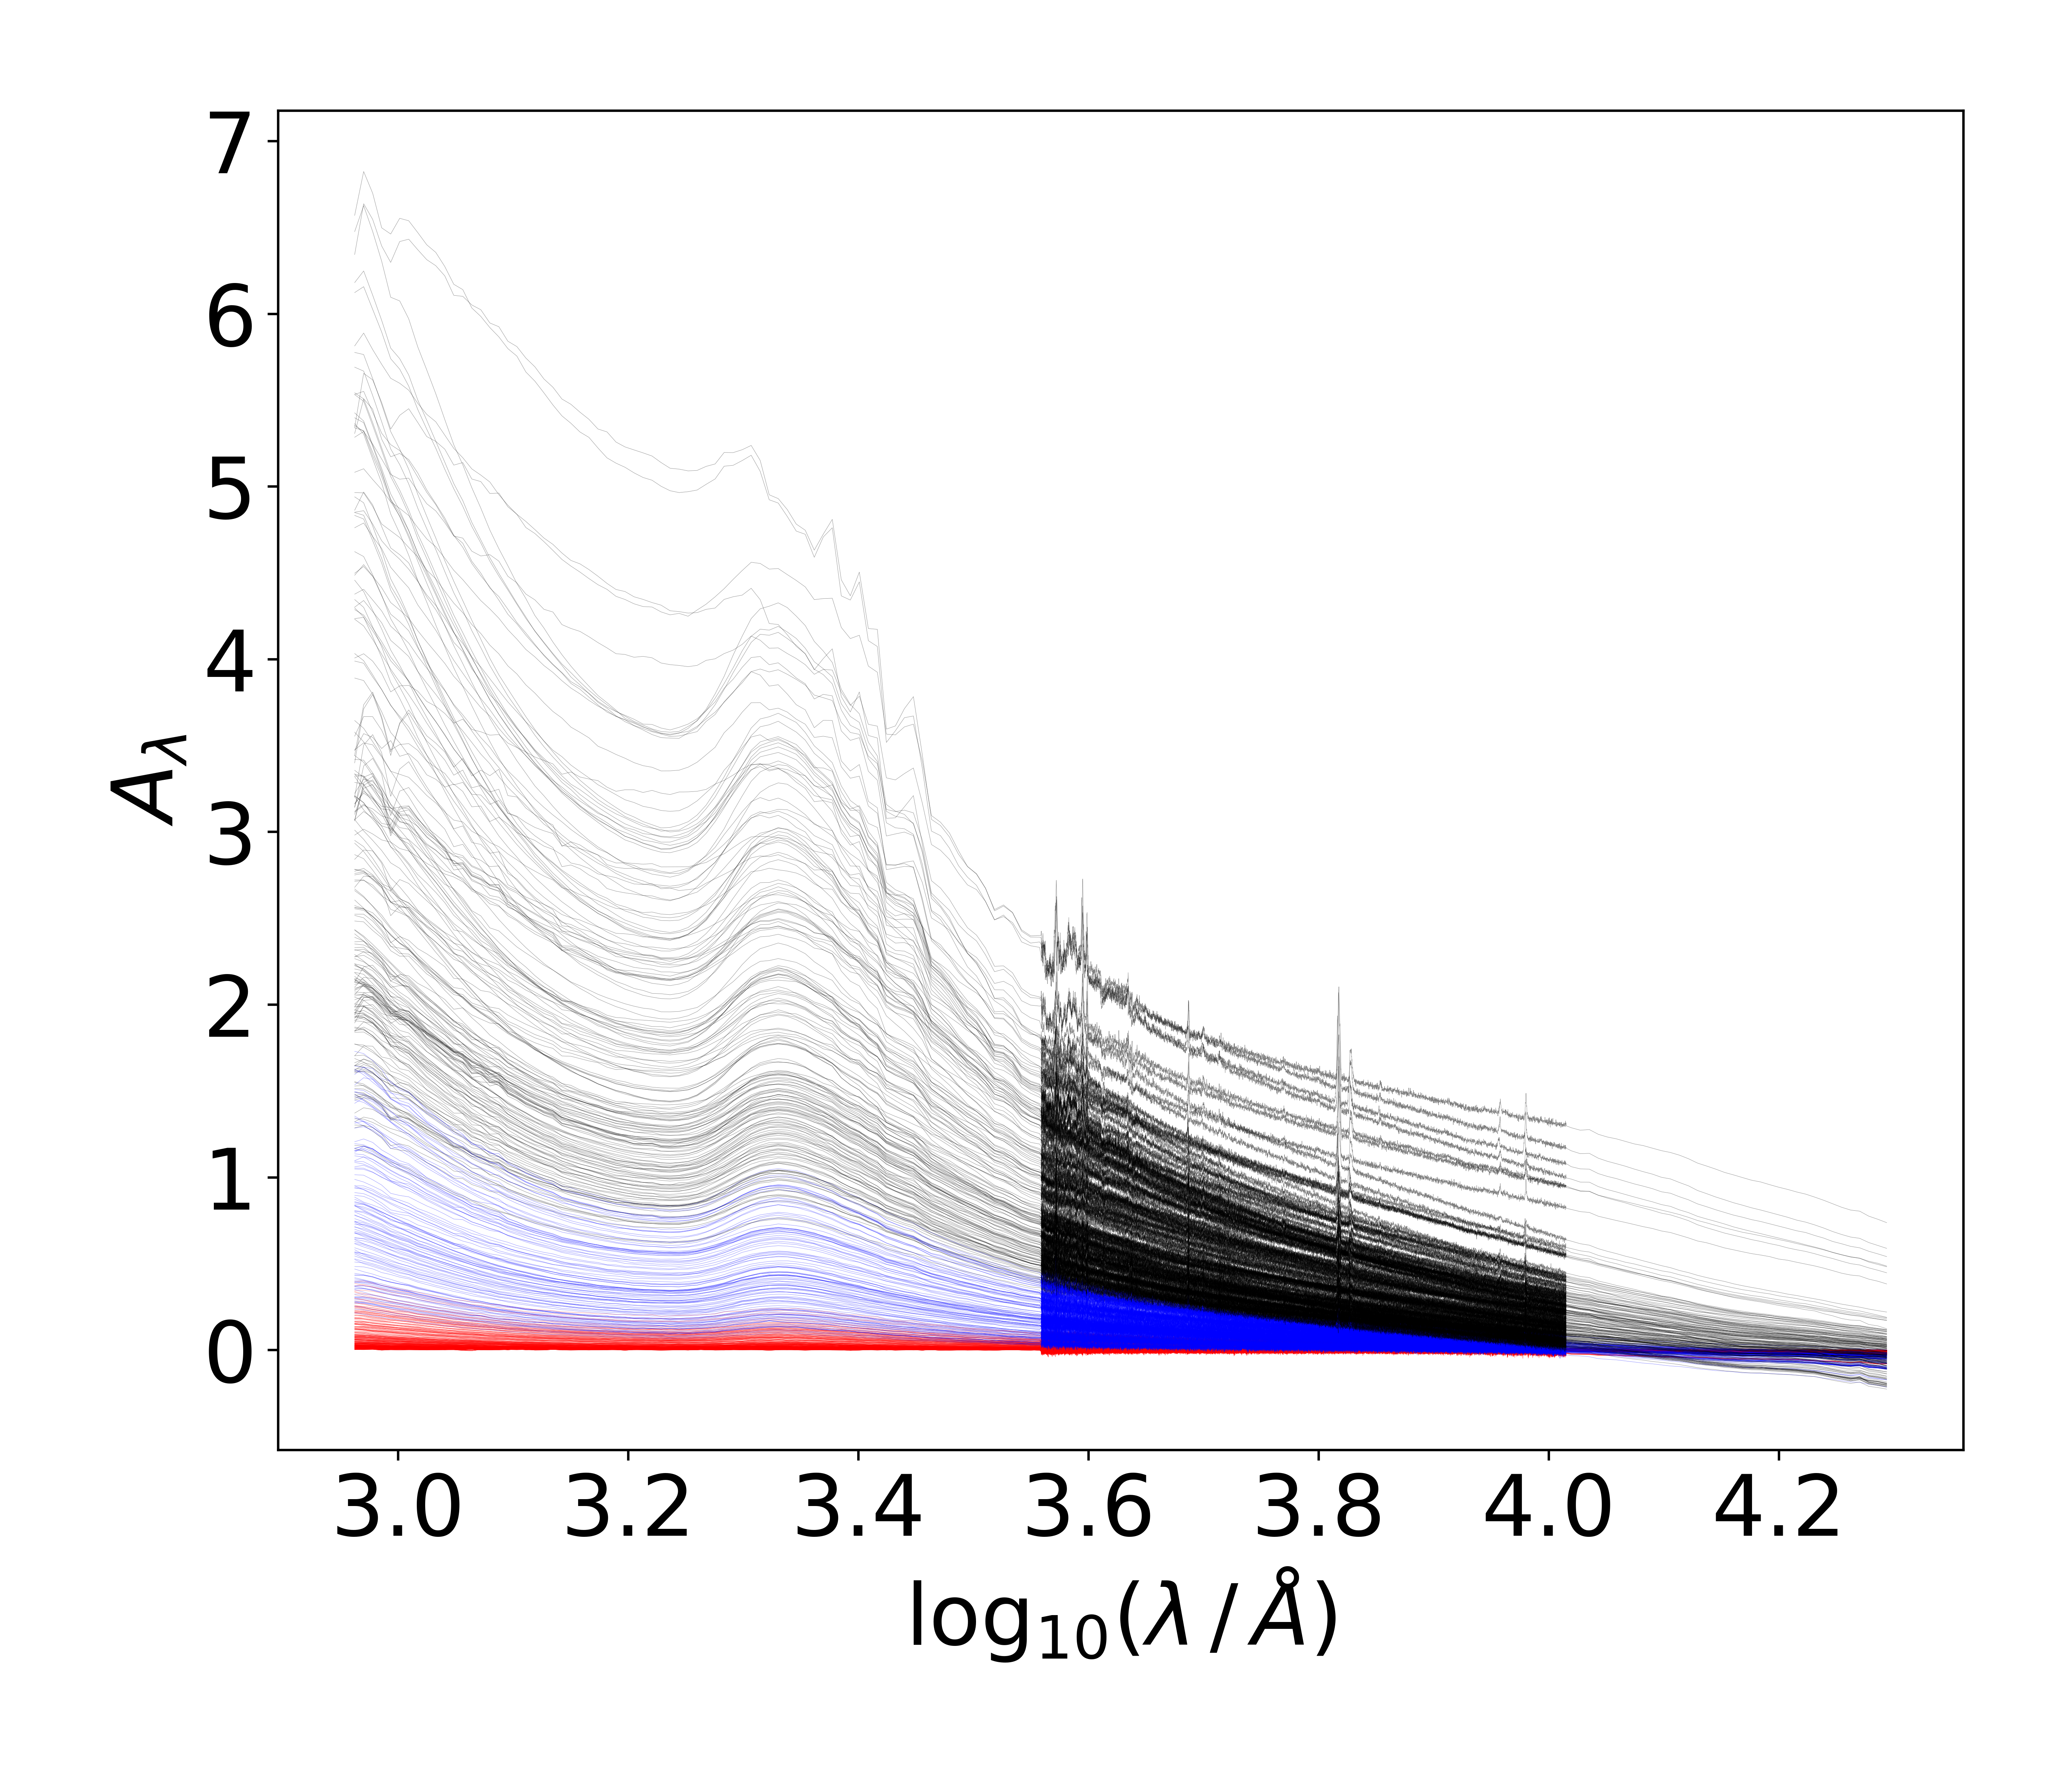
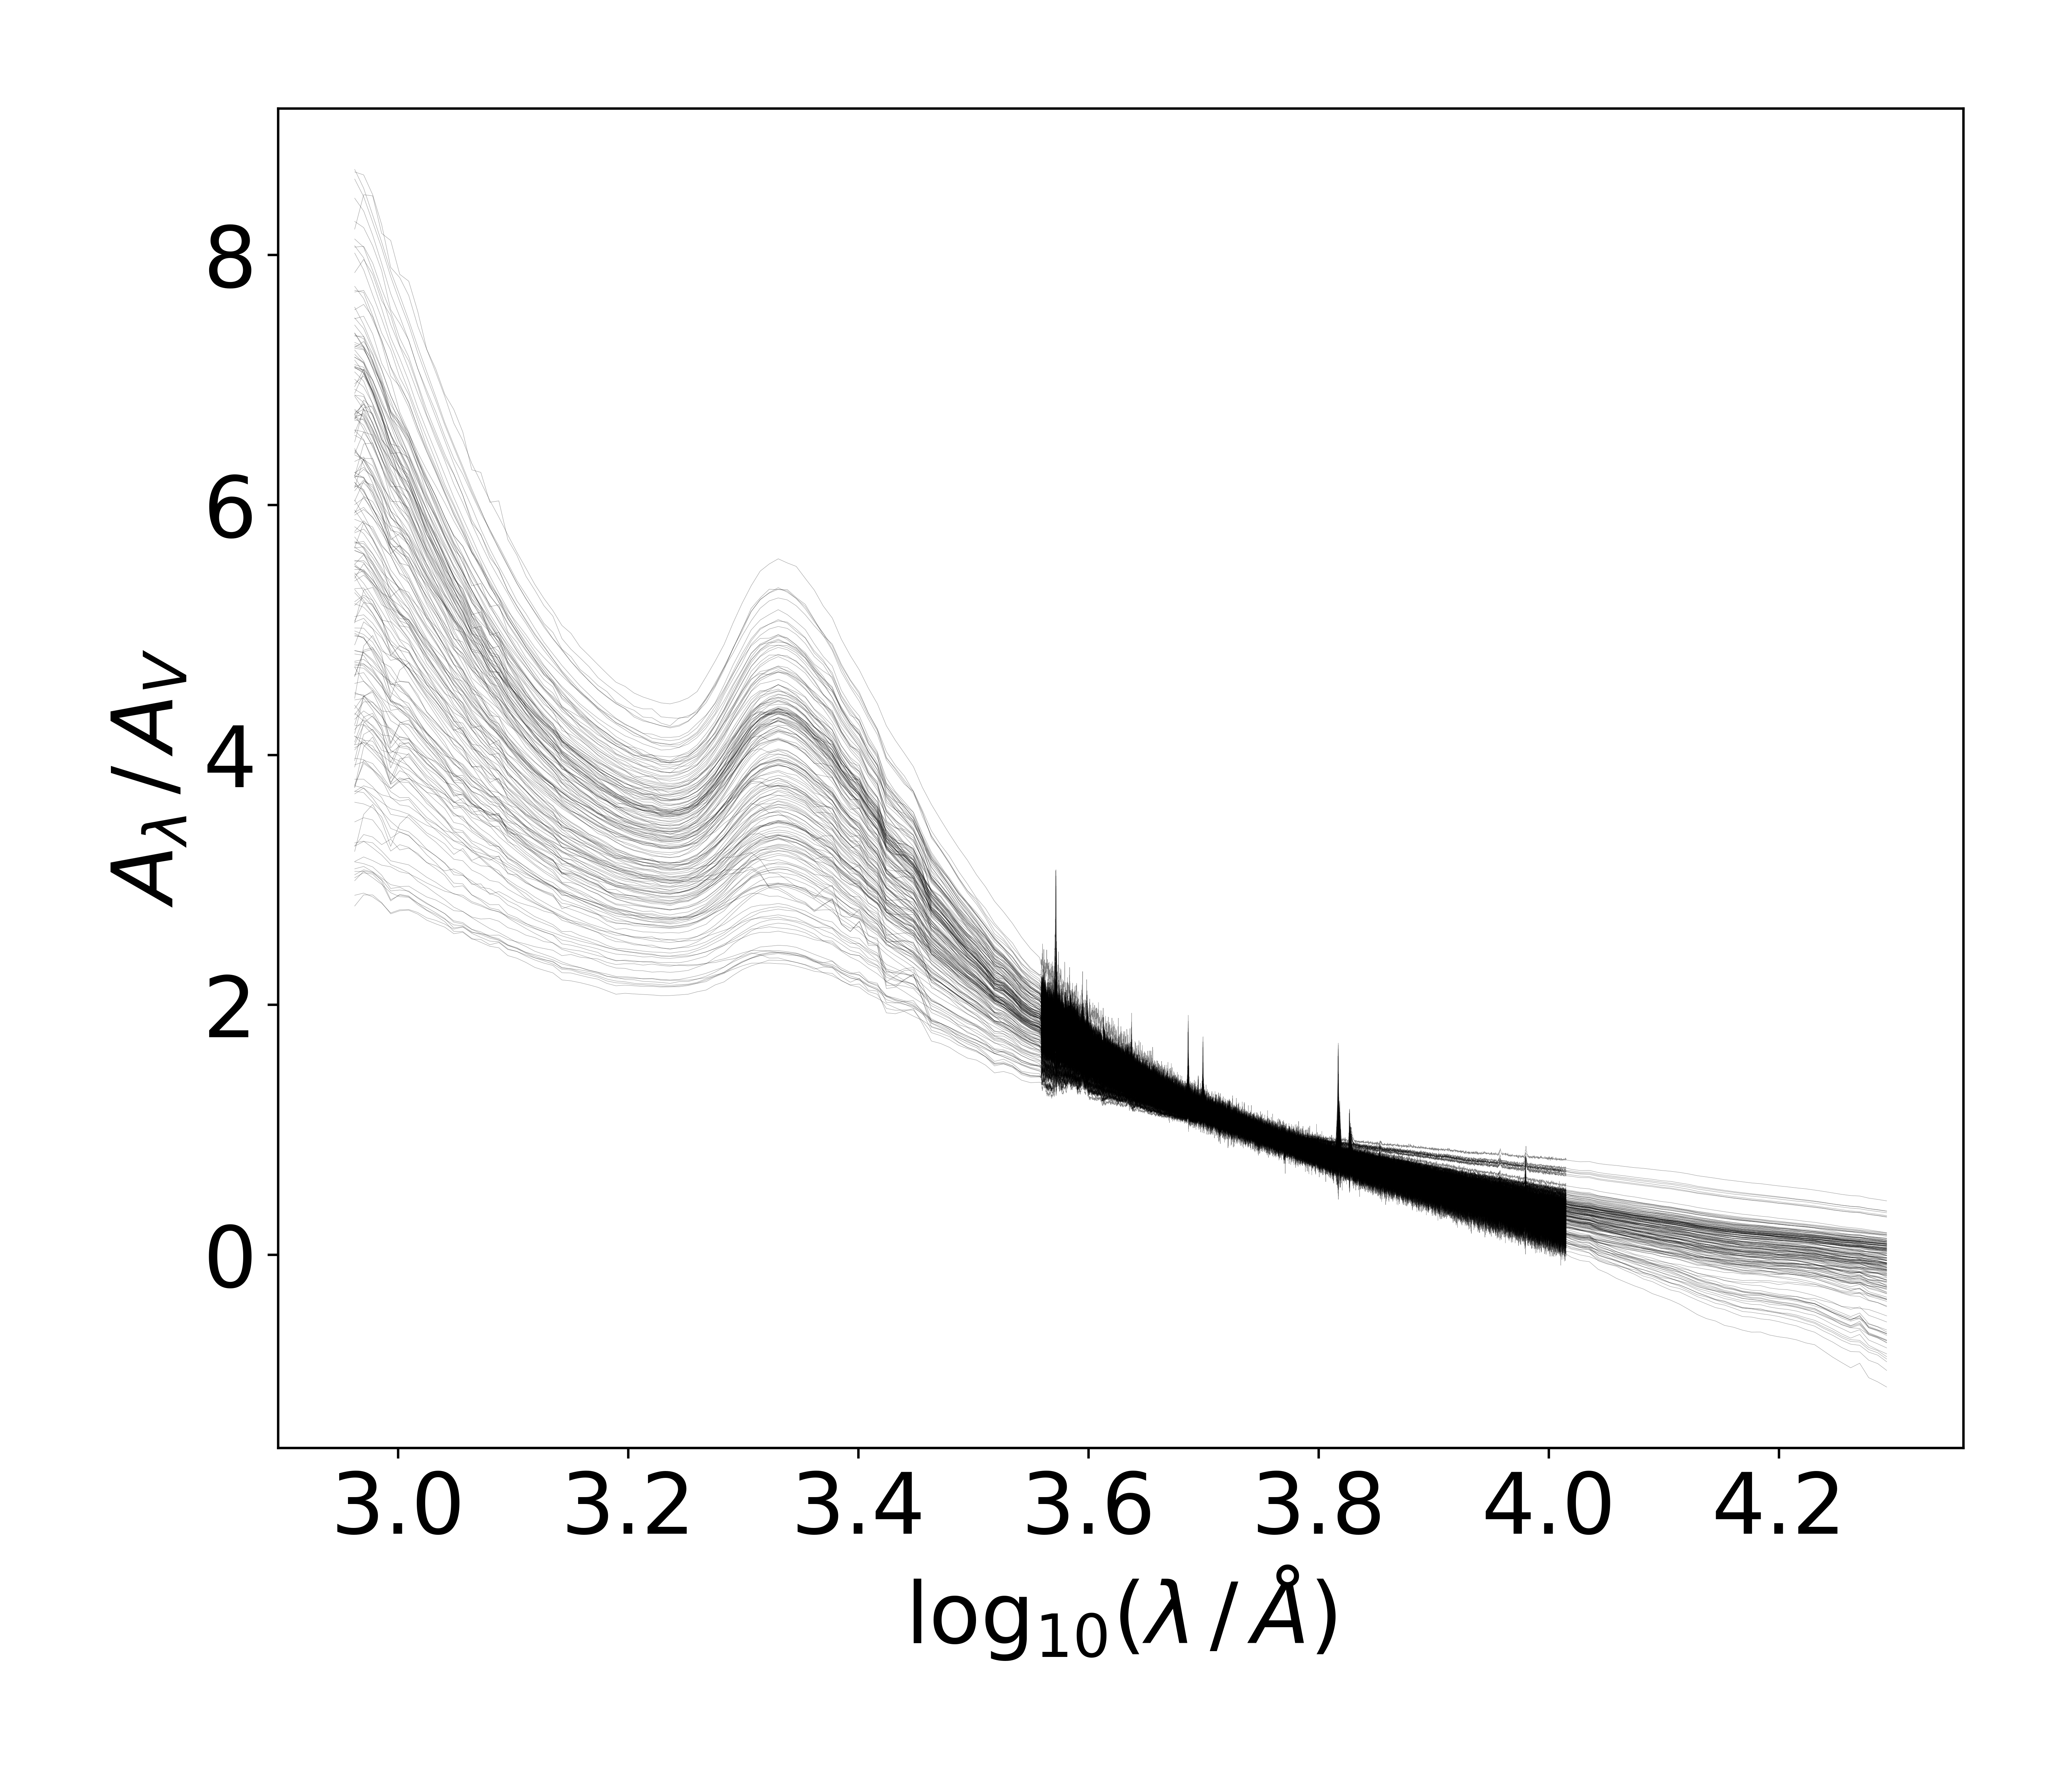
To calculate the energy attenuated by dust, we run each simulated galaxy with no diffuse dust (effectively setting ), and no sub-grid dust from the photo-dissociation regions (PDRs) around young stars (). We then calculate the attenuation as:
| (8) |
For these simulations, this definition is suitable for Å to Å. However, even with , there is still a small amount of intrinsic attenuation and infrared emission coming from the star-forming stellar particles, and the emission contaminates at longer wavelengths. We discussed in Section 3.2 that the attenuation at shorter wavelengths has a negligible effect on the calculated attenuation curves. To compare the shapes of the attenuation curves (i.e. the reddening), we will normalize them to the attenuation at 5500 Å.
Figure 16 shows the spectra and normalized attenuation curves for a single simulated disk galaxy viewed from 10 different orientations, with the face-on orientation shown in blue, the edge-on orientation in red, the no-dust spectrum in black, and intermediate orientations in grey. Looking at the normalized attenuation curves in this figure, we can see that there is significant variation in the shape of the attenuation curves at different viewing orientations.
The left side of Figure 17 shows the attenuation curves of full simulated suite of NIHAO galaxies at all 10 orientations. Red lines correspond to galaxies with total stellar mass below , blue lines correspond to galaxies above this mass but with values less than 0.2, and grey lines correspond to galaxies above this mass and with values above 0.2. The right side of Figure 17 shows the normalized versions of the grey attenuation curves from the left side. Relative to Figure 16, the normalized attenuation curves of Figure 17 show even more variation in shape.
The attenuation curves show a narrow feature around Å, the wavelength of emission, and around other emission lines. These features result from differential attenuation of star forming regions relative to other regions. In both the attenuated and unattenuated spectra, the regions emit the same amount of emission. However, in the attenuated spectra, the emission is attenuated by the surrounding PDR while in the unattenuated spectra, the emission escapes the SF region freely. Because emission is preferentially located close to dust, in particular the sub-grid dust of the PDRs, we see a bump in the attenuation curve at Å. Following this same line of reasoning, we can attribute the other consistent bumps and dips in the attenuation curves to other spectral features associated with either more or less dusty regions.
6.6 Energy Balance
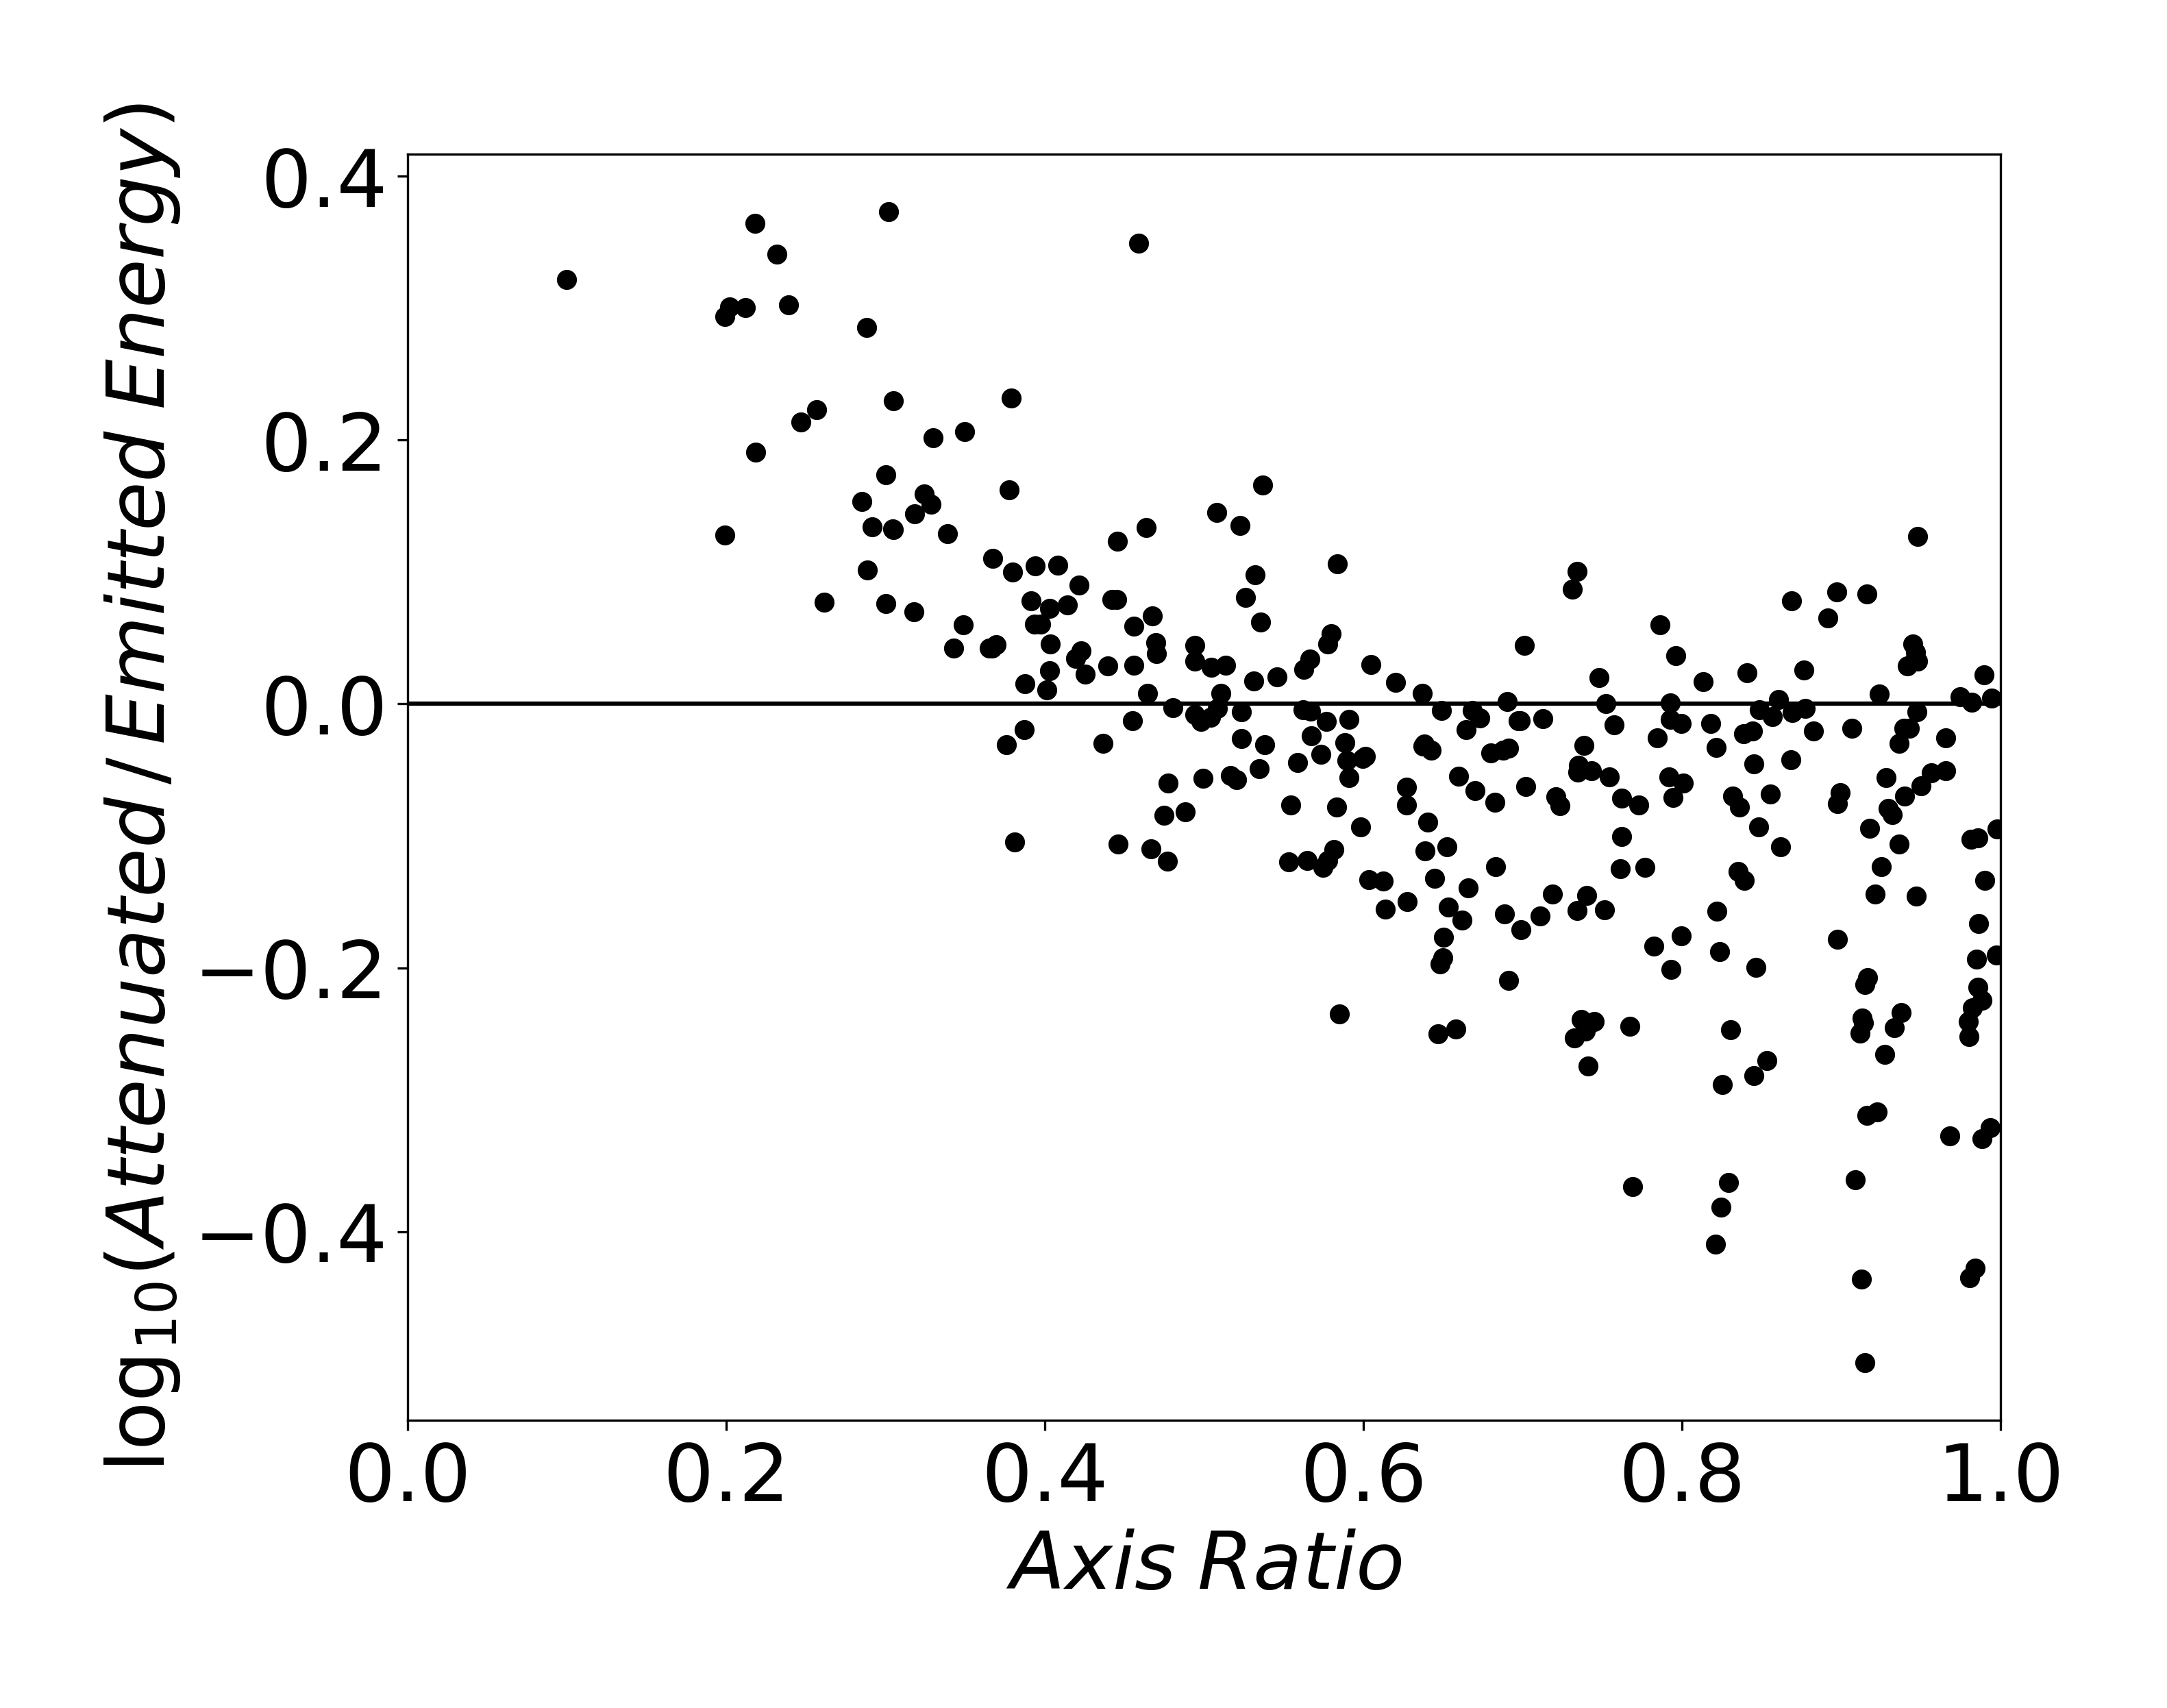
Figure 18 shows the ratio of the energy attenuated and emitted by dust for simulated galaxies with total stellar mass above . Attenuated energy is calculated by integrating the difference between the no-dust and dusty spectra over wavelengths below , and emitted energy is calculated by integrating the difference between the dusty and no-dust spectra over wavelengths above .
Although the total energy (integrated over solid angle) attenuated by dust must equal the total energy reemitted by dust, this requirement does not hold when considering the light received by an observer in a particular direction. At low axis ratios, we can see that there is an excess of attenuated energy relative to emitted energy, and at large axis ratios we see the opposite effect. Qualitatively this is what we should expect, since, relative to a face-on galaxy, the stellar light from an edge-on galaxy will need to travel through more of the dust-filled ISM on average before reaching the observer. In general, we can see that there is strong deviation from perfect energy balance, which is denoted by the horizontal line. This result is in stark opposition to the assumptions made by commonly used SED modeling codes such as Prospector, CIGALE, and MAGPHYS, which impose strict energy balance between dust attenuation and emission.
7 Data Product
To compliment this paper, we publicly release two data files containing our final mock photometry with model parameters and Myrs, with the age smoothing procedure described in section 3.2. All photometric quantities are calculated at a distance of 100 Mpcs. Both data files contain the following information for each simulated galaxy:
-
•
Total stellar mass
-
•
Star-formation rate averaged over the most recent 100 Myrs
-
•
Total dust mass
-
•
Physical size
-
•
Star-formation history (SFH) as a histogram of stellar mass as a function of age resolved by 200 age bins evenly separated in log space
-
•
Chemical evolution history (CEH) as a 2D histogram of stellar mass as a function of age and metallicity resolved by 200x200 age and metallicity bins evenly separated in log space
We draw particular attention to the chemical evolution history (CEH), which can be used to recreate each simulated galaxy’s photometry using your choice of stellar population synthesis (SPS) model. For each orientation of each galaxy, both data files contain the following information:
-
•
Axis ratio (b/a)
-
•
The spatially integrated data file contains the following additional information for each orientation:
-
•
Total energy attenuated and emitted by dust (see Section 6.6 for more details)
-
•
20 spatially integrated broadband photometric bandpasses both with and without dust (FUV, NUV, u, g, r, i, z, J, H, K, W1, W2, W3, W4, m, m, m, m, m, m)
-
•
Spatially integrated high resolution spectra both with and without dust (see Section 3.1 for more details)
-
•
Spatially integrated attenuation curves
The spatially resolved data file contains the following additional information for each orientation:
-
•
20 spatially resolved (500500) broadband photometric bandpasses both with and without dust (FUV, NUV, u, g, r, i, z, J, H, K, W1, W2, W3, W4, m, m, m, m, m, m)
The data product is publicly available at https://github.com/ntf229/NIHAO-SKIRT-Catalog.
8 Summary
By utilizing the radiative transfer software SKIRT, we have created a mock catalog of realistic photometry from the NIHAO galaxy simulation suite. Statistical comparison to observed galactic flux ratios in the local universe has motivated the implementation of sub-grid recipes that mitigate limitations in the temporal and spatial resolution of the simulations (Section 3.2). Using this mock catalog, we have shown that commonly made simplifying assumptions in SED modeling do not hold true when we spatially resolve the interactions between starlight and cosmic dust. Of particular importance, we find that the assumption of energy balance between dust attenuation and emission along an observer’s line of sight can be violated by up to a factor of 3 (Section 6.6). We publicly release our final mock photometry as a data product, which also contains physical properties about each simulated galaxy and viewing orientation (Section 7). Future work will be dedicated to using this mock catalog as a ground truth to determine the accuracy of SED modeling inferences under a variety of modeling choices and assumptions.
References
- Arora et al. (2023) Arora, N., Courteau, S., Stone, C., & Macció, A. V. 2023, MNRAS, doi: 10.1093/mnras/stad1023
- Battisti et al. (2020) Battisti, A. J., da Cunha, E., Grasha, K., & Cosmos Collaboration. 2020, in American Astronomical Society Meeting Abstracts, Vol. 236, American Astronomical Society Meeting Abstracts #236, 110.05
- Blank et al. (2019) Blank, M., Macciò, A. V., Dutton, A. A., & Obreja, A. 2019, MNRAS, 487, 5476, doi: 10.1093/mnras/stz1688
- Blanton et al. (2017) Blanton, M. R., Bershady, M. A., Abolfathi, B., et al. 2017, AJ, 154, 28, doi: 10.3847/1538-3881/aa7567
- Boquien et al. (2019) Boquien, M., Burgarella, D., Roehlly, Y., et al. 2019, A&A, 622, A103, doi: 10.1051/0004-6361/201834156
- Boselli et al. (2010) Boselli, A., Eales, S., Cortese, L., et al. 2010, PASP, 122, 261, doi: 10.1086/651535
- Bundy et al. (2015) Bundy, K., Bershady, M. A., Law, D. R., et al. 2015, ApJ, 798, 7, doi: 10.1088/0004-637X/798/1/7
- Camps & Baes (2020) Camps, P., & Baes, M. 2020, Astronomy and Computing, 31, 100381, doi: 10.1016/j.ascom.2020.100381
- Camps et al. (2016) Camps, P., Trayford, J. W., Baes, M., et al. 2016, MNRAS, 462, 1057, doi: 10.1093/mnras/stw1735
- Camps et al. (2015) Camps, P., Misselt, K., Bianchi, S., et al. 2015, A&A, 580, A87, doi: 10.1051/0004-6361/201525998
- Chabrier (2003) Chabrier, G. 2003, PASP, 115, 763, doi: 10.1086/376392
- Clark et al. (2018) Clark, C. J. R., Verstocken, S., Bianchi, S., et al. 2018, A&A, 609, A37, doi: 10.1051/0004-6361/201731419
- Conroy (2013) Conroy, C. 2013, ARA&A, 51, 393, doi: 10.1146/annurev-astro-082812-141017
- Conroy & Gunn (2010) Conroy, C., & Gunn, J. E. 2010, ApJ, 712, 833, doi: 10.1088/0004-637X/712/2/833
- Conroy et al. (2009) Conroy, C., Gunn, J. E., & White, M. 2009, ApJ, 699, 486, doi: 10.1088/0004-637X/699/1/486
- Conroy et al. (2010) Conroy, C., Schiminovich, D., & Blanton, M. R. 2010, ApJ, 718, 184, doi: 10.1088/0004-637X/718/1/184
- Crain et al. (2015) Crain, R. A., Schaye, J., Bower, R. G., et al. 2015, MNRAS, 450, 1937, doi: 10.1093/mnras/stv725
- Davies et al. (2017) Davies, J. I., Baes, M., Bianchi, S., et al. 2017, PASP, 129, 044102, doi: 10.1088/1538-3873/129/974/044102
- Dutton et al. (2017) Dutton, A. A., Obreja, A., Wang, L., et al. 2017, MNRAS, 467, 4937, doi: 10.1093/mnras/stx458
- Foreman-Mackey et al. (2014) Foreman-Mackey, D., Sick, J., & Johnson, B. 2014, python-fsps: Python bindings to FSPS (v0.1.1), v0.1.1, Zenodo, Zenodo, doi: 10.5281/zenodo.12157
- Groves et al. (2008) Groves, B., Dopita, M. A., Sutherland, R. S., et al. 2008, ApJS, 176, 438, doi: 10.1086/528711
- Hayward & Smith (2015) Hayward, C. C., & Smith, D. J. B. 2015, MNRAS, 446, 1512, doi: 10.1093/mnras/stu2195
- Heyer et al. (2001) Heyer, M. H., Carpenter, J. M., & Snell, R. L. 2001, ApJ, 551, 852, doi: 10.1086/320218
- Jones et al. (2017) Jones, A. P., Köhler, M., Ysard, N., Bocchio, M., & Verstraete, L. 2017, A&A, 602, A46, doi: 10.1051/0004-6361/201630225
- Jonsson et al. (2010) Jonsson, P., Groves, B. A., & Cox, T. J. 2010, MNRAS, 403, 17, doi: 10.1111/j.1365-2966.2009.16087.x
- Kapoor et al. (2021) Kapoor, A. U., Camps, P., Baes, M., et al. 2021, MNRAS, 506, 5703, doi: 10.1093/mnras/stab2043
- Leitherer et al. (1999) Leitherer, C., Schaerer, D., Goldader, J. D., et al. 1999, ApJS, 123, 3, doi: 10.1086/313233
- Leja et al. (2017) Leja, J., Johnson, B. D., Conroy, C., van Dokkum, P. G., & Byler, N. 2017, ApJ, 837, 170, doi: 10.3847/1538-4357/aa5ffe
- Lower et al. (2020) Lower, S., Narayanan, D., Leja, J., et al. 2020, ApJ, 904, 33, doi: 10.3847/1538-4357/abbfa7
- Lupton (1996) Lupton, R. H. 1996, MISC photo-related RHL documents, The Trustees of Princeton University. https://www.astro.princeton.edu/~rhl/photomisc/
- Macciò et al. (2016) Macciò, A. V., Udrescu, S. M., Dutton, A. A., et al. 2016, MNRAS, 463, L69, doi: 10.1093/mnrasl/slw147
- Maller et al. (2009) Maller, A. H., Berlind, A. A., Blanton, M. R., & Hogg, D. W. 2009, ApJ, 691, 394, doi: 10.1088/0004-637X/691/1/394
- Marinacci et al. (2019) Marinacci, F., Sales, L. V., Vogelsberger, M., Torrey, P., & Springel, V. 2019, MNRAS, 489, 4233, doi: 10.1093/mnras/stz2391
- Masters et al. (2010) Masters, K. L., Nichol, R., Bamford, S., et al. 2010, MNRAS, 404, 792, doi: 10.1111/j.1365-2966.2010.16335.x
- Salim & Narayanan (2020) Salim, S., & Narayanan, D. 2020, ARA&A, 58, 529, doi: 10.1146/annurev-astro-032620-021933
- Schaye et al. (2015) Schaye, J., Crain, R. A., Bower, R. G., et al. 2015, MNRAS, 446, 521, doi: 10.1093/mnras/stu2058
- Shen et al. (2010) Shen, S., Wadsley, J., & Stinson, G. 2010, MNRAS, 407, 1581, doi: 10.1111/j.1365-2966.2010.17047.x
- Stinson et al. (2013) Stinson, G. S., Brook, C., Macciò, A. V., et al. 2013, MNRAS, 428, 129, doi: 10.1093/mnras/sts028
- Trayford et al. (2017) Trayford, J. W., Camps, P., Theuns, T., et al. 2017, MNRAS, 470, 771, doi: 10.1093/mnras/stx1051
- Trčka et al. (2020) Trčka, A., Baes, M., Camps, P., et al. 2020, MNRAS, 494, 2823, doi: 10.1093/mnras/staa857
- Wadsley et al. (2017) Wadsley, J. W., Keller, B. W., & Quinn, T. R. 2017, MNRAS, 471, 2357, doi: 10.1093/mnras/stx1643
- Wang et al. (2015a) Wang, L., Dutton, A. A., Stinson, G. S., et al. 2015a, MNRAS, 454, 83, doi: 10.1093/mnras/stv1937
- Wang et al. (2015b) —. 2015b, MNRAS, 454, 83, doi: 10.1093/mnras/stv1937