Daniel Kvak et al.
11institutetext: Carebot s.r.o., Prague, Czech Republic
11email: daniel.kvak@carebot.com
22institutetext: Faculty of Medicine, Masaryk University, Brno, Czech Republic
33institutetext: Institute of Biostatistics and Analysis, s.r.o., Brno, Czech Republic
44institutetext: Havířov Hospital and Clinic, Havířov, Czech Republic
55institutetext: Faculty of Mathematics and Physics, Charles University, Prague, Czech Republic
66institutetext: Faculty of Nuclear Sciences and Physical Engineering, Czech Technical University, Prague, Czech Republic
77institutetext: Faculty of Electrical Engineering, Czech Technical University, Prague, Czech Republic
Can Deep Learning Reliably Recognize Abnormality Patterns on Chest X-rays?
A Multi-Reader Study Examining One Month of AI Implementation in Everyday Radiology Clinical Practice
Abstract
In this study, we utilize a deep-learning-based automatic detection algorithm (DLAD, Carebot AI CXR) to detect and localize seven specific radiological findings (atelectasis (ATE), consolidation (CON), pleural effusion (EFF), pulmonary lesion (LES), subcutaneous emphysema (SCE), cardiomegaly (CMG), pneumothorax (PNO)) on chest X-rays (CXR). We collected 956 CXRs and compared the performance of the DLAD with that of six individual radiologists who evaluated the images in a simulated hospital setting. The proposed DLAD achieved high sensitivity (ATE 1.000 (0.624-1.000), CON 0.864 (0.671-0.956), EFF 0.953 (0.887-0.983), LES 0.905 (0.715-0.978), SCE 1.000 (0.366-1.000), CMG 0.837 (0.711-0.917), PNO 0.875 (0.538-0.986)), even when compared to the radiologists (LOWEST: ATE 0.000 (0.000-0.376), CON 0.182 (0.070-0.382), EFF 0.400 (0.302-0.506), LES 0.238 (0.103-0.448), SCE 0.000 (0.000-0.634), CMG 0.347 (0.228-0.486), PNO 0.375 (0.134-0.691), HIGHEST: ATE 1.000 (0.624-1.000), CON 0.864 (0.671-0.956), EFF 0.953 (0.887-0.983), LES 0.667 (0.456-0.830), SCE 1.000 (0.366-1.000), CMG 0.980 (0.896-0.999), PNO 0.875 (0.538-0.986)). The findings of the study demonstrate that the suggested DLAD holds potential for integration into everyday clinical practice as a decision support system, effectively mitigating the false negative rate associated with junior and intermediate radiologists.
keywords:
Artificial Intelligence; Computer-Aided Detection; Deep Learning; Chest X-ray; Radiology.1 Introduction
Despite advances in imaging technologies such as computed tomography (CT) and magnetic resonance imaging (MRI), X-ray remains a key diagnostic method thanks to its affordability, rapid scanning time, and widespread use across hospitals. Chest X-ray (CXR) is used for routine health check-ups, pre-operative examinations, screening programs, and diagnosis of cardiopulmonary diseases. However, analysis of chest radiographs can be challenging as it requires careful investigation of complex structures, there is a risk of overlooking abnormalities, and changes may appear similar in different pathologies or one pathology may show different features. This leads to the potential for errors, with Donald & Barnard 2012 [3] reporting that up to 22% of all diagnostic radiological errors are made when interpreting chest radiographs.
2 Background
Computer-aided detection (CAD) applications offer a potential solution to address the challenges in medical diagnosis by assisting physicians in improving accuracy and efficiency. The advancement of machine learning (ML) techniques in biomedical imaging has facilitated the transition of CAD tools from research settings to clinical applications. Approved systems utilizing artificial intelligence (AI) and deep learning (DL) methods have undergone validation and are expected to undergo further enhancements. Notably, DL-based applications have demonstrated promising outcomes in medical image analysis, such as the detection of diabetic retinopathy in eye images [20], segmentation of breast cancer [2], and identification of metastases in pathological samples [7].
In our previous studies, we have explored deep learning algorithms for the detection of suspicious lung parenchymal lesions [13] and COVID-19 disease [12] on CXRs. However, the clinical utility of these algorithms was limited as CXRs may exhibit various abnormalities beyond malignant nodules or pneumonia. To ensure the usefulness of a CAD system, it should be capable of processing CXRs presenting a range of abnormalities, particularly the prevalent chest diseases found within the population.
2.1 Literature Review Methodology
A comprehensive literature search was conducted with the objective of gathering pertinent clinical data pertaining to the medical device under investigation. The primary goal was to provide an overview of the current state of the art, including a detailed description of the clinical context and identification of potential risks associated with the device. The search encompassed both positive and negative findings to ensure a comprehensive evaluation of the proposed DLAD.
| Database | Keywords |
|
|
||||
|---|---|---|---|---|---|---|---|
| PubMed |
|
537 | 15 |
For analysis of the related works, we utilized the PubMed database as our primary source, employing specific keywords such as ”artificial intelligence”, ”deep learning”, ”detection”, ”chest x-ray”, and ”chest radiograph” (Table 1). Considering the limitations and lack of reliability associated with publicly available datasets [4] for constructing robust clinical models [17], we excluded studies that relied on these datasets for training or testing purposes. From a total of 537 relevant studies, 15 studies involving devices that have successfully undergone certification according to Regulation (EU) 2017/745 of the European Parliament and of the Council of 5 April 2017 on medical devices were selected for analysis, following the guidelines of MEDDEV 2.7/1 rev. 4.
2.2 Related Works
A study conducted by Ahn et al. 2022 [1] assessed the diagnostic accuracy of detecting four specific findings: pneumonia, pulmonary nodule, pleural effusion, and pneumothorax. Another commercially available computer-aided detection (CAD) system was utilized by Park et al. 2020 [18] to detect multiple classes of lesions, including nodules/mass, interstitial opacity, pleural effusion, and pneumothorax. Singh et al. 2018 [21] focused on the detection and analysis of various abnormalities such as cardiac shadow enlargement, pleural effusion, pulmonary opacities, and hilum prominence. The detection of pulmonary diseases was also addressed in the study by Sung et al. 2021 [22]. Jones et al. 2021 [8] evaluated the performance of a deep learning-based CAD system in detecting acute findings. Hwang et al. 2019 (a) [5] presented a deep learning-based CAD system for classifying normal versus abnormal findings associated with lung cancer, active pulmonary tuberculosis, pneumonia, or pneumothorax. Kim et al. 2021 [10] focused on the sensitivity of the CAD system in detecting abnormal findings. Another study by Hwang et al. 2019 (b) [5] specifically targeted the detection of active tuberculosis, followed by studies conducted by Lee et al. 2021 [14] and Nash et al. 2020 [16]. Qin et al. 2019 [19] evaluated tuberculosis detection in the context of identifying TB-related abnormalities and comparing the performance of three different deep learning-based CAD systems. Jang et al. 2020 [6] focused solely on the detection of pneumonia using a deep learning-based CAD system. The reproducibility of test-retest for the detection of pulmonary nodules was analyzed by Kim et al. 2020 [9], and this topic was also addressed in the studies by Koo et al. 2021 [11] and Nam et al. 2019 [15]. In studies employing a multi-reader design, specifically comparing general practitioners (GPs) with radiologists, it was found that the use of the algorithm improved the efficiency of reporting findings, thereby enhancing physician performance, as concluded by multiple studies.
3 Software
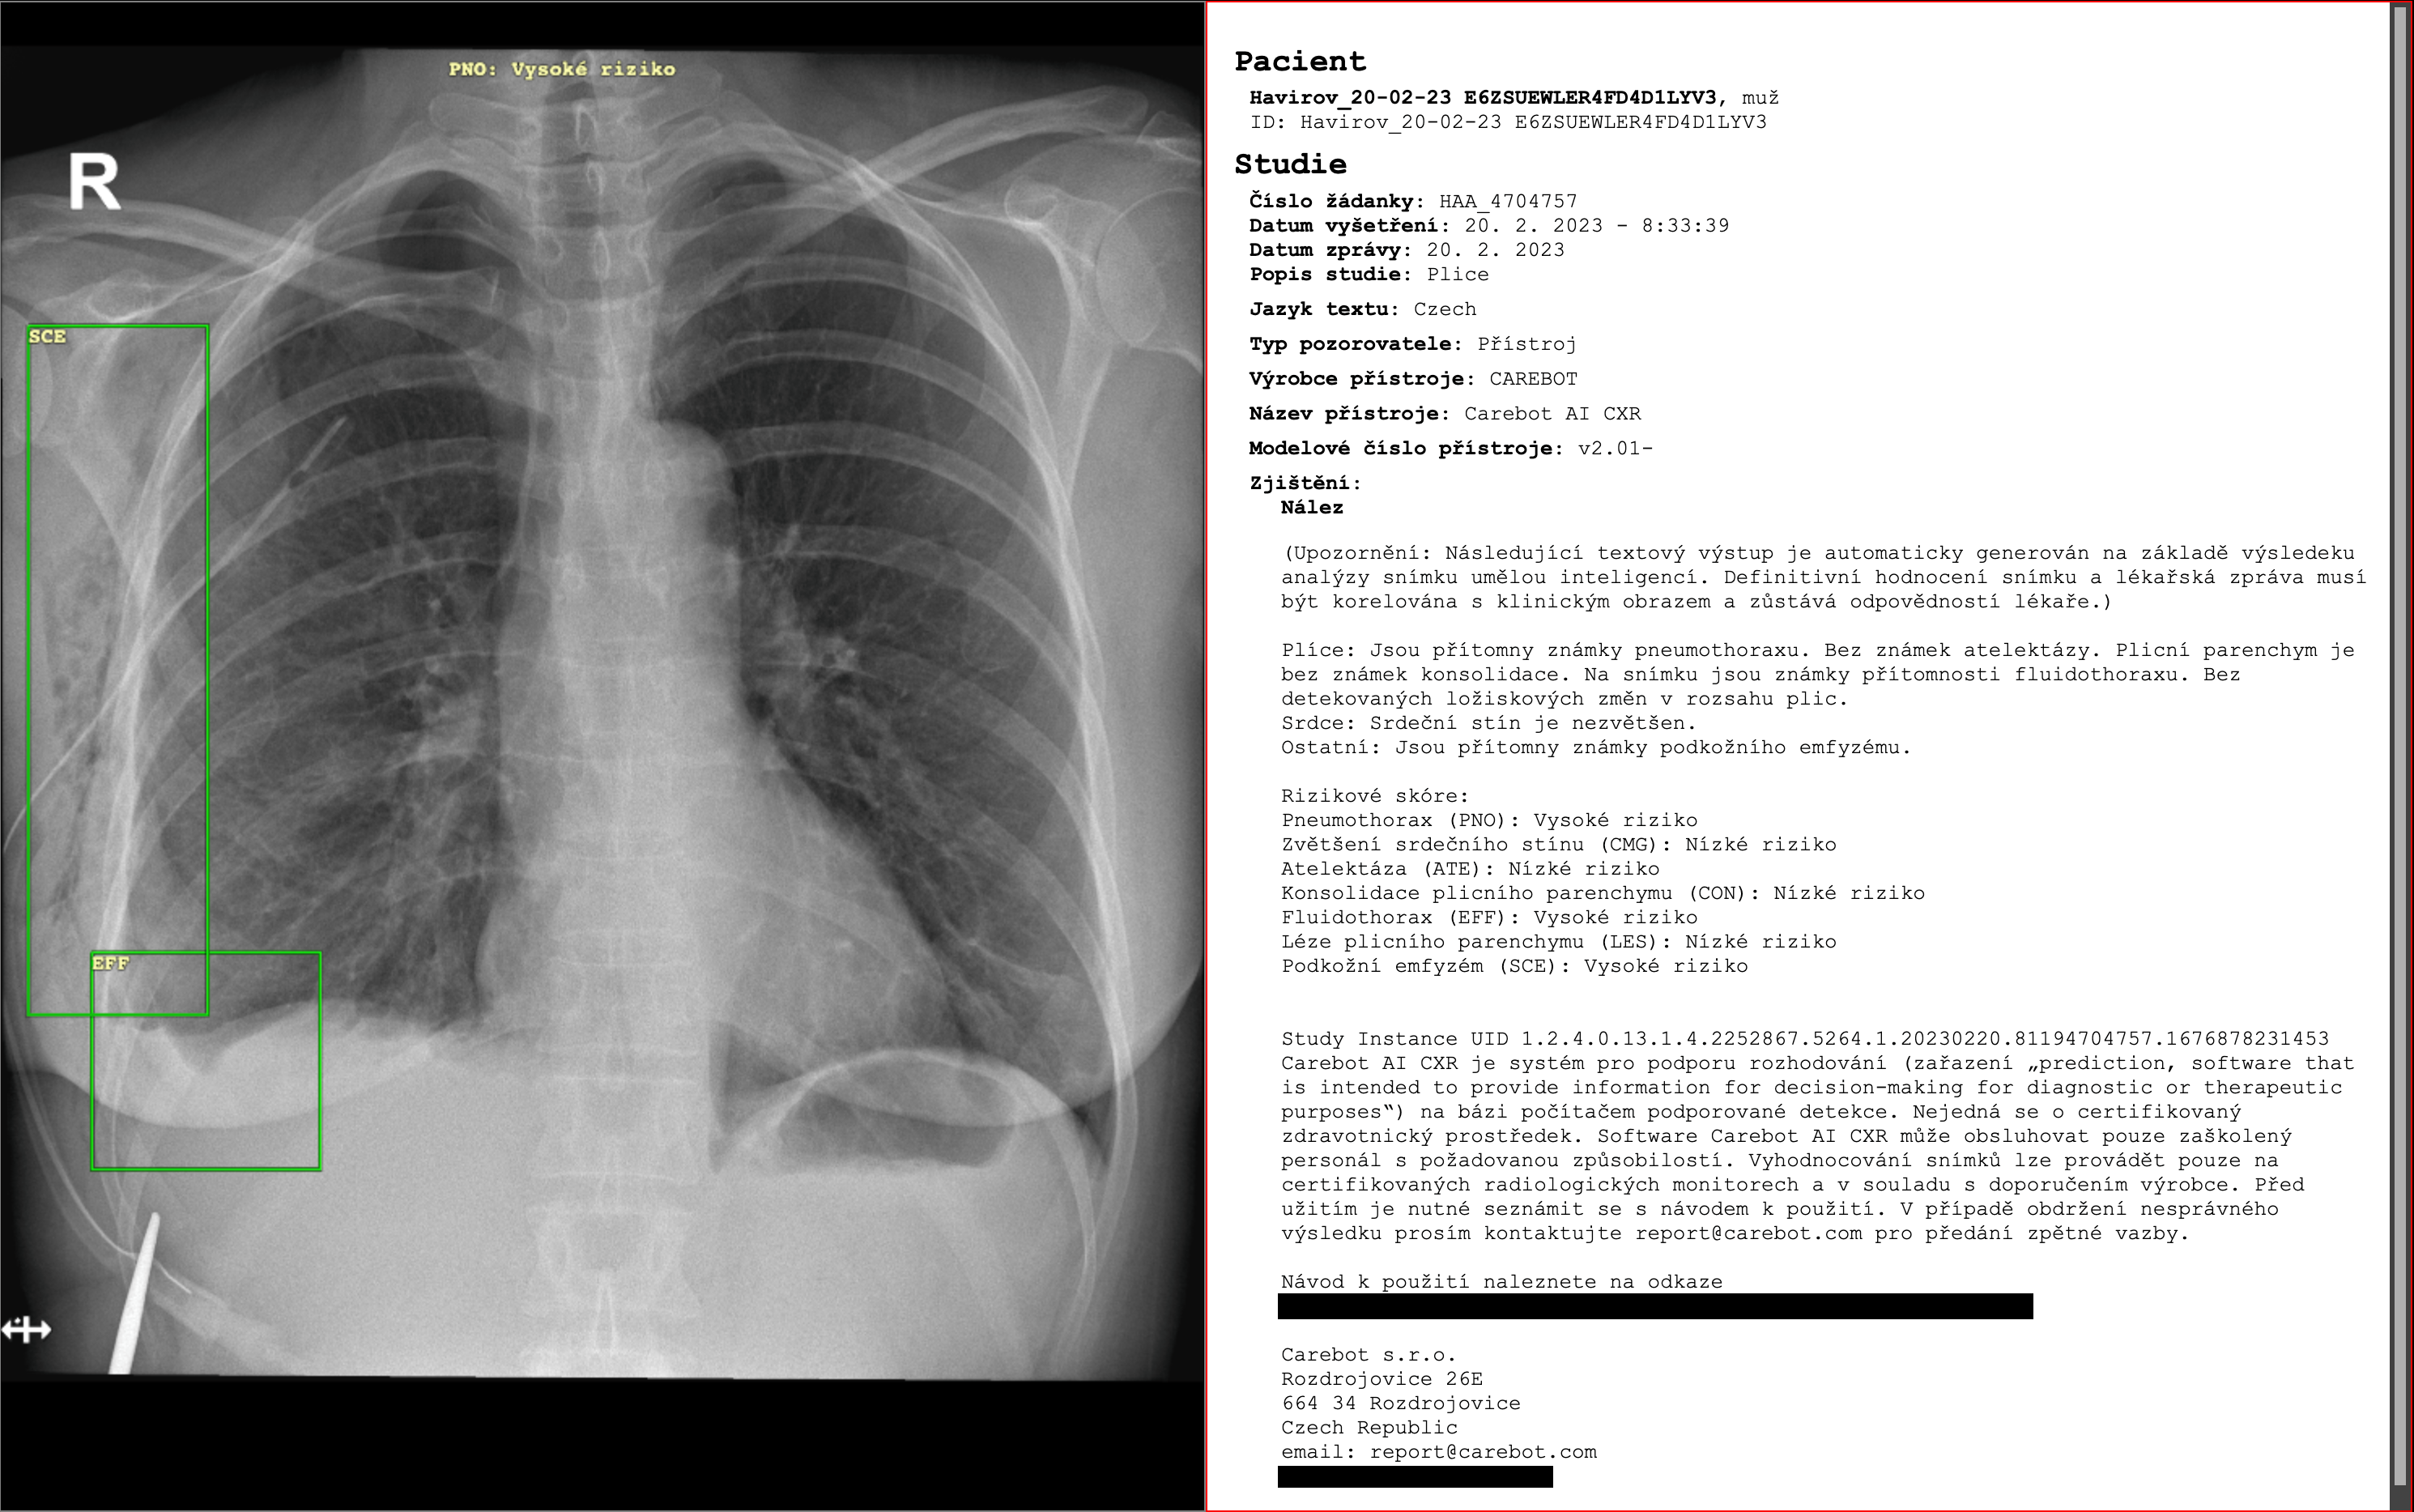
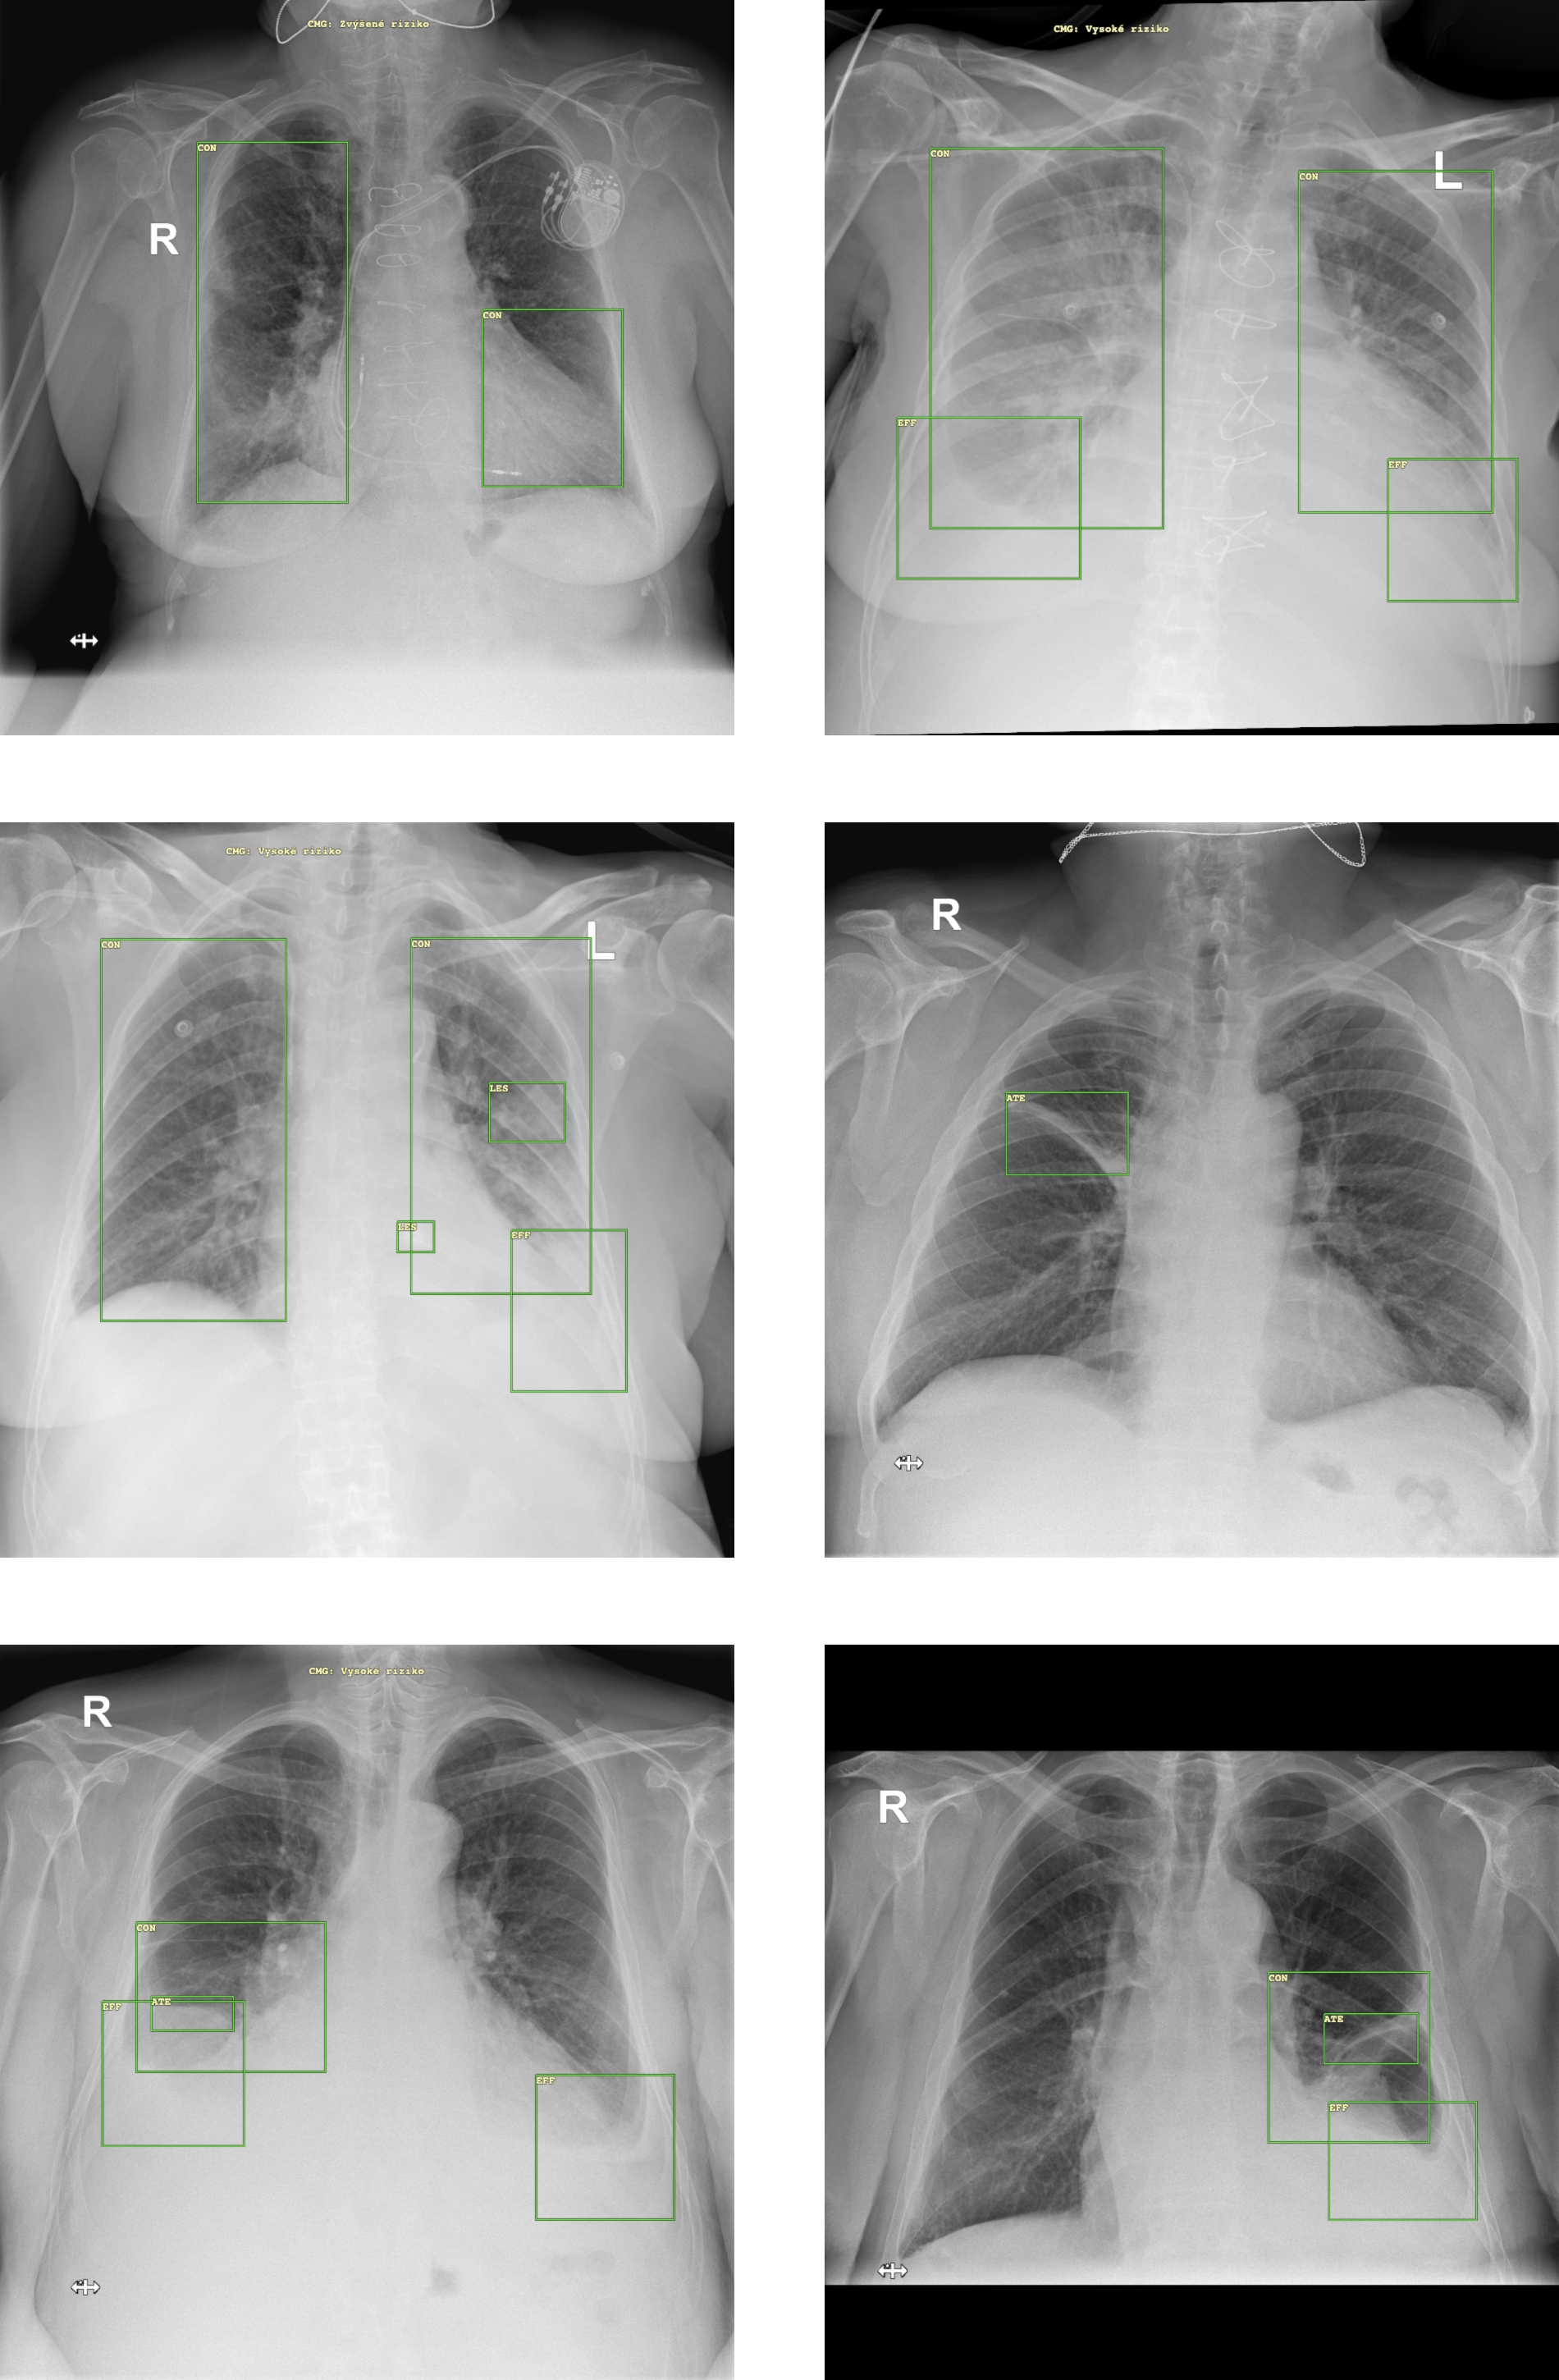
The proposed DLAD (Carebot AI CXR, Figure 1) is a deep learning-based medical device designed to assist radiologists in interpreting chest X-ray images acquired in anteroposterior (AP) or posteroanterior (PA) projection. By employing advanced deep learning algorithms, this solution enables automatic detection of abnormal findings by analyzing visual patterns associated with specific conditions. The targeted abnormalities include atelectasis (ATE), consolidation (CON), pleural effusion (EFF), pulmonary lesion (LES), subcutaneous emphysema (SCE), cardiomegaly (CMG), and pneumothorax (PNO). The DLAD functions as a prediction algorithm complemented by various application peripherals, such as web-based communication tools, DICOM file conversion capabilities, and storage and reporting libraries supporting both DICOM Structured Report and DICOM Presentation State formats.
3.1 Training Data
A total of chest X-rays with established ground truth from sites in Europe, Asia, and North America were used in the development of the DLAD. The complete training dataset includes images with visually confirmed pathological findings, and images with no or insignificant abnormal pathological findings. Chest radiographs were taken in posteroanterior (PA) or anteroposterior (AP) projection. As the images were obtained from the contacted centers in an anonymized form without additional metadata, the manufacturer of the DLAD does not have knowledge of the patients’ history.
4 Methodology
The collected X-ray images were subjected to the proposed DLAD (Carebot AI CXR) for analysis. Subsequently, the DLAD’s performance was compared with the standard clinical practice, where radiologists assessed the CXR images in the simulated hospital setting with access to standard viewing tools (e.g., pan, zoom, WW/WL) and were given an unlimited amount of time to complete the review. Each radiologist determined the presence or absence of 7 indicated radiological findings, including atelectasis (ATE), consolidation (CON), pleural effusion (EFF), pulmonary lesion (LES), subcutaneous emphysema (SCE), cardiomegaly (CMG), and pneumothorax (PNO).
4.1 Data Source
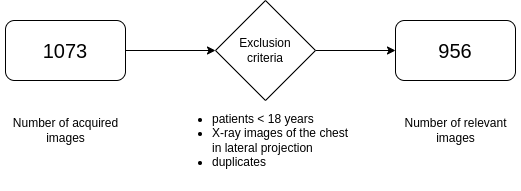
In the period between October 18th, 2022, and November 17th, 2022, anonymized chest X-ray images of patients were collected at the Radiodiagnostic Department of the Havířov Hospital, p.o. The collection process involved utilizing the CloudPACS imaging and archiving system provided by OR-CZ spol. s r.o. A total of 1,073 chest X-rays were acquired within the specified period at the department. The data collection remained intact and unaffected throughout the testing phase, ensuring the integrity of the dataset. The collected sample accurately represents the prevalence of findings within the observed population. After excluding ineligible studies such as X-rays from patients under 18 years of age, lateral projection X-rays, and scans of insufficient quality (Figure 2), a total of 956 relevant CXRs were identified for further assessment.
4.2 Ground Truth
To confirm the presence or absence of a finding on the chest X-ray, a 100% consensus of two highly experienced, board-certified radiologists was required to establish the ground truth (Table 2). The agreement was observed at the level of individual indications, i.e., disagreement in the evaluation of one finding was not taken into account for the inclusion of an image in case of an agreement for another finding.
Ground truth ID Experience #c1235 Head of local radiology department, >20 years of experience, board-certified #24a8d Head of the radiology department of a medium-sized hospital, >20 years of experience, board-certified
4.3 Objectives
The primary objective is to evaluate the performance parameters of the proposed DLAD (Carebot AI CXR) in comparison to individual radiologists.
4.4 Statistical Analysis
The performance of DLAD was conducted using various statistical measures. These measures included sensitivity ensitivity (Se) and specificity (Sp), positive (PLR) and negative likelihood ratio (NLR), and positive (PPV) and negative predictive value (NPV). Sensitivity represents the rate of true positive cases, while specificity represents the rate of false positive cases. The relationship between sensitivity and specificity is expressed by the formulas PLR = Se/(1-Sp) and NLR = (1-Se)/Sp. The likelihood ratios (LRs) solely depend on sensitivity and specificity and are equivalent to the relative risk. It is desirable to have higher PLR and lower NLR values. Predictive values (PVs) indicate the clinical accuracy of the diagnostic test and depend on sensitivity, specificity, and the prevalence of the disease in the population. In this study, a paired design was employed, where all images were evaluated by both the DLAD system and individual radiologists. The results were then compared against the ground truth.
To address the primary objective, which involved comparing DLAD performance with individual radiologists, the aforementioned parameters were estimated and statistically compared using confidence intervals (CI) and p-Values. The statistical comparison procedure consisted of two steps. Firstly, a global hypothesis test was conducted to determine whether there were significant differences between DLAD and radiologists in terms of both sensitivity and specificity (e.g. and vs. and/or ). If the global hypothesis test yielded a significant result, individual hypothesis tests were performed. These tests compared sensitivity and specificity separately (e.g. and .
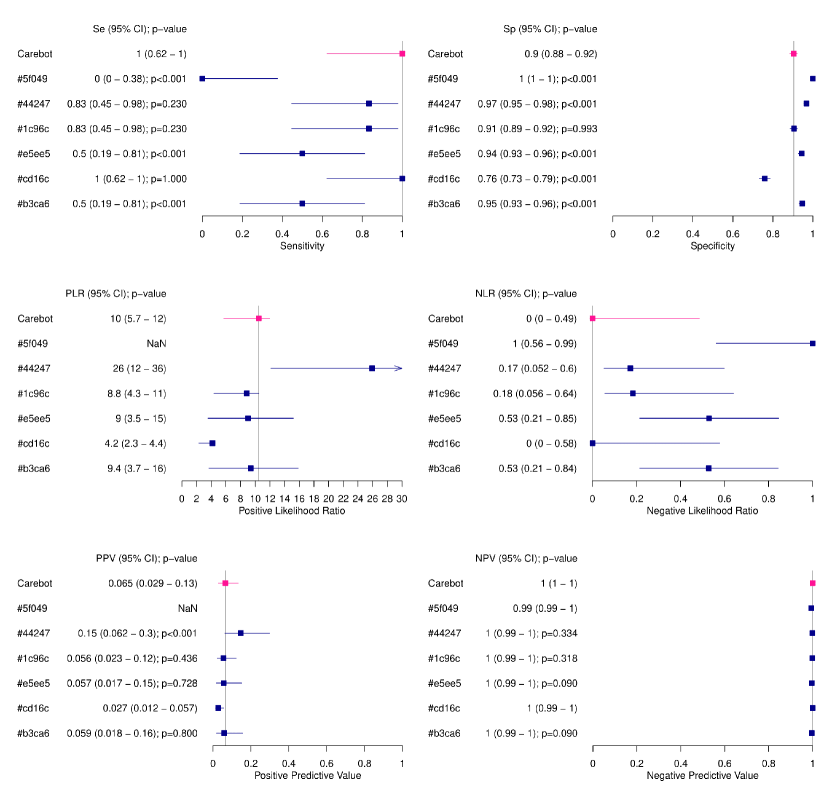
Additionally, a multiple comparison method, such as McNemar with continuity correction for Se and Sp, Holm method for LRs, and weighted generalized score statistics for PVs, was applied to control the overall error rate . Differences among radiologists and DLAD were graphically presented using forest plots. All tests were performed as two-tailed tests at the 5% significance level.
4.5 Demographic Data and Prevalence of Individual Findings
| Patient’s Sex | n | % |
|---|---|---|
| Female | 480 | 50.21 |
| Male | 474 | 49.58 |
| Unspecified | 2 | 0.21 |
| Patient’s Age | ||
| 18-30 | 58 | 6.07 |
| 31-50 | 163 | 17.05 |
| 51-70 | 366 | 38.28 |
| 70+ | 369 | 38.60 |
| Finding | n / N (prevalence) |
|---|---|
| Atelectasis (ATE) | 6 / 908 (0.7%) |
| Consolidation (CON) | 22 / 830 (2.7%) |
| Pleural effusion (EFF) | 85 / 909 (9.4%) |
| Lesion of the lung parenchyma (LES) | 21 / 901 (2.3%) |
| Subcutaneous emphysema (SCE) | 2 / 953 (0.2%) |
| Cardiomegaly (CMG) | 49 / 865 (5.7%) |
| Pneumothorax (PNO) | 8 / 947 (0.8%) |
ID Experience #5f049 Junior radiologist, <2 years of experience, without board-certification #44247 Junior radiologist, <2 years of experience, without board-certification #1c96c Mid-level radiologist, <5 years of experience, without board-certification #e5ee5 Mid-level radiologist, <5 years of experience, without board-certification #cd16c Experienced radiologist, >5 years of experience, board-certified #b3ca6 Experienced radiologist, >5 years of experience, board-certified
5 Results
5.1 Atelectasis
ID Se LSe USe Sp LSp USp Global p-Value Se p-Value Sp p-Value DLAD 1.000 0.624 1.000 0.905 0.884 0.922 #5f049 0.000 0.000 0.376 1.000 0.996 1.000 0.000 0.000 0.000 #44247 0.833 0.446 0.979 0.968 0.954 0.978 0.000 0.230 0.000 #1c96c 0.833 0.446 0.979 0.906 0.885 0.923 0.546 0.230 0.993 #e5ee5 0.500 0.188 0.812 0.945 0.928 0.958 0.000 0.000 0.000 #cd16c 1.000 0.624 1.000 0.759 0.731 0.786 1.000 1.000 0.000 #b3ca6 0.500 0.188 0.812 0.947 0.930 0.960 0.000 0.000 0.000 ID PLR LPLR UPLR NLR LNLR UNLR Global p-Value PLR p-Value NLR p-Value DLAD 10.49 5.68 11.95 0.000 0.000 0.485 #5f049 1.000 0.561 0.993 #44247 25.92 12.13 35.83 0.172 0.052 0.600 #1c96c 8.84 4.35 10.51 0.184 0.056 0.641 #e5ee5 9.02 3.55 15.20 0.529 0.213 0.846 #cd16c 4.16 2.30 4.35 0.000 0.000 0.579 #b3ca6 9.40 3.69 15.87 0.528 0.213 0.844 ID PPV LPPV UPPV NPV LNPV UNPV Global p-Value PPV p-Value NPV p-Value DLAD 0.065 0.029 0.134 1.000 0.995 1.000 #5f049 0.993 0.986 0.997 #44247 0.147 0.062 0.299 0.999 0.994 1.000 0.043 0.000 0.334 #1c96c 0.056 0.023 0.122 0.999 0.993 1.000 0.604 0.436 0.318 #e5ee5 0.057 0.017 0.152 0.996 0.990 0.999 0.080 0.728 0.090 #cd16c 0.027 0.012 0.057 1.000 0.995 1.000 #b3ca6 0.059 0.018 0.157 0.996 0.990 0.999 0.077 0.800 0.090
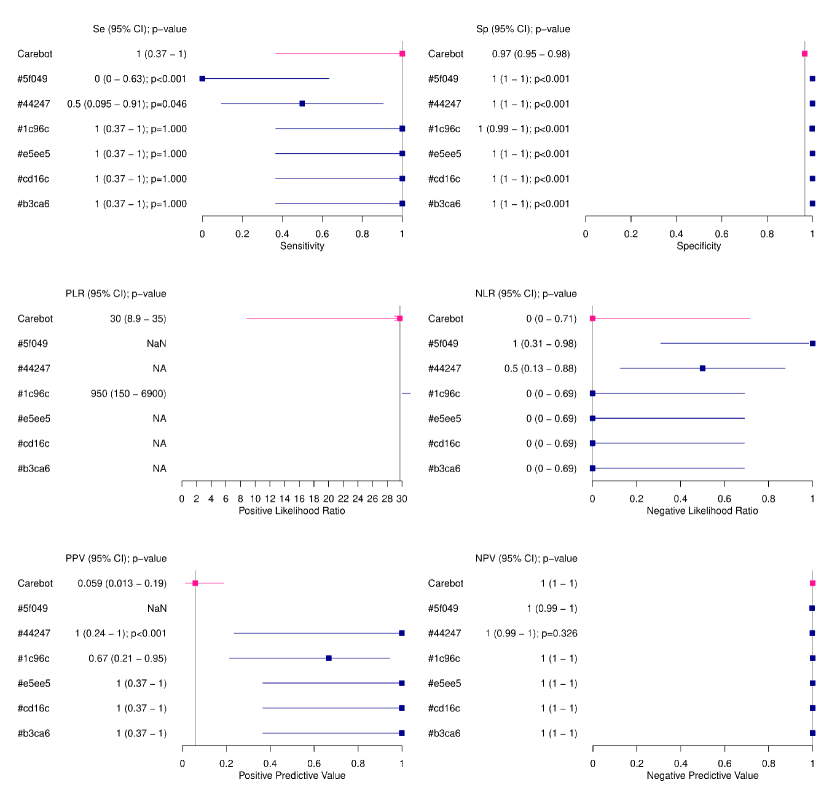
The atelectasis (ATE) has a low prevalence of a confirmed finding (prevalence: 0.7%). The DLAD identified all positive cases as ATE+, achieving sensitivity (Se) of 1.000 (0.624-1.000). Additionally, the DLAD predicted 86 CXRs as ATE+ that were actually ATE-, resulting in specificity (Sp) of 0.905 (0.884-0.922). Considering the low prevalence, the reliability of the results is limited. However, the DLAD still outperformed the radiologists, although some radiologists exhibited higher Sp at the expense of lower Se. Due to the rarity of the diagnoses, a comparison of likelihood ratios was not possible, and certain statistical measures could not be estimated.
5.2 Consolidation
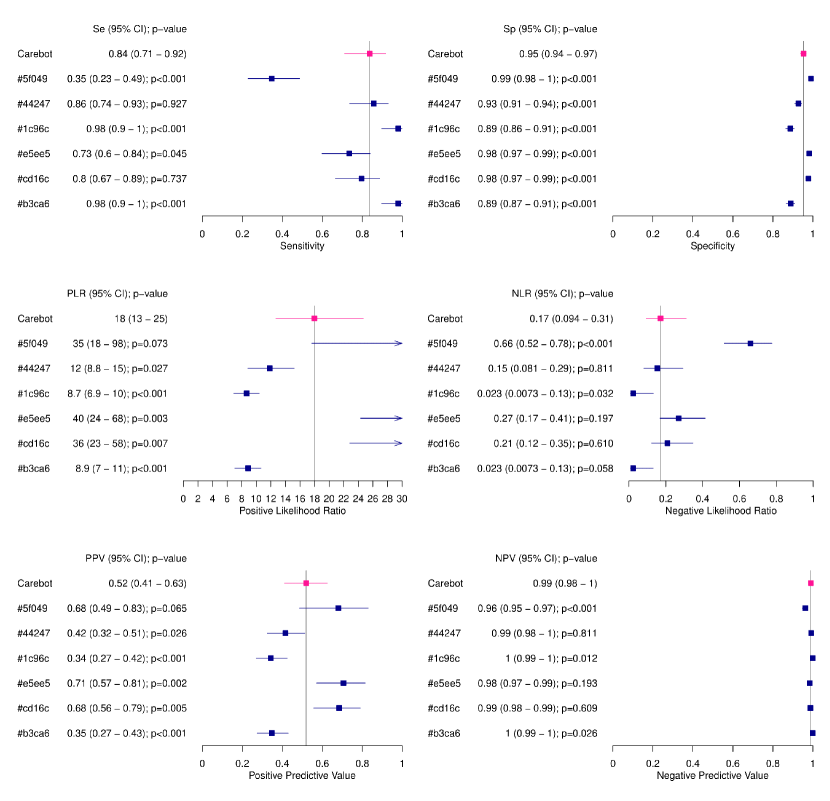
ID Se LSe USe Sp LSp USp Global p-Value Se p-Value Sp p-Value DLAD 0.864 0.671 0.956 0.854 0.828 0.877 #5f049 0.182 0.070 0.382 0.998 0.991 0.999 0.000 0.000 0.000 #44247 0.545 0.347 0.731 0.868 0.843 0.889 0.019 0.000 0.468 #1c96c 0.545 0.347 0.731 0.990 0.981 0.995 0.000 0.000 0.000 #e5ee5 0.864 0.671 0.956 0.979 0.967 0.987 0.000 1.000 0.000 #cd16c 0.909 0.726 0.979 0.855 0.829 0.878 0.590 0.295 0.994 #b3ca6 0.500 0.307 0.693 0.975 0.962 0.984 0.000 0.000 0.000 ID PLR LPLR UPLR NLR LNLR UNLR Global p-Value PLR p-Value NLR p-Value DLAD 5.91 4.26 6.93 0.160 0.066 0.406 #5f049 73.45 20.80 567.33 0.820 0.607 0.921 0.000 0.002 0.002 #44247 4.12 2.56 5.75 0.524 0.315 0.753 0.088 0.115 0.030 #1c96c 55.09 26.57 124.66 0.459 0.277 0.659 0.000 0.000 0.054 #e5ee5 41.05 24.40 64.60 0.139 0.058 0.354 0.000 0.000 0.838 #cd16c 6.28 4.61 7.33 0.106 0.039 0.344 0.603 0.600 0.319 #b3ca6 20.20 11.03 35.69 0.513 0.318 0.708 0.000 0.000 0.053 ID PPV LPPV UPPV NPV LNPV UNPV Global p-Value PPV p-Value NPV p-Value DLAD 0.139 0.090 0.206 0.996 0.988 0.999 #5f049 0.667 0.305 0.908 0.978 0.966 0.986 0.000 0.000 0.001 #44247 0.101 0.058 0.167 0.986 0.974 0.993 0.055 0.115 0.022 #1c96c 0.600 0.388 0.782 0.988 0.978 0.993 0.000 0.000 0.044 #e5ee5 0.528 0.370 0.680 0.996 0.989 0.999 0.000 0.000 0.838 #cd16c 0.146 0.096 0.214 0.997 0.990 0.999 0.604 0.600 0.316 #b3ca6 0.355 0.210 0.529 0.986 0.976 0.992 0.000 0.000 0.041
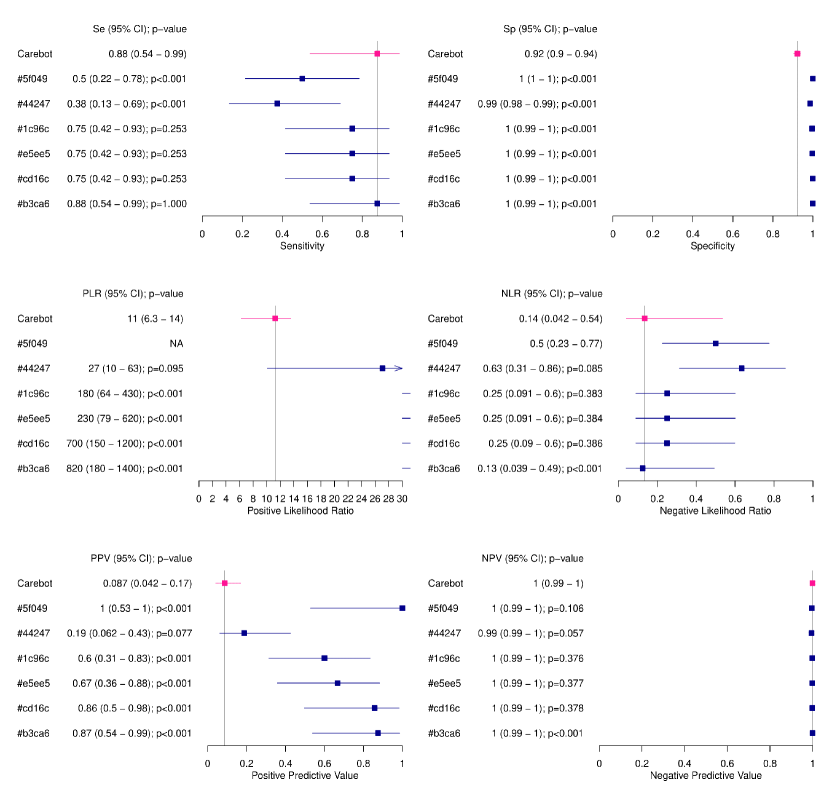
A total of 22 images (prevalence: 2.7%) were with confirmed consolidation (CON). The DLAD successfully identified 19 of these as CON+, resulting in Se of 0.864 (0.671-0.956). Additionally, the DLAD incorrectly flagged 118 images as CON+ that were, in fact, CON-, indicating Sp of 0.854 (0.828-0.877). Notably, only two radiologists, who possessed more experience, achieved a similar balance between Se and Sp in this diagnosis. The increased number of false positive scans can be attributed to the lowest agreement among the physicians involved in determining the ground truth for this particular finding.
5.3 Pleural Effusion
ID Se LSe USe Sp LSp USp Global p-Value Se p-Value Sp p-Value DLAD 0.953 0.887 0.983 0.876 0.852 0.897 #5f049 0.400 0.302 0.506 1.000 0.996 1.000 0.000 0.000 0.000 #44247 0.576 0.471 0.676 0.975 0.962 0.983 0.000 0.000 0.000 #1c96c 0.753 0.652 0.833 0.989 0.980 0.994 0.000 0.000 0.000 #e5ee5 0.953 0.887 0.983 0.982 0.970 0.989 0.000 1.000 0.000 #cd16c 0.882 0.798 0.936 0.966 0.951 0.977 0.000 0.002 0.000 #b3ca6 0.753 0.652 0.833 0.990 0.981 0.995 0.000 0.000 0.000 ID PLR LPLR UPLR NLR LNLR UNLR Global p-Value PLR p-Value NLR p-Value DLAD 7.70 6.29 9.20 0.054 0.023 0.136 #5f049 0.600 0.493 0.697 #44247 22.62 14.67 37.58 0.435 0.333 0.544 0.000 0.000 0.000 #1c96c 68.94 38.44 133.29 0.250 0.172 0.354 0.000 0.000 0.001 #e5ee5 52.35 32.95 83.41 0.048 0.022 0.122 0.000 0.000 0.872 #cd16c 25.97 18.14 37.32 0.122 0.070 0.214 0.000 0.000 0.135 #b3ca6 77.55 42.01 154.98 0.249 0.172 0.354 0.000 0.000 0.001 ID PPV LPPV UPPV NPV LNPV UNPV Global p-Value PPV p-Value NPV p-Value DLAD 0.443 0.372 0.515 0.994 0.986 0.998 #5f049 1.000 0.902 1.000 0.942 0.924 0.956 0.000 0.000 0.000 #44247 0.700 0.585 0.795 0.957 0.941 0.969 0.000 0.000 0.000 #1c96c 0.877 0.783 0.935 0.975 0.962 0.984 0.000 0.000 0.000 #e5ee5 0.844 0.759 0.904 0.995 0.988 0.998 0.000 0.000 0.872 #cd16c 0.728 0.636 0.805 0.988 0.977 0.993 0.000 0.000 0.124 #b3ca6 0.889 0.797 0.944 0.975 0.962 0.984 0.000 0.000 0.000
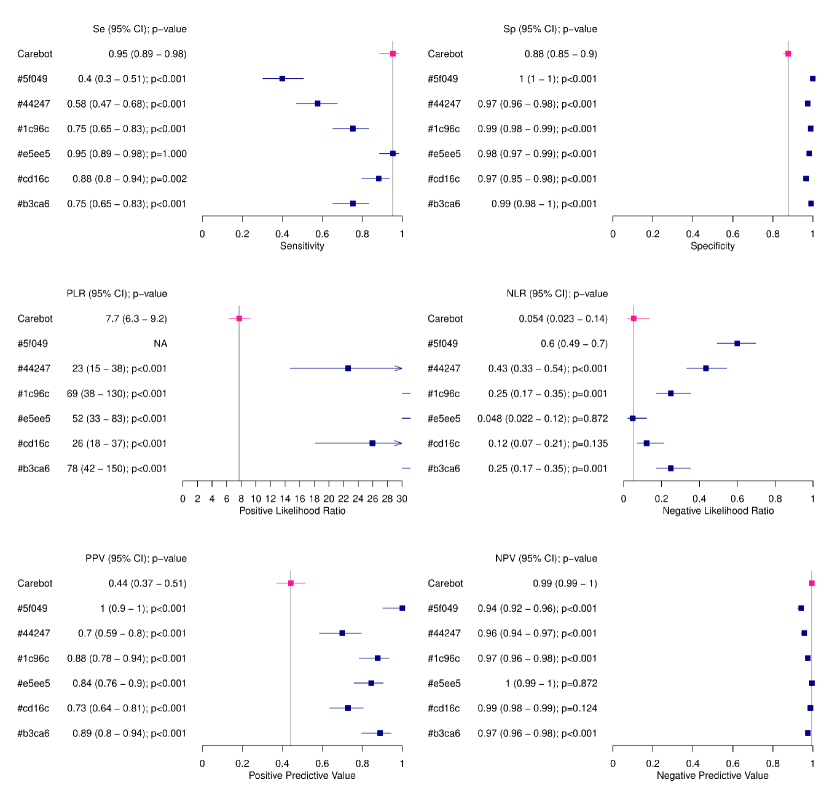
A total of 85 images (prevalence: 9.4%) exhibited pleural effusion (EFF). The DLAD accurately identified 81 of these as EFF+, resulting in Se of 0.953 (0.887-0.983). However, the DLAD also incorrectly labeled 102 images as EFF+ that were, in fact, EFF-, leading to Sp of 0.876 (0.852-0.897). Notably, only two more experienced radiologists achieved a similar balance between Se and Sp in this diagnosis. It is important to highlight that the DLAD achieved a lower positive predictive value (PPV) due to the higher number of false positive images.
5.4 Pulmonary Lesion
ID Se LSe USe Sp LSp USp Global p-Value Se p-Value Sp p-Value DLAD 0.905 0.715 0.978 0.893 0.871 0.912 #5f049 0.238 0.103 0.448 0.999 0.994 1.000 0.000 0.000 0.000 #44247 0.333 0.170 0.544 0.933 0.915 0.948 0.000 0.000 0.000 #1c96c 0.524 0.324 0.717 0.884 0.861 0.904 0.001 0.000 0.685 #e5ee5 0.619 0.410 0.794 0.968 0.955 0.978 0.000 0.000 0.000 #cd16c 0.667 0.456 0.830 0.991 0.982 0.996 0.000 0.000 0.000 #b3ca6 0.619 0.410 0.794 0.989 0.979 0.994 0.000 0.000 0.000 ID PLR LPLR UPLR NLR LNLR UNLR Global p-Value PLR p-Value NLR p-Value DLAD 8.47 6.08 10.12 0.107 0.039 0.342 #5f049 209.52 45.83 348.21 0.763 0.543 0.887 0.000 0.003 0.003 #44247 4.97 2.59 8.77 0.715 0.483 0.881 0.026 0.137 0.007 #1c96c 4.52 2.74 6.45 0.539 0.325 0.763 0.005 0.007 0.010 #e5ee5 19.46 11.45 30.04 0.393 0.221 0.612 0.000 0.001 0.033 #cd16c 73.33 36.22 152.57 0.336 0.182 0.554 0.000 0.000 0.055 #b3ca6 54.48 27.81 109.09 0.385 0.217 0.599 0.000 0.000 0.069 ID PPV LPPV UPPV NPV LNPV UNPV Global p-Value PPV p-Value NPV p-Value DLAD 0.168 0.110 0.247 0.997 0.991 0.999 #5f049 0.833 0.446 0.979 0.982 0.971 0.989 0.000 0.000 0.001 #44247 0.106 0.051 0.202 0.983 0.972 0.990 0.002 0.136 0.002 #1c96c 0.097 0.054 0.165 0.987 0.977 0.993 0.014 0.007 0.004 #e5ee5 0.317 0.195 0.469 0.991 0.982 0.995 0.000 0.000 0.022 #cd16c 0.636 0.431 0.804 0.992 0.984 0.996 0.000 0.000 0.042 #b3ca6 0.565 0.369 0.744 0.991 0.982 0.996 0.000 0.000 0.052
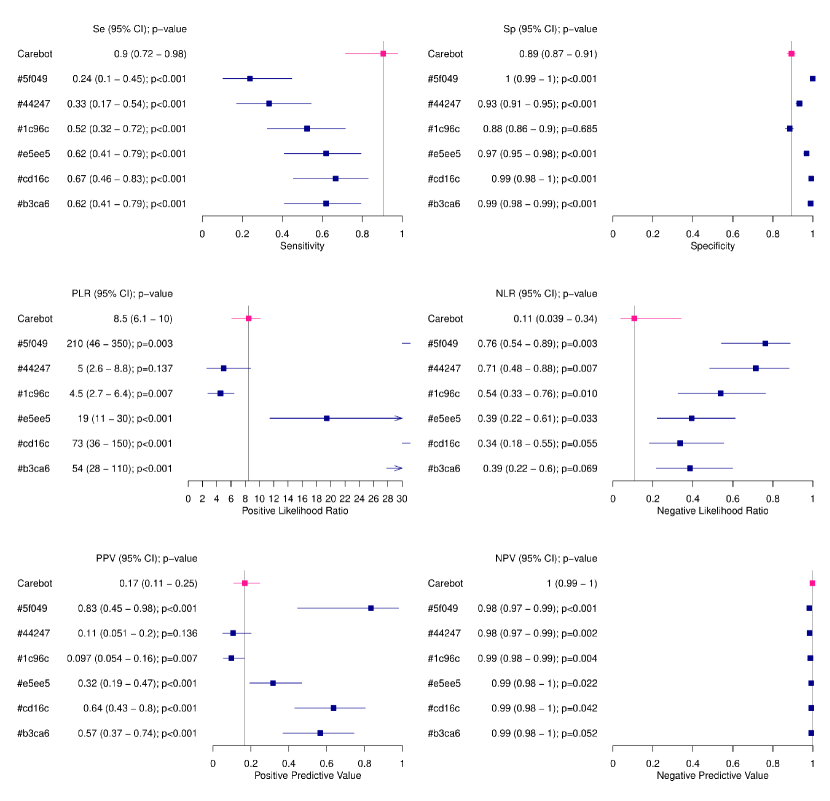
A total of 21 scans (prevalence: 2.3%) were with confirmed pulmonary lesions (LES). The DLAD correctly identified 19 of these as LES+, resulting in Se of 0.905 (0.715-0.978). Additionally, the DLAD incorrectly flagged 94 images as LES+ that were actually LES-, leading to Sp of 0.893 (0.871-0.912). Notably, none of the radiologists achieved a similar level of performance in this diagnosis. It is important to note that the low PPV can be attributed to both a higher false positive rate and the low prevalence of pulmonary lesions in the dataset.
5.5 Subcutaneous Emphysema
ID Se LSe USe Sp LSp USp Global p-Value Se p-Value Sp p-Value DLAD 1.000 0.366 1.000 0.966 0.953 0.976 #5f049 0.000 0.000 0.634 1.000 0.996 1.000 0.000 0.000 0.000 #44247 0.500 0.095 0.905 1.000 0.996 1.000 0.000 0.046 0.000 #1c96c 1.000 0.366 1.000 0.999 0.994 1.000 1.000 1.000 0.000 #e5ee5 1.000 0.366 1.000 1.000 0.996 1.000 1.000 1.000 0.000 #cd16c 1.000 0.366 1.000 1.000 0.996 1.000 1.000 1.000 0.000 #b3ca6 1.000 0.366 1.000 1.000 0.996 1.000 1.000 1.000 0.000 ID PLR LPLR UPLR NLR LNLR UNLR Global p-Value PLR p-Value NLR p-Value DLAD 29.72 8.87 35.31 0.000 0.000 0.715 #5f049 1.000 0.310 0.983 #44247 0.500 0.125 0.876 #1c96c 951.00 145.88 6902.31 0.000 0.000 0.692 #e5ee5 0.000 0.000 0.691 #cd16c 0.000 0.000 0.691 #b3ca6 0.000 0.000 0.691 ID PPV LPPV UPPV NPV LNPV UNPV Global p-Value PPV p-Value NPV p-Value DLAD 0.059 0.013 0.188 1.000 0.996 1.000 #5f049 0.998 0.993 1.000 #44247 1.000 0.235 1.000 0.999 0.994 1.000 0.000 0.000 0.326 #1c96c 0.667 0.214 0.945 1.000 0.996 1.000 #e5ee5 1.000 0.366 1.000 1.000 0.996 1.000 #cd16c 1.000 0.366 1.000 1.000 0.996 1.000 #b3ca6 1.000 0.366 1.000 1.000 0.996 1.000
Subcutaneous emphysema (SCE) is an exceptionally rare condition, with only 2 scans (prevalence: 0.2%) confirming its presence. The DLAD accurately identified both of these cases as SCE+, demonstrating Se of 1.000 (0.366-1.000). However, given the small sample size, the confidence interval for Se is wide. Additionally, the DLAD flagged an additional 32 images as SCE+, which were actually SCE-, resulting in Sp of 0.966 (0.953-0.976). Generally, the assessment of this diagnosis was more effectively performed by assessed radiologists, as the DLAD exhibited a higher number of false positive predictions. Notably, less experienced radiologists demonstrated low detection rates, with #5f049 not identifying any positive cases and #44247 identifying only one. In such cases, the DLAD would have provided significant assistance to the junior radiologists.
5.6 Cardiomegaly
ID Se LSe USe Sp LSp USp Global p-Value Se p-Value Sp p-Value DLAD 0.837 0.711 0.917 0.953 0.937 0.966 #5f049 0.347 0.228 0.486 0.990 0.981 0.995 0.000 0.000 0.000 #44247 0.857 0.735 0.931 0.928 0.908 0.944 0.031 0.927 0.000 #1c96c 0.980 0.896 0.999 0.887 0.864 0.907 0.000 0.000 0.000 #e5ee5 0.735 0.599 0.839 0.982 0.970 0.989 0.000 0.045 0.000 #cd16c 0.796 0.665 0.887 0.978 0.966 0.986 0.005 0.737 0.000 #b3ca6 0.980 0.896 0.999 0.890 0.866 0.910 0.000 0.000 0.000 ID PLR LPLR UPLR NLR LNLR UNLR Global p-Value PLR p-Value NLR p-Value DLAD 17.97 12.72 24.70 0.171 0.094 0.310 #5f049 35.39 17.62 98.10 0.660 0.517 0.776 0.000 0.073 0.000 #44247 11.85 8.84 15.22 0.154 0.081 0.294 0.034 0.027 0.811 #1c96c 8.69 6.91 10.43 0.023 0.007 0.133 0.000 0.000 0.032 #e5ee5 39.97 24.29 68.08 0.270 0.169 0.414 0.000 0.003 0.197 #cd16c 36.08 22.81 57.69 0.209 0.122 0.349 0.007 0.007 0.610 #b3ca6 8.88 7.04 10.68 0.023 0.007 0.132 0.000 0.000 0.058 ID PPV LPPV UPPV NPV LNPV UNPV Global p-Value PPV p-Value NPV p-Value DLAD 0.519 0.411 0.626 0.990 0.980 0.995 #5f049 0.680 0.486 0.830 0.962 0.947 0.973 0.000 0.065 0.000 #44247 0.416 0.324 0.513 0.991 0.981 0.996 0.034 0.026 0.811 #1c96c 0.343 0.269 0.424 0.999 0.992 1.000 0.000 0.000 0.012 #e5ee5 0.706 0.571 0.814 0.984 0.973 0.991 0.000 0.002 0.193 #cd16c 0.684 0.556 0.791 0.988 0.978 0.993 0.004 0.005 0.609 #b3ca6 0.348 0.273 0.430 0.999 0.992 1.000 0.000 0.000 0.026
A total of 49 scans (prevalence: 5.7%) were confirmed to have cardiomegaly (CMG). The DLAD accurately identified 41 of these cases as abnormal, resulting in Se of 0.837 (0.711-0.917). Additionally, the DLAD assessed 38 images as CMG+ that were actually CMG-, leading to Sp of 0.953 (0.937-0.966). Notably, in this diagnosis, the DLAD demonstrated a high level of Sp and maintained an acceptable level of Se. Although three radiologists achieved higher Se, their Sp was lower. Other characteristics of the DLAD exhibited similar trends. Given the DLAD’s supportive purpose, the very good PPV suggests that implementing the DLAD into the clinical workflow can provide benefits without imposing any additional workload on the radiologist.
5.7 Pneumothorax
ID Se LSe USe Sp LSp USp Global p-Value Se p-Value Sp p-Value DLAD 0.875 0.538 0.986 0.922 0.903 0.938 #5f049 0.500 0.215 0.785 1.000 0.996 1.000 0.000 0.000 0.000 #44247 0.375 0.134 0.691 0.986 0.977 0.992 0.000 0.000 0.000 #1c96c 0.750 0.415 0.934 0.996 0.989 0.998 0.000 0.253 0.000 #e5ee5 0.750 0.415 0.934 0.997 0.991 0.999 0.000 0.253 0.000 #cd16c 0.750 0.415 0.934 0.999 0.994 1.000 0.000 0.253 0.000 #b3ca6 0.875 0.538 0.986 0.999 0.994 1.000 1.000 1.000 0.000 ID PLR LPLR UPLR NLR LNLR UNLR Global p-Value PLR p-Value NLR p-Value DLAD 11.26 6.26 13.55 0.136 0.042 0.535 #5f049 0.500 0.227 0.775 #44247 27.09 10.09 63.05 0.634 0.313 0.860 0.022 0.095 0.085 #1c96c 176.06 64.11 426.23 0.251 0.091 0.601 0.000 0.000 0.383 #e5ee5 234.75 78.68 621.72 0.251 0.091 0.601 0.000 0.000 0.384 #cd16c 704.25 151.33 1208.39 0.250 0.090 0.599 0.000 0.000 0.386 #b3ca6 821.62 178.89 1361.98 0.125 0.039 0.494 0.000 0.000 0.000 ID PPV LPPV UPPV NPV LNPV UNPV Global p-Value PPV p-Value NPV p-Value DLAD 0.087 0.042 0.168 0.999 0.994 1.000 #5f049 1.000 0.528 1.000 0.996 0.989 0.998 0.000 0.000 0.106 #44247 0.188 0.062 0.426 0.995 0.988 0.998 0.028 0.077 0.057 #1c96c 0.600 0.315 0.834 0.998 0.992 1.000 0.000 0.000 0.376 #e5ee5 0.667 0.358 0.883 0.998 0.992 1.000 0.000 0.000 0.377 #cd16c 0.857 0.496 0.983 0.998 0.992 1.000 0.000 0.000 0.378 #b3ca6 0.875 0.538 0.986 0.999 0.994 1.000 0.000 0.000 0.000
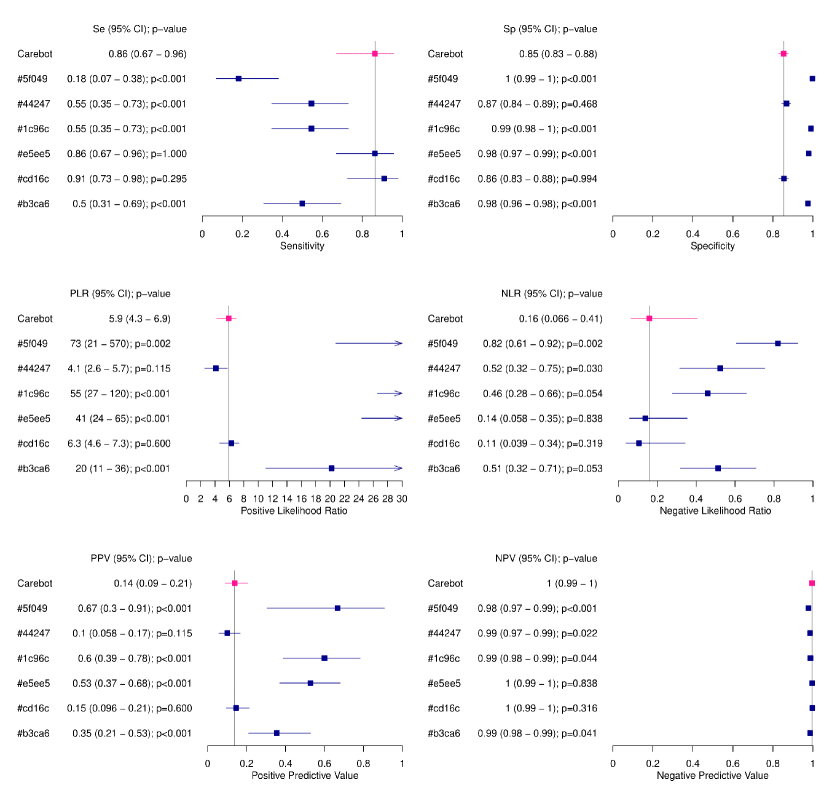
Pneumothorax (PNO) is an infrequent diagnosis, with only 8 images (prevalence: 0.8%) demonstrating abnormality. DLAD identified 7 of these as PNO+ (Se of 0.875 (0.538-0.986)) and classified an additional 73 PNO- images as PNO+ (Sp of 0.922 (0.903-0.938)). Considering the rarity of this condition, these outcomes are highly favorable, with only one radiologist (the most experienced) achieving similar results. The lower PPV can be attributed to the higher rate of false positives and the low prevalence of PNO.
5.8 Forest Plots
6 Conclusion
The proposed DLAD (Carebot AI CXR) showed better or comparable results compared to the doctor’s assessment, depending on the finding and its rarity as well as the experience of the doctor. It generally achieved higher sensitivity (Se) and significantly higher specificity (Sp) than expected, confirming the robustness of the model. The positive predictive value (PPV) was generally rather lower (worse) than the doctor’s assessment, due to the higher number of false positives, as a result of the setting of the algorithm itself to make DLAD classify questionable and suspicious images as abnormal.
A large variability in the accuracy of the assessment of the findings was observed among physicians. In general, success rates correlated with physician experience. As a result, the proposed DLAD can be considered beneficial for both less and more experienced doctors. Only the very rare subcutaneous emphysema (SCE) was rated more favorably by radiologists, but given the very low prevalence of the finding, these are imprecise estimates. Pneumothorax (PNO) also showed very wide confidence intervals for the estimates, given the low prevalence. DLAD showed the most accurate classification for the finding of cardiomegaly (CMG) and pulmonary lesions (LES).
Abbreviations
AI = Artificial Intelligence
ML = Machine Learning
DL = Deep Learning
CAD = Computer-Aided Diagnosis System
DLAD = Deep-Learning-based Automatic Detection Algorithm
Se = Sensitivity
Sp = Specificity
PPV = Positive Predictive Value
NPV = Negative Predictive Value
PLR = Positive Likelihood Ratio
NLR = Negative Likelihood Ratio
CI = Confidence Interval
Informed Consent Statement
Informed consent was obtained from all subjects involved in the study.
Conflict of interest
In relation to this study, we declare the following conflicts of interest: the research was funded by Carebot s.r.o.
References
- [1] Jong Seok Ahn, Shadi Ebrahimian, Shaunagh McDermott, Sanghyup Lee, Laura Naccarato, John F Di Capua, Markus Y Wu, Eric W Zhang, Victorine Muse, Benjamin Miller, et al. Association of artificial intelligence–aided chest radiograph interpretation with reader performance and efficiency. JAMA Network Open, 5(8):e2229289–e2229289, 2022.
- [2] Mugahed A Al-Antari, Mohammed A Al-Masni, Mun-Taek Choi, Seung-Moo Han, and Tae-Seong Kim. A fully integrated computer-aided diagnosis system for digital x-ray mammograms via deep learning detection, segmentation, and classification. International journal of medical informatics, 117:44–54, 2018.
- [3] Jennifer J Donald and Stuart A Barnard. Common patterns in 558 diagnostic radiology errors. Journal of medical imaging and radiation oncology, 56(2):173–178, 2012.
- [4] Weronika Hryniewska, Przemysław Bombiński, Patryk Szatkowski, Paulina Tomaszewska, Artur Przelaskowski, and Przemysław Biecek. Checklist for responsible deep learning modeling of medical images based on covid-19 detection studies. Pattern Recognition, 118:108035, 2021.
- [5] Eui Jin Hwang, Sunggyun Park, Kwang-Nam Jin, Jung Im Kim, So Young Choi, Jong Hyuk Lee, Jin Mo Goo, Jaehong Aum, Jae-Joon Yim, Chang Min Park, et al. Development and validation of a deep learning–based automatic detection algorithm for active pulmonary tuberculosis on chest radiographs. Clinical infectious diseases, 69(5):739–747, 2019.
- [6] Se Bum Jang, Suk Hee Lee, Dong Eun Lee, Sin-Youl Park, Jong Kun Kim, Jae Wan Cho, Jaekyung Cho, Ki Beom Kim, Byunggeon Park, Jongmin Park, et al. Deep-learning algorithms for the interpretation of chest radiographs to aid in the triage of covid-19 patients: A multicenter retrospective study. PLoS One, 15(11):e0242759, 2020.
- [7] Andrew Janowczyk and Anant Madabhushi. Deep learning for digital pathology image analysis: A comprehensive tutorial with selected use cases. Journal of pathology informatics, 7(1):29, 2016.
- [8] Catherine M Jones, Luke Danaher, Michael R Milne, Cyril Tang, Jarrel Seah, Luke Oakden-Rayner, Andrew Johnson, Quinlan D Buchlak, and Nazanin Esmaili. Assessment of the effect of a comprehensive chest radiograph deep learning model on radiologist reports and patient outcomes: a real-world observational study. BMJ open, 11(12):e052902, 2021.
- [9] Hyungjin Kim, Chang Min Park, and Jin Mo Goo. Test-retest reproducibility of a deep learning–based automatic detection algorithm for the chest radiograph. European radiology, 30:2346–2355, 2020.
- [10] Ji Hoon Kim, Sang Gil Han, Ara Cho, Hye Jung Shin, and Song-Ee Baek. Effect of deep learning-based assistive technology use on chest radiograph interpretation by emergency department physicians: a prospective interventional simulation-based study. BMC Medical Informatics and Decision Making, 21:1–9, 2021.
- [11] Young Hoon Koo, Kyung Eun Shin, Jai Soung Park, Jae Wook Lee, Seonghwan Byun, and Heon Lee. Extravalidation and reproducibility results of a commercial deep learning-based automatic detection algorithm for pulmonary nodules on chest radiographs at tertiary hospital. Journal of Medical Imaging and Radiation Oncology, 65(1):15–22, 2021.
- [12] Daniel Kvak, Marian Bendik, and Anna Chromcova. Towards clinical practice: Design and implementation of convolutional neural network-based assistive diagnosis system for covid-19 case detection from chest x-ray images. arXiv preprint arXiv:2203.10596, 2022.
- [13] Daniel Kvak, Anna Chromcová, Marek Biroš, Robert Hrubỳ, Karolína Kvaková, Marija Pajdaković, and Petra Ovesná. Chest x-ray abnormality detection by using artificial intelligence: A single-site retrospective study of deep learning model performance. BioMedInformatics, 3(1):82–101, 2023.
- [14] Jong Hyuk Lee, Sunggyun Park, Eui Jin Hwang, Jin Mo Goo, Woo Young Lee, Sangho Lee, Hyungjin Kim, Jason R Andrews, and Chang Min Park. Deep learning–based automated detection algorithm for active pulmonary tuberculosis on chest radiographs: diagnostic performance in systematic screening of asymptomatic individuals. European Radiology, 31:1069–1080, 2021.
- [15] Ju Gang Nam, Sunggyun Park, Eui Jin Hwang, Jong Hyuk Lee, Kwang-Nam Jin, Kun Young Lim, Thienkai Huy Vu, Jae Ho Sohn, Sangheum Hwang, Jin Mo Goo, et al. Development and validation of deep learning–based automatic detection algorithm for malignant pulmonary nodules on chest radiographs. Radiology, 290(1):218–228, 2019.
- [16] Madlen Nash, Rajagopal Kadavigere, Jasbon Andrade, Cynthia Amrutha Sukumar, Kiran Chawla, Vishnu Prasad Shenoy, Tripti Pande, Sophie Huddart, Madhukar Pai, and Kavitha Saravu. Deep learning, computer-aided radiography reading for tuberculosis: a diagnostic accuracy study from a tertiary hospital in india. Scientific reports, 10(1):210, 2020.
- [17] Luke Oakden-Rayner. Exploring large-scale public medical image datasets. Academic radiology, 27(1):106–112, 2020.
- [18] Sohee Park, Sang Min Lee, Kyung Hee Lee, Kyu-Hwan Jung, Woong Bae, Jooae Choe, and Joon Beom Seo. Deep learning-based detection system for multiclass lesions on chest radiographs: comparison with observer readings. European radiology, 30:1359–1368, 2020.
- [19] Zhi Zhen Qin, Melissa S Sander, Bishwa Rai, Collins N Titahong, Santat Sudrungrot, Sylvain N Laah, Lal Mani Adhikari, E Jane Carter, Lekha Puri, Andrew J Codlin, et al. Using artificial intelligence to read chest radiographs for tuberculosis detection: A multi-site evaluation of the diagnostic accuracy of three deep learning systems. Scientific reports, 9(1):15000, 2019.
- [20] Sehrish Qummar, Fiaz Gul Khan, Sajid Shah, Ahmad Khan, Shahaboddin Shamshirband, Zia Ur Rehman, Iftikhar Ahmed Khan, and Waqas Jadoon. A deep learning ensemble approach for diabetic retinopathy detection. Ieee Access, 7:150530–150539, 2019.
- [21] Ramandeep Singh, Mannudeep K Kalra, Chayanin Nitiwarangkul, John A Patti, Fatemeh Homayounieh, Atul Padole, Pooja Rao, Preetham Putha, Victorine V Muse, Amita Sharma, et al. Deep learning in chest radiography: detection of findings and presence of change. PloS one, 13(10):e0204155, 2018.
- [22] Jinkyeong Sung, Sohee Park, Sang Min Lee, Woong Bae, Beomhee Park, Eunkyung Jung, Joon Beom Seo, and Kyu-Hwan Jung. Added value of deep learning–based detection system for multiple major findings on chest radiographs: a randomized crossover study. Radiology, 299(2):450–459, 2021.