V. Zhukova ,††\dagger††\daggerCorresponding author.
Measurement of the cross section in the energy range from to using inclusive and production
Abstract
We report the first measurement of the inclusive and cross sections in the energy range from to . Based on these results, we determine and in the same energy range. We measure the fraction of events at to be . We determine also the ratio of the inclusive branching fractions . The results are obtained using the data collected with the Belle detector at the KEKB asymmetric-energy collider.
Keywords:
Experiments, Particle and resonance production, B Physics, Quarkonium, Spectroscopy1 Introduction
Hadronic states in the bottomonium spectrum lying above the open-bottom threshold demonstrate properties at odds with the standard quark model scheme. In particular, the structures and , observed by Belle in 2012 Belle:2011aa , are charged and contain at least four quarks. The mass splittings for the high-lying vector bottomonia do not follow the quark model expectations either. The rates of their transitions to lower bottomonia with the emission of light hadrons are much higher compared to the expectations for ordinary bottomonium, in violation of the Okubo-Zweig-Iizuka rule Meng:2007tk ; Simonov:2008ci , and their transitions are not suppressed relative to the dipion transitions, which violates Heavy Quark Spin Symmetry Kaiser:2002bm ; Voloshin:2012dk . For a review, see, e.g. Ref. Bondar:2016hva . Studies of various cross sections above the open-bottom threshold can help us to understand the properties of the resonances lying in this energy region.
The total hadronic cross section in the bottomonium energy region was previously measured by both Belle and BaBar collaborations Belle:2015aea ; BaBar:2008cmq . It has a nontrivial shape, with peaks near the resonances, valley near , and dips near the , , and thresholds. To some extent, the total cross section has already been decomposed into exclusive cross sections up to the energy 11.02 GeV. The Belle experiment measured the energy dependence of the cross sections , , , , , and Belle:2021lzm ; Abdesselam:2016tbc ; Belle:2011aa ; Belle:2015tbu . The major missing contribution is the channels; it can be estimated using the difference between the total cross section and the sum of the measured exclusive channels.
A combined fit of the available measurements was performed in Ref. Husken:2022yik using a coupled-channel approach. For the first time, the decay branching fractions of the , , and resonances were determined rigorously. Also, pole positions (masses and widths) of the states and energy dependence of the scattering amplitudes between all considered channels were extracted. It was noted in Ref. Husken:2022yik that the accuracy of the data needs to be improved. This is especially true for the channel, in which one can not discriminate the models that predict different behavior of the cross section near the threshold.
The previous measurement of the final states was performed using full reconstruction of one . The efficiency of the full reconstruction was relatively low, which resulted in large statistical uncertainties in the results.
Here we use an inclusive approach: first, we measure and , then and are determined based on the above measurements. The cross sections are measured in the energy range from to . Since isospin-violating channels are strongly suppressed, the relation
| (1) |
is valid up to the threshold that opens at , thus, for most of the energy range studied in this paper.
For brevity, in the following we denote as and as .
2 Belle detector and data samples
The analysis is based on data collected by the Belle detector Abashian:2000cg ; Belle:2012iwr at the KEKB asymmetric-energy collider Kurokawa:2001nw ; Abe:2013kxa .
The Belle detector is a large-solid-angle magnetic spectrometer that consists of a silicon vertex detector (SVD), a 50-layer central drift chamber (CDC), an array of aerogel threshold Cherenkov counters (ACC), a barrel-like arrangement of time-of-flight scintillation counters (TOF), and an electromagnetic calorimeter (ECL) composed of CsI(Tl) crystals located inside a superconducting solenoid coil that provides a 1.5 T magnetic field. An iron flux-return located outside of the coil is instrumented to detect mesons and to identify muons (KLM). Two different inner detector configurations were used. For the first sample of 156 , a 2.0 cm radius beam pipe and a 3-layer silicon vertex detector were used; for the latter sample of 833 , a 1.5 cm radius beam pipe, and a 4-layer silicon vertex detector (SVD2) and a small-cell inner drift chamber were used. This analysis is based only on data collected with the SVD2 configuration. A detailed description of the detector can be found, for example, in Ref. Abashian:2000cg ; Belle:2012iwr .
We use energy scan data with approximately per point: six points collected in 2007 and 16 points collected in 2010. We use also the on-resonance data with a total integrated luminosity of collected at five points with energies from to . The center-of-mass (c.m.) energies of these data samples are calibrated using the and () processes Belle:2019cbt . We combine the data samples with similar energies so that finally we obtain 23 energy points. The energies and integrated luminosities of these 23 data samples are presented in Table 6 below. We also use the SVD2 part of the data sample with an integrated luminosity of and the data sample collected below the threshold (c.m. energy ) with an integrated luminosity of .
The signal and the continuum events are generated using EvtGen Lange:2001uf . The size of the Monte-Carlo (MC) samples corresponds to an integrated luminosity six times that of the data. The detector response is simulated using GEANT3 Brun:1987ma . The MC simulation includes run-dependent variations in the detector performance and background conditions.
3 Analysis strategy
The method used in this paper was developed by the CLEO collaboration CLEO:2005pyn and then applied by Belle Belle:2006jvm for one energy point near the . We slightly modify the method to mitigate low accuracy in inclusive branching fractions.
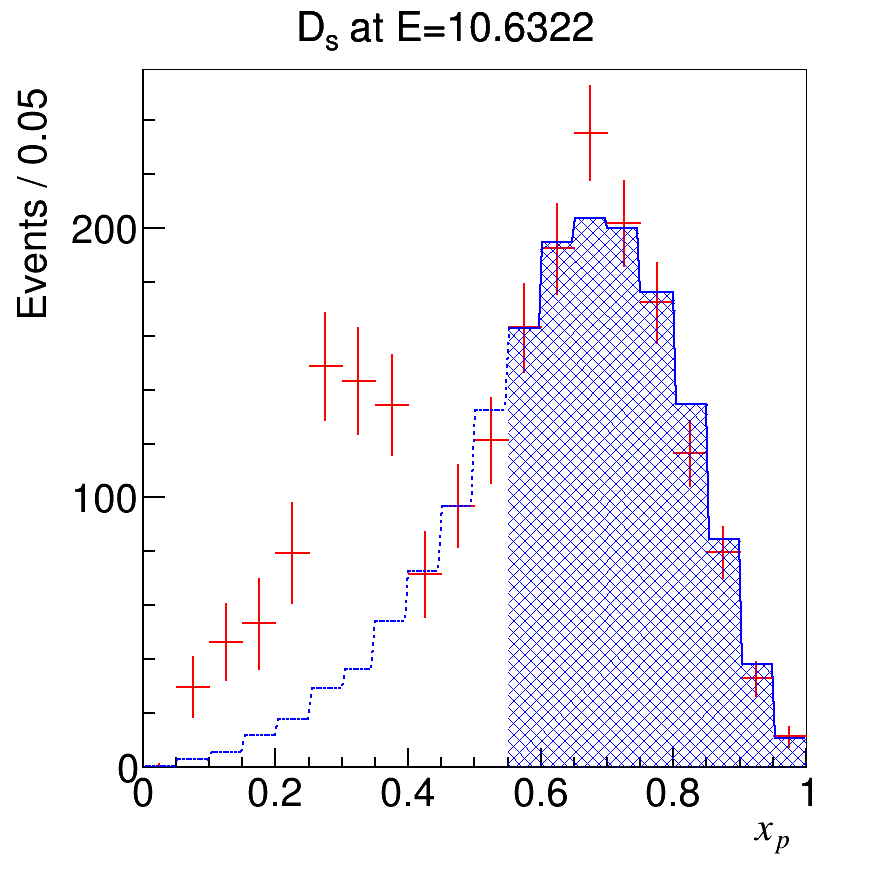
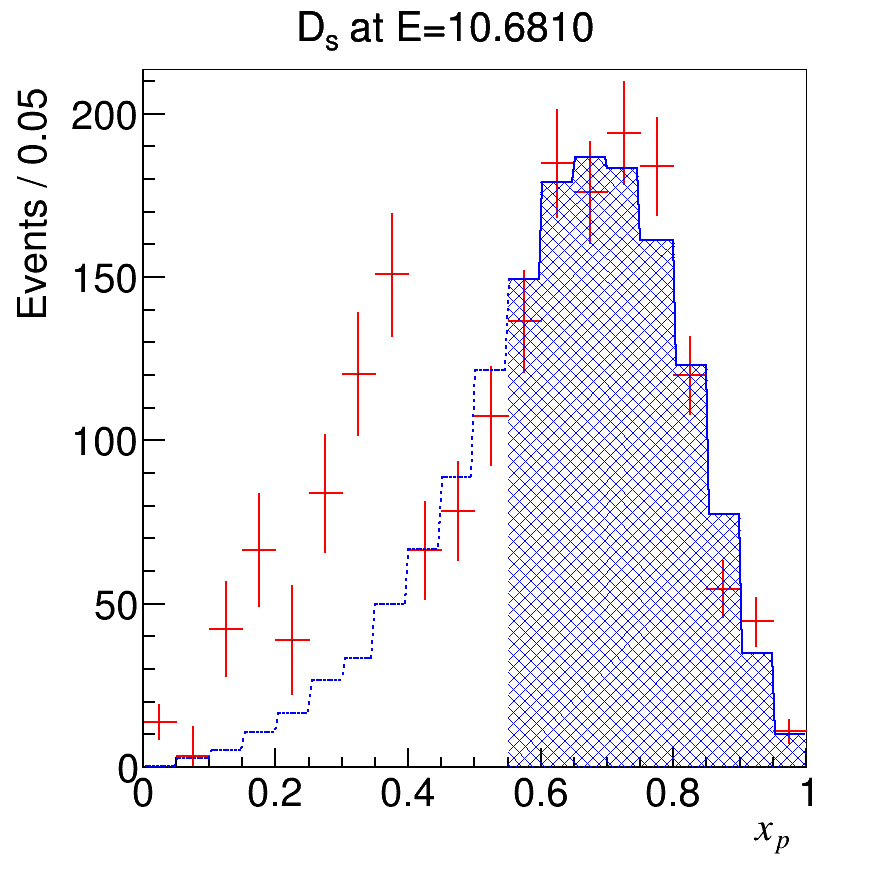
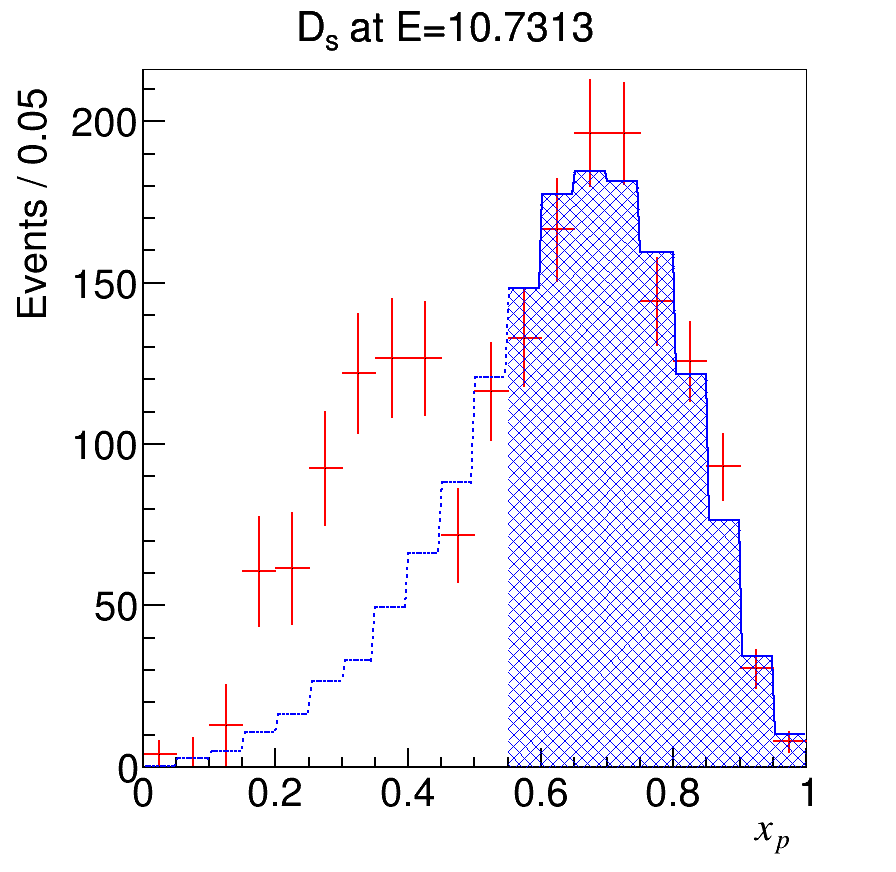
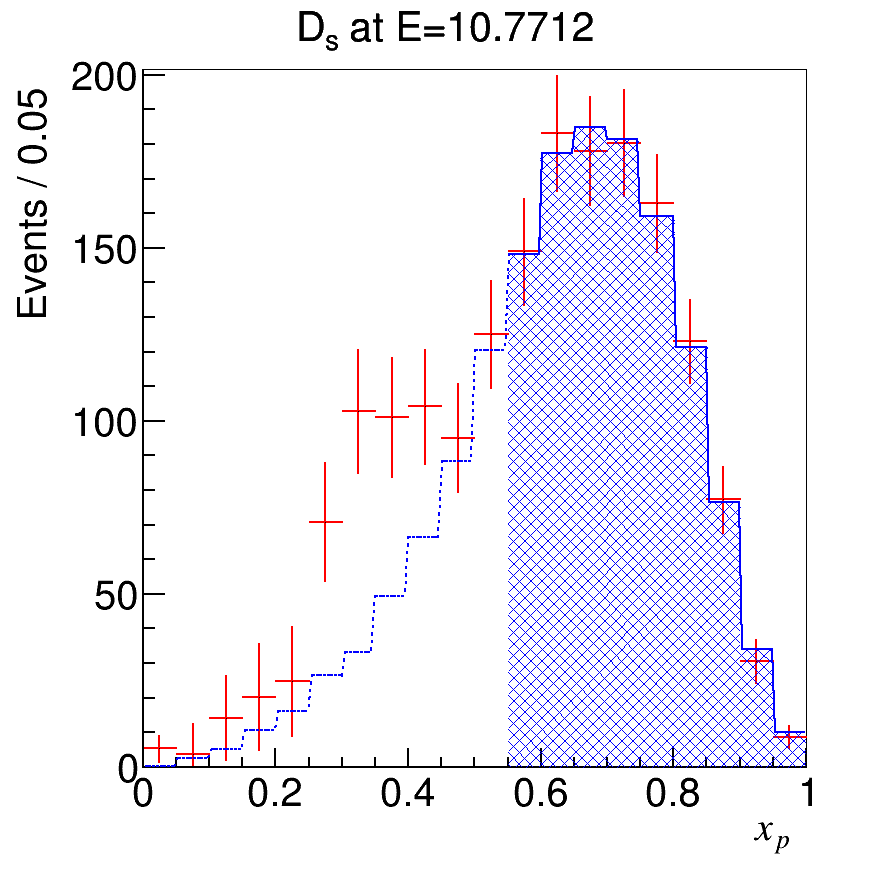
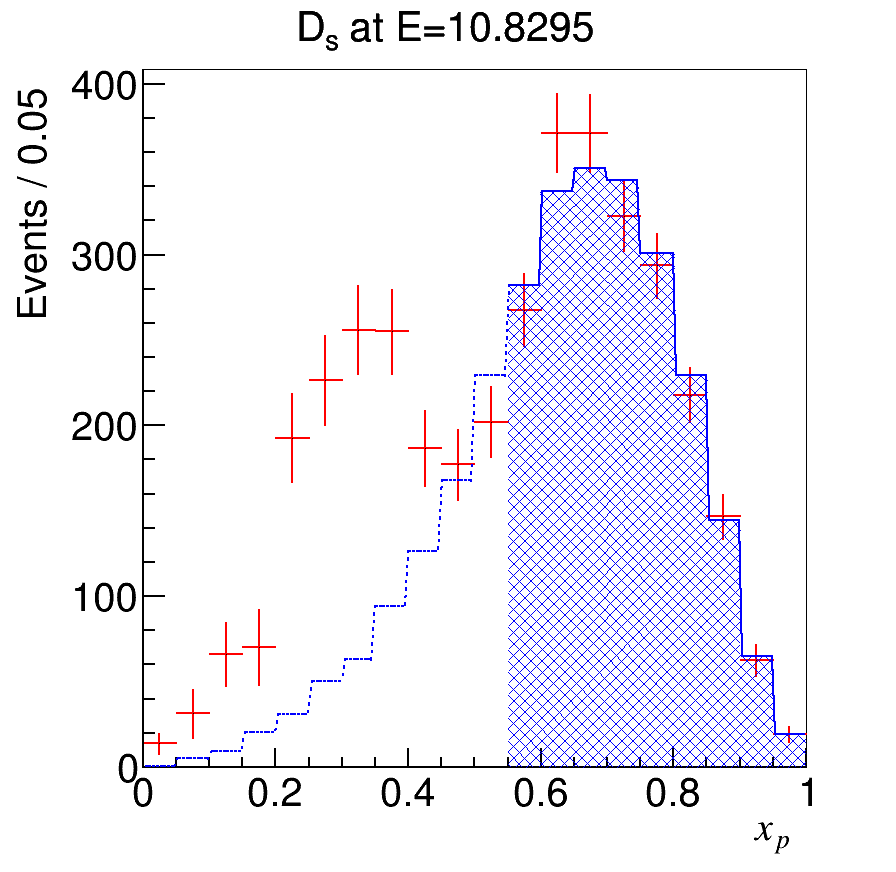
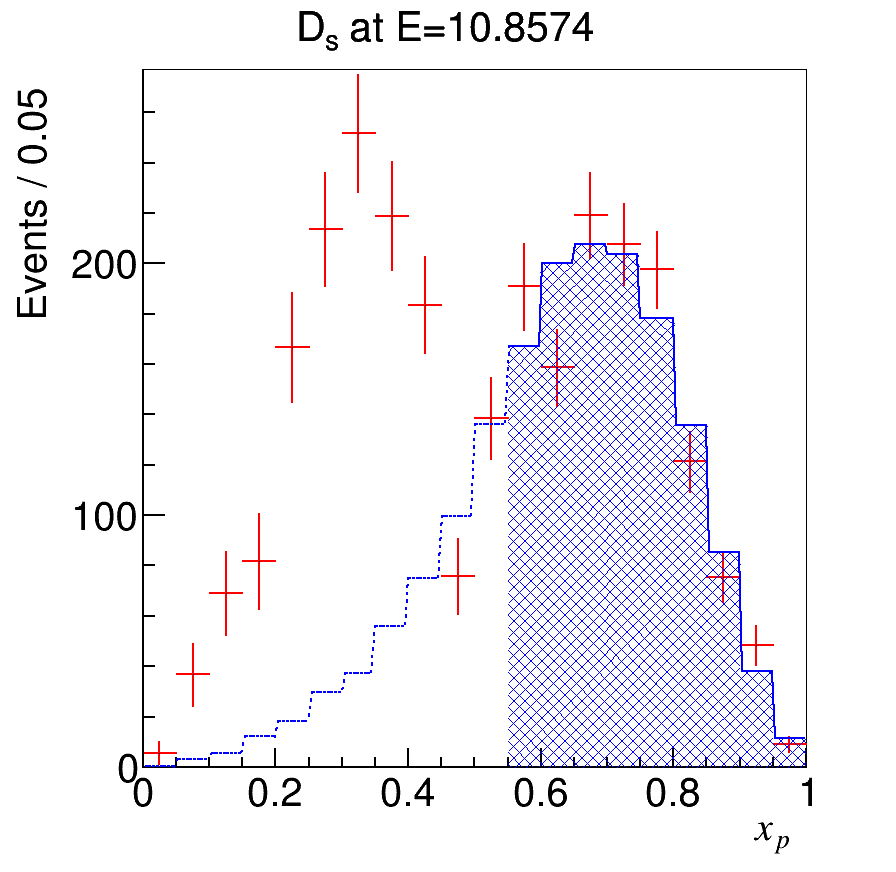
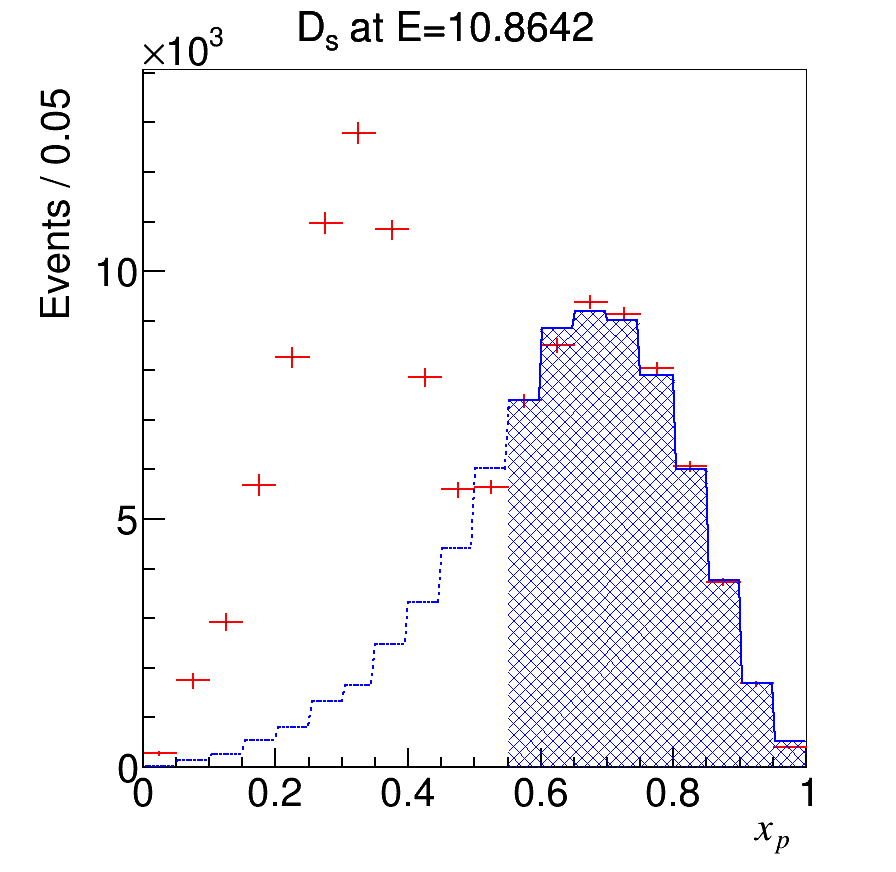
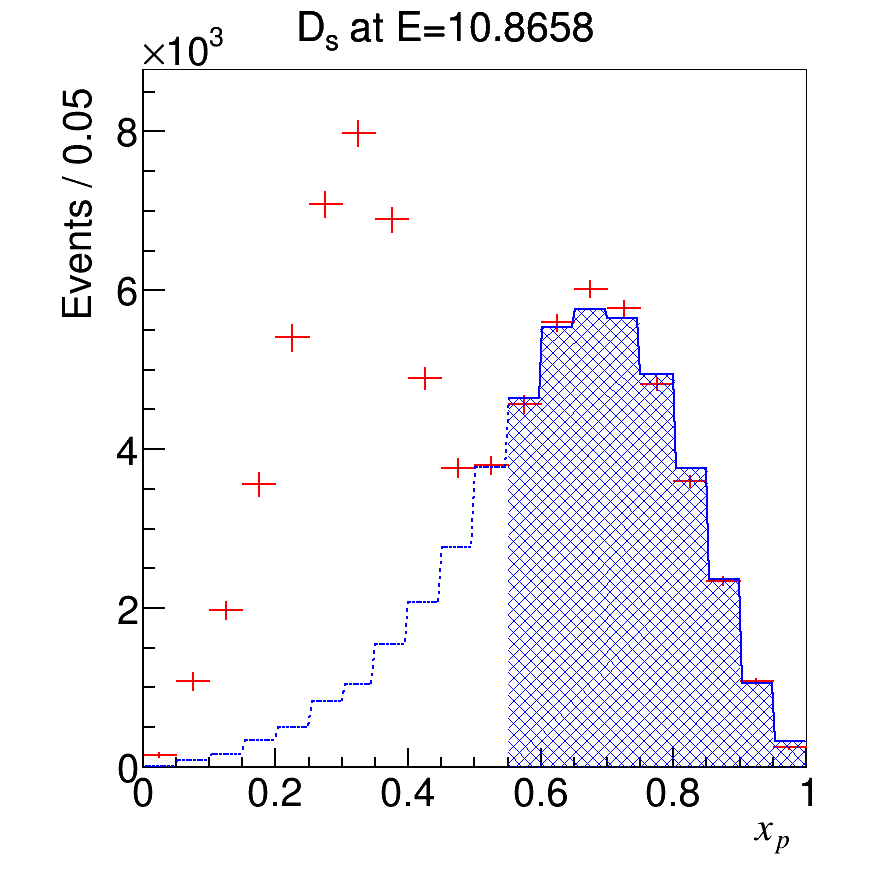
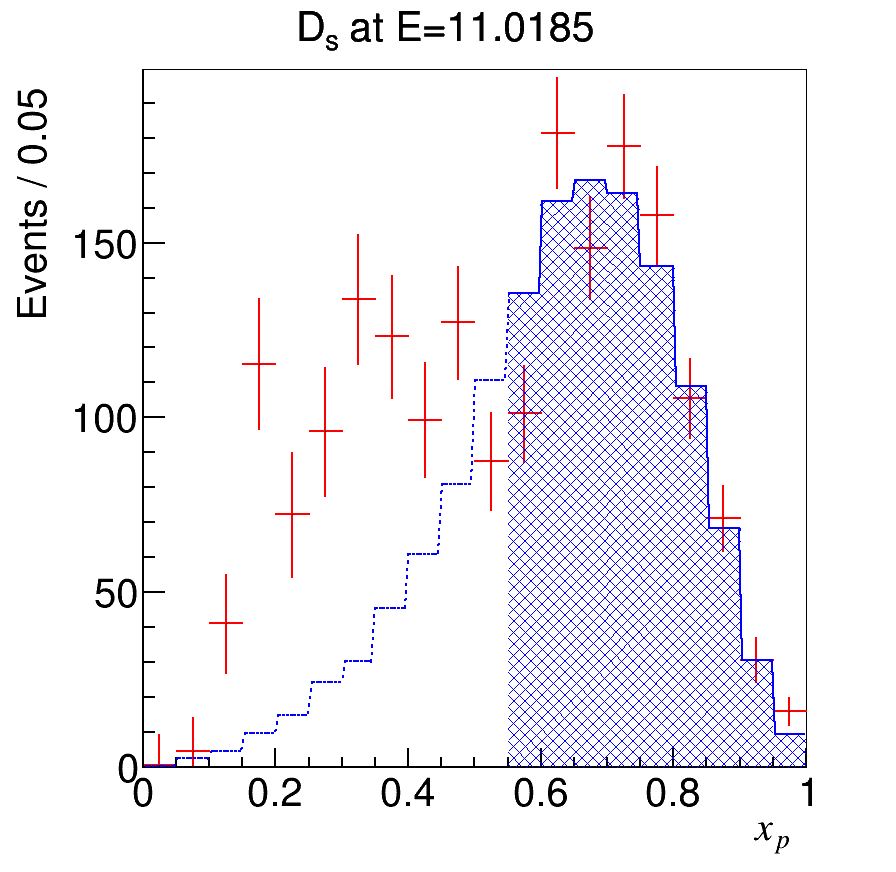
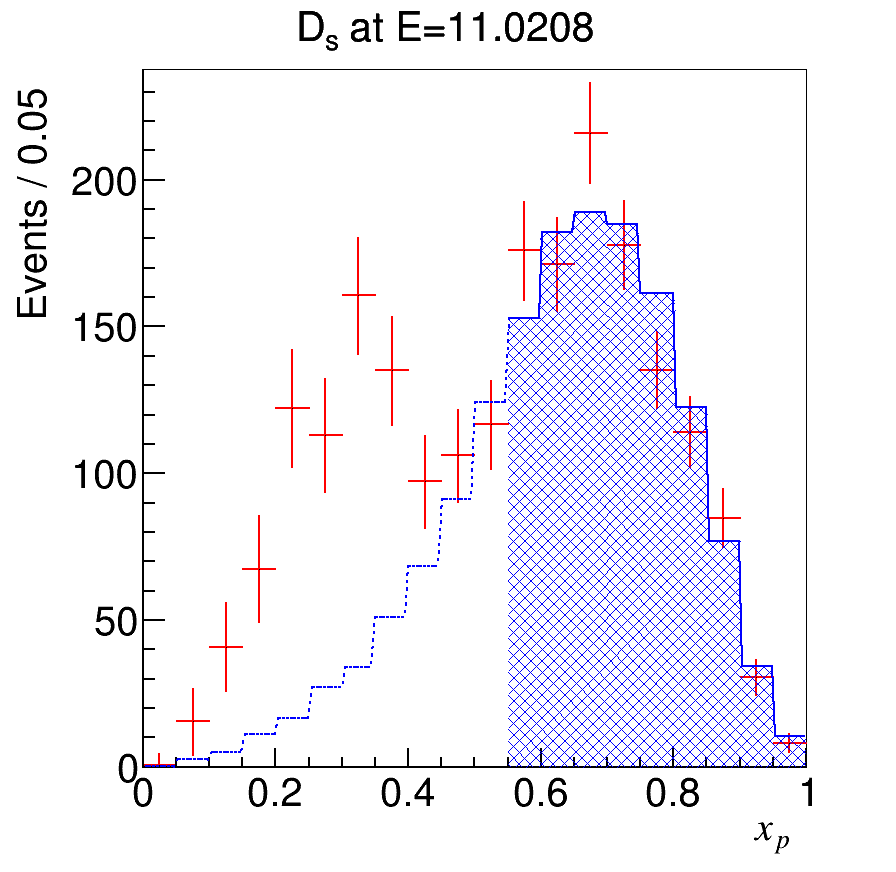
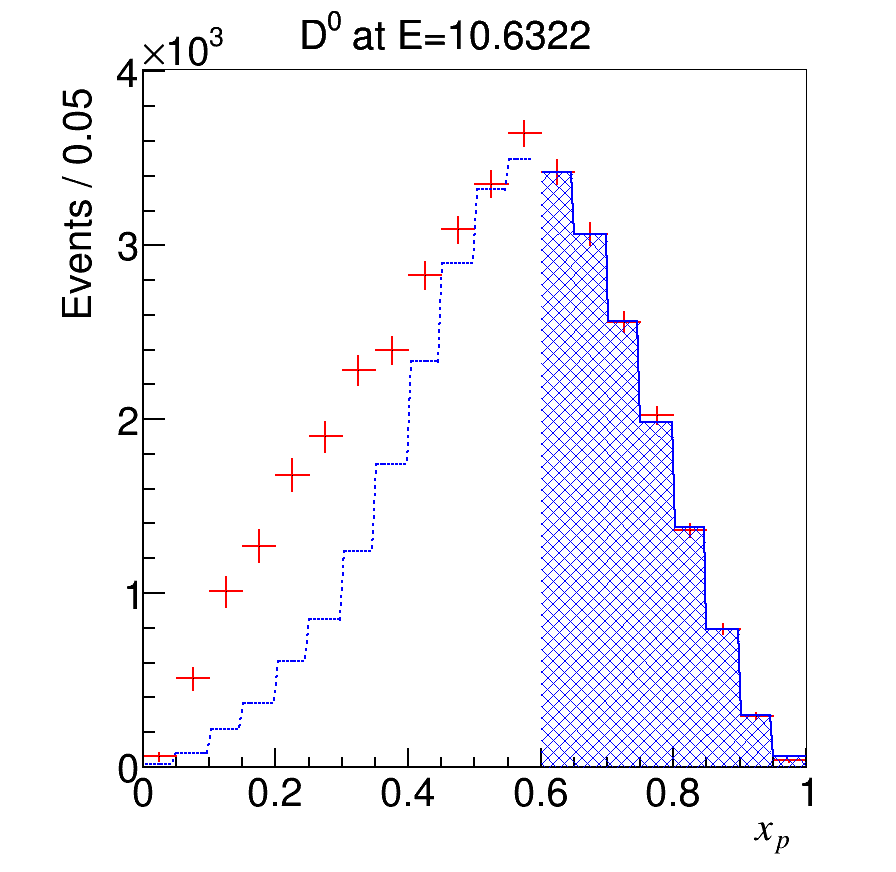
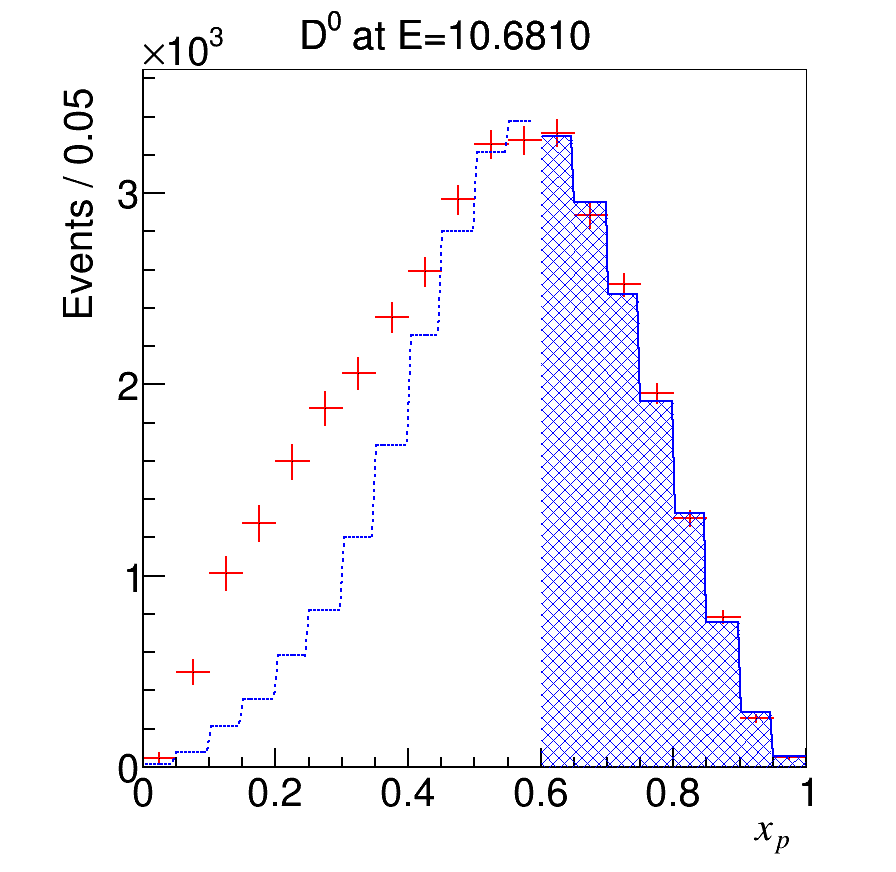
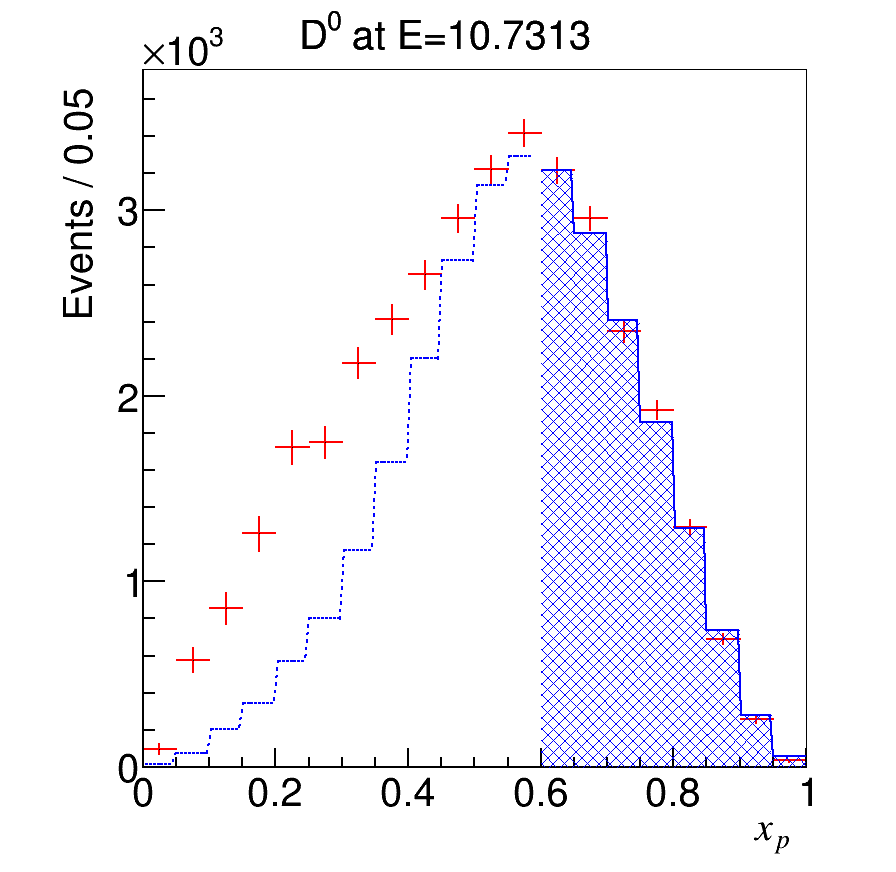
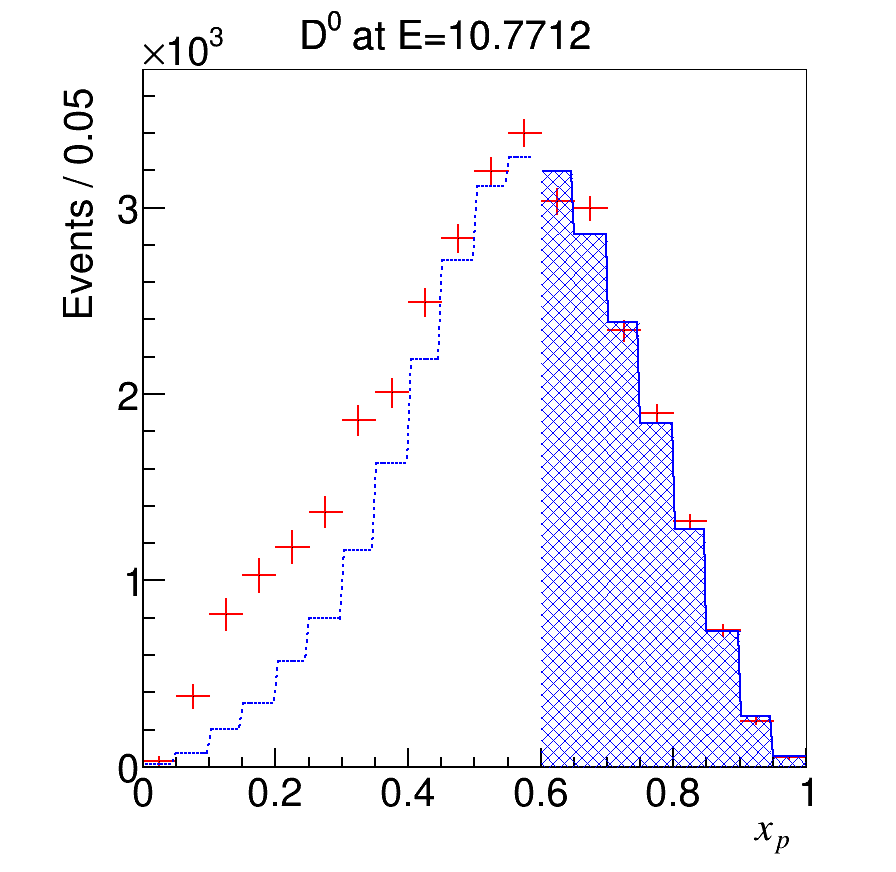
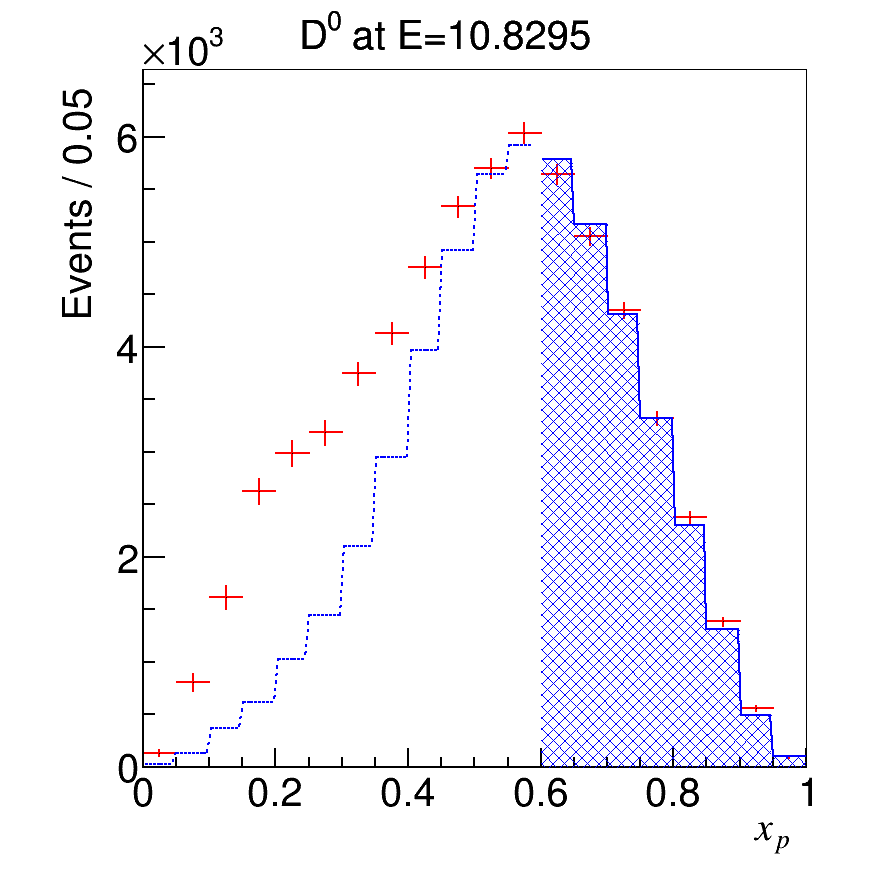
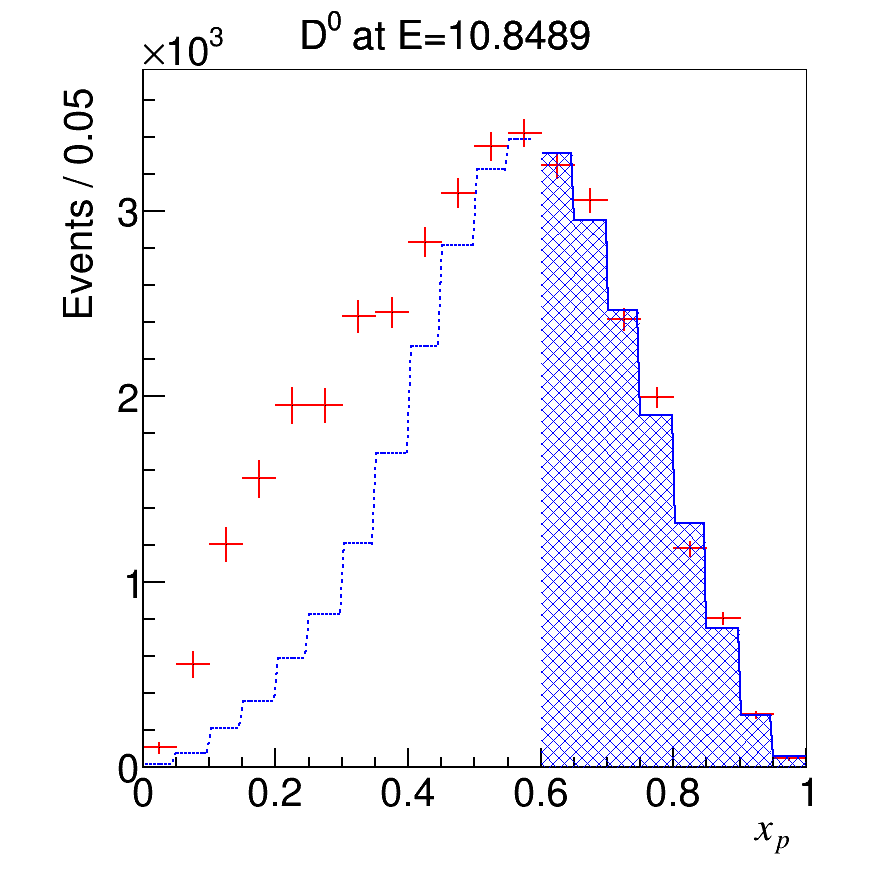
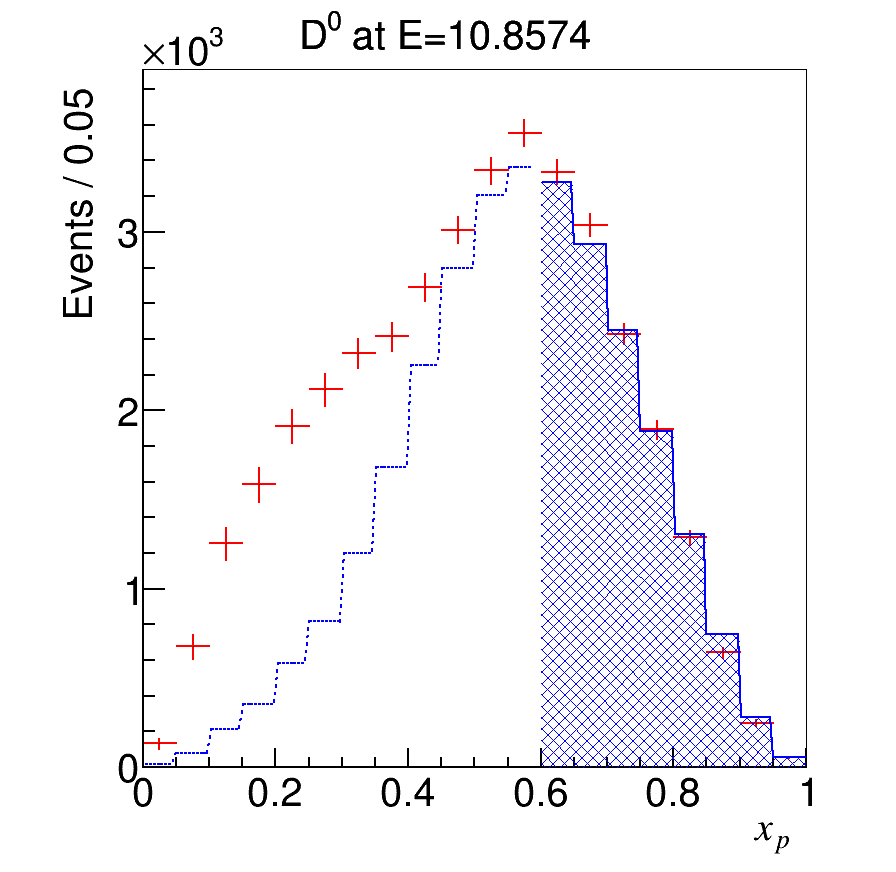
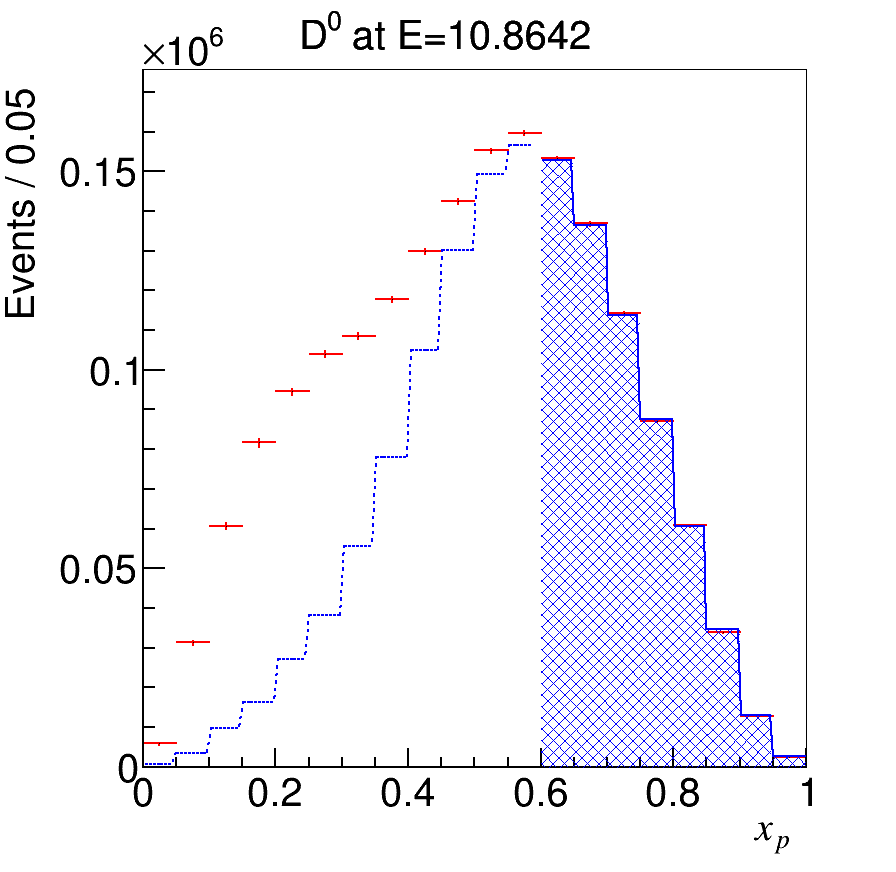
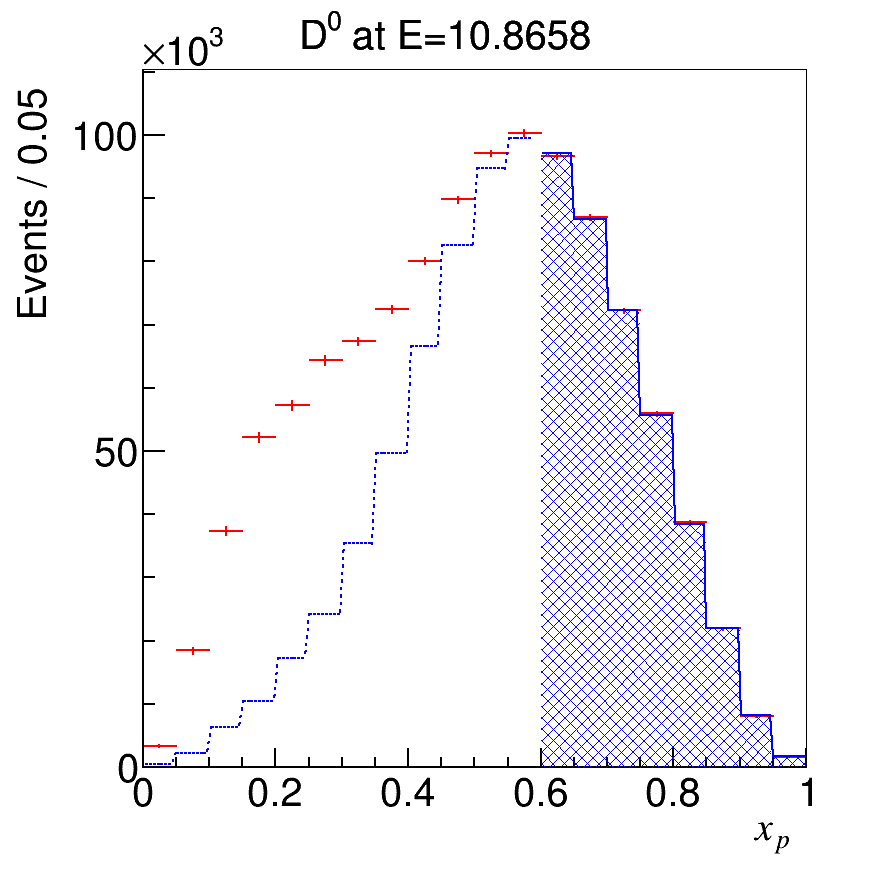
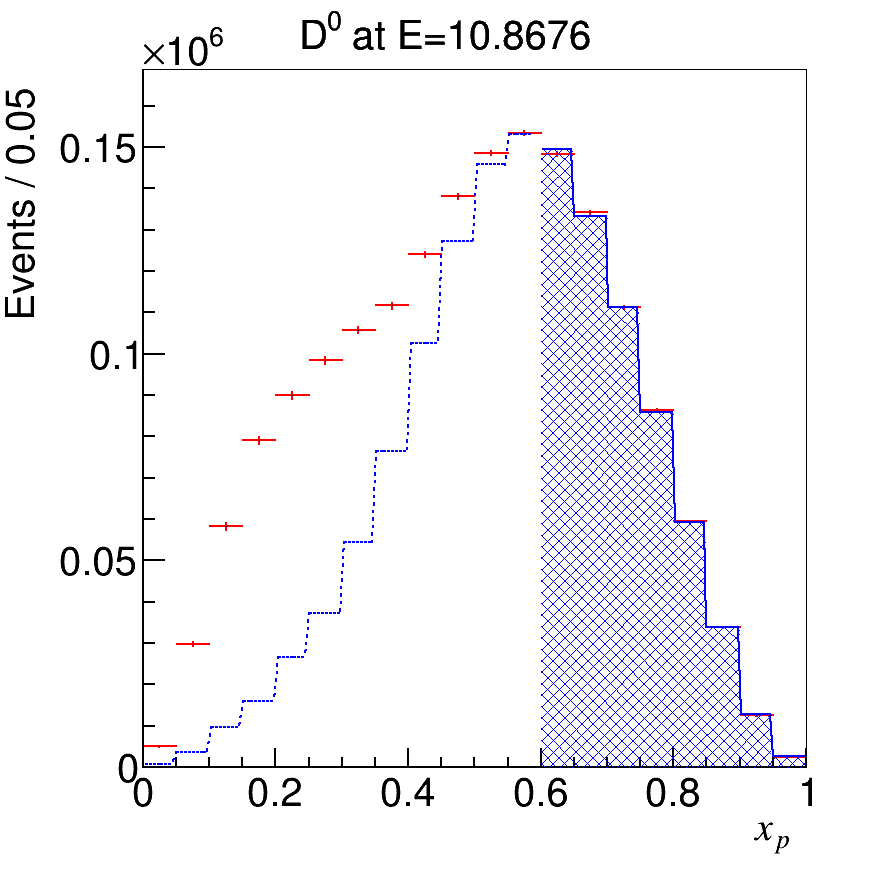
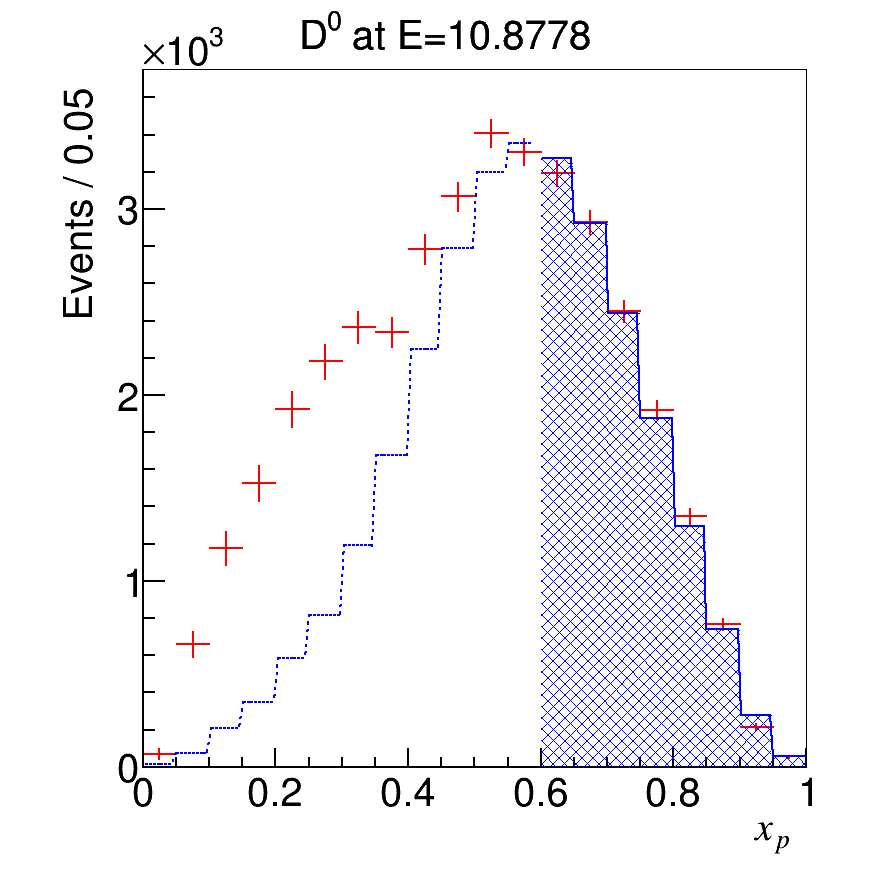
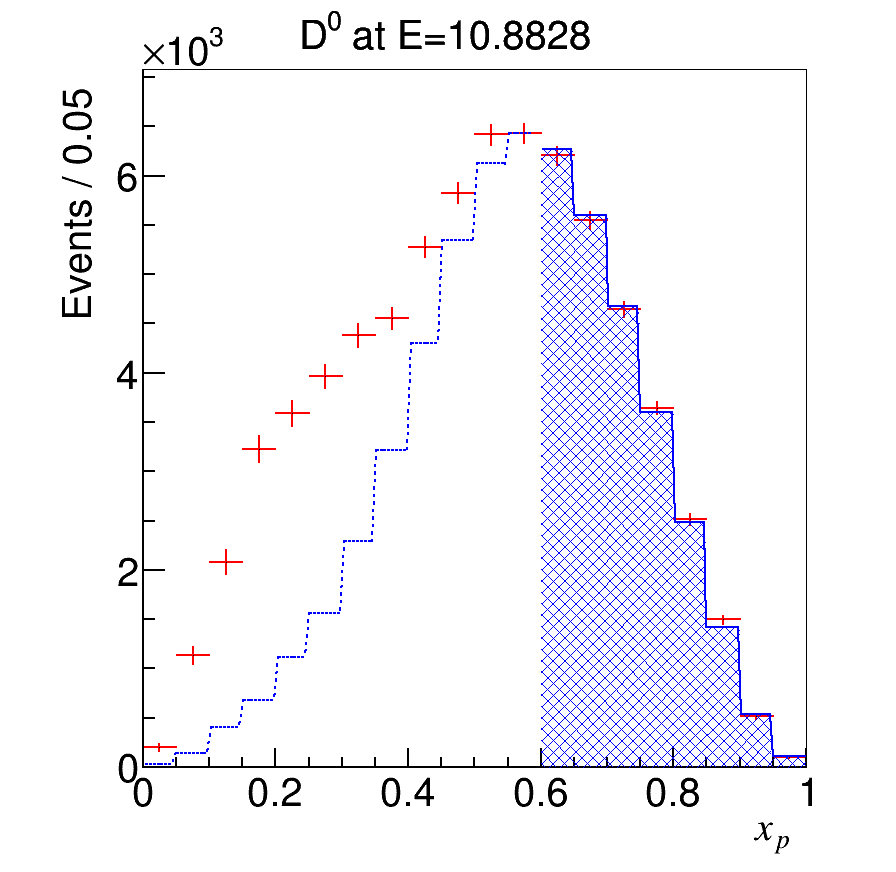
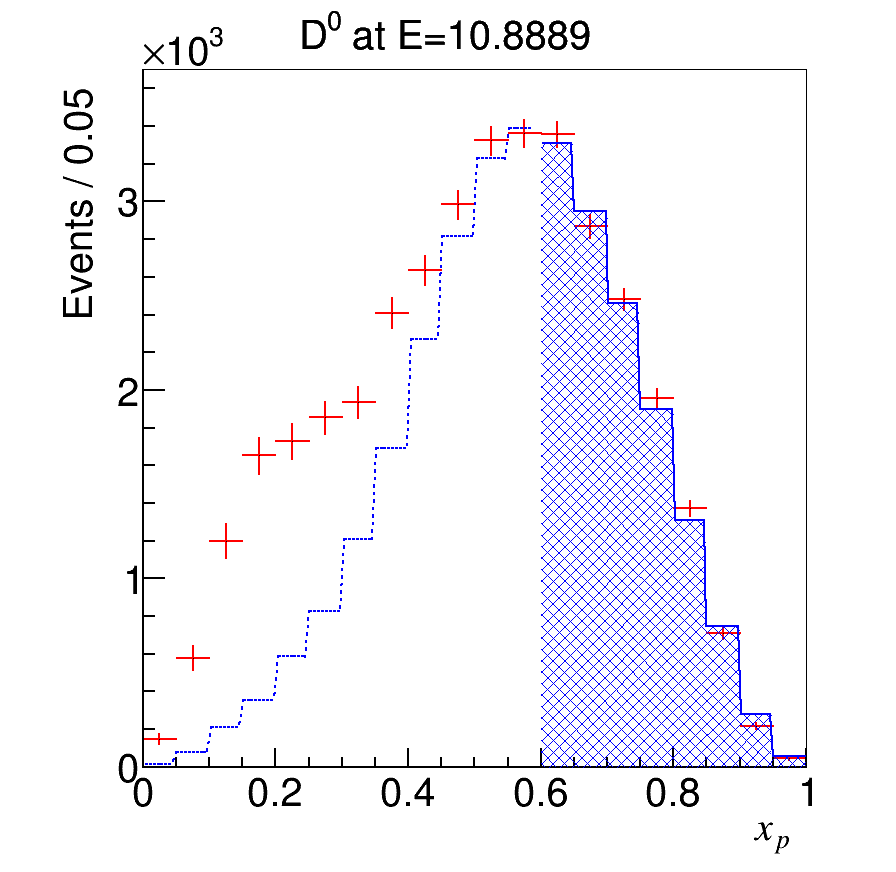
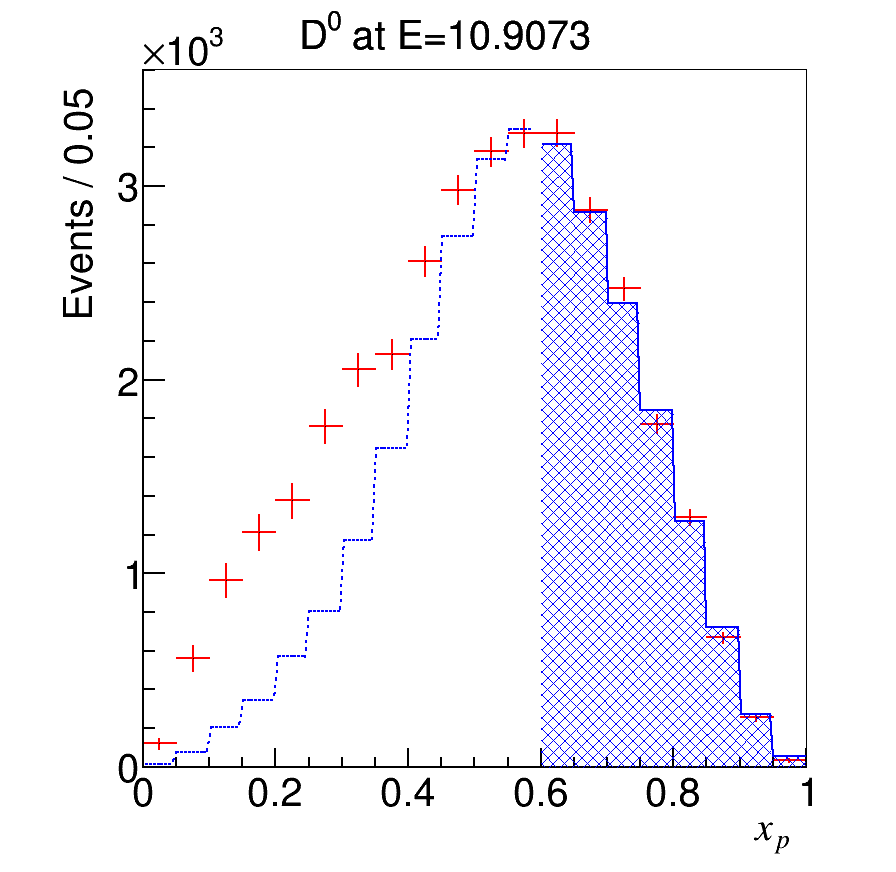
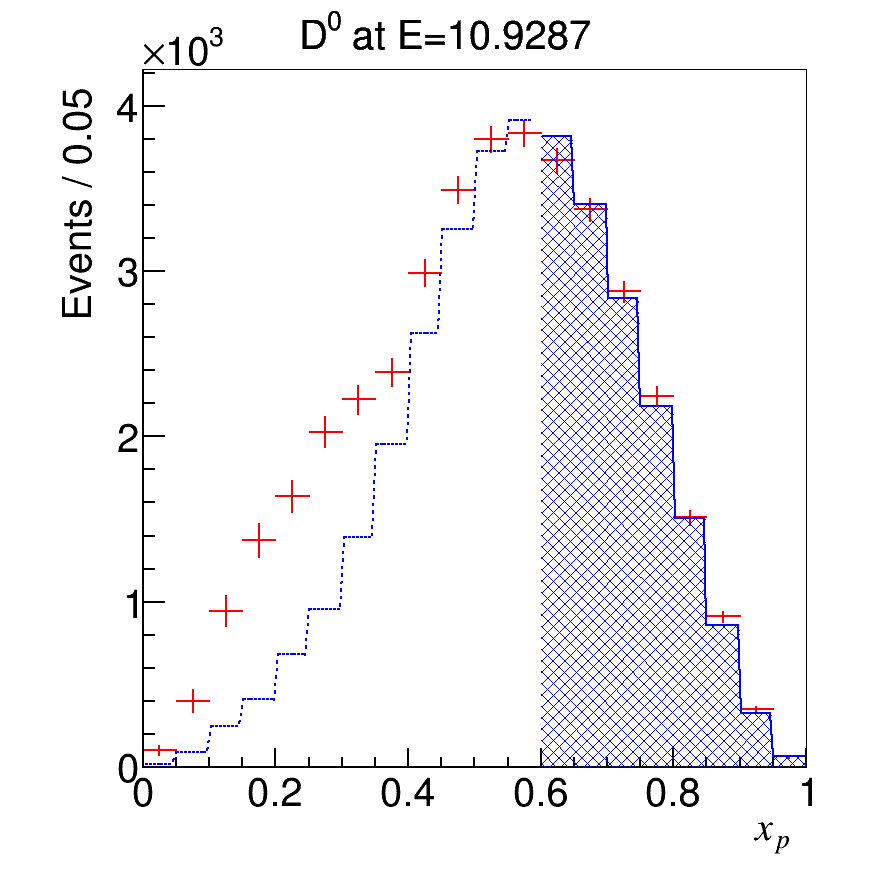
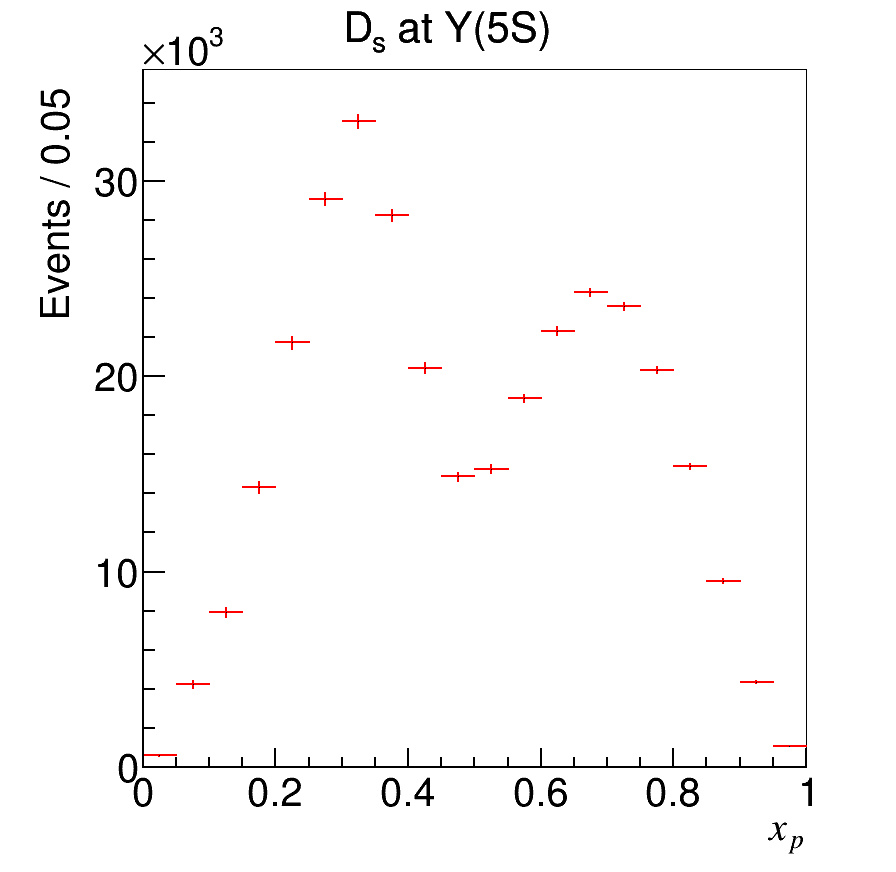
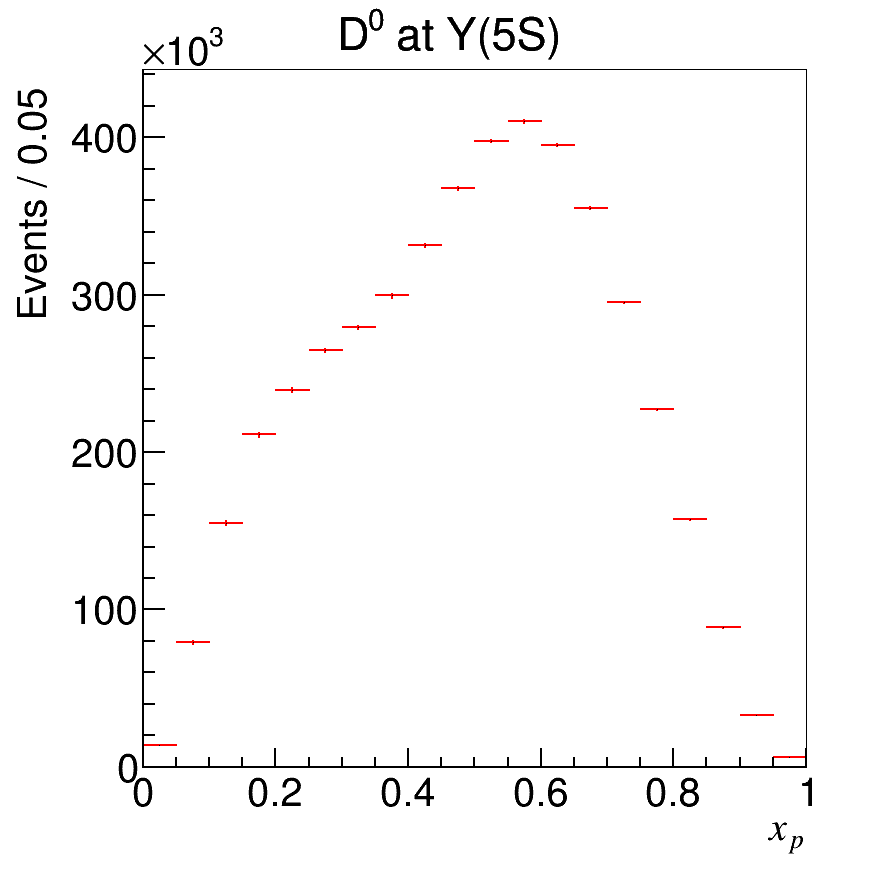
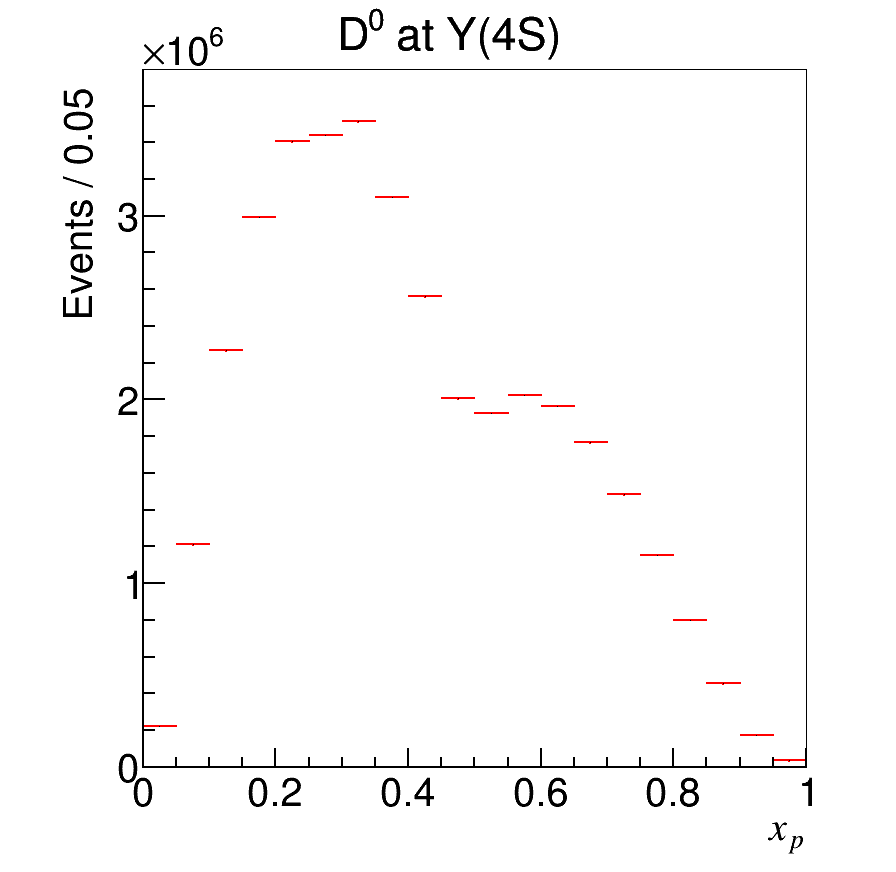
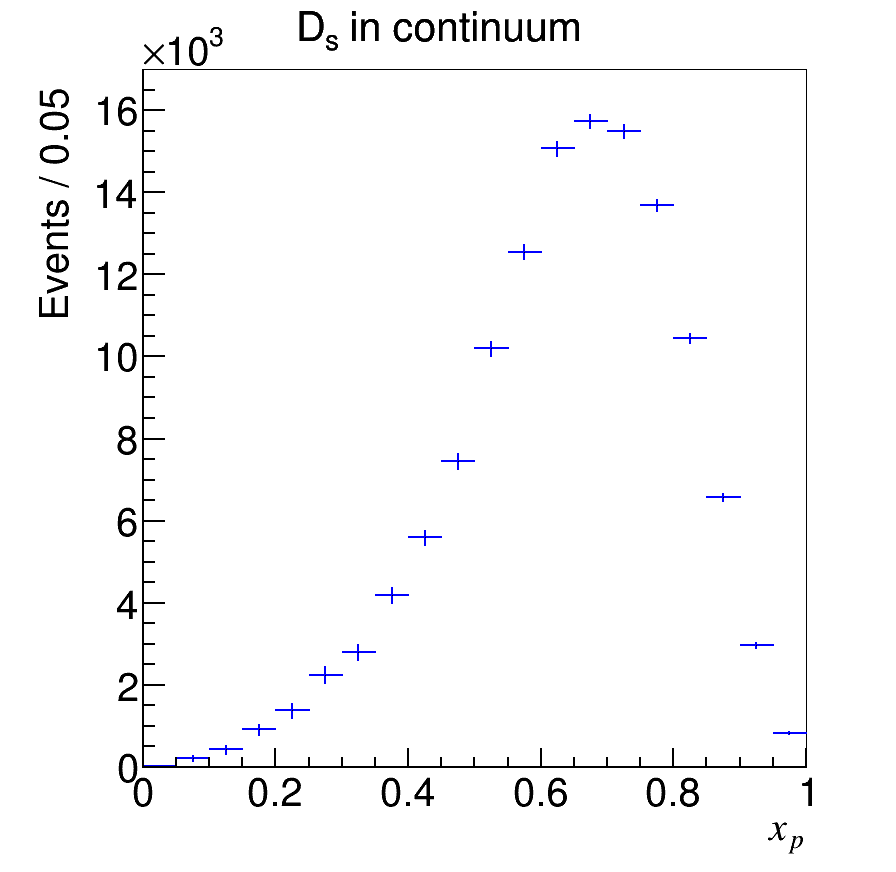
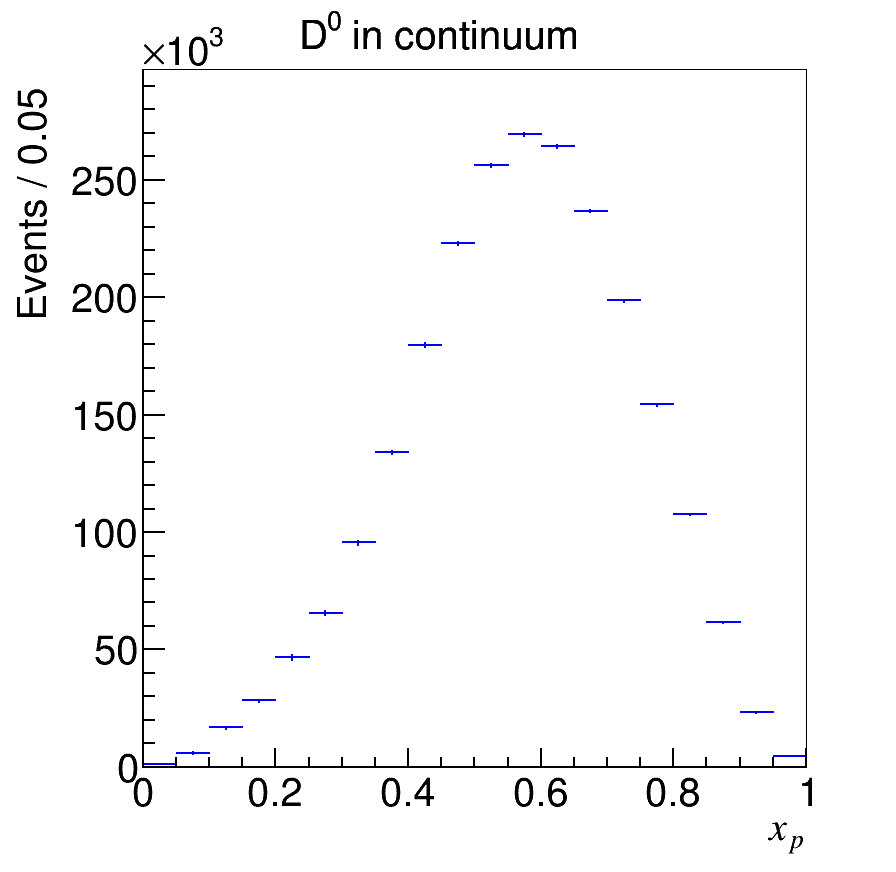
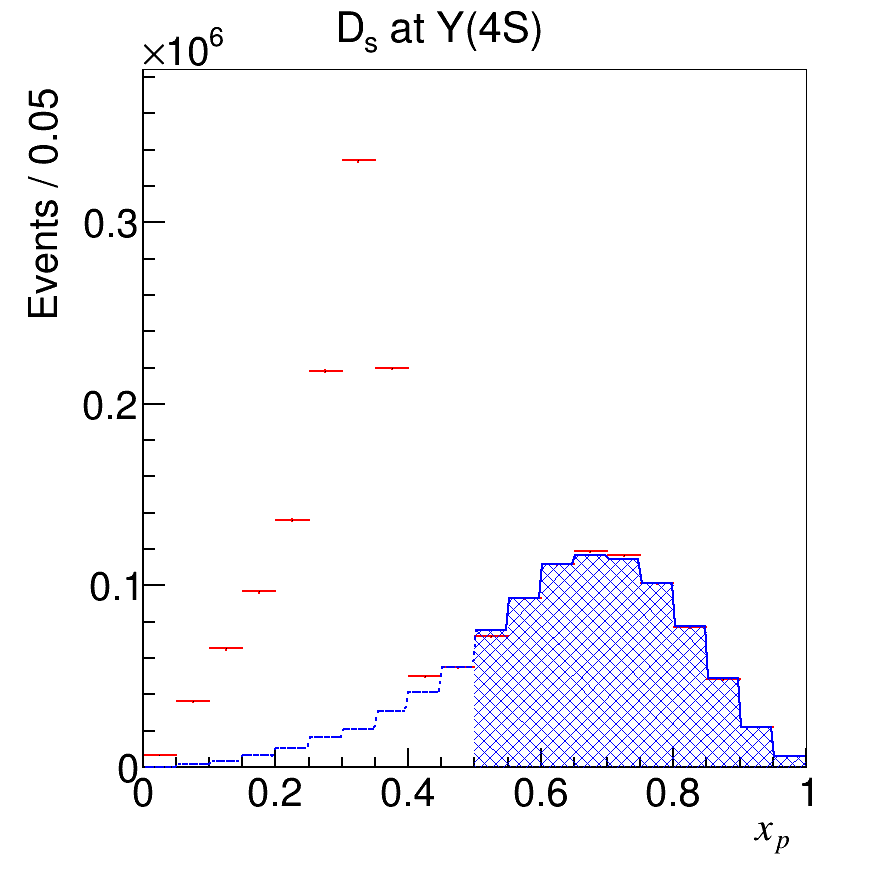
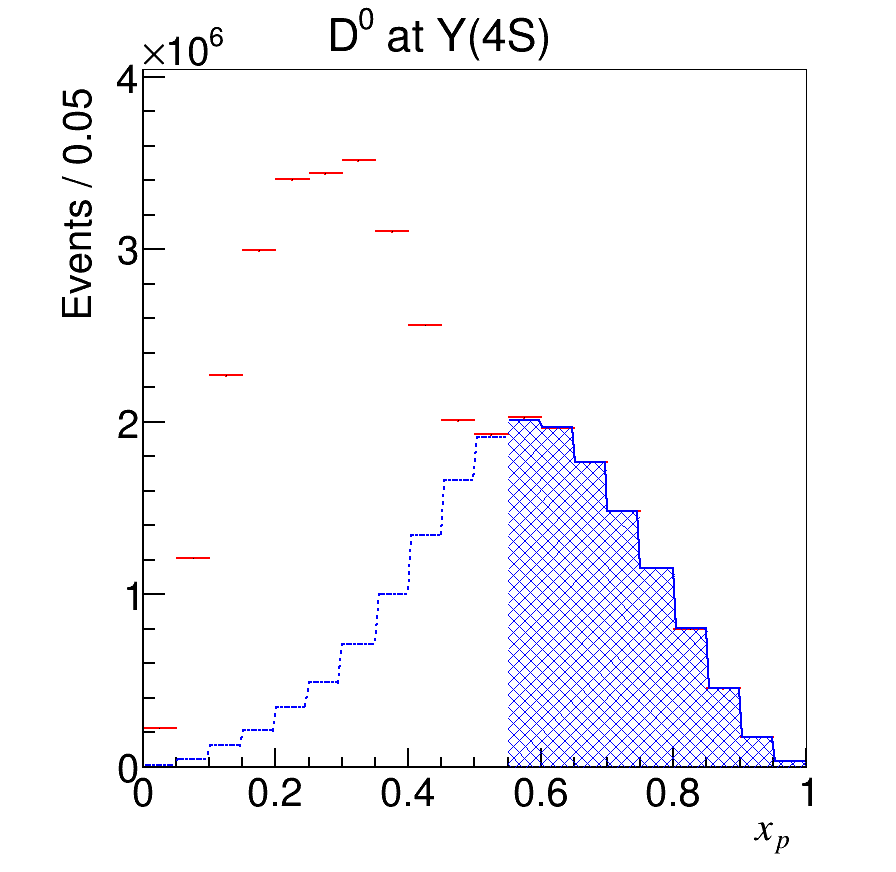
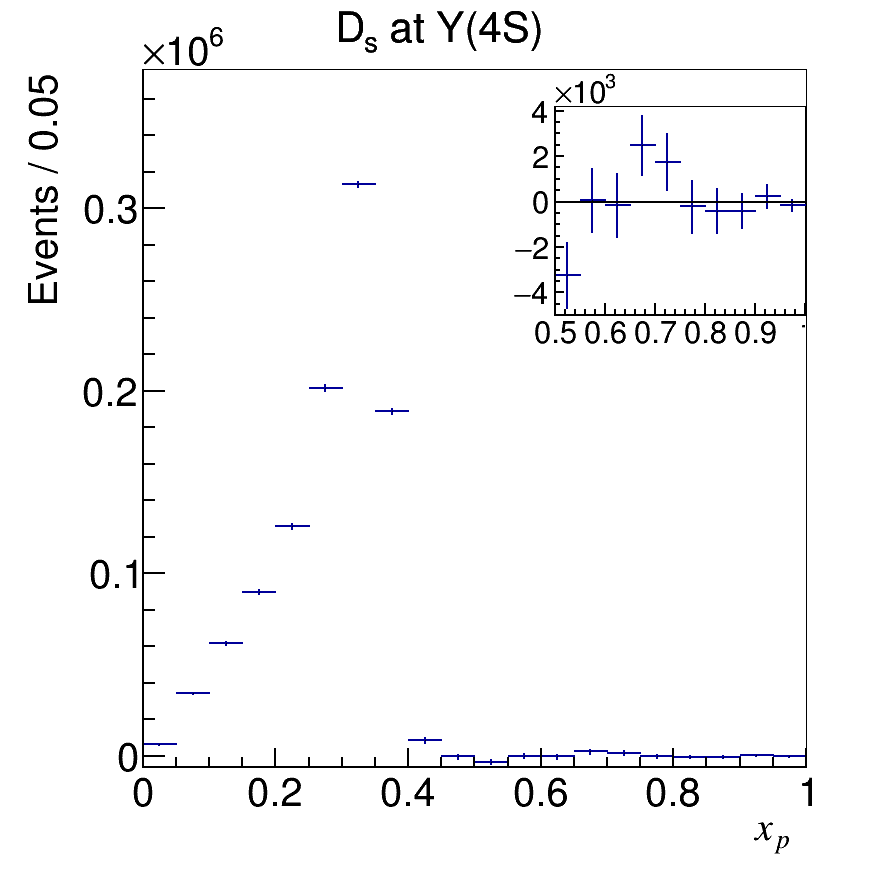
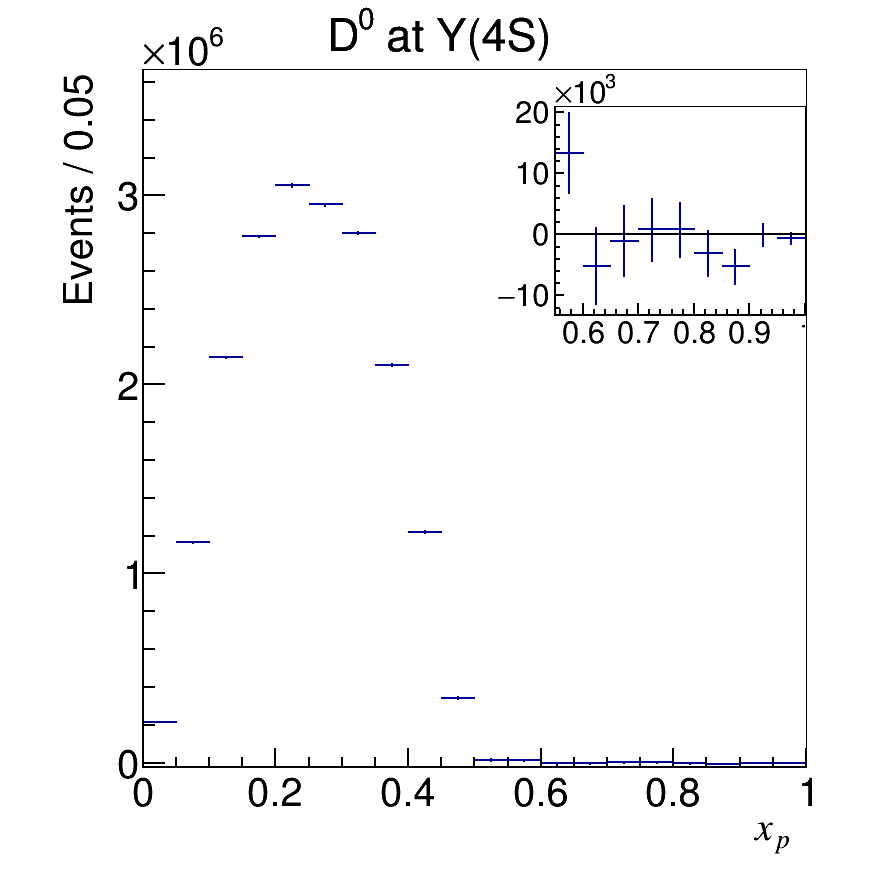
We measure the inclusive and cross sections at various energies above the threshold by subtracting the continuum contribution from the total and cross sections. To perform the subtraction, we use distributions in the normalized momentum , which is defined as ,111We are using units. where is the -meson ( corresponds to or ) momentum measured in the c.m. frame, is the c.m. energy, and is the -meson mass. The spectra of mesons at the energy in the simulated and continuum events are shown in Fig. 1.
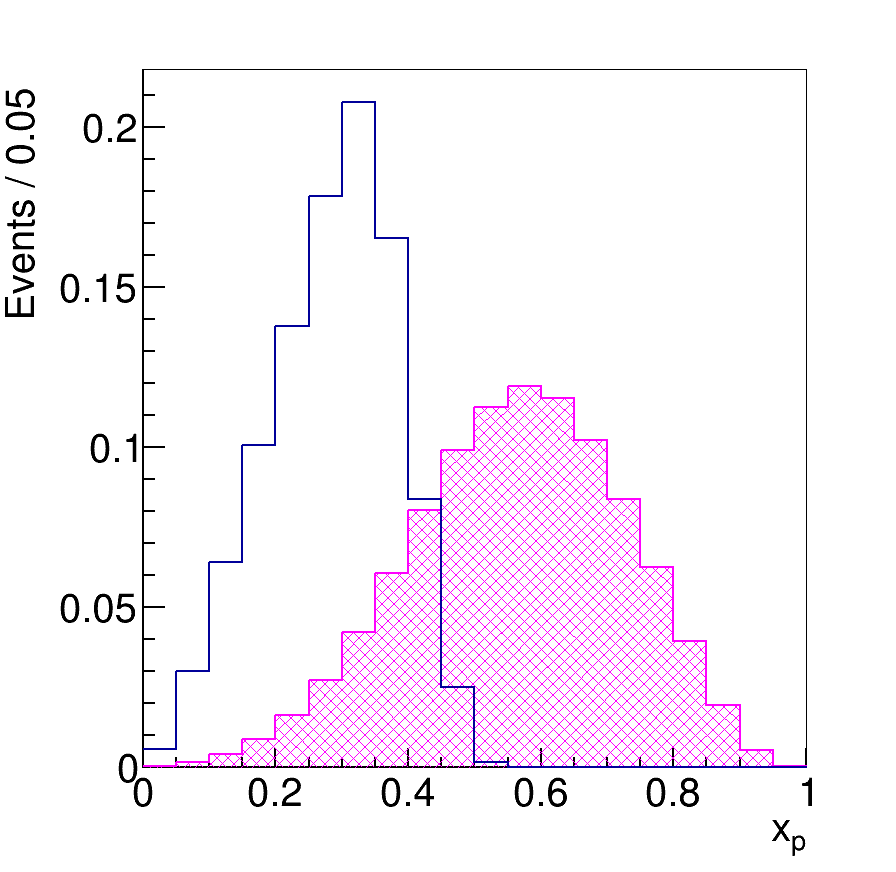 |
The events are restricted to the lower half of the range, while the continuum events are enhanced in the high region. We determine the shape of the continuum contribution using the data collected below the threshold, normalize the contribution using the high region, and subtract. The events remaining after the subtraction are corrected for the efficiency in the bins, and their sum is used to determine .
In the considered energy range, the events are of three types: with mesons ( corresponds to or ), with , and with bottomonium; the latter contributes at the level of a few per cent. Neglecting meson production in bottomonium decays, we write
| (2) |
The multiplicity of mesons is up to two in decays and up to four in events; the branching fractions and the cross sections correspond to the average multiplicity of the mesons in the considered processes. From the system of equations (2), we find the ratio
| (3) |
We determine the ratio by measuring and at the energy and using the value of at this energy reported in Ref. Belle:2021lzm . Then we re-write the system of equations (2) as
| (4) |
We define , and solve the system of equations (4) with respect to and :
where we introduced notations
| (6) | |||
To study energy dependence of the cross section, it is convenient to consider the product , since in this case a rather large uncertainty in will affect only the overall normalization.
Based on the data, we measure and , and use them in Eqs. (3) and (LABEL:eq:solv_general12) to reduce systematic uncertainties.
4 Event selection
All charged tracks are required to be consistent with originating from the interaction point (IP): we require and , where and are the impact parameters perpendicular to and along the beam direction, respectively, with respect to the IP. Information from the TOF, the number of the photoelectrons from the ACC, and the measurement in the CDC are combined to form a likelihood for a hadron hypothesis Nakano:2002jw . Charged kaon candidates are required to have a likelihood ratio . Charged pion candidates are required to have . The efficiency for kaon (pion) identification is about 90% (97%) with a misidentification rate of a pion as a kaon (a kaon as a pion) of about 8% (20%).
The and candidates are reconstructed using only the clean and decay channels.222Throughout this paper, charge conjugation is always included. Since there might be several mesons in an event, we do not apply best candidate selection. The mesons are reconstructed from pairs. The invariant mass of the two kaons should be within from the nominal mass (Fig. 2).
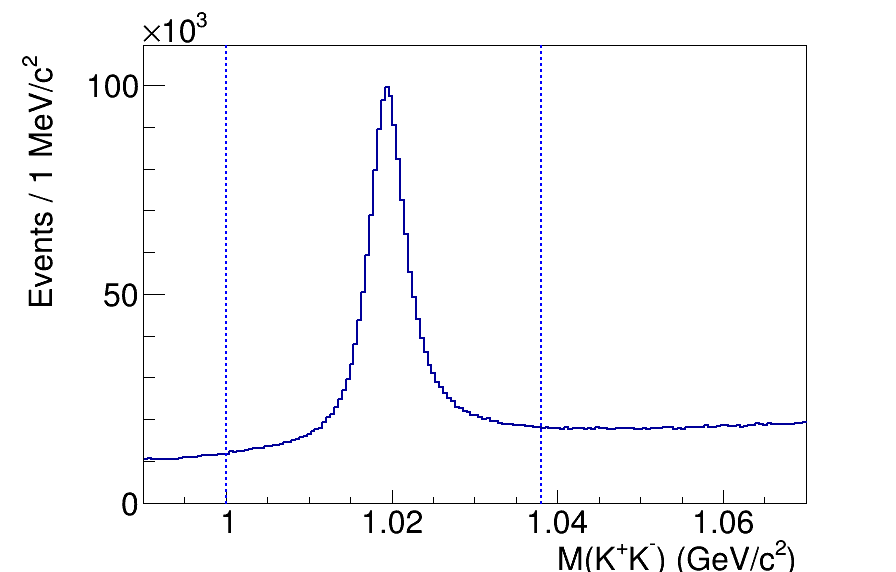
The helicity angle is defined as the angle between the and momenta in the rest frame; a requirement is applied.
5 Analysis of the and data samples
In this section, we describe the analysis of the and data samples. Here our goal is to measure the cross sections , the branching fractions , the production fraction , and the ratio .
5.1 Measurement of
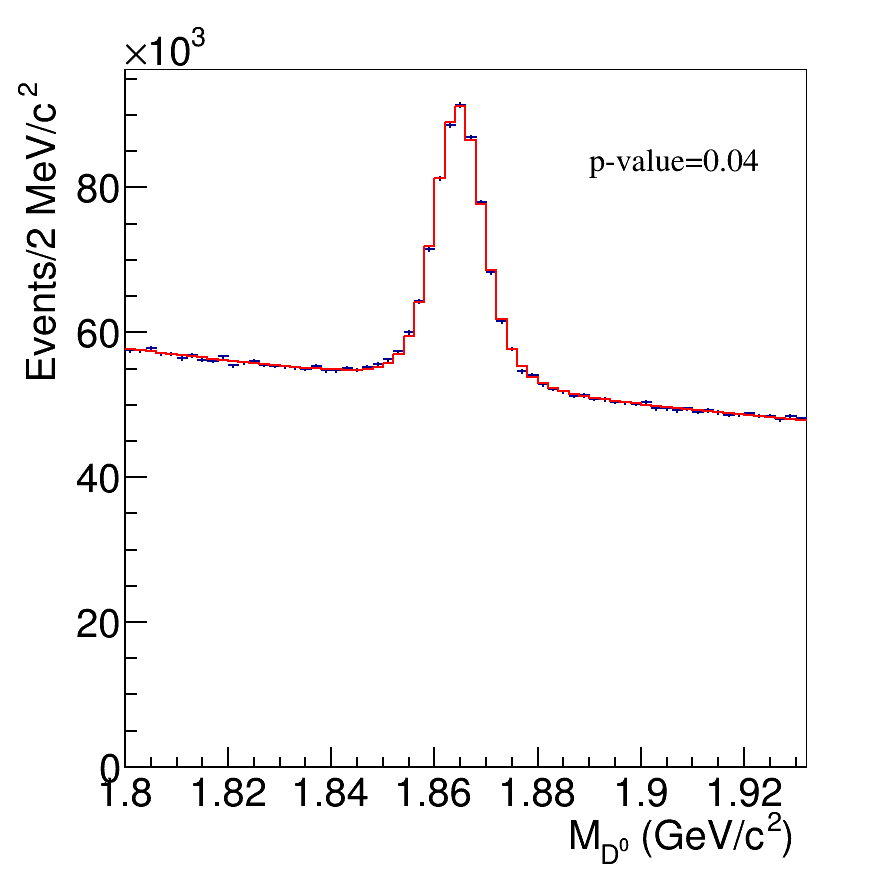
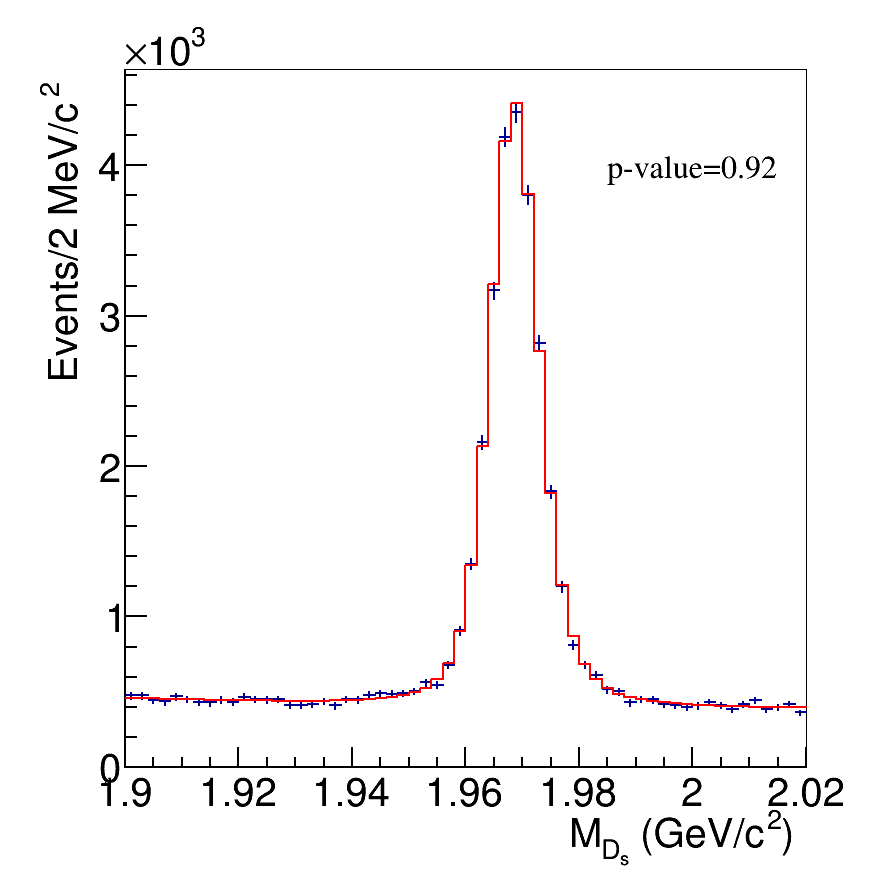
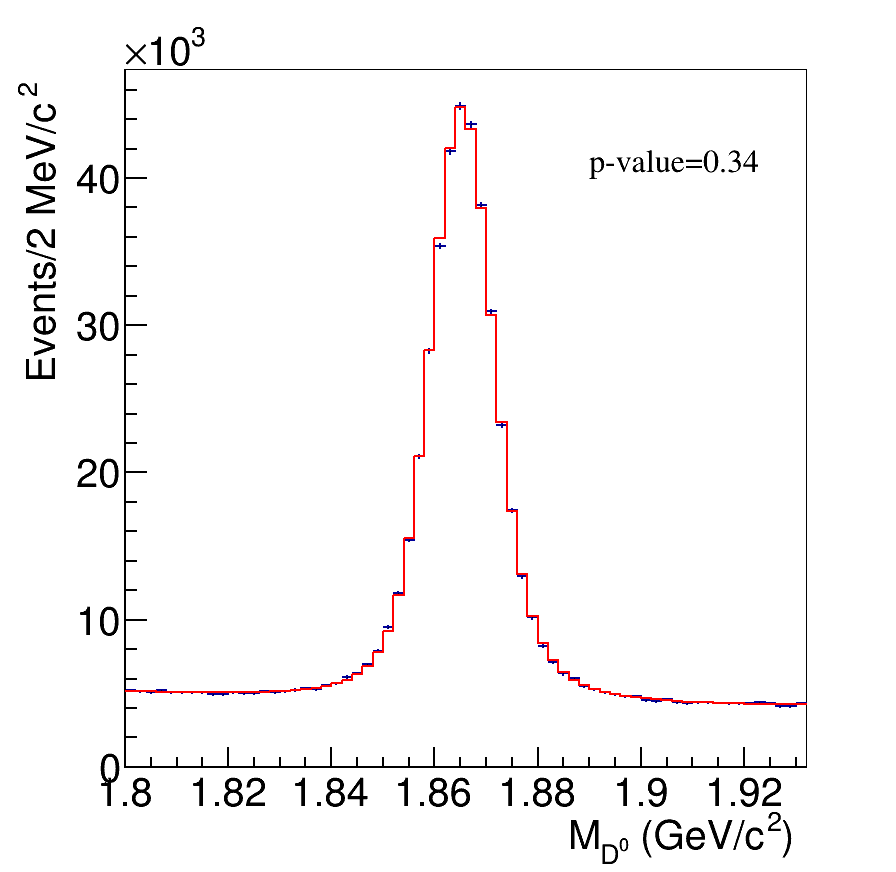
We fit the mass distributions of the and candidates in bins of . The signals are described by a sum of four Gaussians with parameters determined from the MC simulation. We introduce a shift and a broadening factor, common to all Gaussians, that are floated in each bin. The background is described by a second-order polynomial. We use binned likelihood fits. Examples of the fits to the data for bins (0.25, 0.3) and (0.65, 0.7) are shown in Fig. 3. The p-values of the fits, quoted in Fig. 3, are calculated assuming Gaussian errors in each bin.
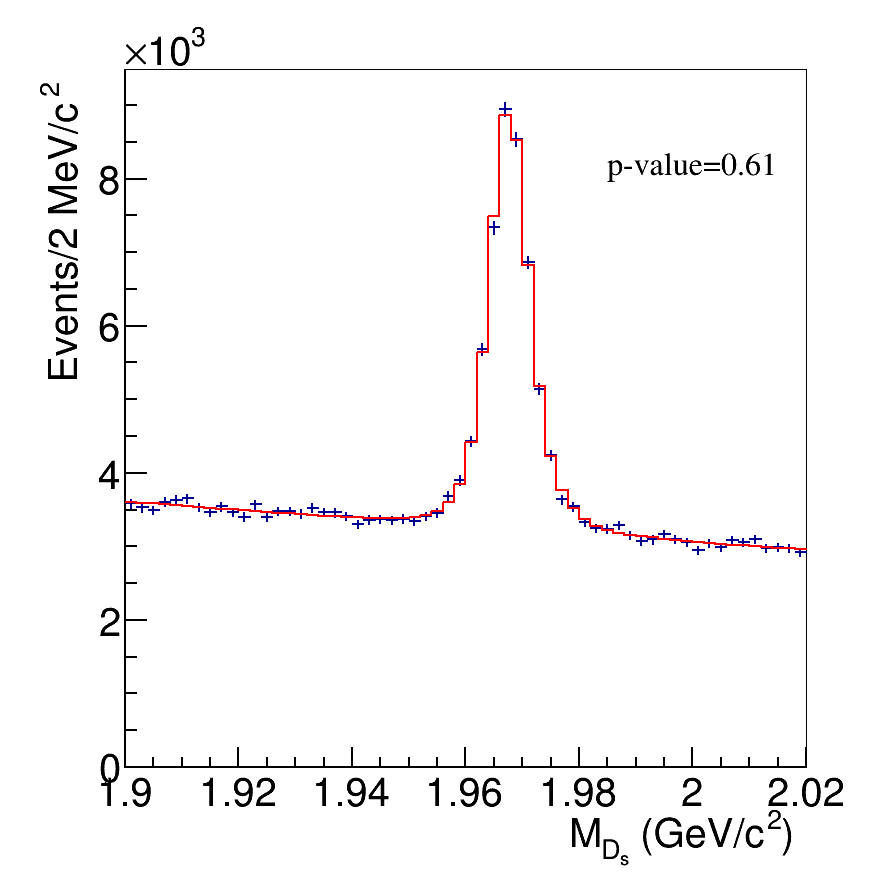 |
 |
 |
 |
The dependence of the and yields on for the , , and continuum data samples is shown in Fig. 4.
 |
 |
 |
 |
 |
 |
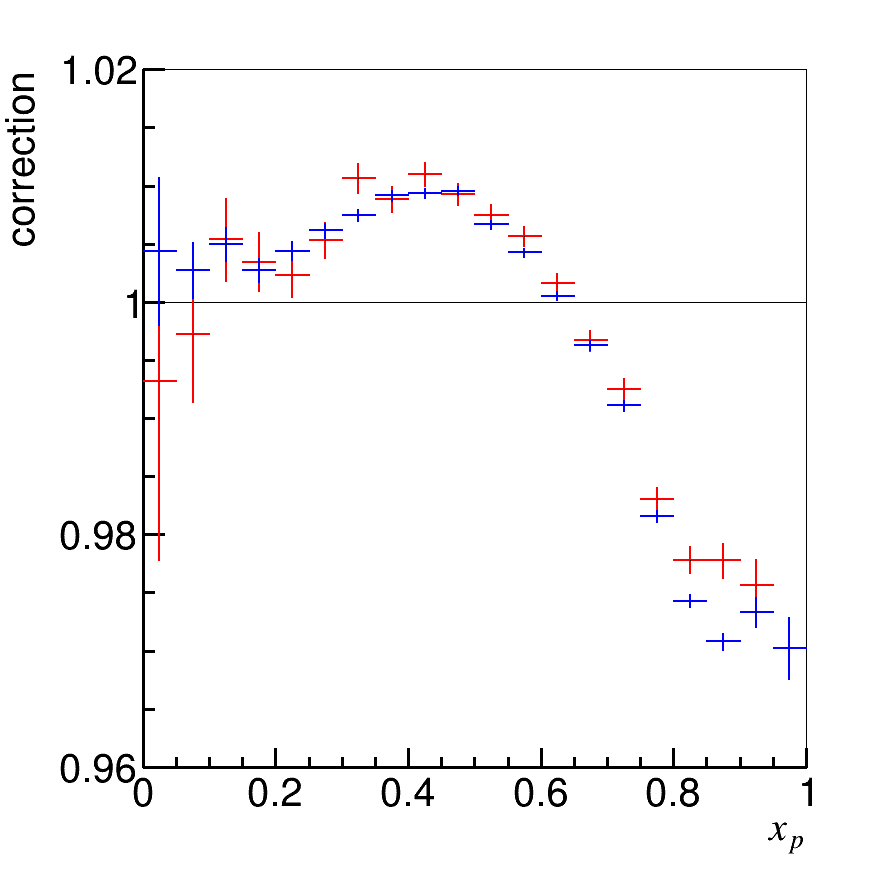
There is a clear enhancement at low in the and data due to the production of the events. We subtract the continuum contribution using the spectra for the data collected below the threshold. The shape of the continuum spectrum changes noticeably between and the energy, primarily due to the evolution of fragmentation with energy. We determine corrections with the help of the event generator developed for Belle II that integrates KKMC and Pythia ref::b2_generators . The KKMC generator is used to simulate initial state radiation and the Pythia generator is used to simulate -quark fragmentation. The correction factors for and , defined as the ratio of the continuum spectra at the energy and at GeV, are shown in Fig. 5. In the case, we find that no correction is needed since the energy is close to 10.52 GeV.
From the MC simulation, we find that events contribute only at lower values: the highest bin with a contribution, , and the corresponding upper bin edge , are shown for and in different data samples in Table 1.
| at | at | at | at | |
| 11 | 12 | 10 | 11 | |
| 0.55 | 0.60 | 0.50 | 0.55 | |
| 1.516 | 7.430 | |||
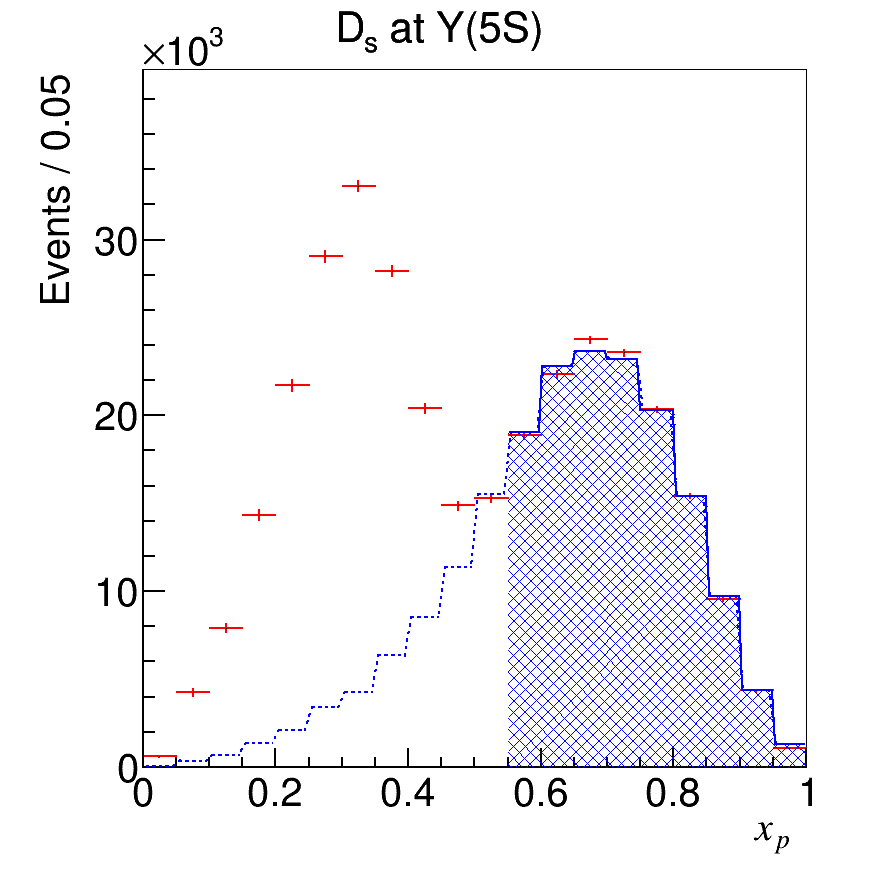
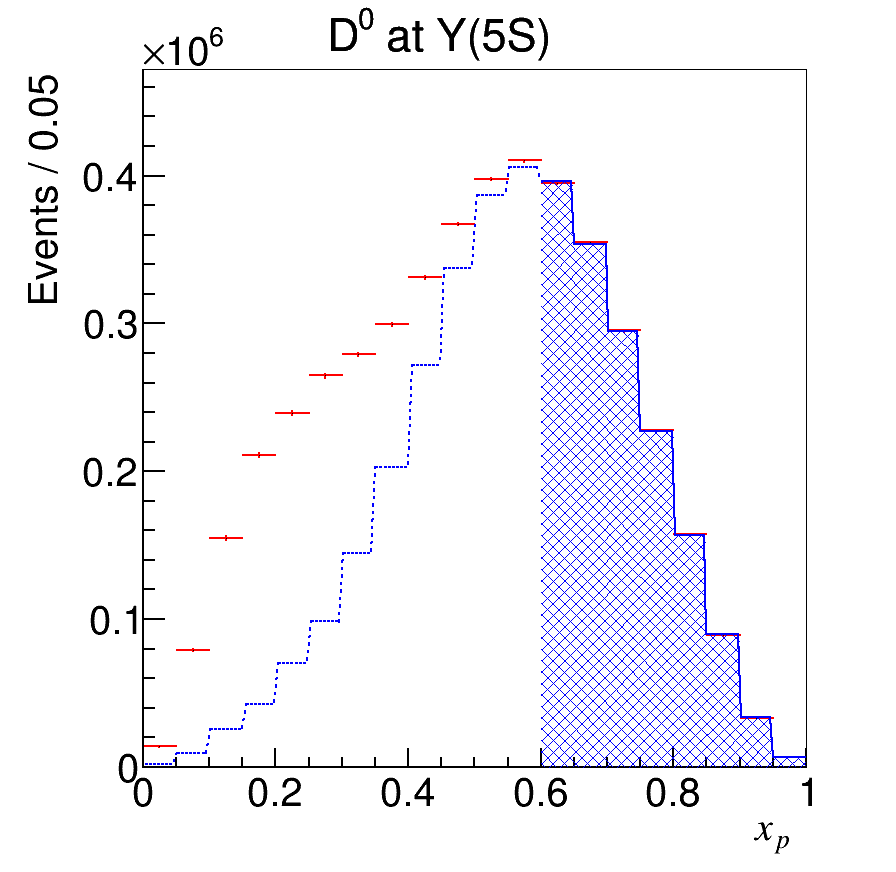
Thus, we use the region for the normalization of the continuum distribution and fit the and data in this range using the (corrected) spectrum of the data below the threshold as the fitting function. The results of these fits are shown in Fig. 6.
 |
 |
 |
 |
The normalization factors for the continuum contribution obtained from the fits are listed in Table 1. These factors can be roughly estimated as
| (7) |
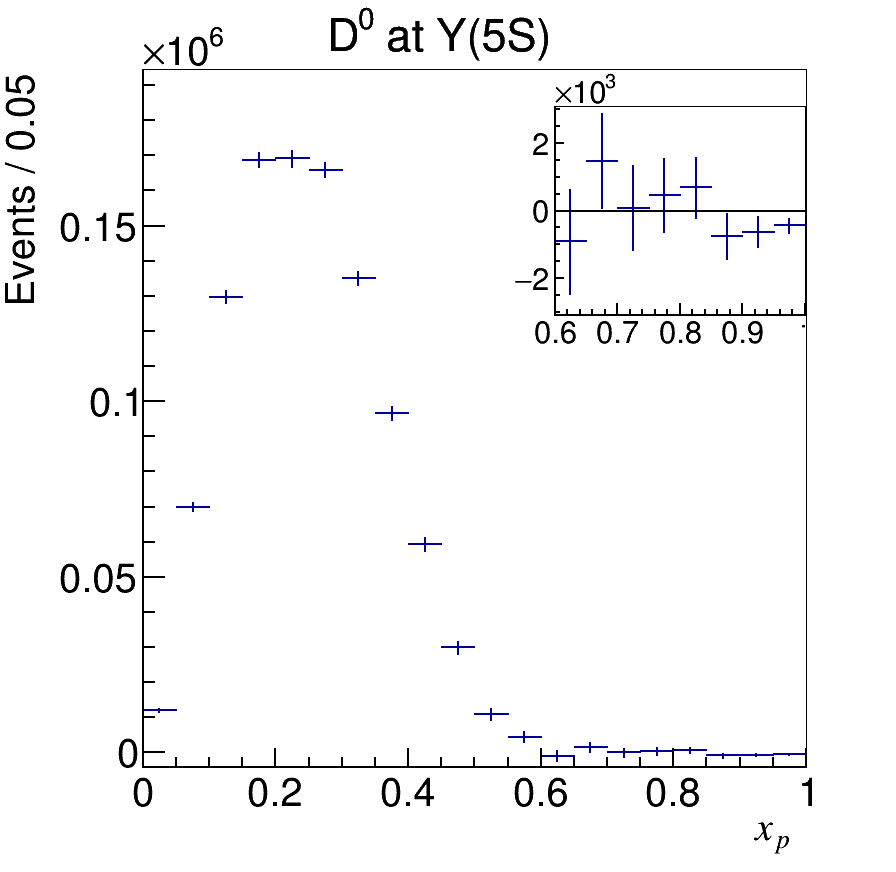
where runs over and , “cont” denotes data sample collected below the threshold, and are the corresponding energy and integrated luminosity. The values of are in reasonable agreement with the fit results, as shown in Table 1. The spectra after the continuum subtraction are shown in Fig. 7. The points in the subtraction region are consistent with zero, which indicates that the continuum spectra are determined correctly.
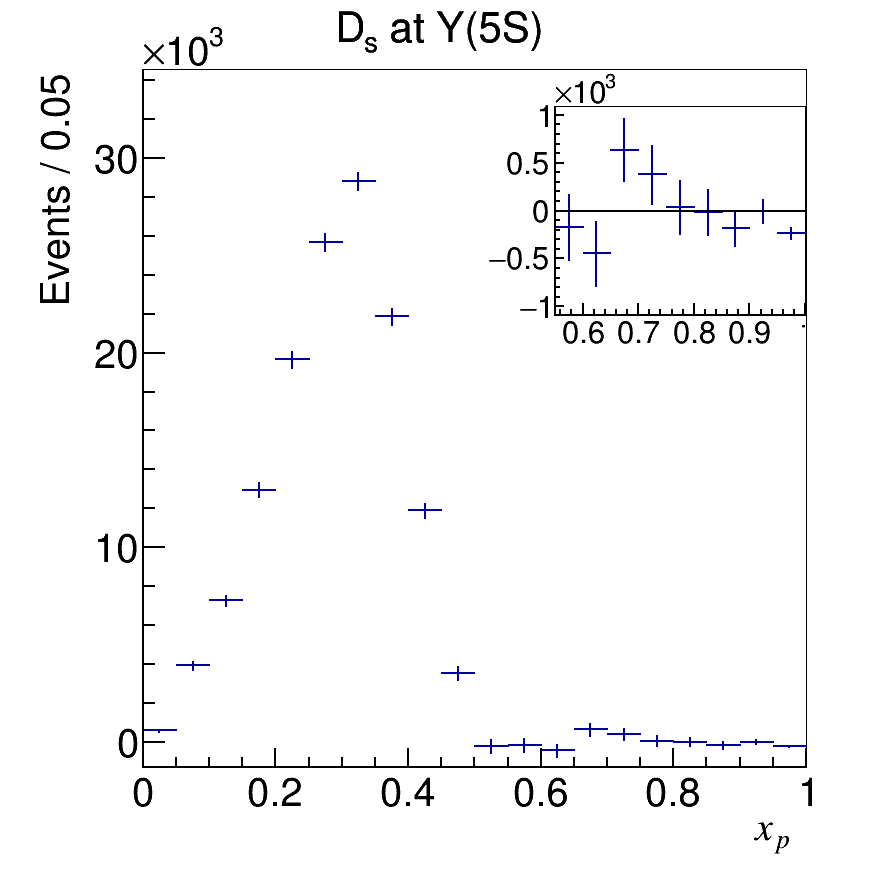 |
 |
 |
 |
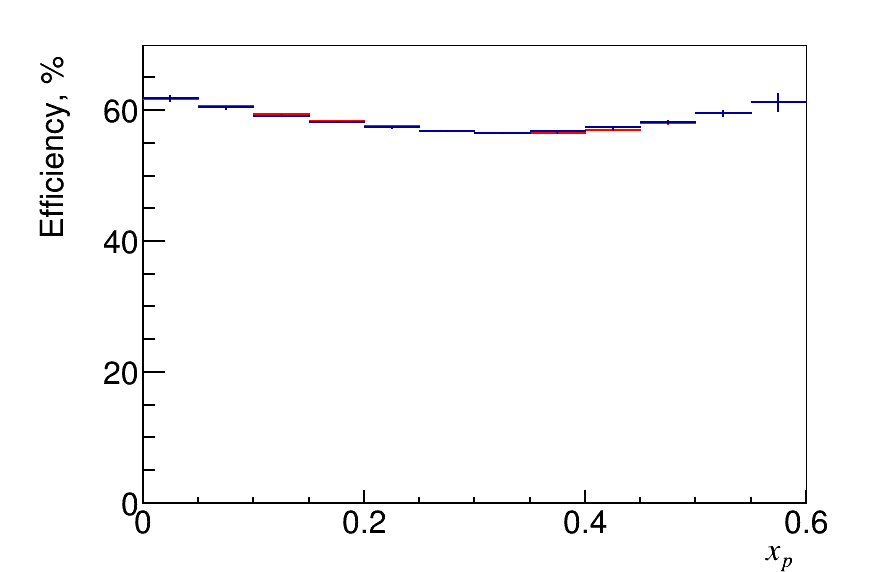
The meson reconstruction efficiency as a function of is shown in Fig. 8. It takes into account the known difference between data and simulation for particle identification efficiency; the corresponding momentum and polar angle dependent correction factors are determined using the decays Nakano:2002jw . The presented reconstruction efficiency includes the efficiency of the mass and helicity angle requirements.
 |
 |
We introduce a correction factor to account for the difference in distribution between the data and the MC simulation. To determine , we fit the mass distributions for the candidates that satisfy the mass and helicity angle requirements and that are rejected by them. Based on the corresponding signal yields, and , we find
| (8) |
Here we use events with , where background is low and all bins are well-populated. To estimate systematic uncertainty, we vary the considered interval. The result is
| (9) |
Here and throughout this paper if two uncertainties are shown, the first is statistical and the second is systematic.
The inclusive visible cross sections are calculated as
| (10) |
and
| (11) |
where runs over the bins, the values of are given in Table 1, and are the numbers of the mesons in the -th bin in the on-resonance and continuum spectra, respectively, is the reconstruction efficiency in the -th bin, is the integrated luminosity of the or data samples, and ParticleDataGroup:2022pth ; is given in Table 1, and is given in Eq. (9). The cross section values measured at the and are listed in Table 2.
Their statistical uncertainties are calculated as
| (12) |
where is the inclusive cross section in the -th momentum bin and is the statistical uncertainty of the quantity .
Below we list various contributions to the systematic uncertainty in the cross sections; corresponding summary is presented in Table 3.
-
•
We vary the fit model for the mass spectra of the candidates. In particular, we (1) introduce one additional shift for one narrow Gaussian; (2) introduce additional shift and broadening factor for one narrow Gaussian; (3) change the background function from 2nd- to 3rd-order polynomial. Variations (1) and (3) result in negligibly small changes in the cross section. The uncertainties related to variation (2) are shown in Table 3.
-
•
Contribution of the statistical error in the continuum spectrum is calculated as
(13) -
•
The systematic uncertainty related to the continuum spectrum correction is estimated as half of the change in the cross section obtained with and without this correction.
-
•
The contribution of the MC statistical error is calculated as
(14) -
•
We account for the 0.6% uncertainty in .
-
•
The systematic uncertainty of the track reconstruction efficiency, estimated using partially reconstructed , and events, is 0.35% per track; thus we have 1.1% for and 0.7% for .
-
•
The uncertainty of the identification efficiency is due to a possible difference between MC and data. This difference is studied using decays — see Chapter 5.4 of Ref. BaBar:2014omp . The uncertainty is calculated as 2.3% for and 1.4% for .
-
•
The uncertainty in the integrated luminosity is 1.4%.
-
•
The uncertainty in the world average is 1.9% and in is 0.8% ParticleDataGroup:2022pth .
The total systematic uncertainty is calculated by adding the various contributions in quadrature.
| Source | at | at | at | at |
|---|---|---|---|---|
| Fit model | 0.6 | 0.3 | 1.0 | 1.1 |
| Cont. spectrum stat. unc. | 0.6 | 0.4 | 0.4 | 0.1 |
| Cont. spectrum correction | 0.3 | 1.3 | - | - |
| MC statistical unc. | 0.2 | 0.1 | 0.1 | 0.0 |
| 0.6 | - | 0.6 | - | |
| Tracking | 1.1 | 0.7 | 1.1 | 0.7 |
| identification | 2.3 | 1.4 | 2.3 | 1.4 |
| Integrated luminosity | 1.4 | 1.4 | 1.4 | 1.4 |
| Branching fraction | 1.9 | 0.8 | 1.9 | 0.8 |
| Total | 3.6 | 2.6 | 3.7 | 2.5 |
Cross sections for various bins are presented in Appendix A.
5.2 Determination of
The branching fractions are found as
| (15) |
where we use the cross sections measured at the . The total cross section is calculated as
| (16) |
where is the total number of the pairs in the SVD2 data Belle:2012iwr and is the total integrated luminosity of this data sample. The number is obtained by counting the hadronic events at the and subtracting the continuum contribution determined using the data below the threshold. The transitions from to lower bottomonia have a total branching fraction of 0.26% ParticleDataGroup:2022pth and are neglected.
Using the cross section values presented in Table 2, we find
| (17) | |||||
| (18) |
The systematic uncertainty due to the integrated luminosity is the same in the numerator and denominator of Eq. (15) and, therefore, cancels.
The world-average results obtained by a similar method are for and for ParticleDataGroup:2022pth . Our uncertainties are lower than those of the world-average values; there is a tension in the channel. One can also use for comparison the measurements performed with a full reconstruction of one meson in the event BaBar:2006wbf . In this case, one has to add branching fractions for and . The results are and ; the agreement with our measurements is better.
5.3 Production fractions at the
We determine the average number of the mesons produced at the as
| (19) |
Using the values from Table 2 and Belle:2012tsw , we find
| (20) | |||||
| (21) |
These results agree with the previous measurements for and for Belle:2006jvm , and supersede them.
The fraction of events produced at the is defined as
| (22) |
where can be found from the first equation of (2)
| (23) |
Then, using Eq. (15) for , we find
| (24) |
Using from Table 2, Belle:2021qxu , and pb Belle:2021lzm , we obtain:
| (25) |
While estimating the systematic uncertainty in , we take into account that the systematic uncertainties of the quantities entering Eq. (24) are correlated and to a large extent cancel.
-
•
The uncertainty due to the integrated luminosity is the same in all ’s in Eq. (24) and, therefore, cancels in .
-
•
Both quantities and contain the same uncertainty due to Belle:2021lzm — it cancels in their ratio.
-
•
The uncertainties due to the reconstruction efficiency and the -meson branching fraction are fully correlated between the inclusive cross sections in the numerator. They are treated as common correlated errors for the resulting value of , and, thus, the total uncertainty in the difference is considerably reduced.
The individual contribution from each quantity and the correlated contributions are listed in Table 4. We sum all presented errors in quadrature to obtain the total systematic uncertainty.
| Source | Systematic uncertainty (%) |
|---|---|
| 1.4 | |
| 0.7 | |
| 1.4 | |
| 10.5 | |
| 4.5 | |
| Correlated contributions | |
| – tracking | 1.1 |
| – identification | 2.3 |
| – | 0.6 |
| – | 1.9 |
| Total | 12.0 |
To improve the accuracy in , we use the relation
| (26) |
where Belle:2021lzm is the fraction of the events at and is the fraction of events without open-bottom mesons in the final state. The fraction is due to the transitions to lower bottomonia with the emission of light hadrons. In Ref. Belle:2021lzm , it was estimated that the known bottomonium channels sum up to
| (27) |
We perform a fit to three measurements: , and , applying one constraint – Eq. (26). The free parameters of this fit are the fitted values of the production fractions. Since potentially not all bottomonium channels are known, we use Eq. (27) as a constraint from below. The production fractions contain a factor which results in a correlated uncertainty of 4.5% (Table 4). The presence of on the right-hand side of Eq. (24) results in an anti-correlated uncertainty in and of 1.4% and 2.4%, respectively. The above value for is taken from Table 4; the value for is obtained taking into account that the uncertainty in in Eq. (24) partially cancels. The correlated uncertainties are taken into account using the method described in Ref. HFLAV:2022pwe . From the fit, we find
| (28) |
This result for supersedes the previous Belle measurement Belle:2012tsw obtained with a model-dependent estimate ; it also supersedes the result reported in Ref. Belle:2021qxu .
5.4 Determination of
The measurements presented in Eqs. (17) and (18), and in Table 2 are substituted in Eq. (3); we find
| (29) |
As in the case of , here we consider the correlations between the systematic uncertainties of the quantities in Eq. (3).
-
•
The uncertainty due to integrated luminosity cancels in the ratio of the cross sections.
-
•
The uncertainty due to cancels in the product of and (we note that is inversely proportional to ).
-
•
The uncertainties due to the reconstruction efficiency and the -meson branching fractions are completely correlated between the two terms in the numerator of Eq. (3). This correlation considerably reduces the uncertainty in the difference of the two terms. The same is true about the denominator.
-
•
The uncertainty due to tracking efficiency partly cancels between the numerator and the denominator (two tracks in the numerator and three tracks in the denominator).
-
•
We conservatively assume that the uncertainties due to the particle identification are not correlated between the numerator and the denominator because the corresponding momentum spectra of kaons and pions are different.
In Table 5 we list first the uncorrelated contributions from the quantities in Eq. (3), and then the correlated contributions; the total uncertainty is the sum in quadrature of all listed errors.
| Source | Systematic uncertainty (%) |
|---|---|
| 13.3 | |
| 1.4 | |
| 11.2 | |
| 0.8 | |
| 13.7 | |
| Correlated contributions | |
| – tracking | 0.4 |
| – identification | 2.7 |
| – | 0.6 |
| – | 1.9 |
| – | 0.8 |
| Total | 22.2 |
The fractions of and events at the and are different: at the ratio of production fractions Belle:2022hka , while at this ratio is expected to be close to one since is far from the production thresholds and no isospin violation is expected. Given that the branching fractions and are considerably different ParticleDataGroup:2022pth , we expect at the to be lower than at the , here denotes the relevant mixture of and . The effect is small and is neglected.
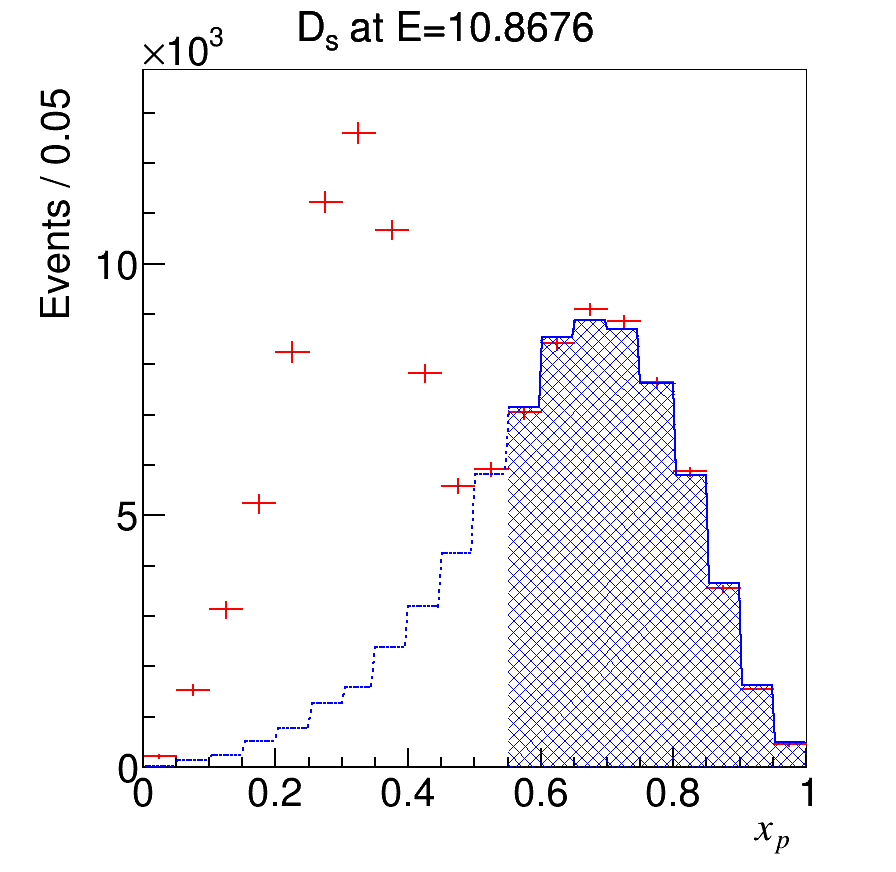
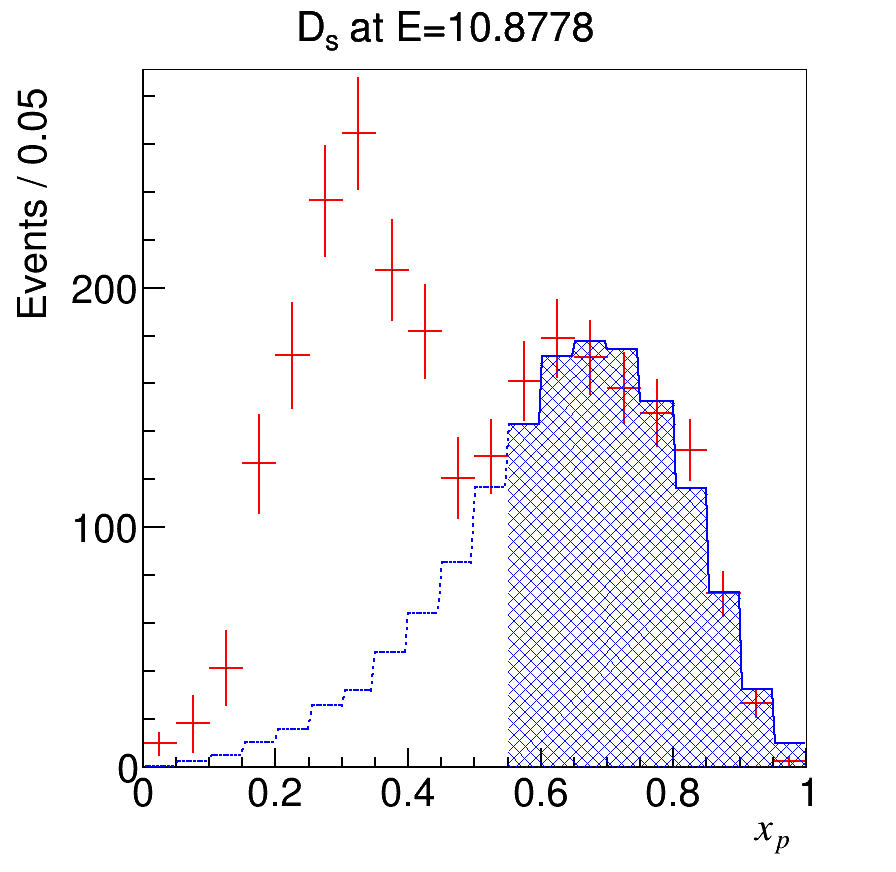
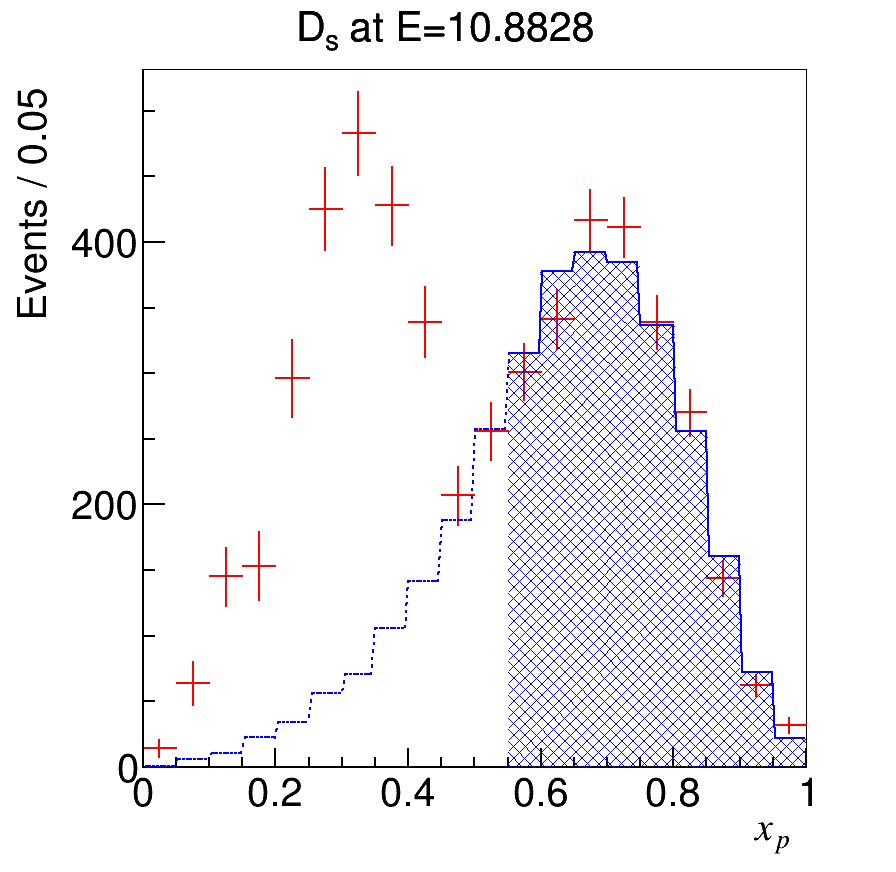
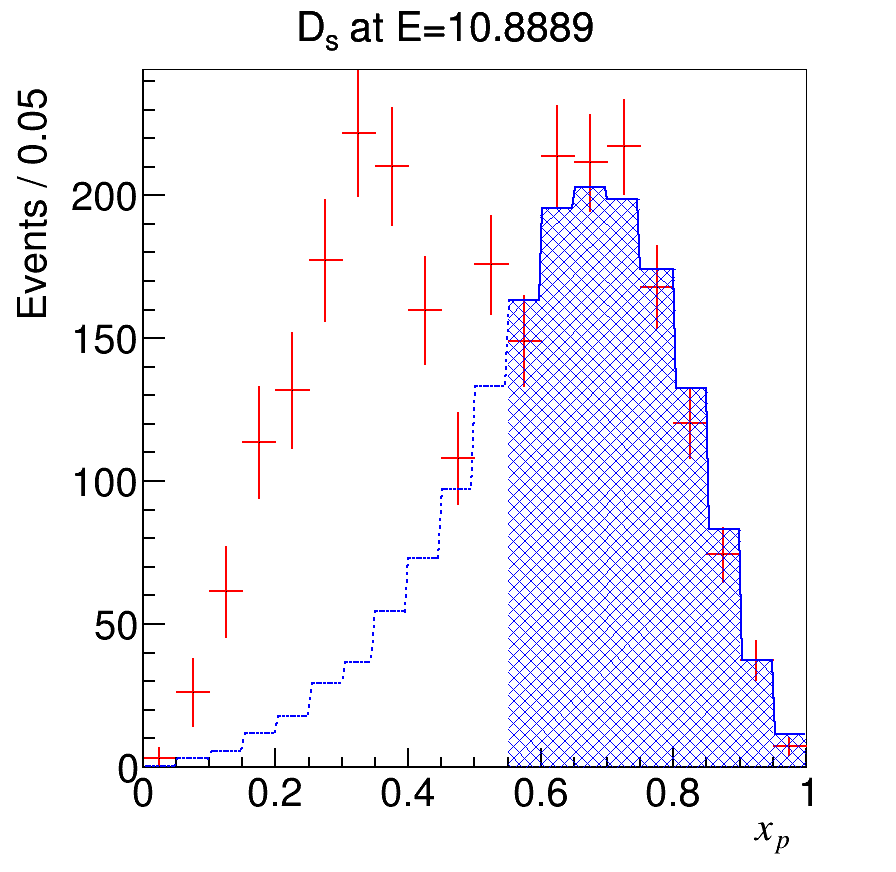
6 Energy scan data
The analysis strategy described previously in Sec. 5 for the and data is now applied at each energy point. We fit the mass distributions of the and candidates in each bin. As in the and analysis, the signal function is a sum of the four Gaussians with parameters obtained from fitting the MC sample. The shift and the broadening factor, introduced to describe the signal in the data, are common for all the Gaussians. They are fixed to the values obtained from fitting the data sample for all energy points, except the three with the largest luminosity. At these three points, near the resonance, the shift and broadening factor are allowed to vary freely. The background is fitted by a second-order polynomial.
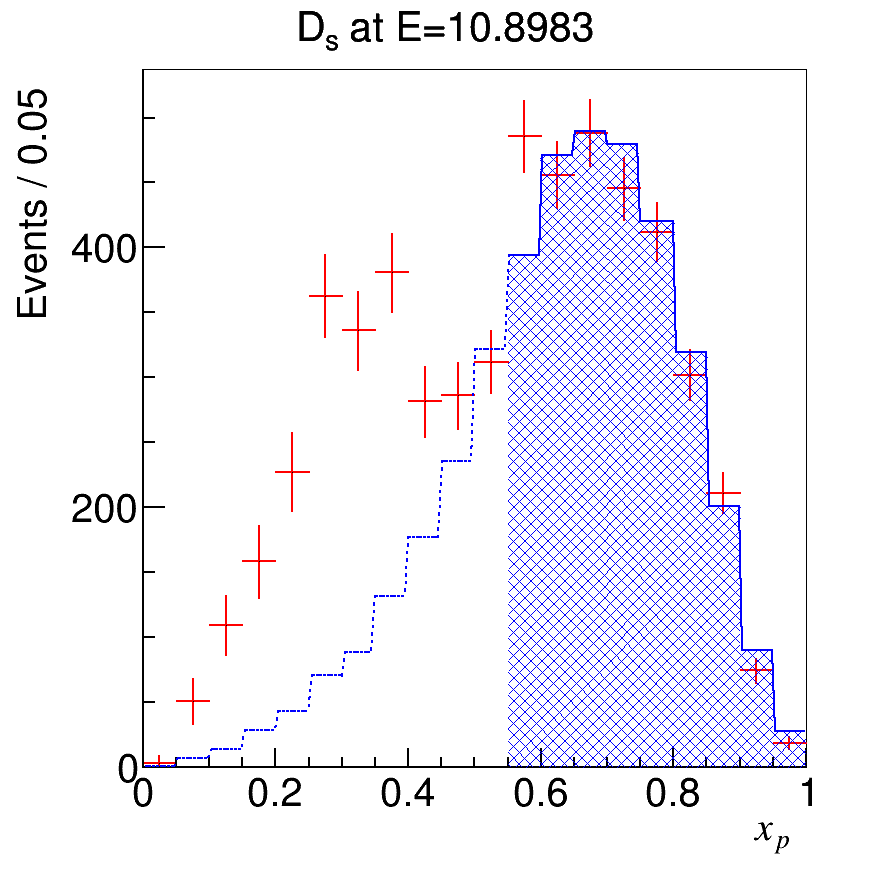
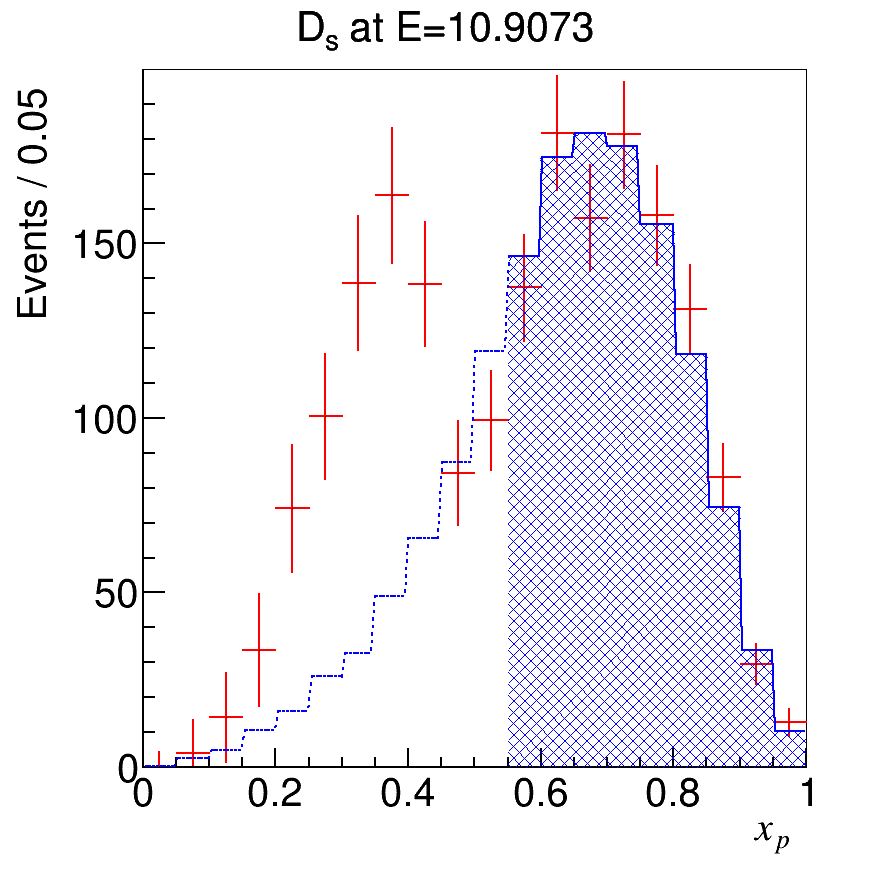
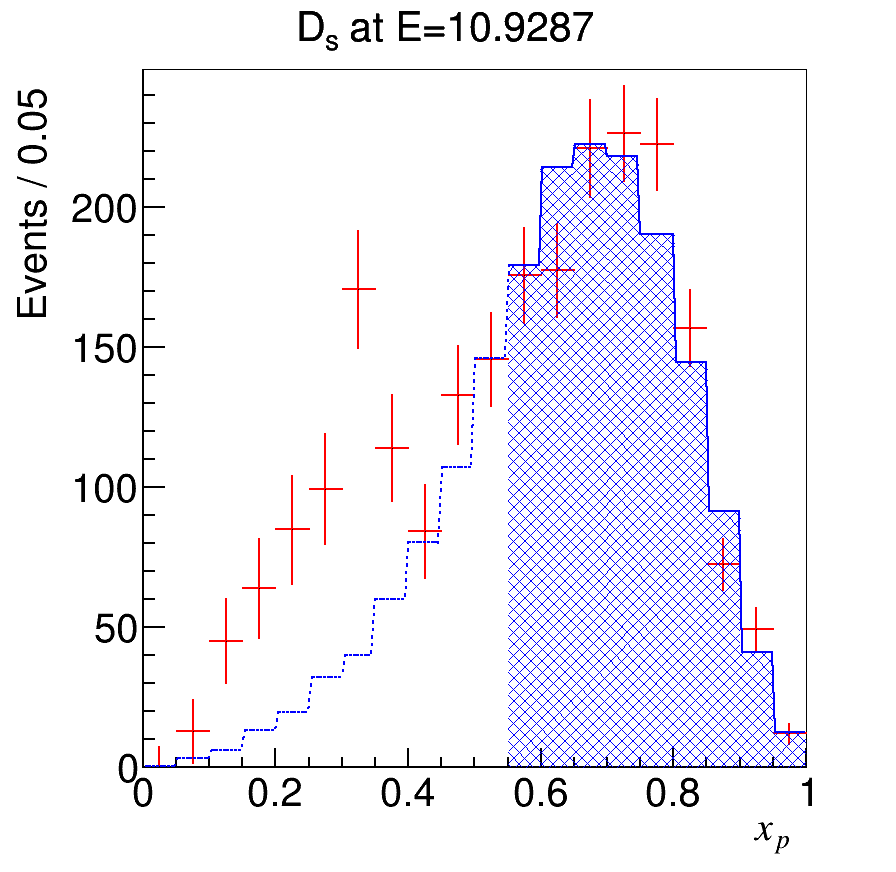
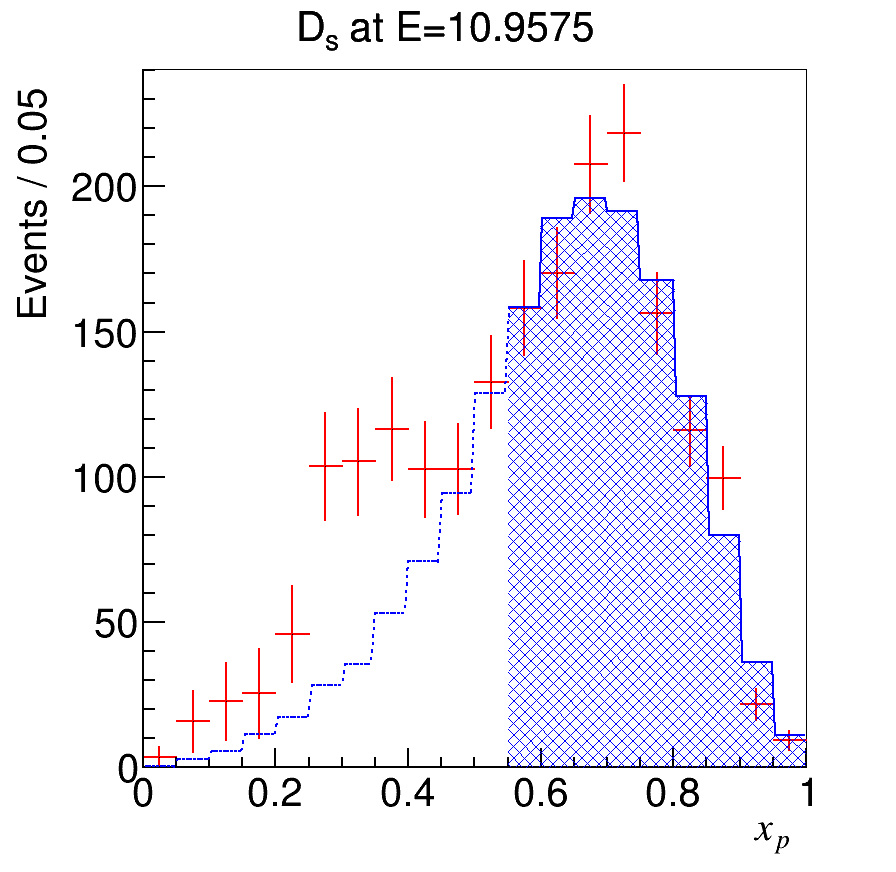
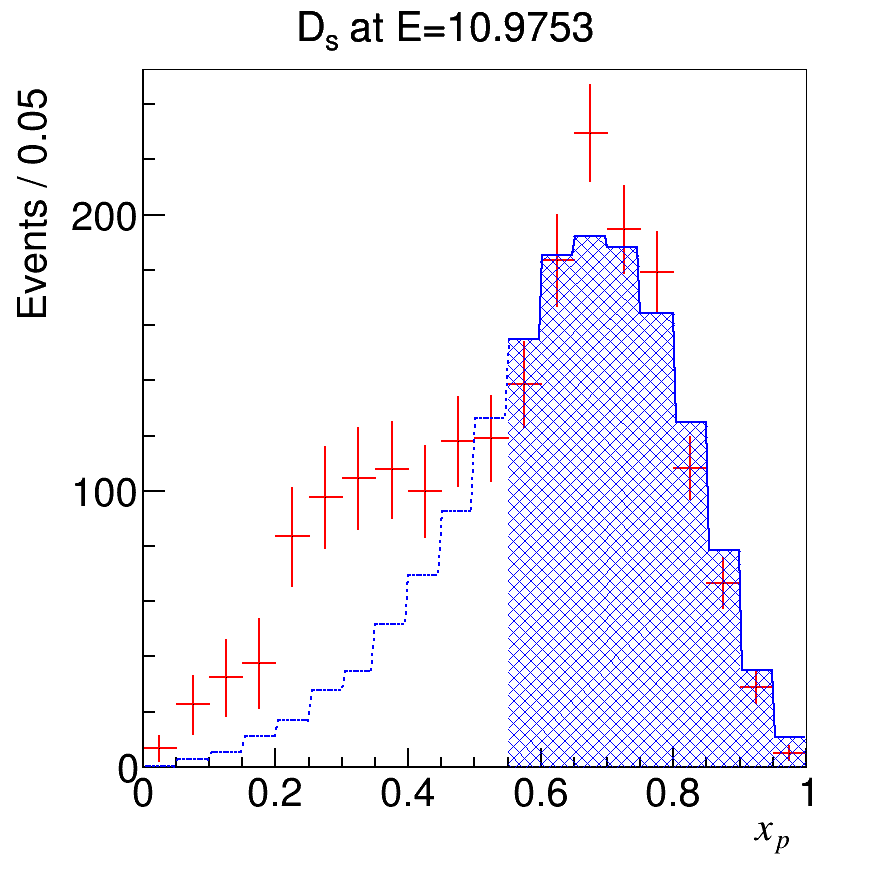
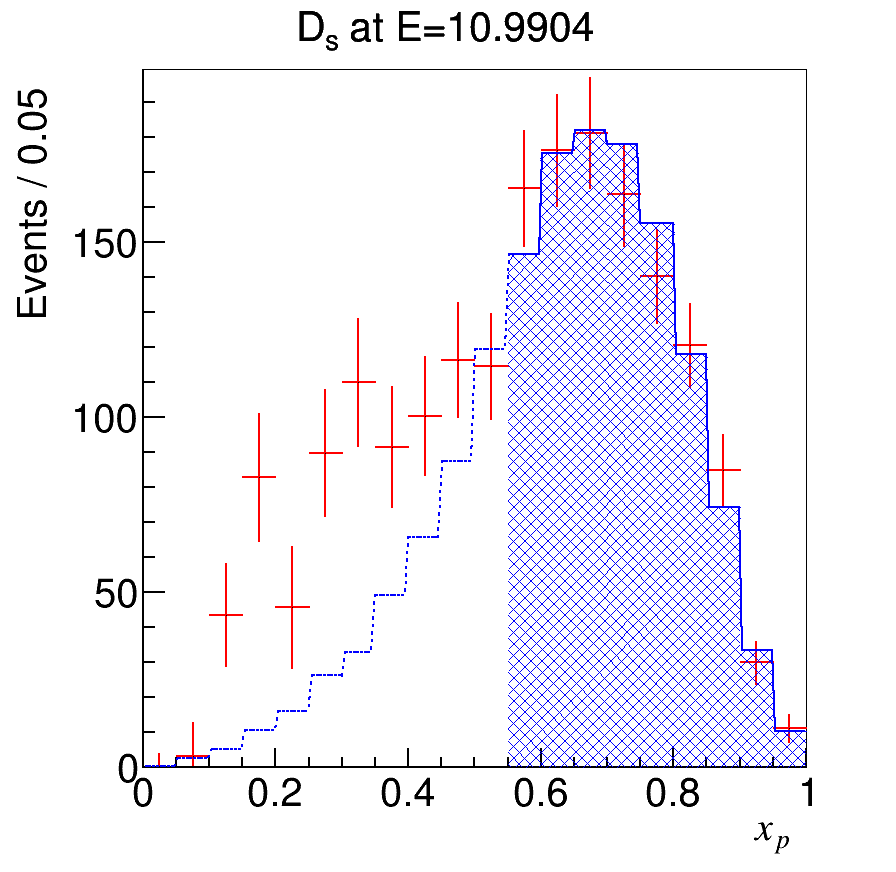
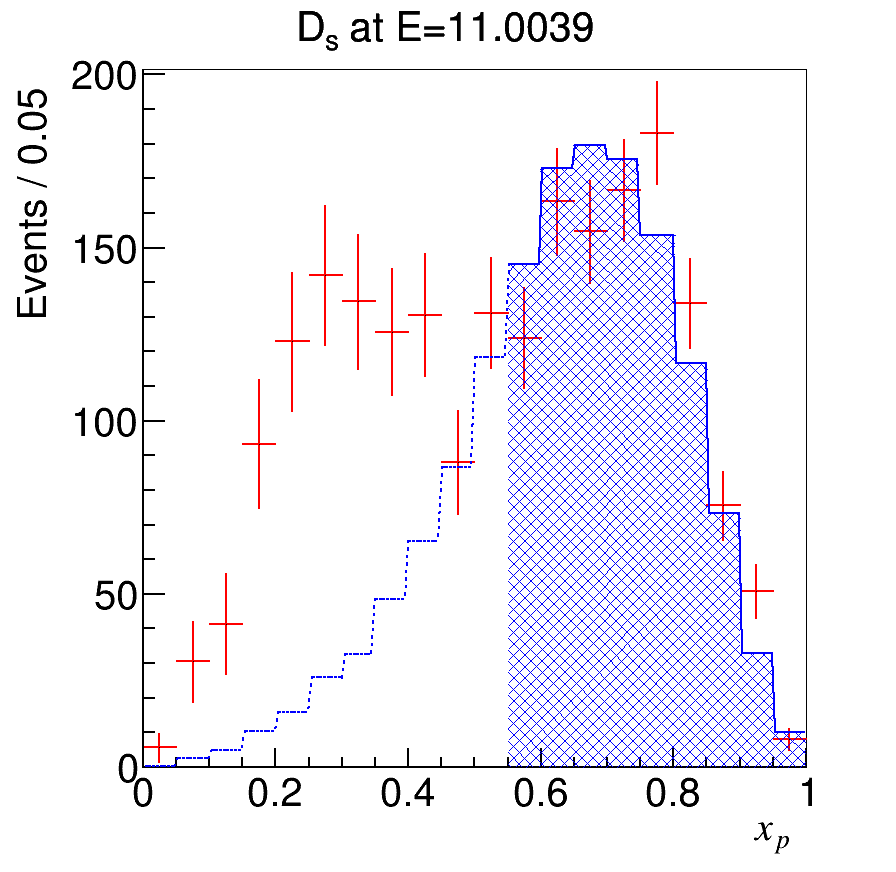
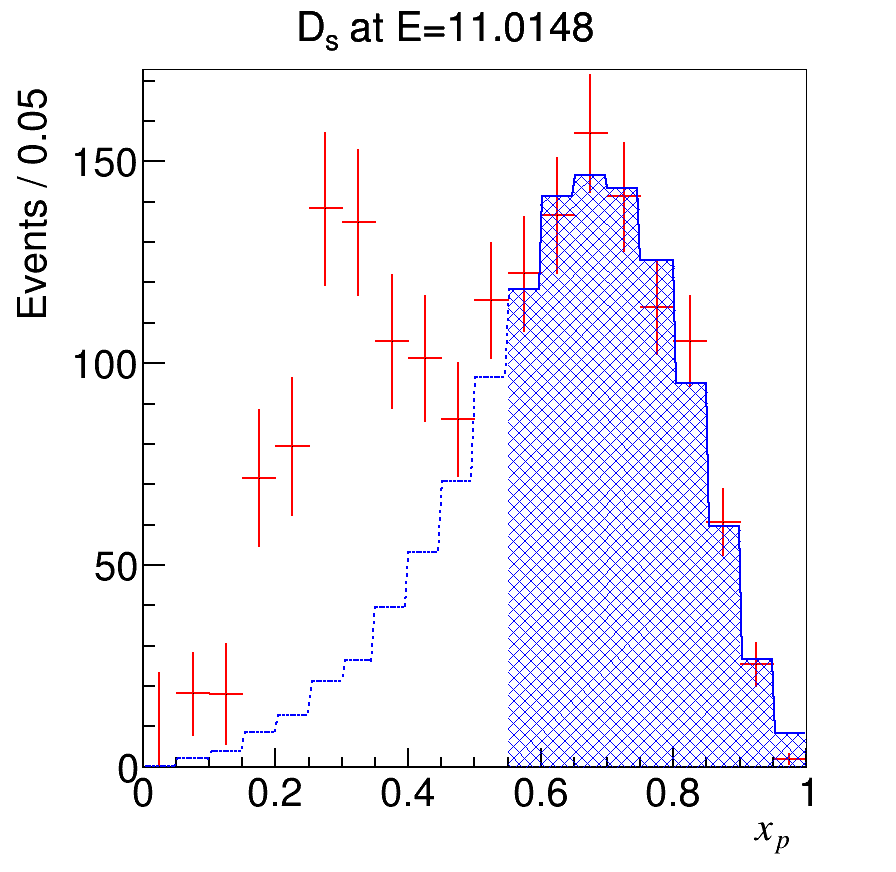
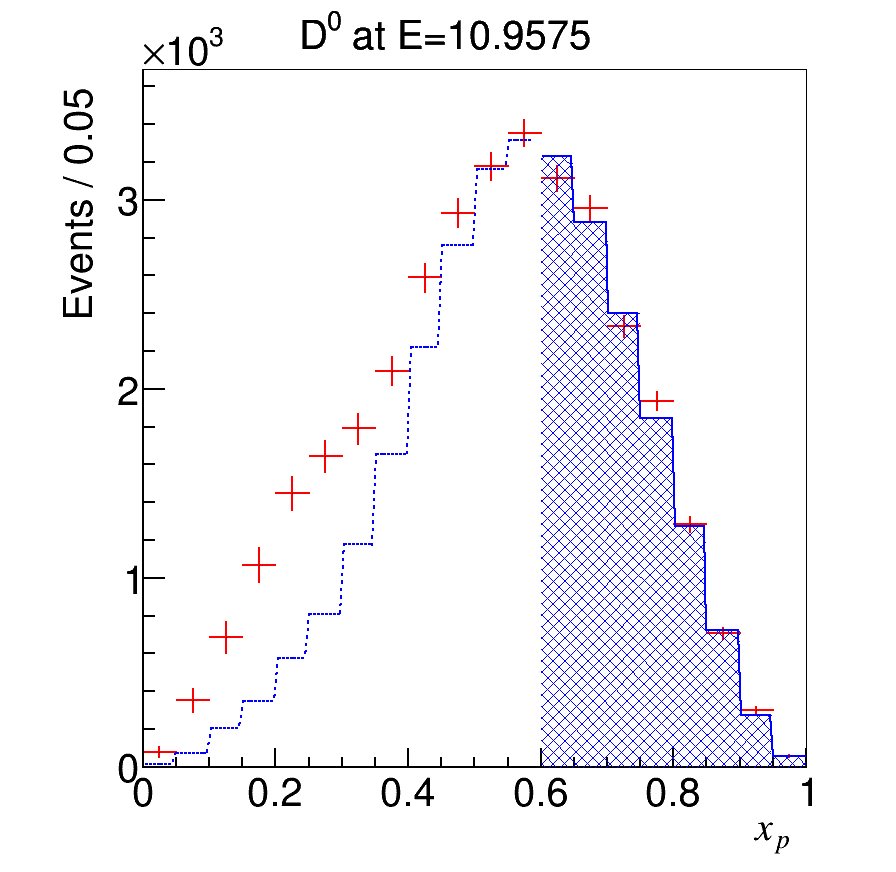
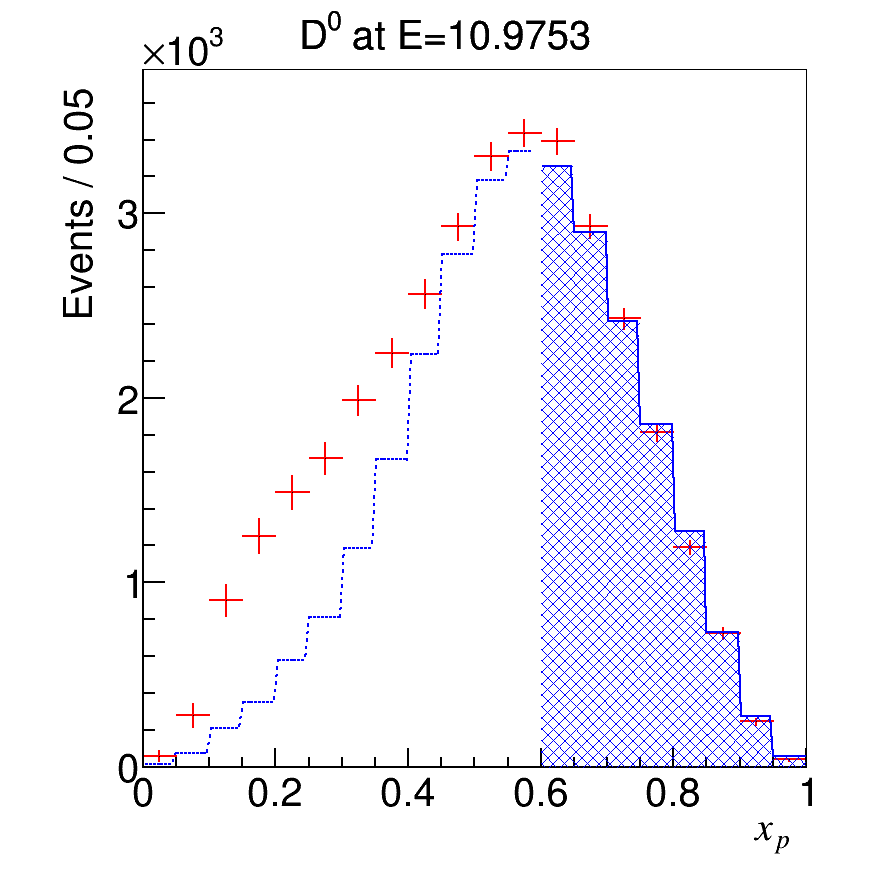
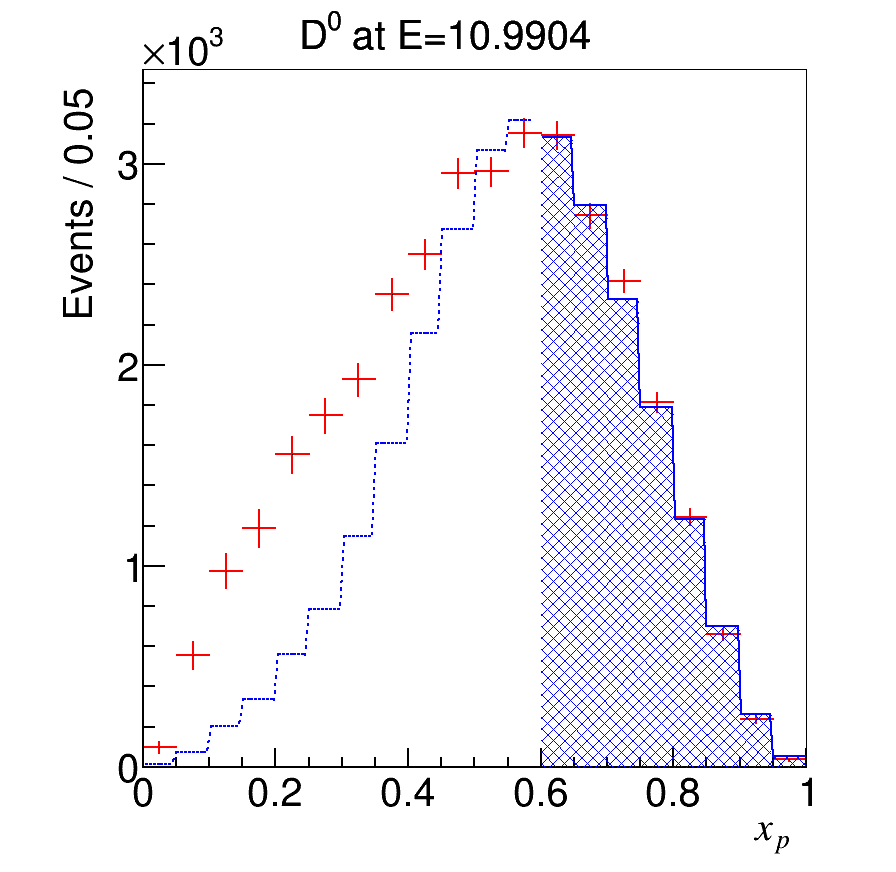
We use the spectra for the data collected below the threshold, shown in Fig. 4 (bottom), to subtract the continuum contribution at each energy point. First, the continuum spectrum for the and mesons is corrected for the energy difference between = 10.52 GeV and the energy of the relevant point. As before, these corrections are obtained using the Belle II event generator. Then, the shape of the corrected continuum spectrum is used in the fit to the high-momentum region of the distribution to obtain the normalization factor for the continuum contribution at the current energy. The results of these fits are provided in Appendix B.
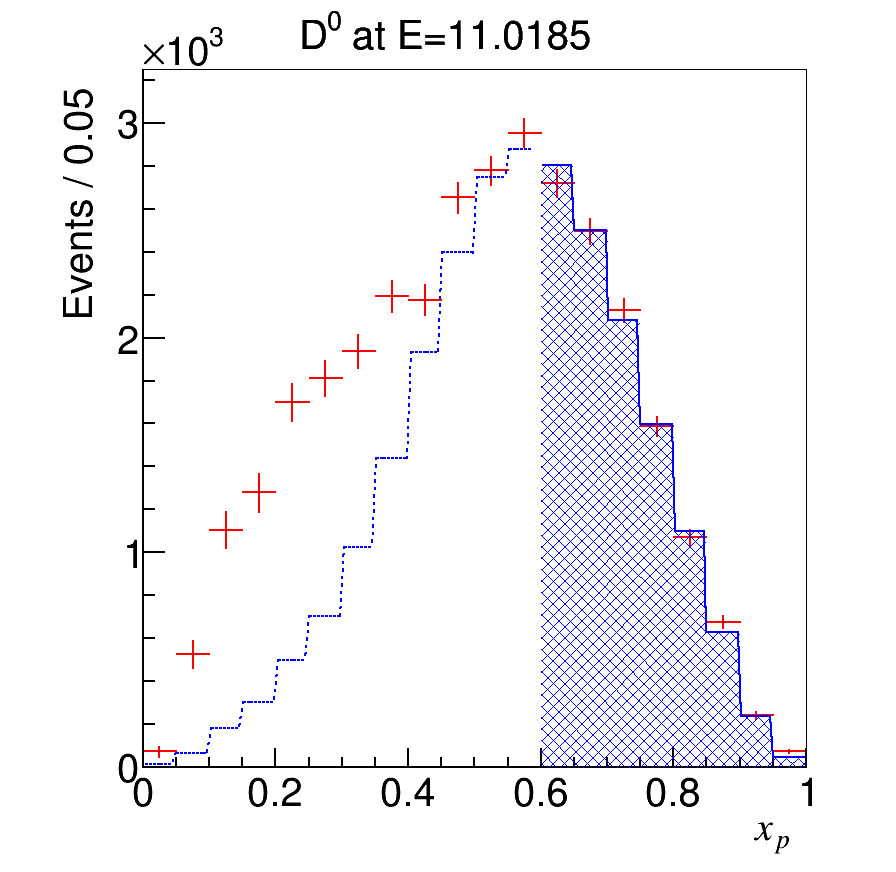
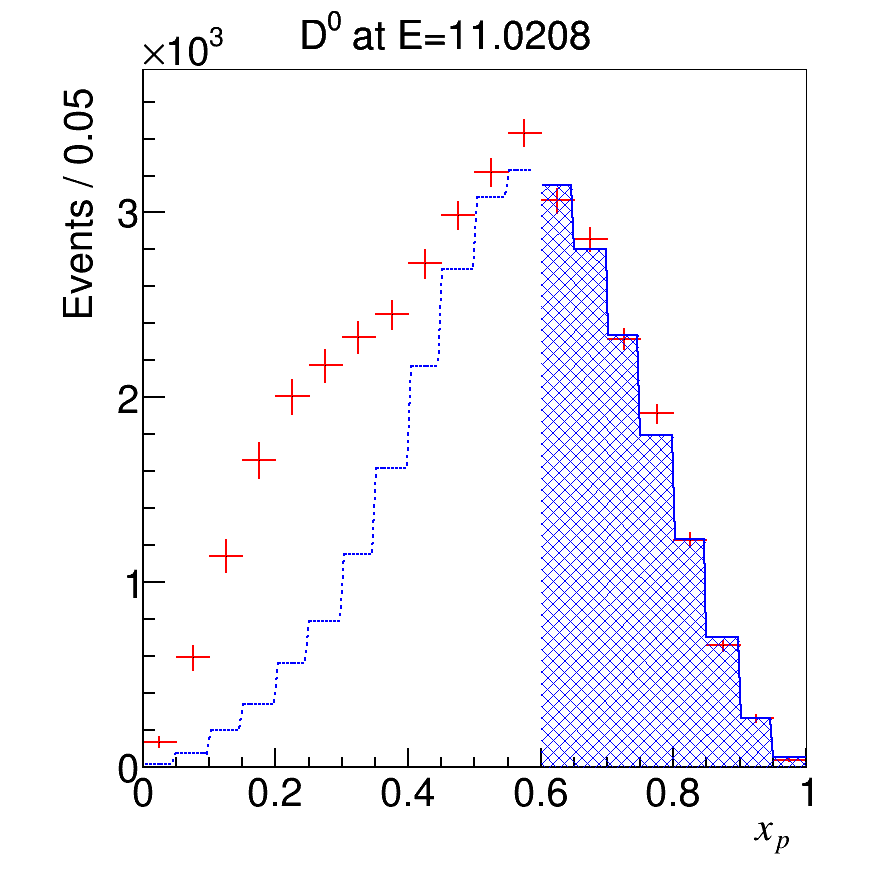
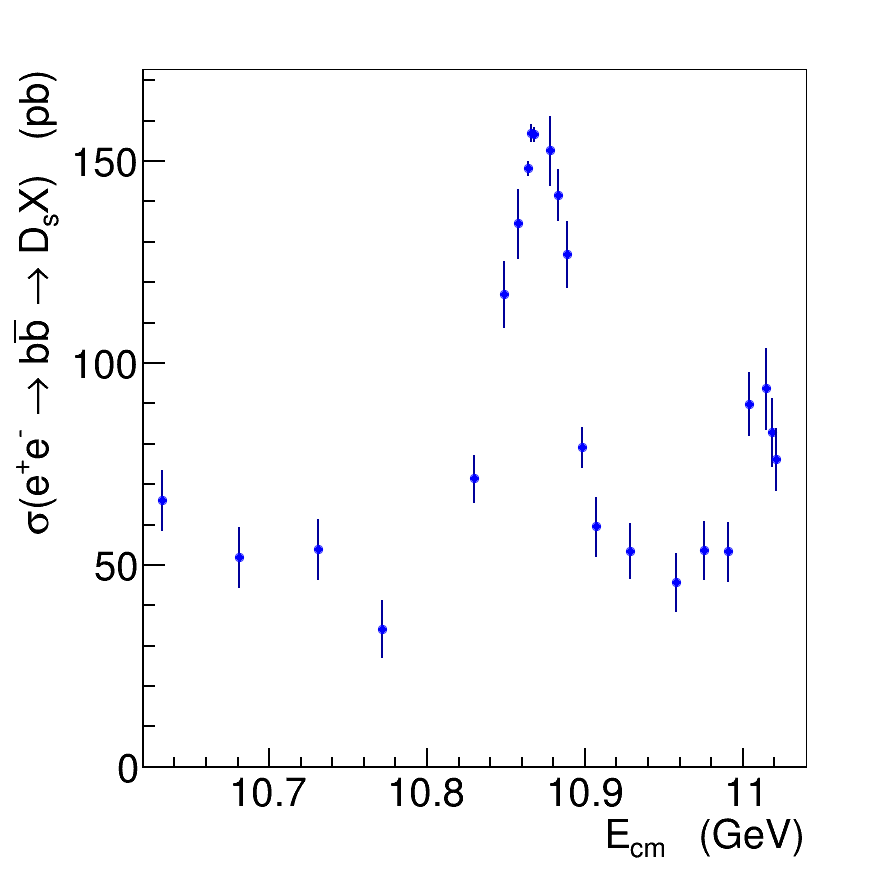
The inclusive and cross sections are calculated according to formulas (10) and (11) with and , respectively (Table 1). The obtained values of the cross sections are listed in Table 6 and shown in Fig. 9. The errors in this figure are statistical only; they are calculated according to Eq. (12).
 |
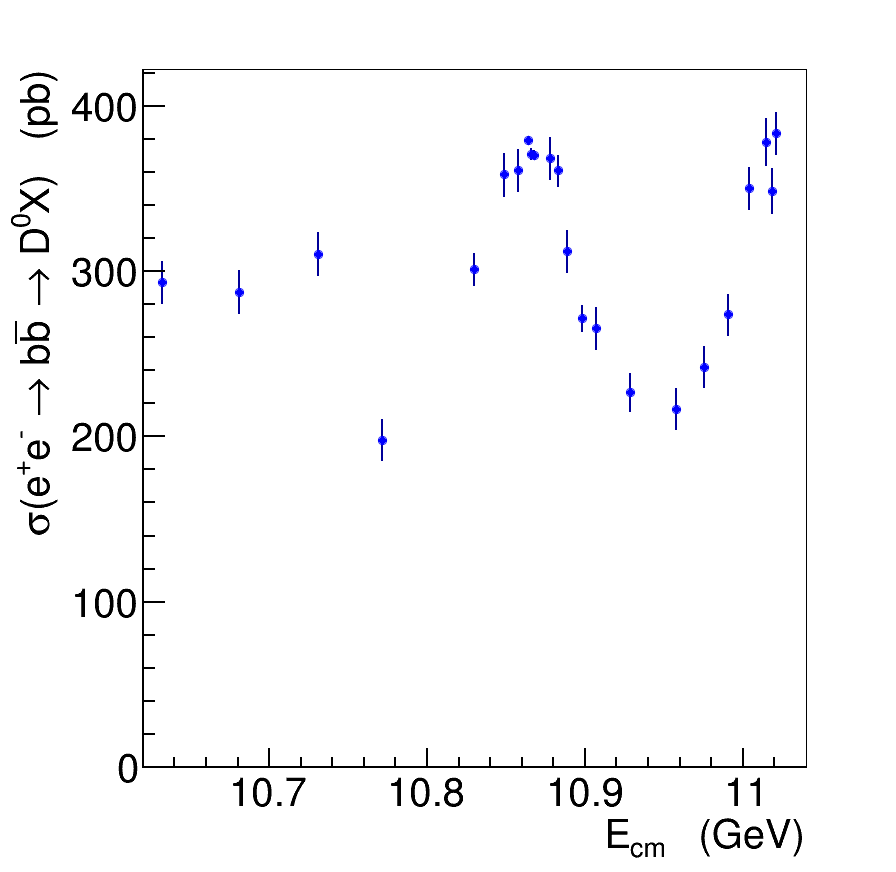 |
We consider the same sources of systematic uncertainty as listed in Table 3. We assume that the systematic uncertainties are fully correlated at the various energy points and find three types of the energy dependence of the systematic uncertainties:
-
•
The contribution of the statistical uncertainty of the continuum spectrum is additive and is almost energy-independent (Fig. 10, blue points).

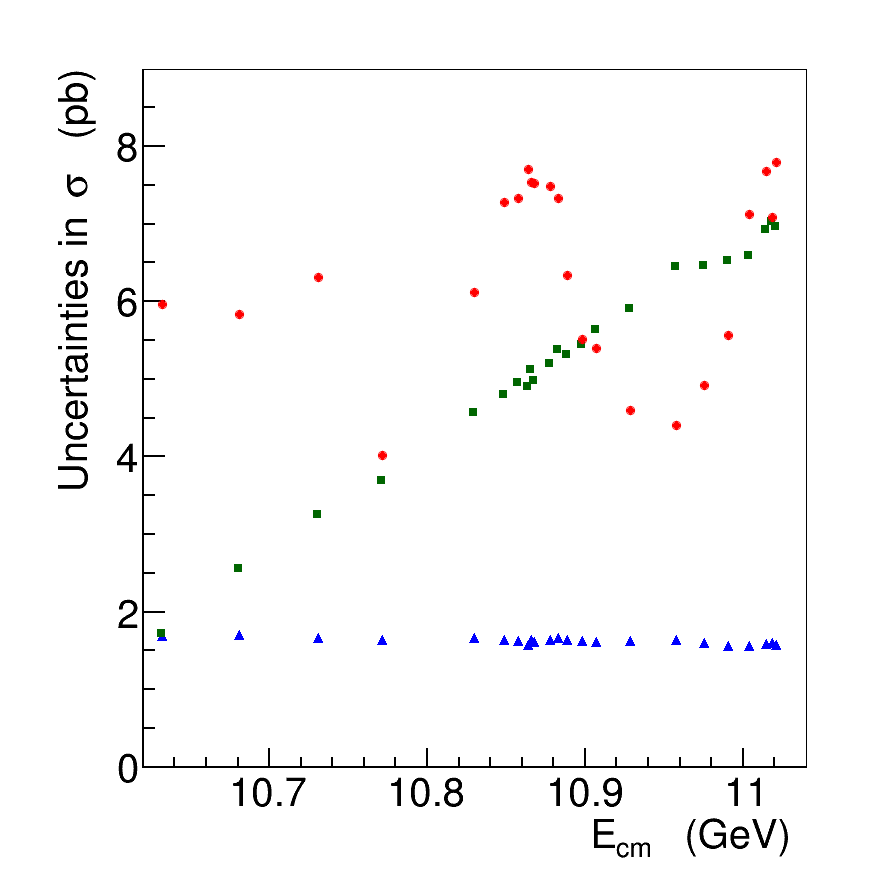
Figure 10: The energy dependence of the absolute systematic uncertainties in the (left) and (right) cross sections. Shown are contributions from the statistical uncertainty of the continuum spectrum (blue triangles), the continuum spectrum correction (green squares), and the sum of the other sources (red circles). The vertical scale is chosen to coincide with the maximal statistical uncertainty in the corresponding cross section. -
•
The contribution of the spectrum correction is additive and shows a linear rise with energy (Fig. 10, green points).
-
•
Other sources are multiplicative; their relative uncertainties are energy-independent. Their shapes repeat those of the cross sections themselves (Fig. 10, red points).
In Table 6 the contributions of these three types of systematic uncertainties are summed in quadrature.
10.6322 0.989 10.6810 0.949 10.7313 0.946 10.7712 0.955 10.8295 1.697 10.8489 0.989 10.8574 0.988 10.8642 47.648 10.8658 29.107 10.8676 45.284 10.8778 0.978 10.8828 1.848 10.8889 0.990 10.8983 2.408 10.9073 0.980 10.9287 1.149 10.9575 0.969 10.9753 0.999 10.9904 0.985 11.0039 0.976 11.0148 0.771 11.0185 0.859 11.0208 0.982
Substituting the obtained values of , , and (Eqs. (17), (18) and (29)) in Eqs. (LABEL:eq:solv_general12), we find
The results for and are presented in Table 6 and in Fig. 11.
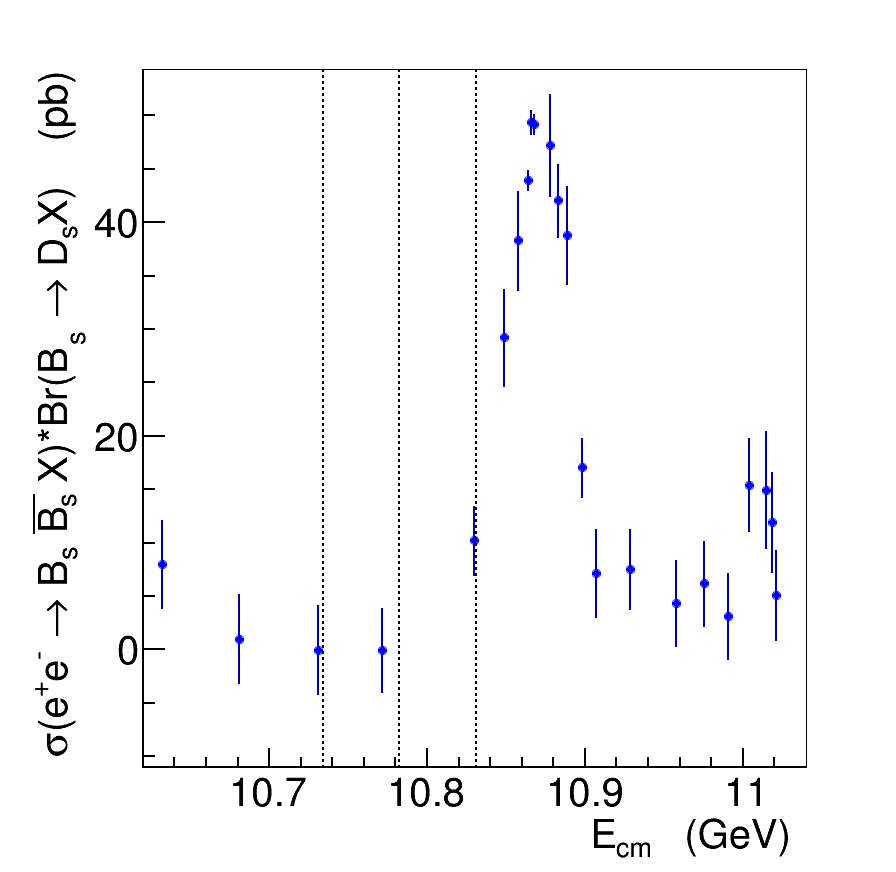 |
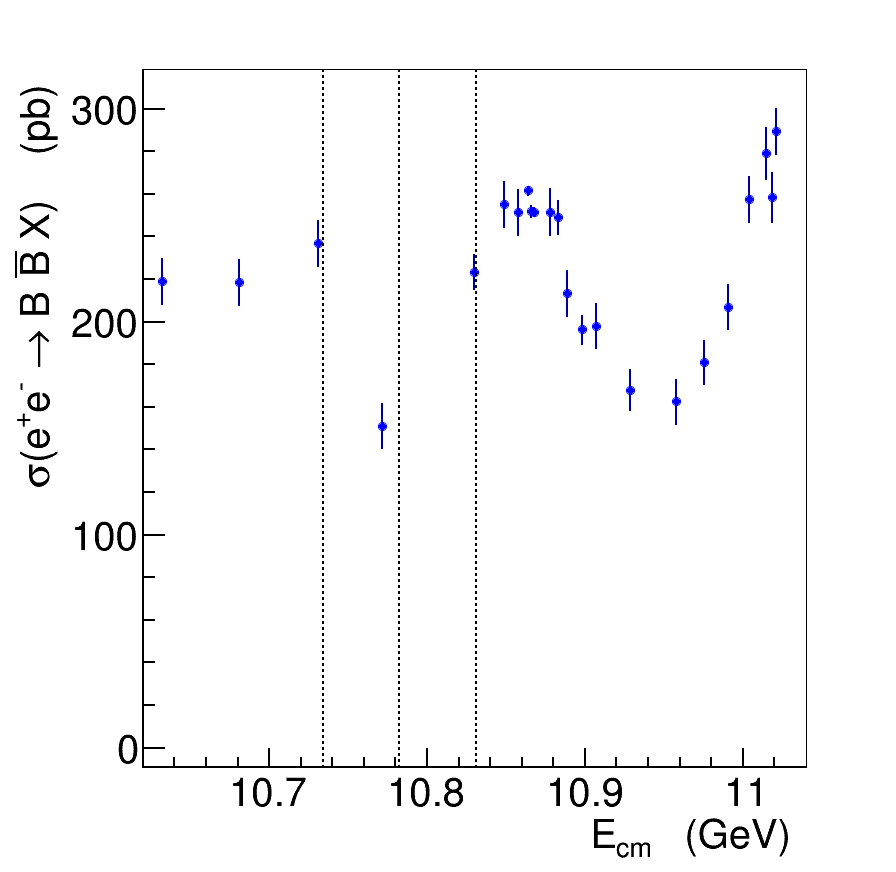 |
The cross section shows a clear peak near the energy and a hint of a peak near the , while the non-resonant contribution is small.
7 Conclusions
We have measured the inclusive cross sections , , and the product in the energy range from to . Results are presented in Table 6. The energy dependence of the cross section shows a clear peak near the energy and a hint of a peak near the . The obtained results can be used in a combined analysis of the data in various final states within coupled-channel approaches to investigate the nature and properties of the bottomonium and bottomonium-like states lying above the threshold.
We have measured the following inclusive branching fractions and production fractions:
| (31) | ||||
| (32) | ||||
| (33) | ||||
| (34) |
There might be several mesons in decays and events; the measurements correspond to the average multiplicities. The results shown in Eqs. (33) and (34) supersede previous Belle measurements reported in Ref. Belle:2006jvm .
The fraction of the events containing the mesons at the is found to be
| (35) |
This value supersedes the previous Belle results reported in Refs. Belle:2012tsw and Belle:2021qxu .
We also determined the ratio of the branching fractions
| (36) |
The inclusive method allows to measure energy dependence of the cross section with relatively high precision even if relatively low integrated luminosity is available. It can be used by the Belle II experiment for exploratory studies of various energy regions of interest, for example, near the production thresholds or to search for -wave and states via enhancements at the thresholds Bondar:2016hva . Additional advantage of the method is that the inclusive cross section is also determined.
Acknowledgements.
This work, based on data collected using the Belle detector, which was operated until June 2010, was supported by the Ministry of Education, Culture, Sports, Science, and Technology (MEXT) of Japan, the Japan Society for the Promotion of Science (JSPS), and the Tau-Lepton Physics Research Center of Nagoya University; the Australian Research Council including grants DP210101900, DP210102831, LE230100085; Science and Research (FWF) and FWF Austrian Science Fund No. P 31361-N36; the National Natural Science Foundation of China under Contracts No. 11675166, No. 11975076; No. 12175041; Research Program of Frontier Sciences, Chinese Academy of Sciences (CAS), Grant No. QYZDJ-SSW-SLH011; ZR2022JQ02 supported by Shandong Provincial Natural Science Foundation; the Ministry of Education, Youth and Sports of the Czech Republic under Contract No. LTT17020; the Czech Science Foundation Grant No. 22-18469S; Horizon 2020 ERC Advanced Grant No. 884719 and ERC Starting Grant No. 947006 “InterLeptons” (European Union); the Carl Zeiss Foundation, the Deutsche Forschungsgemeinschaft, the Excellence Cluster Universe, and the VolkswagenStiftung; the Department of Atomic Energy (Project Identification No. RTI 4002) and the Department of Science and Technology of India; the Istituto Nazionale di Fisica Nucleare of Italy; National Research Foundation (NRF) of Korea Grant Nos. 2016R1D1A1B02012900, 2018R1A2B3003643, 2018R1A6A1A06024970, RS202200197659, 2019R1I1A3A01058933, 2021R1A6A1A03043957, 2021R1F1A1060423, 2021R1F1A1064008, 2022R1A2C1003993; Radiation Science Research Institute, Foreign Large-size Research Facility Application Supporting project, the Global Science Experimental Data Hub Center of the Korea Institute of Science and Technology Information and KREONET/GLORIAD; the Polish Ministry of Science and Higher Education and the National Science Center; the Ministry of Science and Higher Education of the Russian Federation, Agreement 14.W03.31.0026, Basic Research Program, Moscow; research grants S-1440-0321, S-0256-1438, and S-0280-1439 (Saudi Arabia); the Slovenian Research Agency Grant Nos. J1-9124 and P1-0135; Ikerbasque, Basque Foundation for Science, Spain; the Swiss National Science Foundation; the Ministry of Education and the Ministry of Science and Technology of Taiwan; and the United States Department of Energy and the National Science Foundation. These acknowledgements are not to be interpreted as an endorsement of any statement made by any of our institutes, funding agencies, governments, or their representatives. We thank the KEKB group for the excellent operation of the accelerator; the KEK cryogenics group for the efficient operation of the solenoid; and the KEK computer group and the Pacific Northwest National Laboratory (PNNL) Environmental Molecular Sciences Laboratory (EMSL) computing group for strong computing support; and the National Institute of Informatics, and Science Information NETwork 6 (SINET6) for valuable network support.References
- (1) Belle collaboration, Observation of two charged bottomonium-like resonances in decays, Phys. Rev. Lett. 108 (2012) 122001 [1110.2251].
- (2) C. Meng and K.-T. Chao, Scalar resonance contributions to the dipion transition rates of in the re-scattering model, Phys. Rev. D 77 (2008) 074003 [0712.3595].
- (3) Y.A. Simonov and A.I. Veselov, Strong decays and dipion transitions of , Phys. Lett. B 671 (2009) 55 [0805.4499].
- (4) R. Kaiser, A.V. Manohar and T. Mehen, Isospin violation in , Phys. Rev. Lett. 90 (2003) 142001 [hep-ph/0208194].
- (5) M.B. Voloshin, Heavy quark spin symmetry breaking in near-threshold quarkonium-like resonances, Phys. Rev. D 85 (2012) 034024 [1201.1222].
- (6) A.E. Bondar, R.V. Mizuk and M.B. Voloshin, Bottomonium-like states: Physics case for energy scan above the threshold at Belle-II, Mod. Phys. Lett. A 32 (2017) 1750025 [1610.01102].
- (7) Belle collaboration, Measurements of the (10860) and (11020) resonances via , Phys. Rev. D 93 (2016) 011101 [1501.01137].
- (8) BaBar collaboration, Measurement of the cross section between = 10.54-GeV and 11.20-GeV, Phys. Rev. Lett. 102 (2009) 012001 [0809.4120].
- (9) Belle collaboration, Measurement of the energy dependence of the , , and exclusive cross sections, JHEP 06 (2021) 137 [2104.08371].
- (10) A. Abdesselam et al., Study of Two-Body Production in the Energy Range from 10.77 to 11.02 GeV, 1609.08749.
- (11) Belle collaboration, Energy scan of the cross sections and evidence for decays into charged bottomonium-like states, Phys. Rev. Lett. 117 (2016) 142001 [1508.06562].
- (12) N. Hüsken, R.E. Mitchell and E.S. Swanson, K-matrix analysis of e+e- annihilation in the bottomonium region, Phys. Rev. D 106 (2022) 094013 [2204.11915].
- (13) Belle collaboration, The Belle Detector, Nucl. Instrum. Meth. A 479 (2002) 117.
- (14) Belle collaboration, Physics Achievements from the Belle Experiment, PTEP 2012 (2012) 04D001 [1212.5342].
- (15) S. Kurokawa and E. Kikutani, Overview of the KEKB accelerators, Nucl. Instrum. Meth. A 499 (2003) 1.
- (16) T. Abe et al., Achievements of KEKB, PTEP 2013 (2013) 03A001.
- (17) Belle collaboration, Observation of a new structure near 10.75 GeV in the energy dependence of the (n = 1, 2, 3) cross sections, JHEP 10 (2019) 220 [1905.05521].
- (18) D.J. Lange, The EvtGen particle decay simulation package, Nucl. Instrum. Meth. A 462 (2001) 152.
- (19) R. Brun, F. Bruyant, M. Maire, A.C. McPherson and P. Zanarini, GEANT3: user’s guide Geant 3.10, Geant 3.11, CERN-DD-EE-84-1.
- (20) CLEO collaboration, First Evidence and Measurement of Production at the , Phys. Rev. Lett. 95 (2005) 261801 [hep-ex/0508047].
- (21) Belle collaboration, Measurement of inclusive , and rates and determination of the production fraction in events at the resonance, Phys. Rev. Lett. 98 (2007) 052001 [hep-ex/0608015].
- (22) E. Nakano, Belle PID, Nucl. Instrum. Meth. A 494 (2002) 402.
- (23) P. Urquijo and T. Ferber, Overview of the Belle II Physics Generators, BELLE2-NOTE-PH-2015-006.
- (24) Particle Data Group collaboration, Review of Particle Physics, PTEP 2022 (2022) 083C01.
- (25) BaBar, Belle collaboration, The Physics of the B Factories, Eur. Phys. J. C 74 (2014) 3026 [1406.6311].
- (26) BaBar collaboration, Study of inclusive and decays to flavor-tagged , and , Phys. Rev. D 75 (2007) 072002 [hep-ex/0606026].
- (27) Belle collaboration, Precise measurement of the branching fractions for and first measurement of the polarization using collisions, Phys. Rev. D 87 (2013) 031101 [1208.0323].
- (28) Belle collaboration, Measurement of with semileptonic tagging, Phys. Rev. D 105 (2022) 012004 [2106.11265].
- (29) Heavy Flavor Averaging Group, HFLAV collaboration, Averages of -hadron, -hadron, and -lepton properties as of 2021, Phys. Rev. D 107 (2023) 052008 [2206.07501].
- (30) Belle collaboration, Measurement of the production ratio in collisions at the resonance using decays at Belle, Phys. Rev. D 107 (2023) L031102 [2207.01194].
Appendix A spectra of and at the and resonances
To determine for various intervals, we use Eqs. (10), (11), and (12) without summing over index . The results are presented in Table 7. We consider the same sources of the systematic uncertainty as shown in Table 3.
interval at the at the at the at the (0.00,0.05) (0.05,0.10) (0.10,0.15) (0.15,0.20) (0.20,0.25) (0.25,0.30) (0.30,0.35) (0.35,0.40) (0.40,0.45) (0.45,0.50) (0.50,0.55) (0.55,0.60)
Appendix B Fits to the distributions at the scan energies